Review

Late Quaternary Relative Sea-Level Changes and Vertical GNSS Motions in the Gulf of Corinth: The Asymmetric Localization of Deformation Inside an Active Half-Graben

1
Faculty of Geology and Geo-Environment, National and Kapodistrian University of Athens, 157 84 Athens, Greece
2
Institute of Geodynamics, National Observatory of Athens, 118 10 Athens, Greece
*
Author to whom correspondence should be addressed.
Geosciences 2023, 13(11), 329; https://doi.org/10.3390/geosciences13110329
Submission received: 20 September 2023 / Revised: 19 October 2023 / Accepted: 21 October 2023 / Published: 28 October 2023
(This article belongs to the Section Natural Hazards)

Abstract

:
Remains of past sea levels such as tidal notches may provide valuable information for the investigation of relative sea-level changes (RSL) of eustatic/tectonic origin. In this review, we focus on case studies of coastal changes from the Corinth Gulf, where impacts of past earthquakes can be traced through various indicators. The southern coast has undergone a tectonic uplift during the Holocene, whereas the northern coast has undergone subsidence. The magnitude of RSL fall in the south Corinth Gulf is larger than RSL rise in the north. Exploiting previous measurements and datings, we created a geodatabase regarding the relative sea-level changes of the whole gulf, including geodetic data based on permanent GNSS observations. The combination of geomorphological (long-term) and geodetic (short-term) data is a key advance for this area, which is characterized by fast rates of N-S crustal extension and strong earthquakes. The joint dataset fits the tectonic model of an active half-graben where the hanging wall (northern coast) subsides and the footwall (southern coast) is uplifted. The highest uplift rates (3.5 mm/year) are near Aigion, which indicates an asymmetric localization of deformation inside this active rift.

1. Introduction

Studying the geomorphological structure and evolution of an area can aid in the reconstruction of its tectonic history [1]. In tectonically active areas, the geomorphological structure is often controlled by vertical or horizontal tectonic movements [2,3].
The Gulf of Corinth is a major marine basin of Greece, which separates the Peloponnese from central Greece (Figure 1). It is a significant WNW–ESE rift structure [4] and one of the most tectonically active regions of Greece [5,6,7,8,9]. It is a young rift whose length is approximately 120 km. Its width roughly reaches 40 km. The highest width (25–30 km) of the gulf is found in its central–eastern part, where the syn-rift sedimentary sequence also reaches its maximum thickness (up to 3 km) [10]. Its maximum depth reaches 860 m in the eastern part [11]. In the eastern part, it forms two lesser gulfs with a depth of less than 200 m, Lechaion (Figure 1) and Alkyonides Gulfs.
The gulf is undergoing a N-S extension with rates reaching 13 mm/a, rendering it one of the fastest expanding regions on Earth [7,12,13,14,15,16,17,18,19,20,21,22] (Figure 1). This extension is not uniform. In the easternmost part, it undergoes an extension of approximately 6–8 mm/a [17,18,19]. The extensional regime of the gulf is expressed with several generations of segmented normal faults [15,23,24,25,26,27,28,29,30,31], which are mainly oriented E-W [32] and dipping toward north. According to several authors [33,34,35,36,37,38,39,40], the fault activity has migrated northwards. The ongoing extension was initiated during the Upper Miocene. It is due to the combination of lithospheric-scale back-arc extensional processes and gravitational collapse of the Hellenides [41,42]. The eastern part of the gulf has a thinner crust than the western part, which is around 28–30 km [43].
Figure 1. Shaded relief map showing the location of the Gulf of Corinth within Greece (see inset box) along with the main sites discussed in the text. Yellow stars show the epicenters of the 1981 (Alkyonides; [13]) and 1995 (Aigion; [44]) earthquakes. The inset map shows Greece and the red rectangle shows the location of the Corinth Gulf.
Geosciences 13 00329 g001
The southern part of the gulf, i.e., the northern part of the Peloponnese, is subject to uplift [5,45,46,47]. Its uplift rate is not uniform; the sub-basin of Patras (NW Peloponnese) undergoes a 0.8 to 1 mm/a uplift, whereas in Corinth, the uplift rates decrease by 0.4 mm/y. Rio is characterized by the highest uplift rate, which has even been calculated at 4.4 mm/y [48].
The rift’s development followed two stages. The initially shallow marine basin was filled with freshwater and was controlled by tectonics [4,33]. Consequently, the basin was characterized by the presence of Gilbert-type deltas and coarse sediments mainly along the southern shore [33,49,50,51].
The Gulf of Corinth is located in the back-arc domain of the convergence zone between the African and Eurasian plates. Therefore, strong (M6+) earthquakes are common inside the gulf. In fact, it is considered the most seismically active area of Europe [5]. Among the most recent strong earthquake events was the 1981 Alkyonides sequence (24 February 1981 M6.7 and 25 February 1981 M6.4; [13]; Figure 1) and the M6.5 event of 15 June 1995 offshore Aigion (Figure 1; [26,32,44,52,53,54]). To highlight the intense seismic activity, we include a seismicity map with 43 earthquakes of magnitude M ≥ 4.0, including three events with M ≥ 5.0 (see Appendix A, Figure A1; source: National Observatory of Athens catalogue, period 2008–2023; last accessed 16 October 2023).
In terms of tectonic style, the Gulf of Corinth has been identified as a half-graben whose southern coasts have undergone uplift and whose northern ones have been subjected to subsidence, as it was characterized by the presence of landforms that reveal this trend [15,55,56]. In this review paper, we focus on tectonically driven sea-level changes in the Corinth Gulf. We mainly focus on case studies of earthquake-driven coastal changes, where impacts of past earthquakes can be traced mainly through tidal notches but also through biological indicators. For this purpose, an extensive bibliographic review was accomplished, and a geodatabase was developed with the main sea-level indicators of the Corinth Gulf for the Holocene. The tectonic movements that have affected the gulf during the Holocene were concluded not only through geomorphological, archaeological and biological indexes, but geodetic data as well, which were based on permanent Global Navigation Satellite System (GNSS) observations collected from permanent stations around the gulf. Data that arose from both types of surveys were calibrated based on modern data (see Section 2).

2. Materials and Methods

For the purposes of this study, we reviewed and compiled a geodatabase of sea-level indicators reported in the Corinth Gulf for the late Holocene. The geodatabase is composed of sea-level data from the available literature as well as past published research by the authors, mainly focusing on tidal notches and biological indicators. The developed database is presented in a free ArcGIS Online webmap application powered by ESRI (https://www.esri.com (last accessed on 15 September 2023). The webmap application is accessible here: https://evelpidou.maps.arcgis.com/apps/instant/sidebar/index.html?appid=fa9556300b8c433492e7f7e2784eb4f0 (published in 20 September 2023, accessed on 15 September 2023) (e.g., [57,58]).
The database includes spatial information such as locality name, region, and status in relation to m.s.l. A variety of descriptive information is also included, such as the feature and feature type, the relative sea level (RSL), geometrical characteristics depending on the feature, height, genesis (if applicable), age in relation to the dating method, the calibrated age, the age range and errors and the rate of uplift (for features indicating uplift). Finally, the database contains the authors’ comments, if applicable, as well as the corresponding reference and DOI.
The provided application has an interface friendly to the user, while at the same time, it incorporates various interactive tools supporting the user for easy and simple indexing of the preferable geodata. At the left bar of the application, the user can find tools such as the activation of the map’s legend, and they can change the basemap (with 10 different options, such as satellite images, plain geographical maps etc.), the map of details and the information when clicking on a map’s feature. Further provided tools are the home button in order to reset the map, the compass, the metadata of the online map and a manual for keyboard shortcuts. The map can be zoomed in and out as much as the user desires, while it provides a roller tool for any special measurements. Finally, the user has the ability to share this online map with other users using three different social media, copy the applications URL or even print as a PDF.

Geodetic Data

Dual-frequency geodetic data can be utilized to obtain position time series for tectonic studies. The geodetic data comprise a 3D set of secular velocities provided by permanent GNSS observations from twenty (20) stations around the Gulf of Corinth (Table 1; Figure 2). The use of GNSS, and particularly the Global Positioning System (GPS), has been used to study the long-term crustal deformation occurring at regional or local scales throughout Greece by use of the analysis of position time series of daily solutions [19,59,60]. Around the Gulf of Corinth, most of the permanent GNSS stations were installed in the early 2000s, and they were continuously occupied over ten (10) years; thus, accurate secular velocities (East, North, Up components) were obtained [19,59].
In this study, we use the vertical velocity dataset of Briole et al. [19] in the global reference frame ITRF2014 [61]. This set of velocities has been corrected for transient effects on the position time series (co-seismic offsets, post-seismic relaxation, etc.). The transient velocity was estimated and was removed from the total velocity field to extract what can be considered as the secular velocity field, which reflects long-term tectonic motion. The earthquakes that have affected the Gulf of Corinth GNSS station positions were the Movri (Achaia) 2008 event [62,63], the Efpalion 2010 events [9,64] and the Zakynthos 2018 subduction event [65,66]. Our data span the period 2000–2020, so we do not consider the shallow, offshore event of 17 February 2021 (Mw = 5.3) east of Rio ([67]; Figure 1; Appendix A, Figure A1). This shallow event ruptured a north-dipping normal fault and did not affect the coastal GNSS stations in the vertical component except station XILI [67]. In terms of data uncertainties, for eleven (11) out of twenty (20) GNSS stations, the uncertainties are ≤1 mm/y, while the uncertainties exceeded the vertical velocity estimates only for four (4) stations (namely AGTH, EGIO, KALA and KRYO; see Table 1). The latter stations are located along the south coast of the gulf (see Figure 2 for a station map). For stations without a clear trend on the vertical, it is usual to observe uncertainties of the same order of magnitude as the signal despite a 6–10 yr longevity of the time series [60].
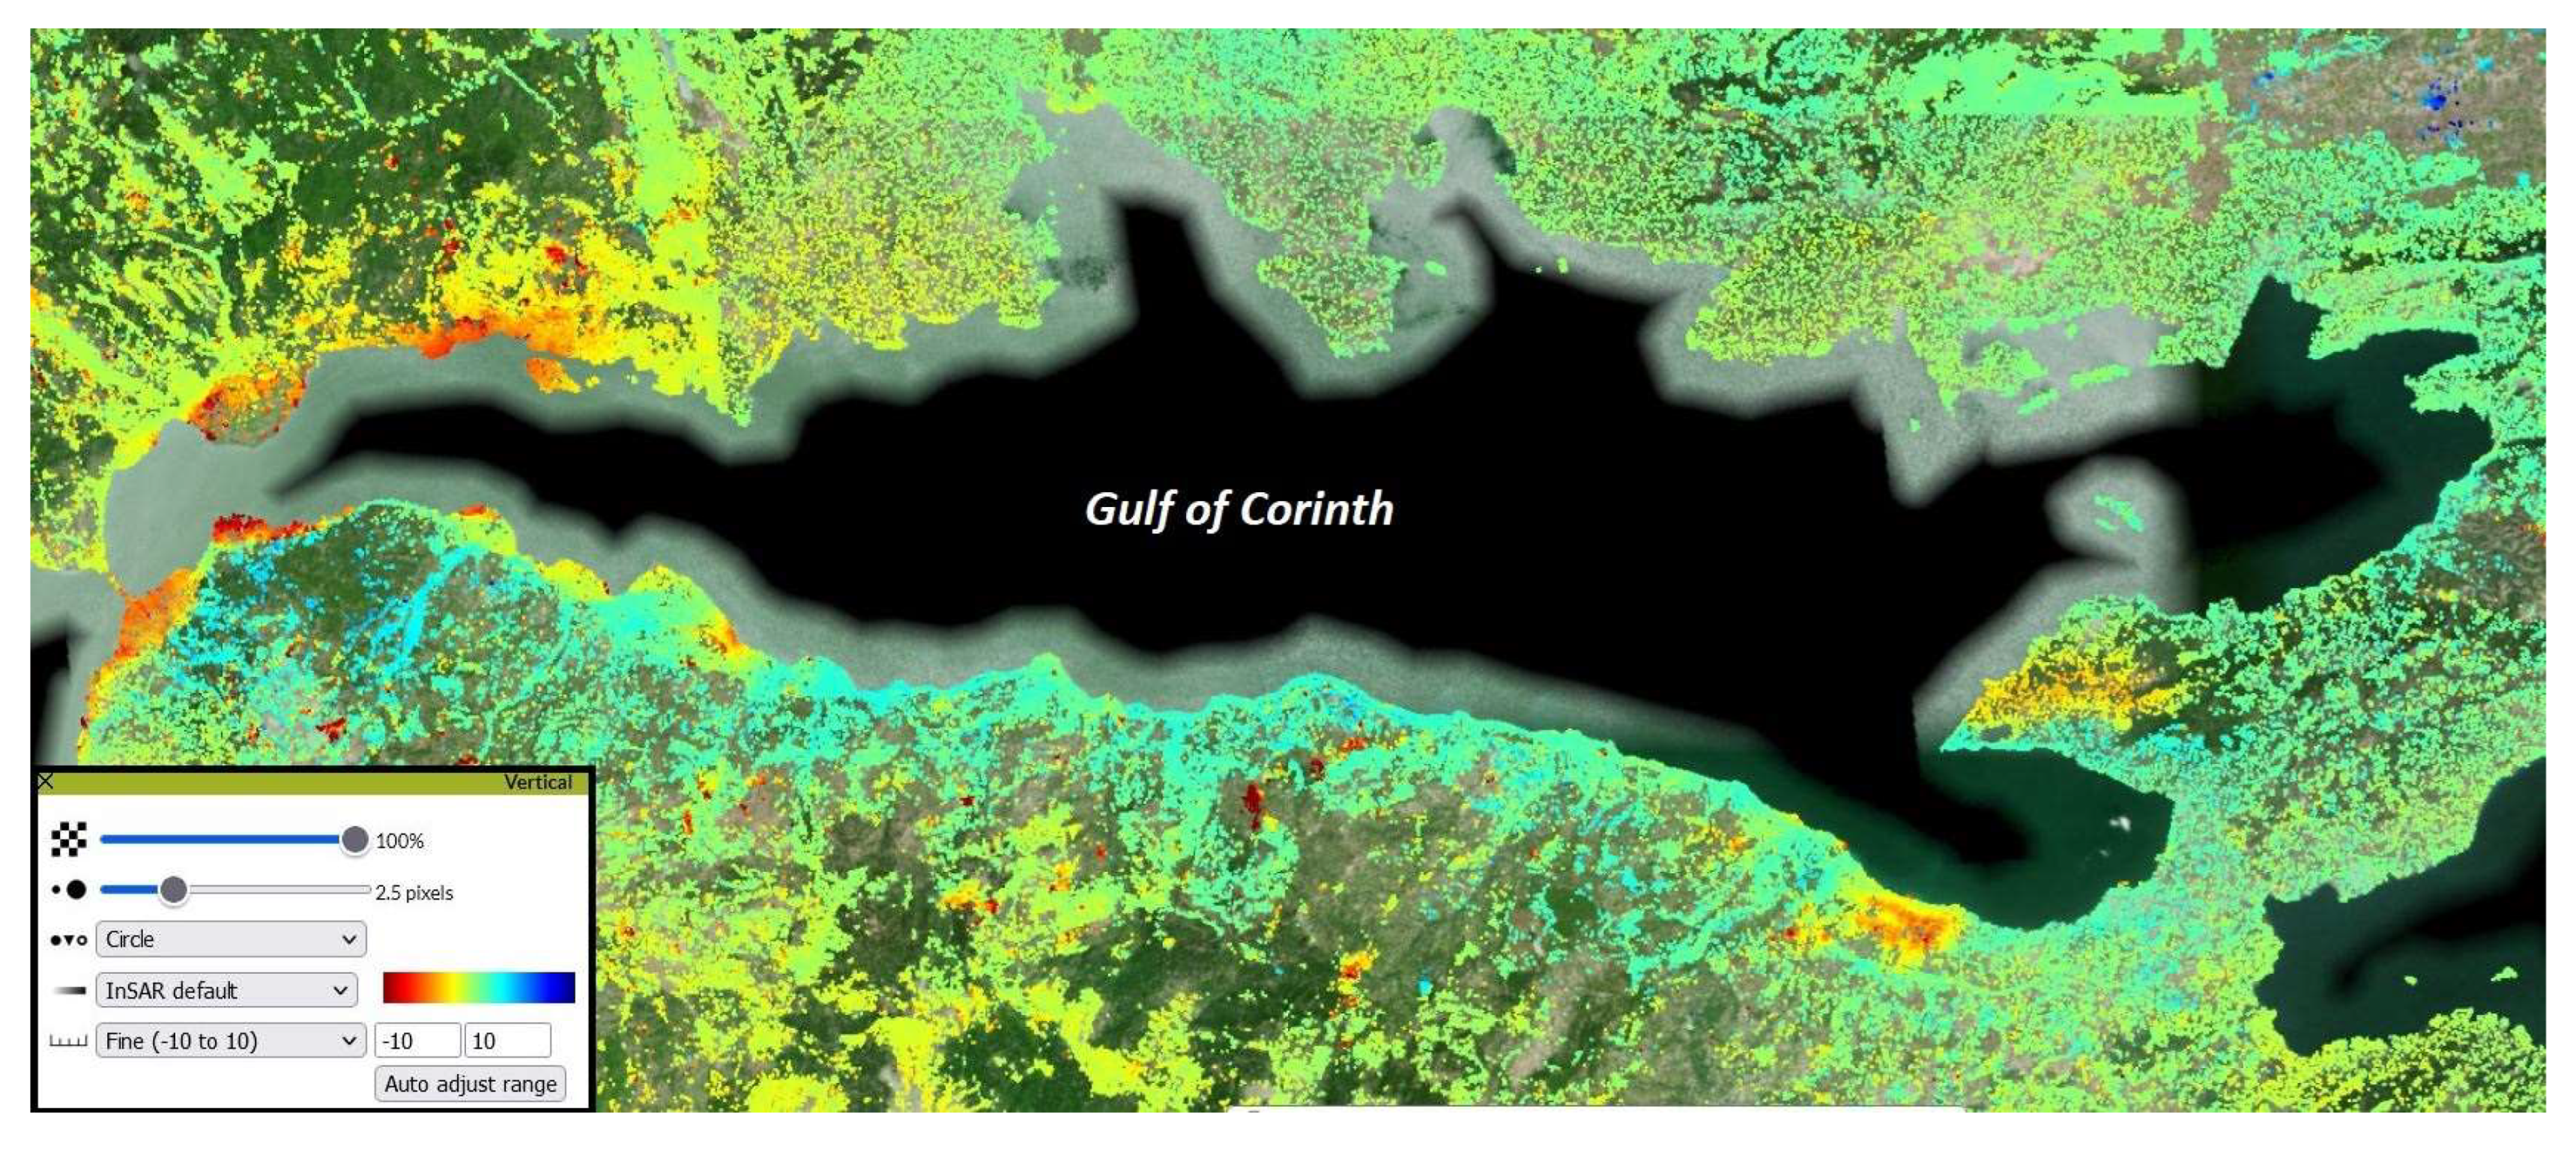
Satellite radar (SAR) images can also provide data on ground motion patterns especially related to seismic slip along large faults [44,68,69,70]. Radar time-series data achieve great results in minimizing the effects of the atmosphere and in exploring areas with vegetation such as river deltas [69]. The SAR image processing aims to produce Permanent Scatterers (PS) time series or interferogram stacks, so it is possible to obtain the mean ground velocity map and the relative displacement time series in LOS (line-of-sight), E–W and Up–Down components. In the Gulf of Corinth, the analysis by Elias and Briole ([69]; their Figure 16) covers the western part (period 2002–2010) and shows that the south coast is uplifting, while the north coast is subsiding. The mean rates of vertical motion are comparable to GNSS that is from −4 mm/y up to +4 mm/y. The European Ground Motion Service (EGMS) product ([71,72]; 100 m grid), which spans the period 2015–2021, also shows a general subsiding pattern of the north coast of the gulf (Figure 3). The greatest rates of subsidence are observed in the western part of the northern coastline near Trizonia islands (Figure 1; see also GNSS station TRIZ in Table 1). The 1995 Aigion earthquake had a clear InSAR signal of ground subsidence centered in the area of Cape Psaromyta (Figure 1; [44]).

3. Sea-Level Markers

Changes in the sea level can be either owed to eustatic processes, which affect the level of the sea globally [74,75] and are a consequence of the successive melting and accumulation of ice in glaciers, or isostatic and/or tectonic processes, which bear an impact locally. When isostasy and/or tectonics are active in an area, any changes in sea level are owed to them as well, in which case they are referred to as relative sea-level changes [76].
Vertical tectonic movements include either uplift or subsidence, resulting in a fall or rise in the sea-level correspondingly. Such relative sea-level changes can be reflected in several structures and formations known as relative sea-level markers. Such markers can be geomorphological, such as those studied in this paper, archeological, such as submerged or uplifted harbors, or biological ones, such as uplifted or submerged carbonate rocks with Lithophaga holes.
The Gulf of Corinth, as part of Greece and consequently the eastern Mediterranean region, is not only affected by eustatic sea-level changes but vertical or partly vertical tectonic movements as well. It is a very active region, meaning that tectonics has played a very significant role in the changes of the sea level over the last thousand years. Therefore, the coastal zone and other features of the gulf offer several pieces of evidence regarding active tectonic movements, such as uplifted shorelines and earthquake-driven landslides [53,55,77,78,79].

3.1. Tidal Notches

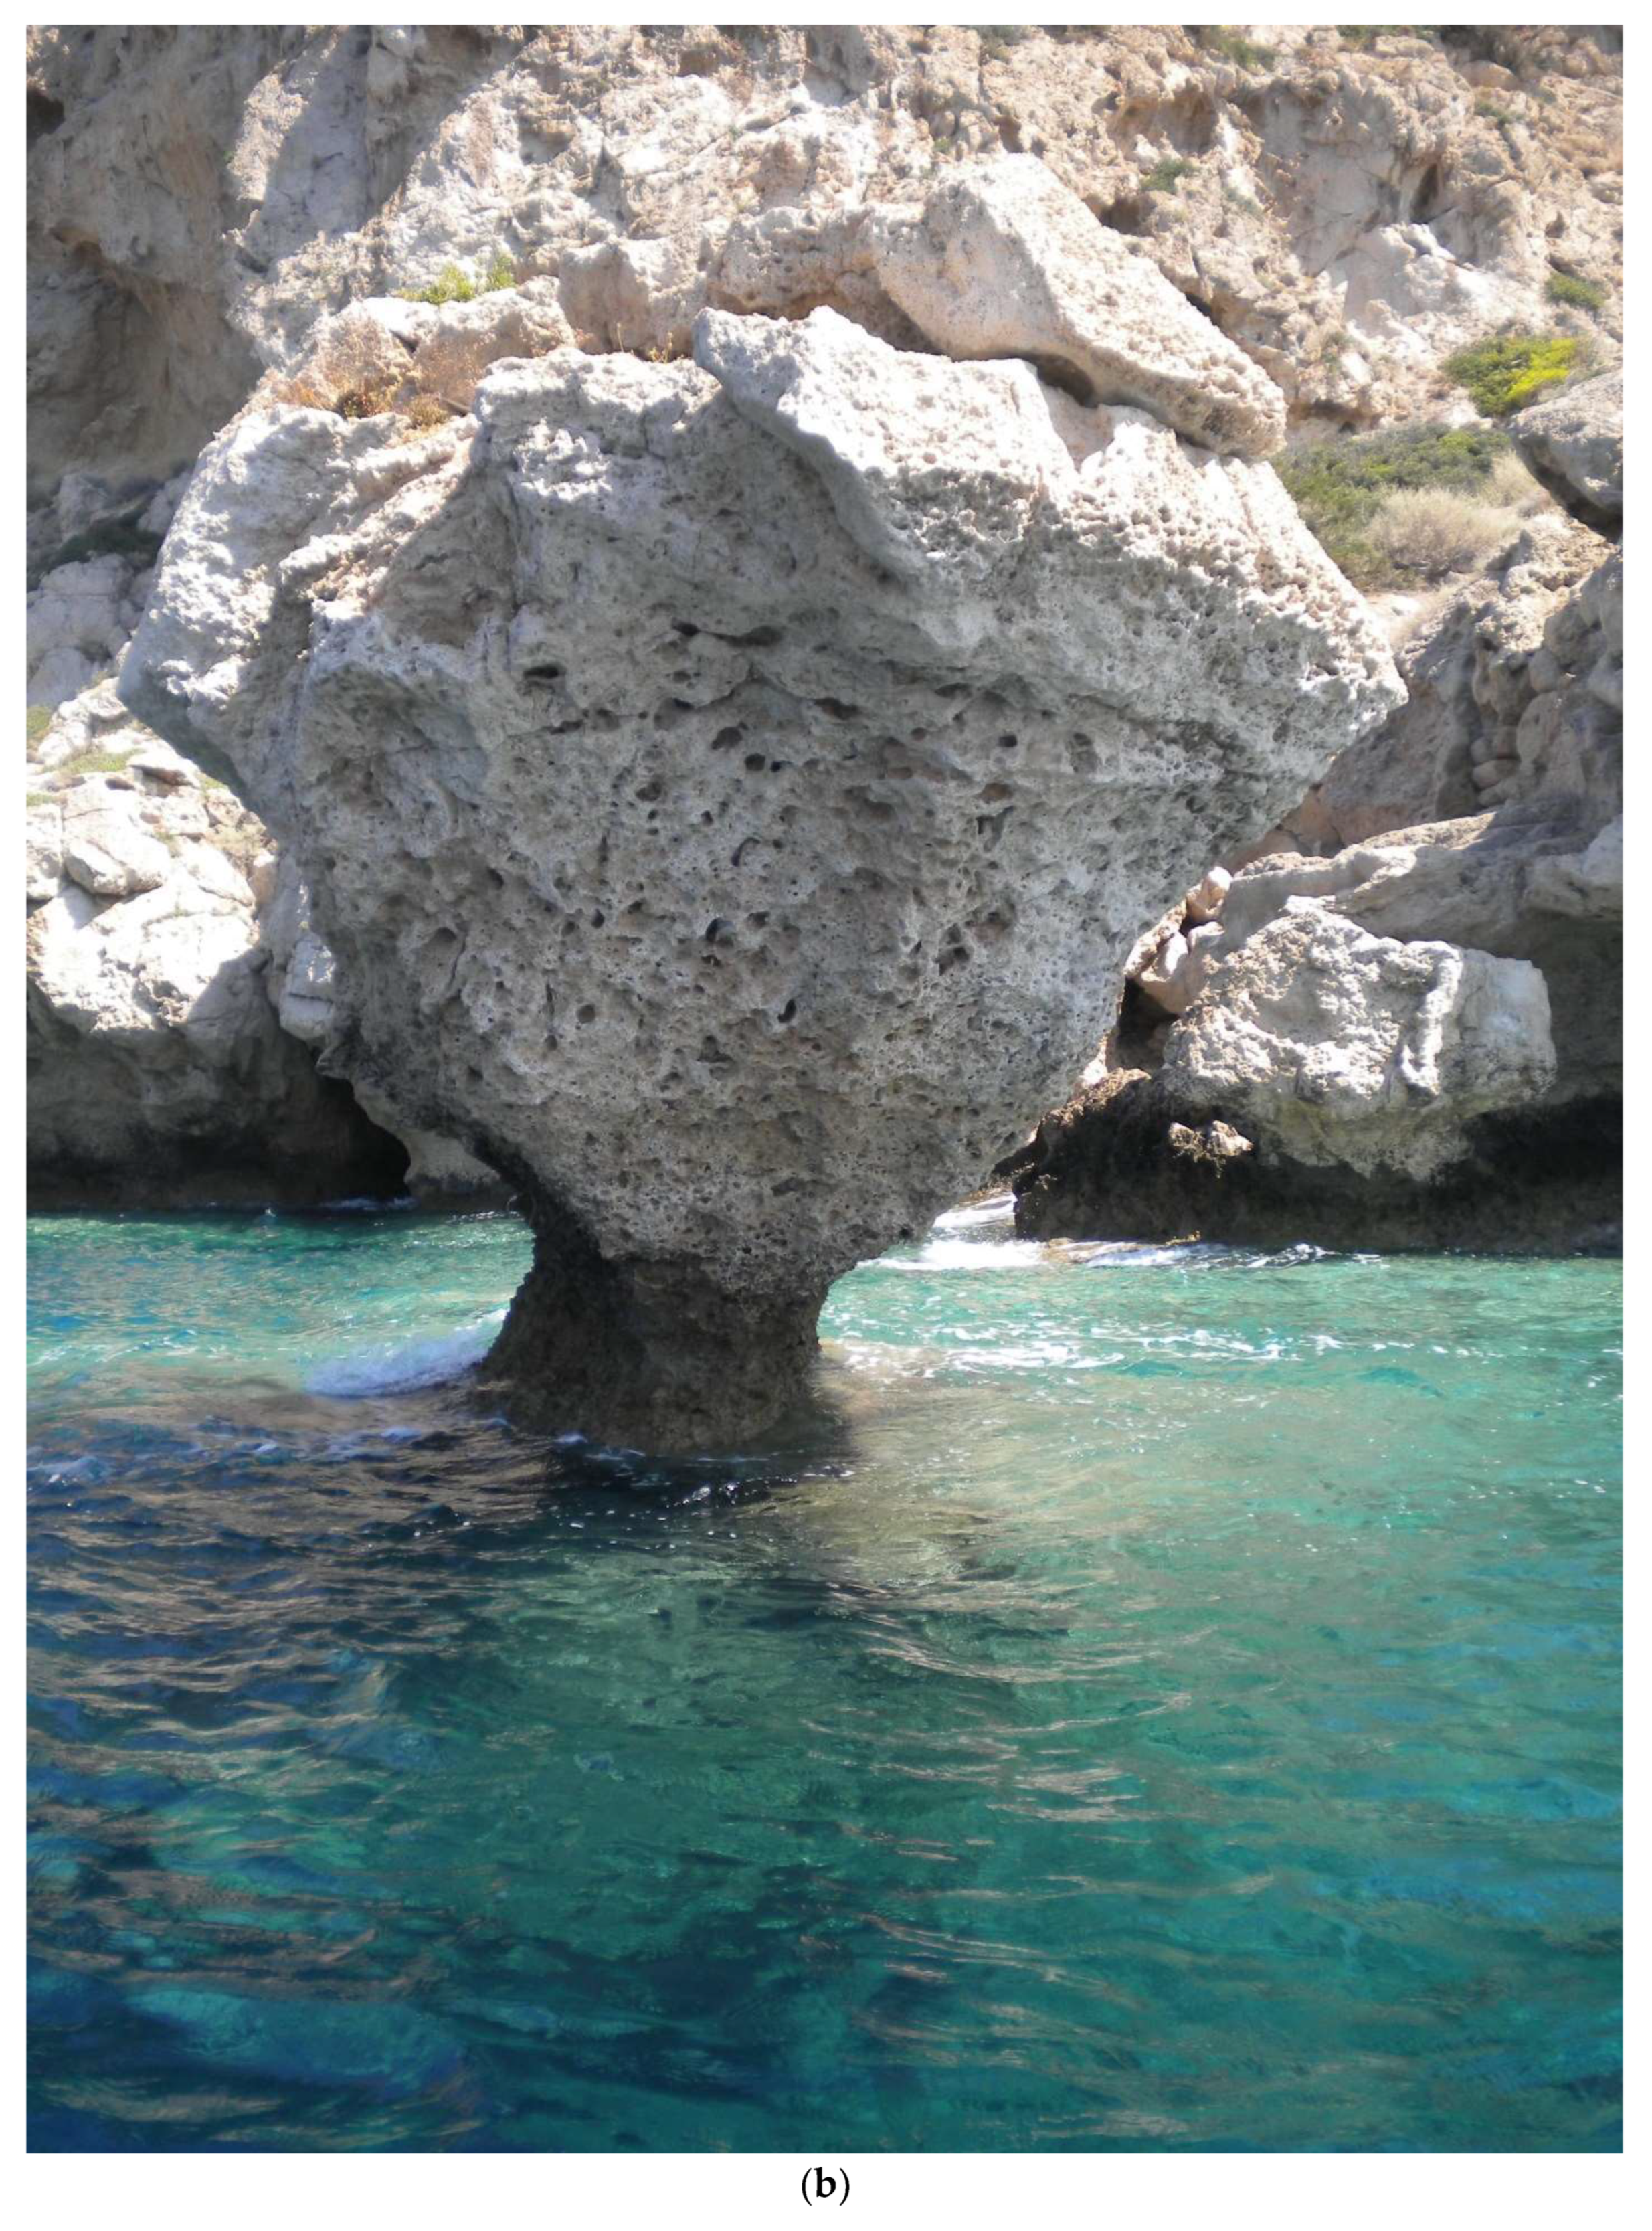
Tidal notches are horizontal U- or V-shaped rock undercuttings that have been formed through the simultaneous action of physical, chemical and biogenic erosional processes [80,81], but bioerosion seems to play the key role in their formation [82]. The organisms that primarily facilitate bioerosion are chitons, cyanobacteria and patellaceous gastropods [83]. Bioerosion rate is not uniform, as it fluctuates between less than 0.1 mm/a and more than 1 mm/a, its average value reaching 0.2 to 0.3 mm/a [80,84,85,86]. The primary factors that affect the bioerosion rate include water temperature, salinity and air pressure. These factors do not solely affect the bioerosion rate directly but also the tidal range at a local scale [87]. Additionally, the rock structure affects bioerosion rates. As it was already mentioned, tidal notches are mainly formed in carbonate rocks. Yet, there are several rock characteristics that control a rock’s susceptibility to bioerosion, such as the layers’ slope and the rock’s discontinuities [88]. Bioerosion rate, and thus the rock undercutting, are higher near the mean sea level that is in the midlittoral zone, as it is this area of the coastal zone that hosts the highest number of eroding organisms. The part of the notch that is characterized by the highest undercutting is referred to as the vertex. The undercutting decreases on either side of the notch’s vertex. The overall notch shape is controlled by several factors, including erosion (physical, chemical and biological), wave activity, lithology and resistance to erosion [89].
Tidal notches are usually formed in limestone cliffs in the mid-littoral zone. Tidal notches formed on compact limestones are a very good sea-level indicator for microtidal areas [80]; they are considered to be precise sea-level indicators, and they can attest to the modality of sea-level change (rapid or slow), allowing the identification of palaeo-seismic events. The fact that tidal notches are formed near the sea level renders them a very significant sea-level indicator. In fact, given that different notch profiles reflect different bioerosion rates, tidal range and/or period for which the sea level remained constant, the notch profiles offer valuable information regarding the conditions that prevailed when they were formed and, more specifically, regarding the position of the sea level during their formation, the duration in which the mean sea level remained in the same position (which would be the position of the vertex), as well as the means of the notch’s displacement from its initial position (i.e., whether it was co-seismic, that is rapid or gradual) [80,86,87,90].
Tidal notches can be linked to several co-seismic uplift events, but identifying a single seismic event through studying them is rarely achievable [91,92,93]. Tidal notches of microtidal areas (such as the Gulf of Corinth) can offer an estimation of Holocene relative sea-level changes [94]. It is worth mentioning, however, that uplifted tidal notches are more often used as sea-level indexes (indicating sea-level rise) (see [95,96,97,98,99,100,101,102,103,104]). On the other hand, submerged notches are often difficult to observe and conduct measurements and received less attention [87,105].
The use of tidal notches as sea-level indicators is very common in the Mediterranean region, because it is generally characterized by low tidal range and wave activity, thus minimizing potential errors [88]. In order to identify a palaeo-shoreline, individual erosional marks need to be recognized as formed in the mean tidal zone of the formation period [97].

3.2. Marine Terraces

Marine terraces are wave-cut platforms formed during an episode of sea-level highstand by the combination of both global (eustatic) sea-level changes and tectonic uplift [55,106,107,108]. The morphological features of marine terraces can be associated with the Late Pleistocene sea-level fluctuations in relationship to the tectonic movements [109,110,111,112,113].
The part of a terrace that can safely be associated to a palaeo-shoreline is called the inner edge, which corresponds to the base of the palaeo-cliff in its interface with the surface of the palaeo-platform. The elevation of the inner edge can be correlated with the extent of the total uplift since the time of formation; among a series of marine terraces, each inner edge reflects a sea-level highstand and, as such, it can be linked to a Marine Isotope Stage (MIS) [109,114,115,116,117,118,119].
In areas that undergo a relatively constant and rapid uplift, several successive marine terraces can be formed; in this case, the inner edge of each terrace corresponds to the position of the coast during the period of the terrace’s formation [108], thus allowing the identification of several sea-level fluctuation cycles [120].

3.3. Beachrocks

Beachrocks are coastal formations consisting of beach material (e.g., sand, pebbles, biogenic material) that has been cemented through the precipitation of carbonate salts, i.e., high-magnesium calcite (HCM) or aragonite [121]. Beachrocks are considered as intertidal deposits [122,123]. The granulometry of a beachrock’s material varies according to the environmental conditions. The grains may consist of quartz, flint, feldspars, heavy minerals, clasts, volcanic material, carbonate ooids, mollusk shells and skeletal fragments [124,125,126]. The cementation of beachrocks is very rapid, thus acting auxiliary in their good preservation [127].
Beachrocks are a very good sea-level proxy, because they contain information on both the horizontal and the vertical movements that have taken place in the coastal zone [128,129]. Facies analysis can be successfully utilized to reconstruct past sea-levels and sea-level changes [127].

3.4. Biological Indicators

Lithophaga are mollusks that create bores in rocks (mainly carbonates), which they use for dwelling. The upper limit of Lithophaga holes and, generally, borer shell holes is considered to be an excellent sea-level indicator [130]. Several studies [130,131,132] have shown that the upper limit of the living Lithophaga can provide the limit between the sublittoral zone, where the mollusks are protected against bioerosion and thus preserved, and the biological midlittoral zone, where these species cannot be preserved due to biogenic erosion. The limit of these two zones is frequently referred to as biological mean sea level. If fossil mollusks are found above this level, i.e., due to co-seismic uplift, their shells are well protected against erosion. Vermetids are a good sea-level indicator as well, as they can clearly show rapid, seismic movements [131,132]. An advantage of mollusk shells is that when found and collected, they can be dated with isotope methods (radiocarbon or uranium series).

3.5. Archaeological Indicators

Several archaeological constructions have been used as sea-level indicators when reconstructing an area’s palaeogeographical evolution, such as ancient harbors or fish tanks [133,134,135,136]. It is, however, important to know how an archaeological indicator is to be used. Constructions that were initially built near the sea level (such as ports and fish tanks) can offer valuable information regarding an area’s vertical tectonic movements, both qualitive and quantitative, whereas constructions such as roads do not give accurate clues regarding uplift/subsidence extent or rate [137]; in fact, a road, a cemetery or a temple that are found above the current sea level offer no information regarding the sea-level changes themselves, whereas if they are found submerged, they can only provide an estimation of the minimum subsidence extent, as the absolute altitude of their initial construction is not known. Additionally, different constructions offer different chronology opportunities. For instance, buildings can more easily be dated through archaeological data, given that their form varies through archaeological periods, than harbor facilities and marine constructions such as breakwaters and moles, whose form roughly remains unaltered over the time [137]. Additionally, a single scientific field (e.g., geomorphology, archaeology etc.) can only rarely extrapolate an accurate conclusion when studying the interaction between relative sea-level changes and archaeological markers, but it is rather the combination of these fields that produces accurate results [137].

4. Sea-Level Changes across the Gulf of Corinth

The coastal zone and other features of the Gulf of Corinth offer several pieces of evidence regarding active tectonic movements, such as uplifted shorelines and earthquake-driven landslides [23,46,53,55,77,79,138].
As far as relative sea-level change patterns are considered, the gulf can be divided into two parts: the northern and the southern. The southern part of the gulf, i.e., the coast of the northern Peloponnese (from the Gulf of Patras–Rio to the Perachora Peninsula; see Figure 1) has been undergoing tectonic uplift at least since 300 ka B.P. [139,140]. The uplift pattern is not uniform across the whole area of the northern Peloponnese, but it varies both in uplift nature (that is, episodic and rapid, co-seismic or gradual, aseismic uplift) and in uplift rates (the latter range from 0.2 to 3 mm/a).
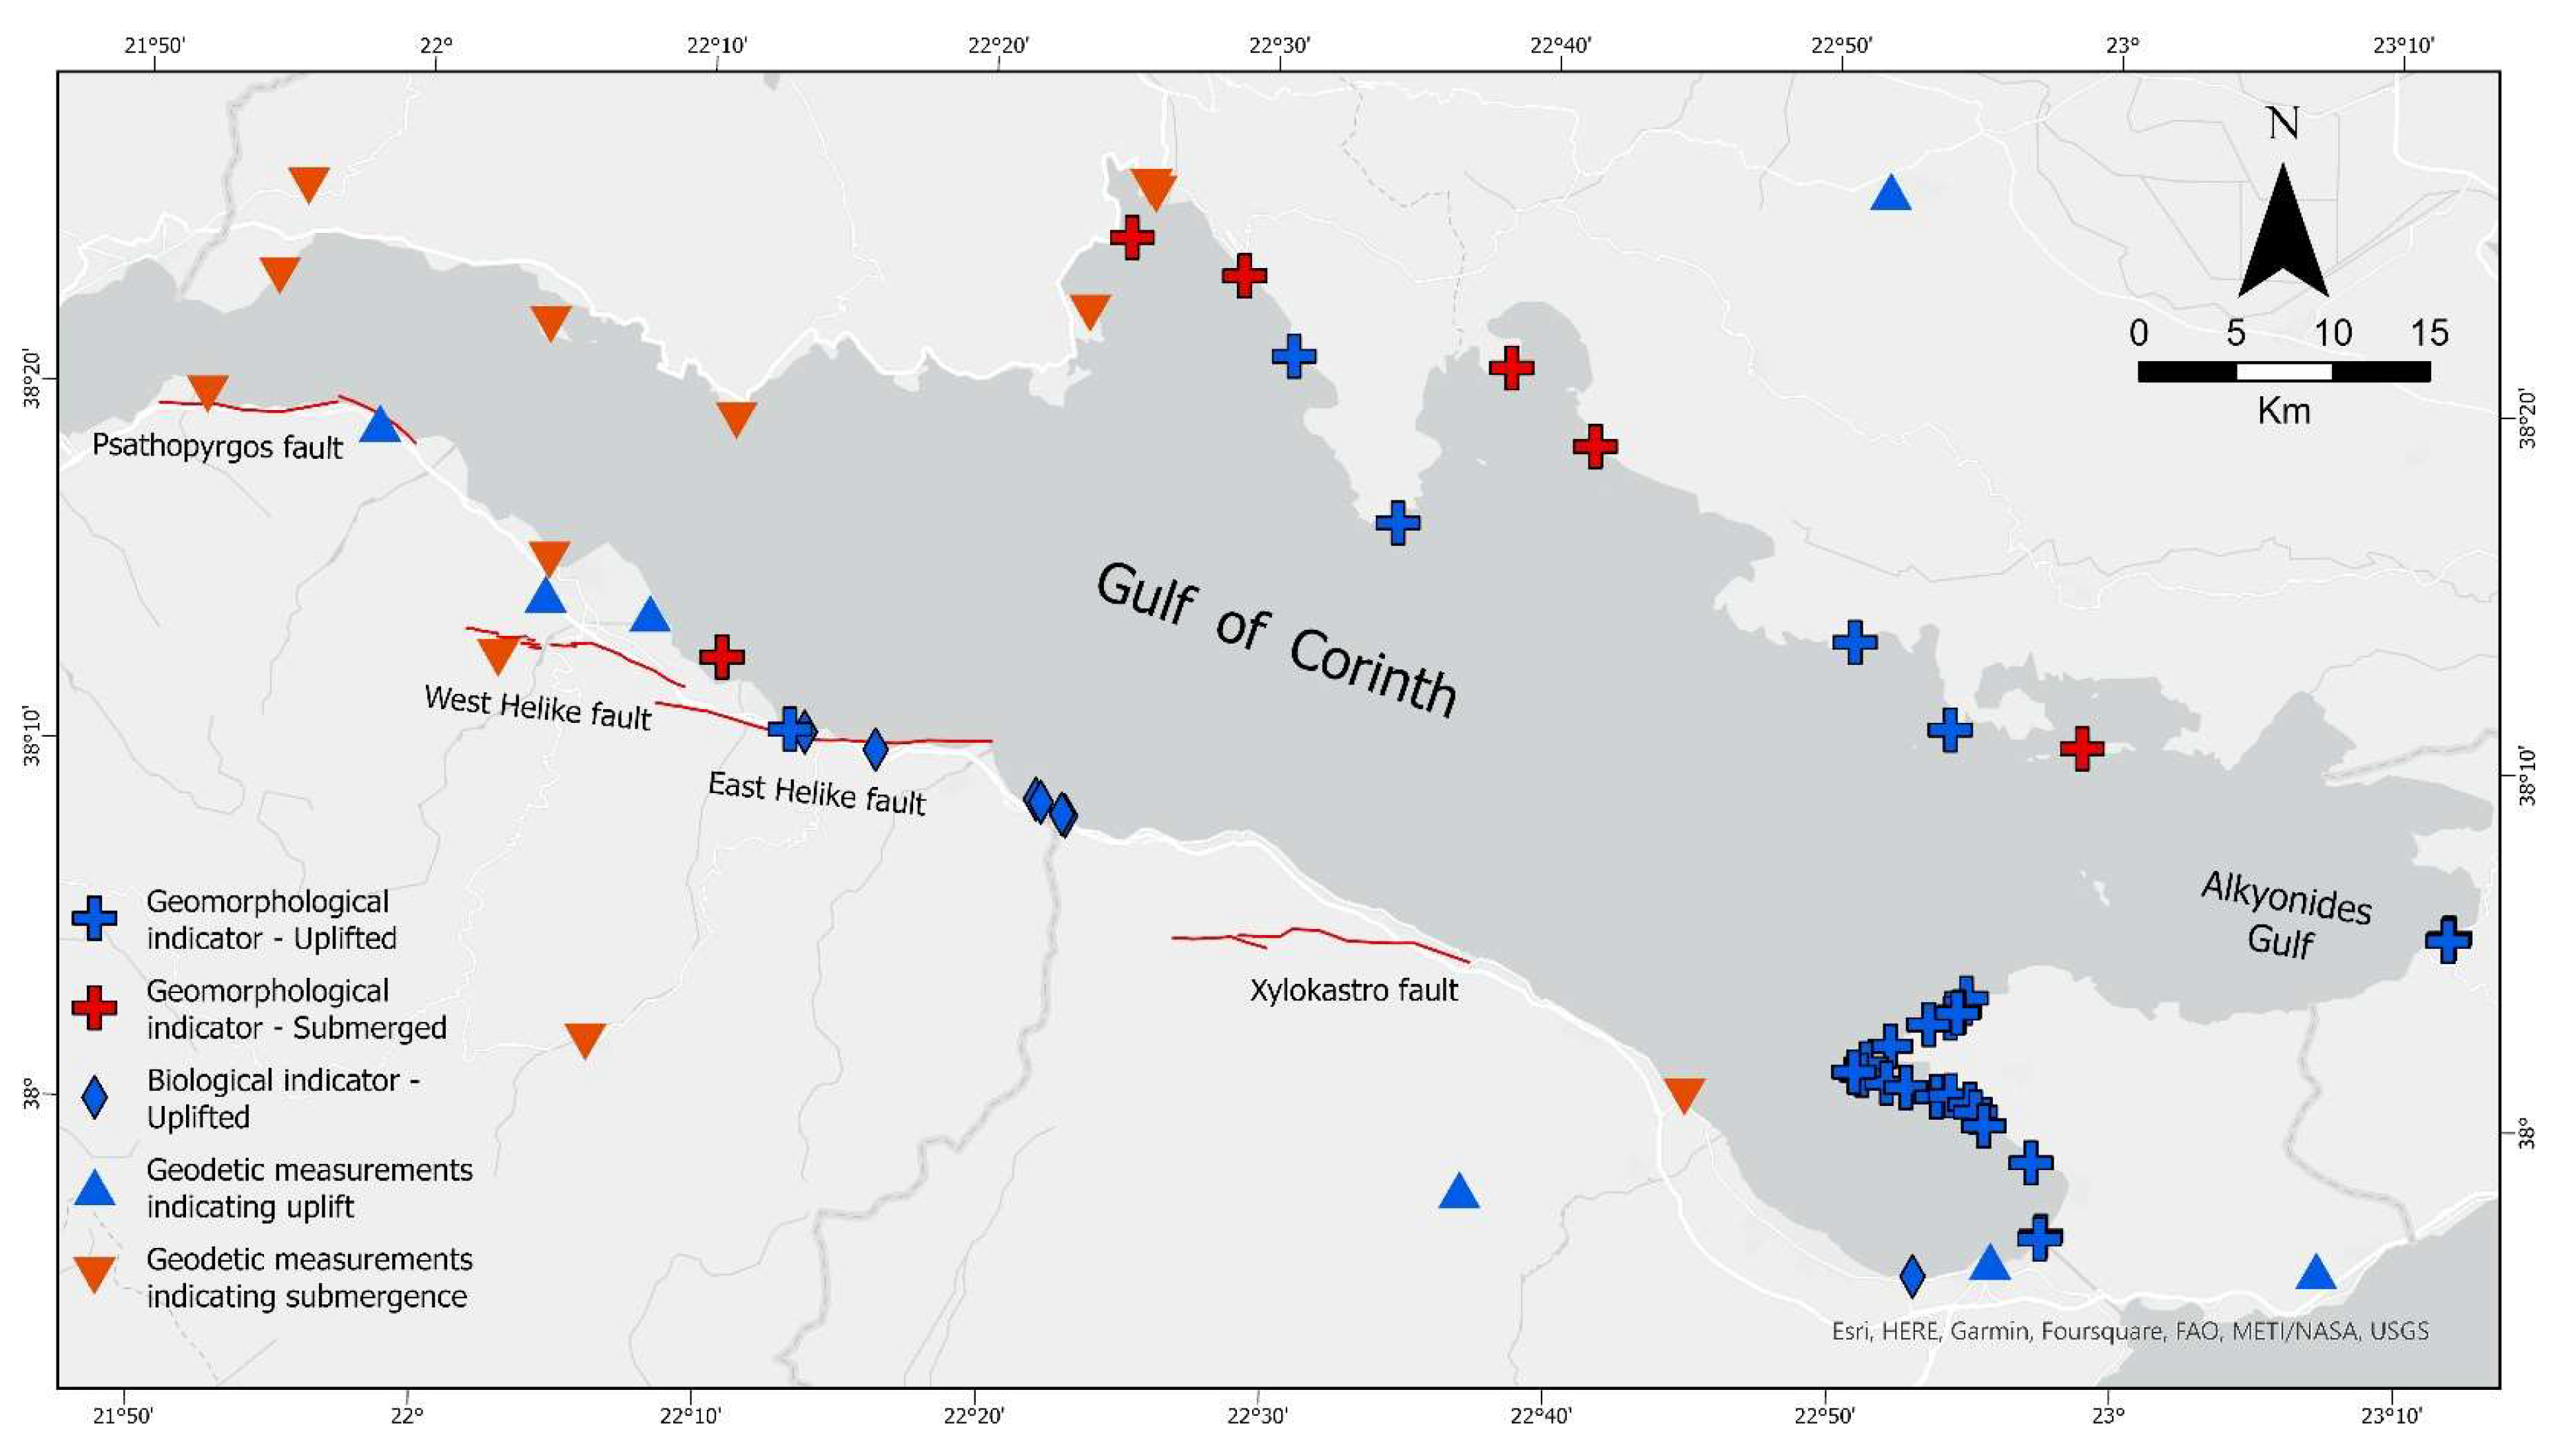
The northern part of the gulf mostly undergoes tectonic subsidence, whose extent is less than the extent of the uplift of the northern Peloponnese. Here too, subsidence is not uniform. The submarine part of the gulf also undergoes subsidence. Subsidence rates were calculated by Moretti et al. [141] for the center of the Corinthian rift at 3.6 mm/a over the last 20 ka. Although uplift evidence is very common and easily observed in the southern part of the gulf, there exists scarce evidence for tectonic subsidence of the northern coasts [142]. In this chapter, we provide uplift and subsidence evidence for the Gulf of Corinth as well as quantitative information (e.g., uplift extent and rates; [142,143,144,145,146,147,148,149,150]). Figure 4 depicts the data collected in this research (geomorphological and geodetic) and shows the confirmed sites undergoing tectonic uplift (Figure 4 blue colors) and those undergoing tectonic subsidence (Figure 4 red colors). Appendix B, Table A1 presents the dated sea-level indicators showing uplift and the calculated tectonic rates.

4.1. Southern Gulf of Corinth

The southern margin of the gulf has been subject to uplift for the last 300 ka [139] with an average rate of 1.5 mm/a [139,140,151]. Uplift in this part of the gulf is evident through various characteristics. Several sea-level markers have been mapped and used to calculate uplift rates in various areas of the northern Peloponnese, such as marine terraces, uplifted beachrocks, tidal notches, biological indicators, such as Lithophaga shells, and archaeological remains, such as ancient harbors and fish tanks. In several cases, the relief itself confirms that uplift has recently taken place (for instance, downcutting erosion in the southern coast of the gulf; [142]).
Generally, the Late Quaternary highest uplift rates in the southern part of the gulf are found in the central part of the northern Peloponnese, having a maximum value of approximately 3 mm/a [47]. Lykousis et al. [152] conducted marine measurements (seismic profiling, long piston coring, short gravity and box coring) in the eastern and central Corinthian Gulf. They found evidence of Upper Quaternary prodelta sequences indicating propagation and subsidence since 125 ka, at rates of 0.7–1 mm/a, whereas the vertical displacement between the northern and the southern margin was calculated at 2–2.3 mm/a. Collier et al. [153] have estimated the uplift rate of the area of Corinth and the Isthmus at 0.3 and 0.44 mm/a, but they point out that these values are only minimum. Keraudren et al. [154] mention that the uplift rate in the Xylokastro area (Figure 1 and Figure 4) reaches 1.5 mm/a.
Through the study of marine terraces, Armijo et al. [15] note that in the broader area of Corinth, south of Xylokastro (Figure 1 and Figure 4), maximum uplift rates range from 1.3 to 0.5 mm/a. At least ten marine terraces have been recorded in the northern part of the Peloponnese, thus indicating various stages/phases of tectonic uplift [15,154,155,156,157]. According to Sébrier [155], the area south of Corinth and Kiato is characterized by raised marine terraces at an altitude of up to 150 m.
Morewood and Roberts [29] have mapped two additional marine terraces besides those by Armijo et al. [15]. Their Terrace 1 has been correlated to the 125 ka high sea-level stand, the uplift rate being 0.28–0.64 mm/a [29]. Based on the assumption that the uplift rate was stable along the whole palaeo-coast [15,158], Morewood and Roberts [29] correlated Terrace 2 to the 240 ka highstand (uplift rate 0.33–0.50 mm/a) and Terrace 3 to the 330 ka highstand (uplift rate 0.36–0.74 mm/a). Uplift rates were higher in the period 330 to 240 ka than in the period 240 ka to present. Additionally, uplift rates along the north-dipping South Alkyonides fault decrease toward the end of the fault [29].
In the area of Diolkos (Figure 1 and Figure 5), there exists the homonymous paved road used in antiquity for the transportation of ships from the Gulf of Corinth to the Saronic Gulf and vice versa. The road has been constructed on a beachrock; upon its construction in the 6th century B.C., the beachrock’s development ceased. The area underwent a subsidence phase of approximately 35 cm, leading to the submergence of both Diolkos and the underlying beachrock. Thus, the beachrock continued being developed, covering part of the ancient road. Consequently, after 1569 A.D., the area underwent at least one co-seismic uplift phase, the total uplift being approximately 12 cm [129] (Figure 5).
In areas where tectonic activity is intense, such as the Gulf of Corinth, the pattern and the features of the drainage basins often reflect the impact of tectonics [159,160,161,162]. Fernández-Blanco et al. [163] concluded that the area of the northern Peloponnese has undergone uplift based on the topographical and geomorphological features of the drainage basins. On the condition that the 3D shape of drainage basins offers a well-detailed record regarding an area’s tectonics, Demoulin et al. [164] conducted morphometric measurements in the main Peloponnesian rivers flowing into the gulf in order to unwrap the area’s uplift history during the Quaternary. One of the features used by Demoulin et al. [164] was the hypsometric curve, which is used to describe the cumulative distribution of elevations of a drainage basin. The curve can be correlated to the rock volume of the catchment in comparison to the catchment’s area. The integral of the hypsometry can offer a rough estimation regarding the catchment’s evolutionary stage. The results for the drainage basins of northern Peloponnese show landscape rejuvenation. More specifically, the most recent uplift has taken place in the Aigion–Derveni area (central part of the northern Peloponnese; see Figure 1) [164].
Another metric Demoulin et al. [164] used was the Geophysical Relief. According to Small and Anderson [165], the geophysical relief is the mean elevation difference between the surface that connects the highest points of the landscape and the actual topography. It indicates the valley deepening and erosion. Demoulin et al. [164] found that the Aigion–Derveni is the most actively and most recently uplifted region, the maximum values reaching 410–420 m. According to their findings, the largest uplift rates, at least regarding the most recent event, are observed in the central area (Aigion–Derveni), while the lowest are observed in the eastern part and intermediate rates are observed in the western part. They estimated that the most recent uplift event of the northern Peloponnese occurred at about 10–20 ka. In conclusion, upon studying the topographical features of the studied drainage basins, Demoulin et al. [164] show that the uplift began in the eastern part and propagated westwards. During the Early Pleistocene uplift phase, the rates of uplift were higher in the western part of the northern Peloponnese. The Middle Pleistocene uplift phase only had an impact on the Akrata–Derveni area and, during the Holocene, only the eastern and central part continued being uplifted.
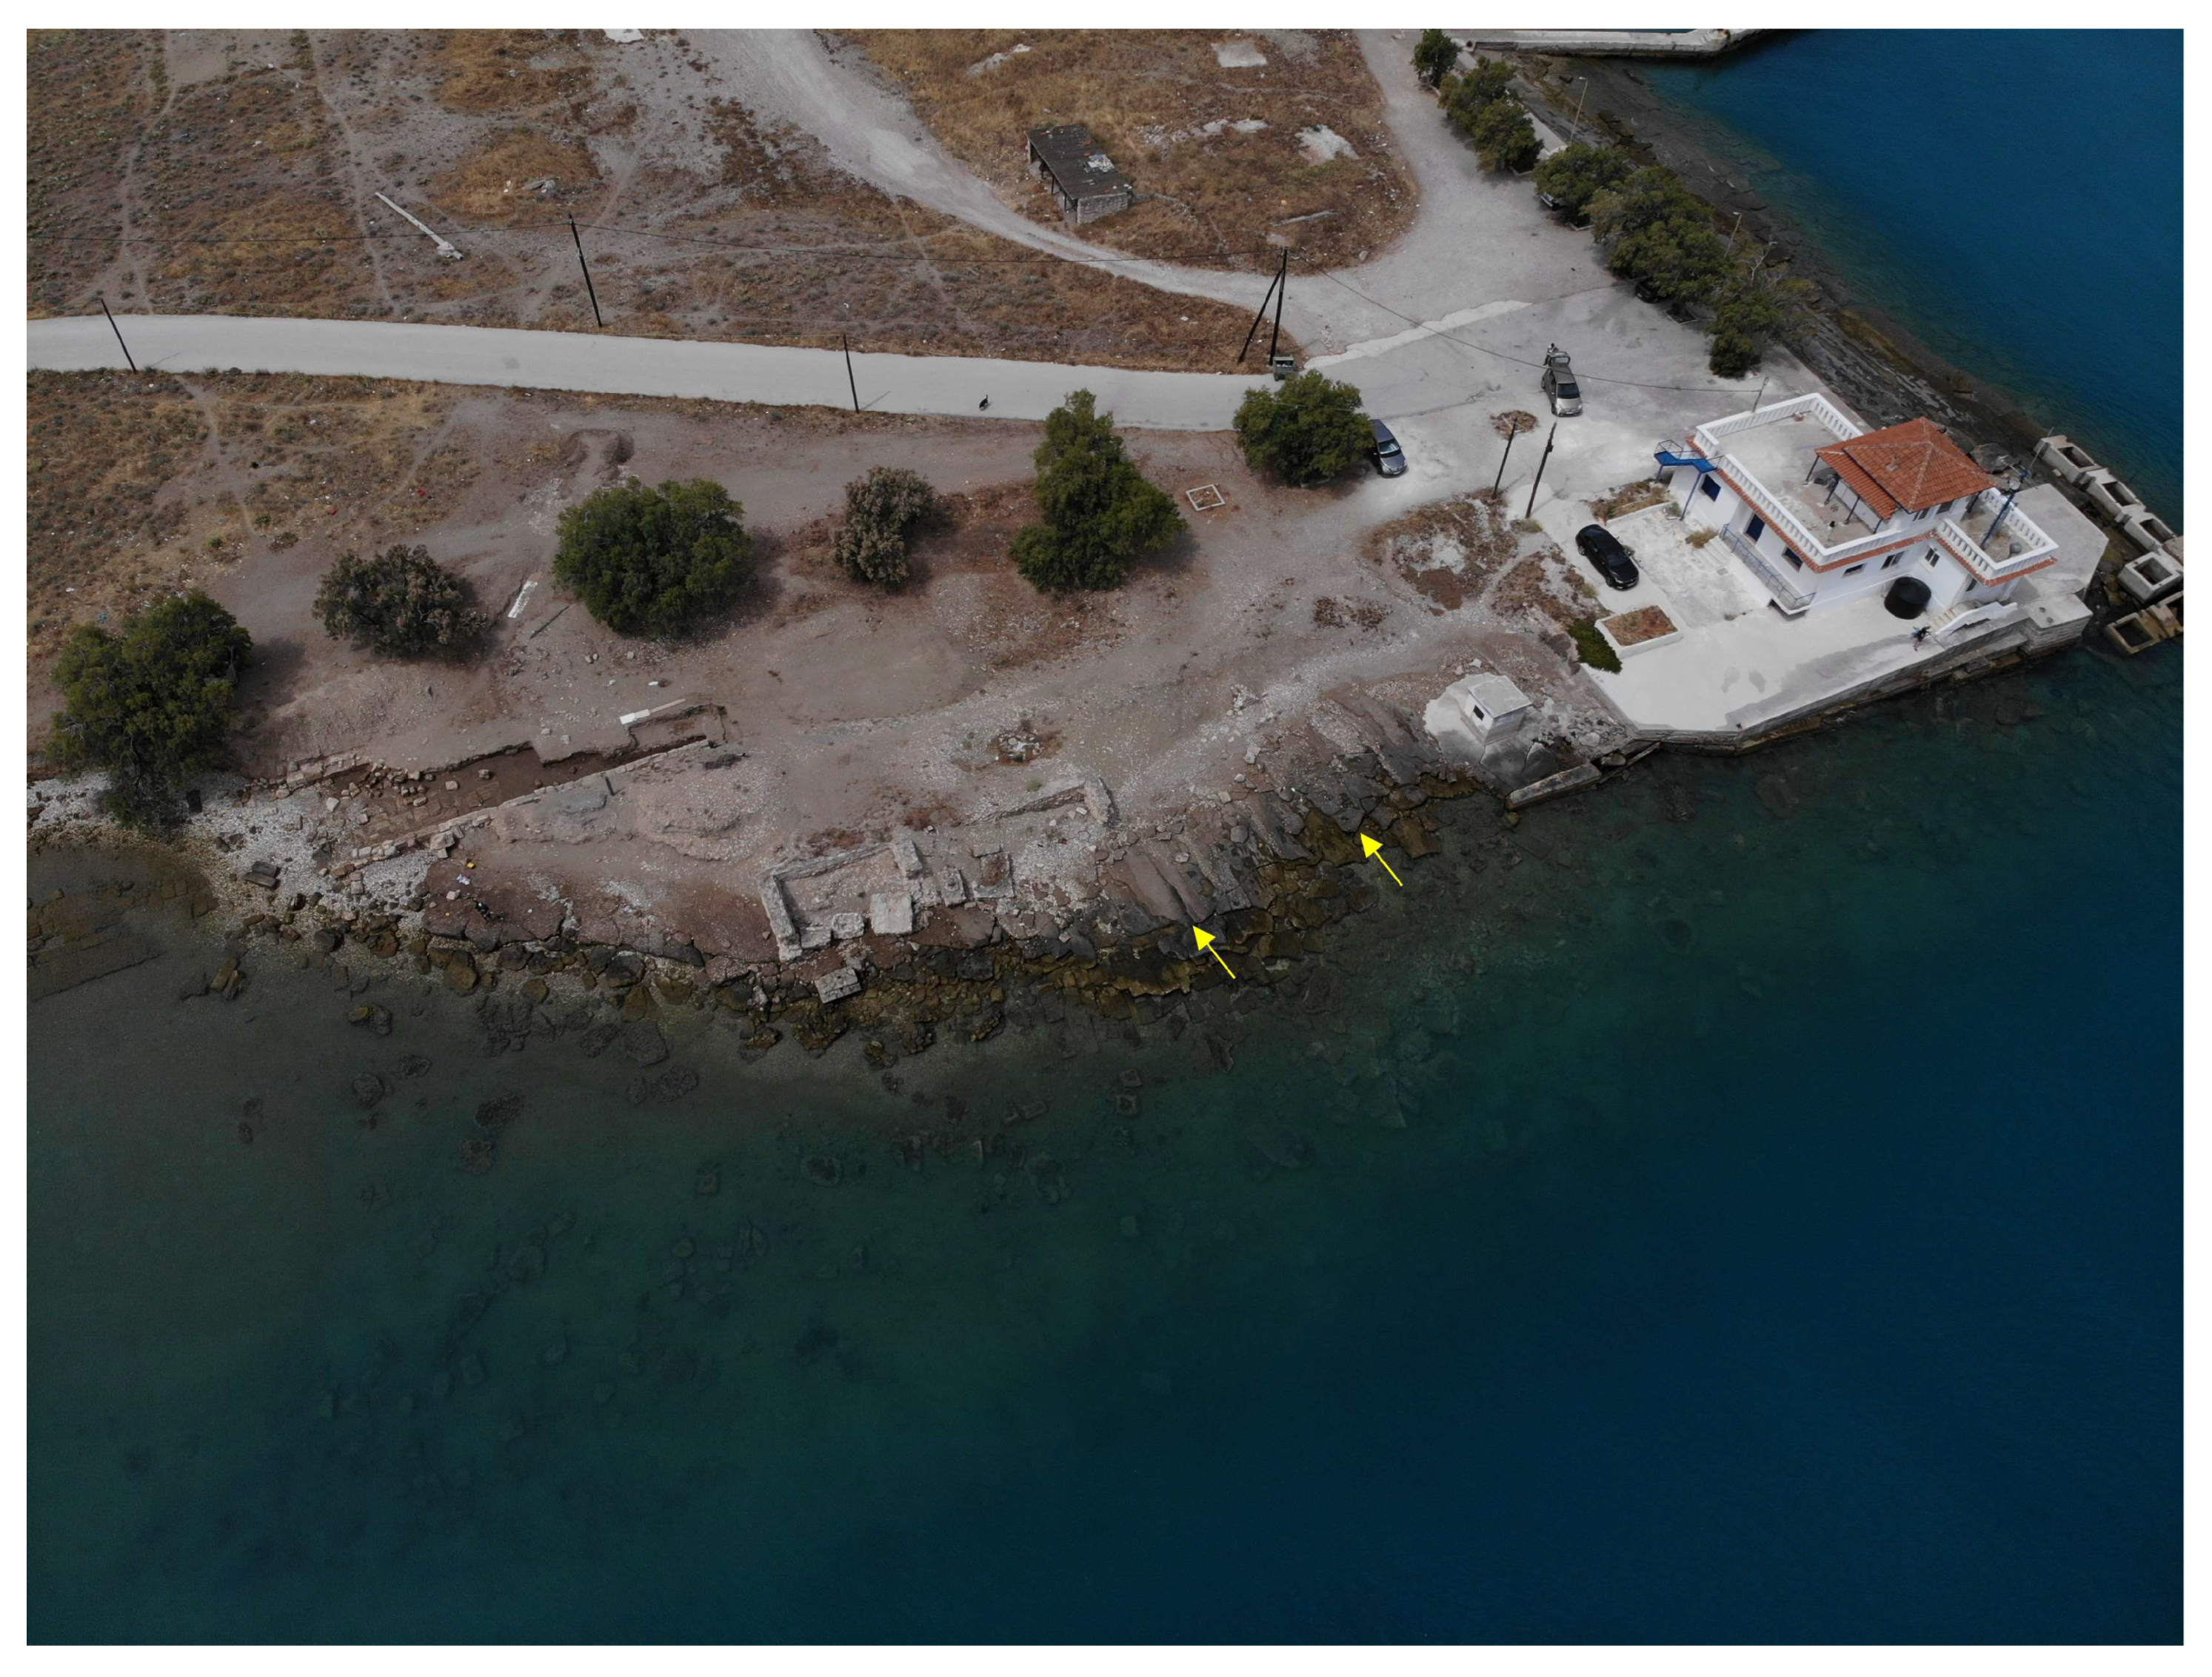
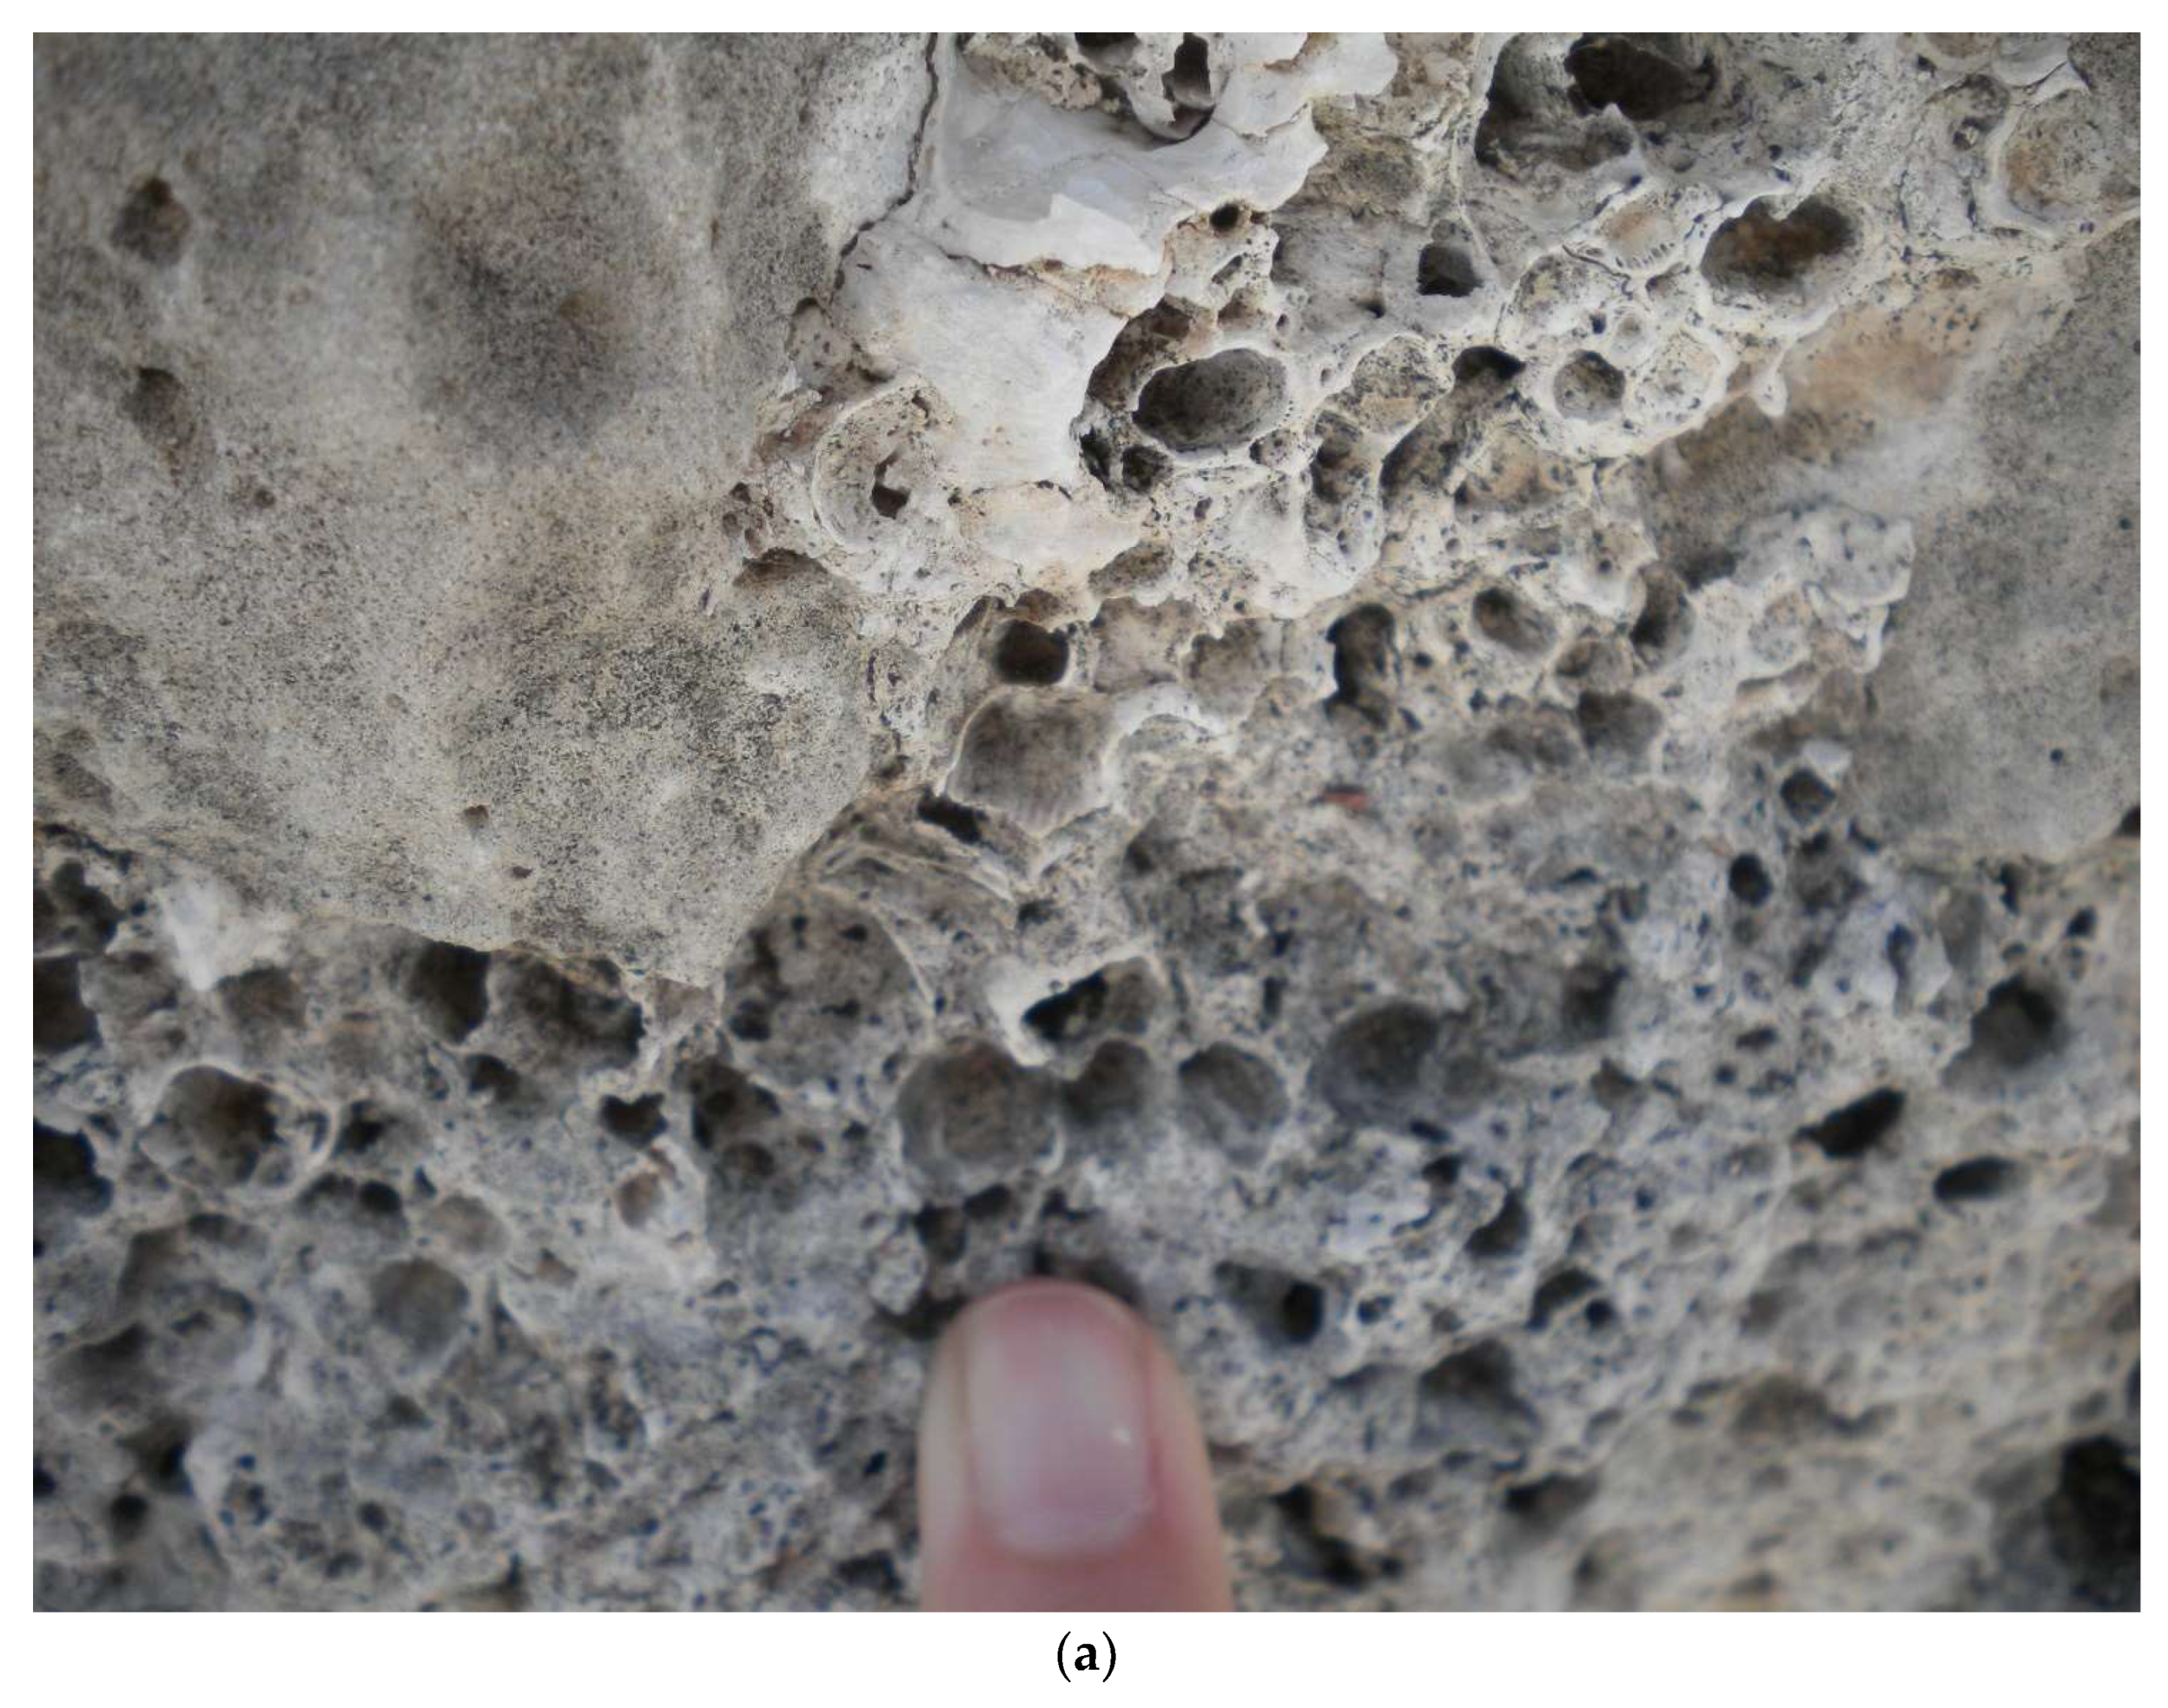
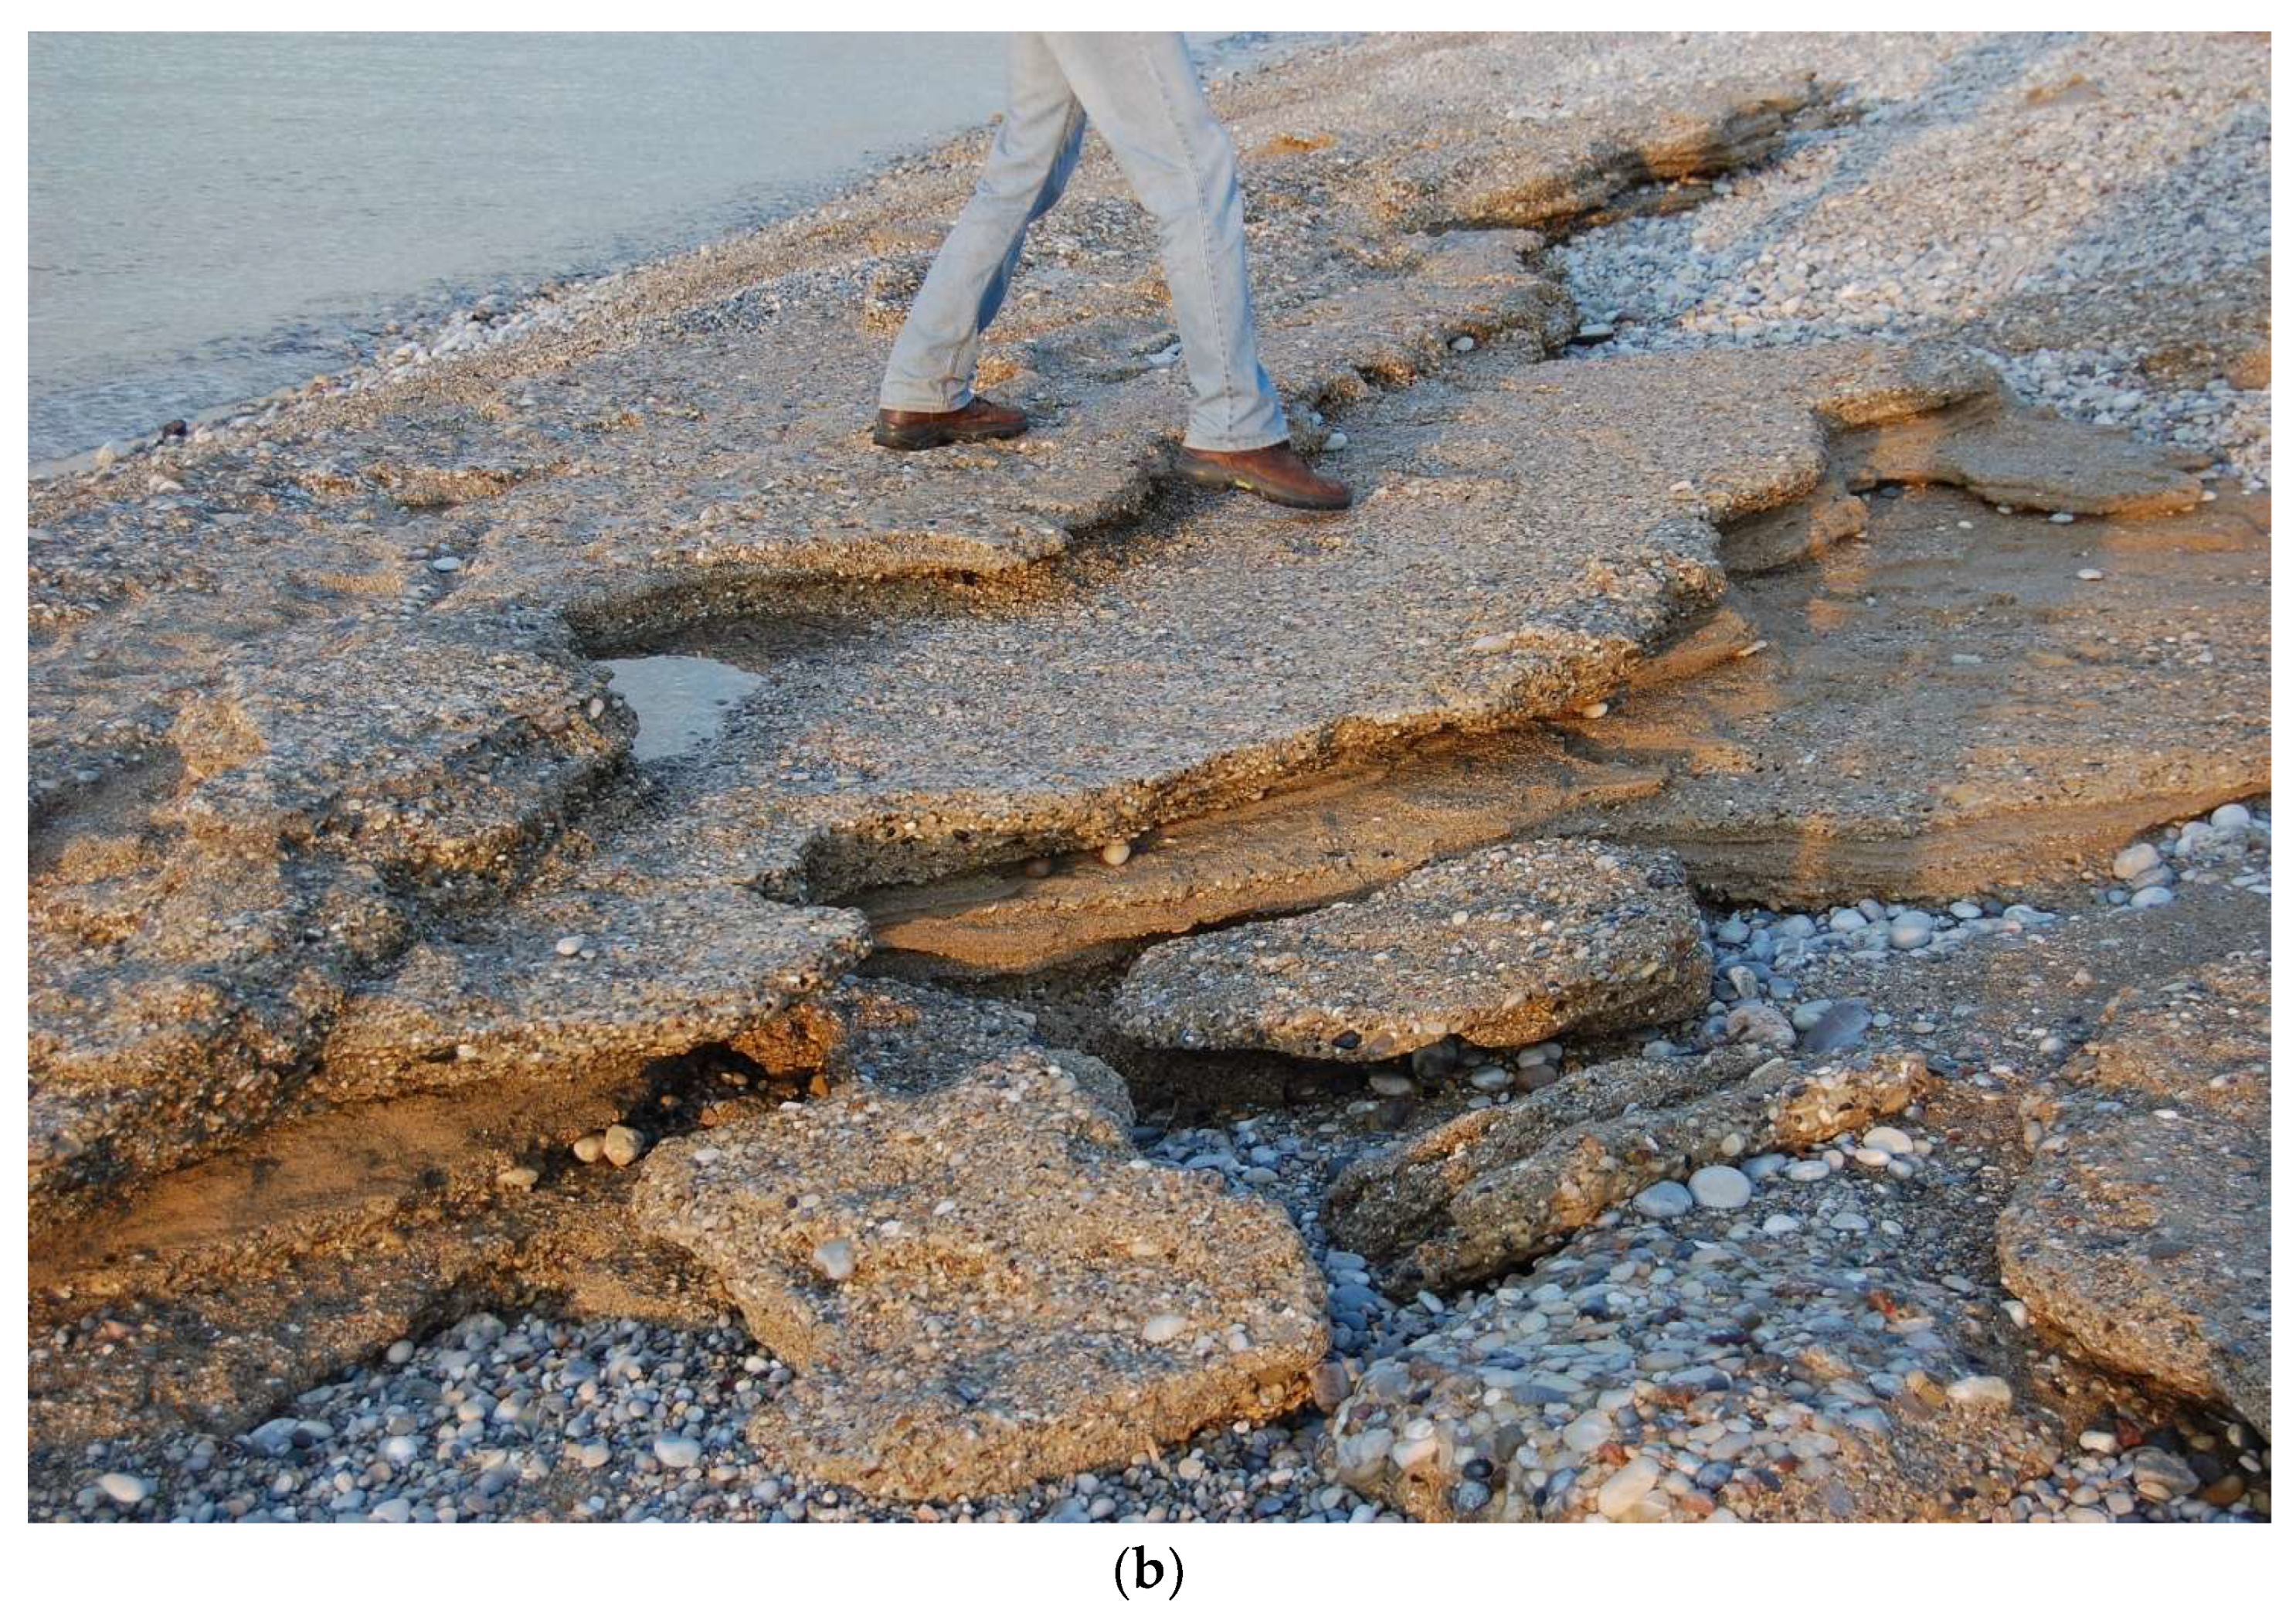
Archaeological remains (mainly uplifted harbors) have also been found in the northern Peloponnese [148,166]. The most typical ones include Lechaion (Figure 1) and Aigeira. Riddick et al. [167] conducted various sediment corings in the ancient port of Lechaion for sediment, micropalaeontology and isotope (C, O) analyses. They suggested that the harbor underwent one or more phases of rapid (co-seismic) uplift in the 6th century A.D., which led to its abandonment. After the uplift, the coastal environment switched to lacustrine, with a simultaneous increase in terrestrial sediments, which was attributed to the lowering of the base level [167]. The uplift of Lechaion could also be identified through rocks bearing mollusk borings (Figure 6a) and through uplifted beachrocks (Figure 6b). According to Mourtzas et al. [157], the area of the ancient port has not only undergone uplift phases but at least one intermediate subsidence phase. After the construction of the harbor around 360 A.D., the first sea-level changes that seem to have occurred in the area were due to seismic events around 360–370 A.D. and 520–580 A.D.; the latter period is possibly related to subsidence [157]. Turner et al. [144] attributed the uplift at Lechaion to isostatic processes.
Stiros [166], based on biological indicators, notes that the ancient port of Aigeira has undergone rapid Holocene uplift due to several individual seismic events. He calculated the sea-level drop rate at 2.15 to 2.3 mm/a from 150 to 250 A.D. (which was the period when the harbor was constructed). Converting it to uplift rate, he estimated that the latter was 2.4–2.5 to 3 mm/a. Papageorgiou et al. [131] reported an uplift of 1 m between 1088 and 1451 A.D., also confirming that the uplift was rapid and episodic, whereas Stewart and Vita-Finzi [91] found an uplift of 6 m in approximately 2400 to 2700 years.
In the Aigeira area, the uppermost boundary of Holocene emergence has been identified by Pirazzoli et al. [47] at +9.3 m. They suggest that the sea level did not remain stable for a significant time period during the Quaternary but underwent constant changes. They estimated the time period prior to which the uplift did not exceed the eustatic sea-level rise around 7035–7542 B.P. After this age, the vertical (uplift) tectonic movements were more significant than the eustatic ones, thus leading to a rapid uplift of the area [47]. The latter also suggests that the uplift rate of Aigeira was not stable; they mention that it was faster during the period to 1451 A.D. and slower in the intermediate periods. In the nearby area of Platanos beach, uplift rates were calculated at 2.4 mm/a, which could also have reached 3.2 mm/a during some periods [47].
Stewart and Vita-Finzi [91] identified uplifted erosional notches in the areas of Diakofto, Platanos beach and south of Aigeira. They also conducted a C isotope study (and locally, U-series) on Lithophaga and other mollusks across this area and found additional evidence of tectonic uplift. The minimum uplift rate was calculated at 0.8–2.5 mm/a in Aigeira, 1–2.3 mm/a in Platanos beach and 1–2 mm/a in Diakofto. The uplift was not solely co-seismic but aseismic as well [143]. According to the area’s morphological features, there have been at least three faulting events in the last 2500 years. Τhere were two periods of rapid uplift (2–2.5 mm/a) and an intermediate phase, lasting for 4 to 5 ka, when the tectonic activity and the consequent uplift were almost inexistent. Stefatos et al. [168] mention that the uplift of the Diakofto, Platanos and Aigeira coastal areas was not due to Helike fault slip solely but rather to more faults, which could also explain the differential uplift extent.
Collier et al. [153] used uranium-series disequilibrium dating of Scleractinian corals collected from the isthmus of Corinth and the Gulf of Alkyonides to calculate the uplift rate for these areas. Uplift rates varied according to the sampling location. They found a minimum uplift rate of 0.2 mm/a over the last 312,000 years to 0.3 mm/a over the last 205,000 years for the area of Corinth and the Isthmus. The average rate was calculated at 0.44 mm/a for the last 205 ka [153]. The Alepochori coast has been uplifted by 0.1 mm/a for the past 127,000 years. The mean rate for the broader area is 0.3 mm/a [153].
Verrios et al. [169] studied the morphometric parameters of the west and east Helike faults in order to assess the recent tectonic movements. Their results confirm the uplift regime that characterizes the area during Holocene. Another morphotectonic study was conducted by Tsimi et al. [170] along the footwall of the Psathopyrgos normal fault at the western end of the Gulf near Rio, indicating high tectonic activity. Mouyaris et al. [149] mention that the two segments of the Helike fault zone have either undergone differential tectonic movements or periodic uplift and subsidence events. In any case, they concluded that the region has been uplifted by at least 6.5 m in the last 4–5 ka, resulting from at least three individual uplift events [149].
Rohais et al. [38] divided the sedimentary formations of the northern Peloponnese into three groups. The Upper Group consists of formations such as slope breccia, present and perched fan delta, slope deposits and fluvial and marine terraces. The older fluvial/marine terraces are dated from the footwall of the eastern Helike fault at 307–312 ka [140,153]. The small fan deltas, terraces and slope deposits of this group were attributed to rapid uplift of the northern Peloponnese [38].
According to McNeil and Collier [140] and McNeil et al. [171], raised marine terraces exist in the footwall of the East Helike fault that show an uplift rate of 1.1 mm/a along the fault, which decreases in the eastern edge of the fault. This rate is similar to that found by Dufaure and Zamanis [172] and Rigo [173] and to the rate of 1.3 to 1.6 mm/a for the Corinth–Xylokastron terraces found by Armijo et al. [15]. In that way, McNeil et al. [171] estimated the fault’s age at 0.7 to 1.1 Ma. They also suggested that the fault has contributed to a 2–3 mm/a extension rate of the overall extension of the Corinthian rift. Activation (earthquake occurrence) frequency for this fault was estimated at two or three events per 1500 years with a probable magnitude of M > 6.6 [171].
Various dating methods have been applied in the terraces of the western part of the south gulf, and several dates and uplift rates have been estimated. Palyvos et al. [45] suggest that west of the Rio area, the uplift rate was not stable during the Middle-Late Pleistocene and calculated on average 1.8 mm/a for the last 350 ka or more. De Martini et al. [151] also mapped raised marine terraces in the footwalls of west Helike, east Helike and Aigion faults. They calculated the uplift rates at 1.05 to 1.2 mm/a for the Aigion fault and 1 to 1.25 mm/a for Helike faults for the last 200 to 300 ka. In the area of Aravonitsa (Figure 1), the uplift rate was found to be 1.74 to 1.85 mm/a [174].

Perachora Peninsula

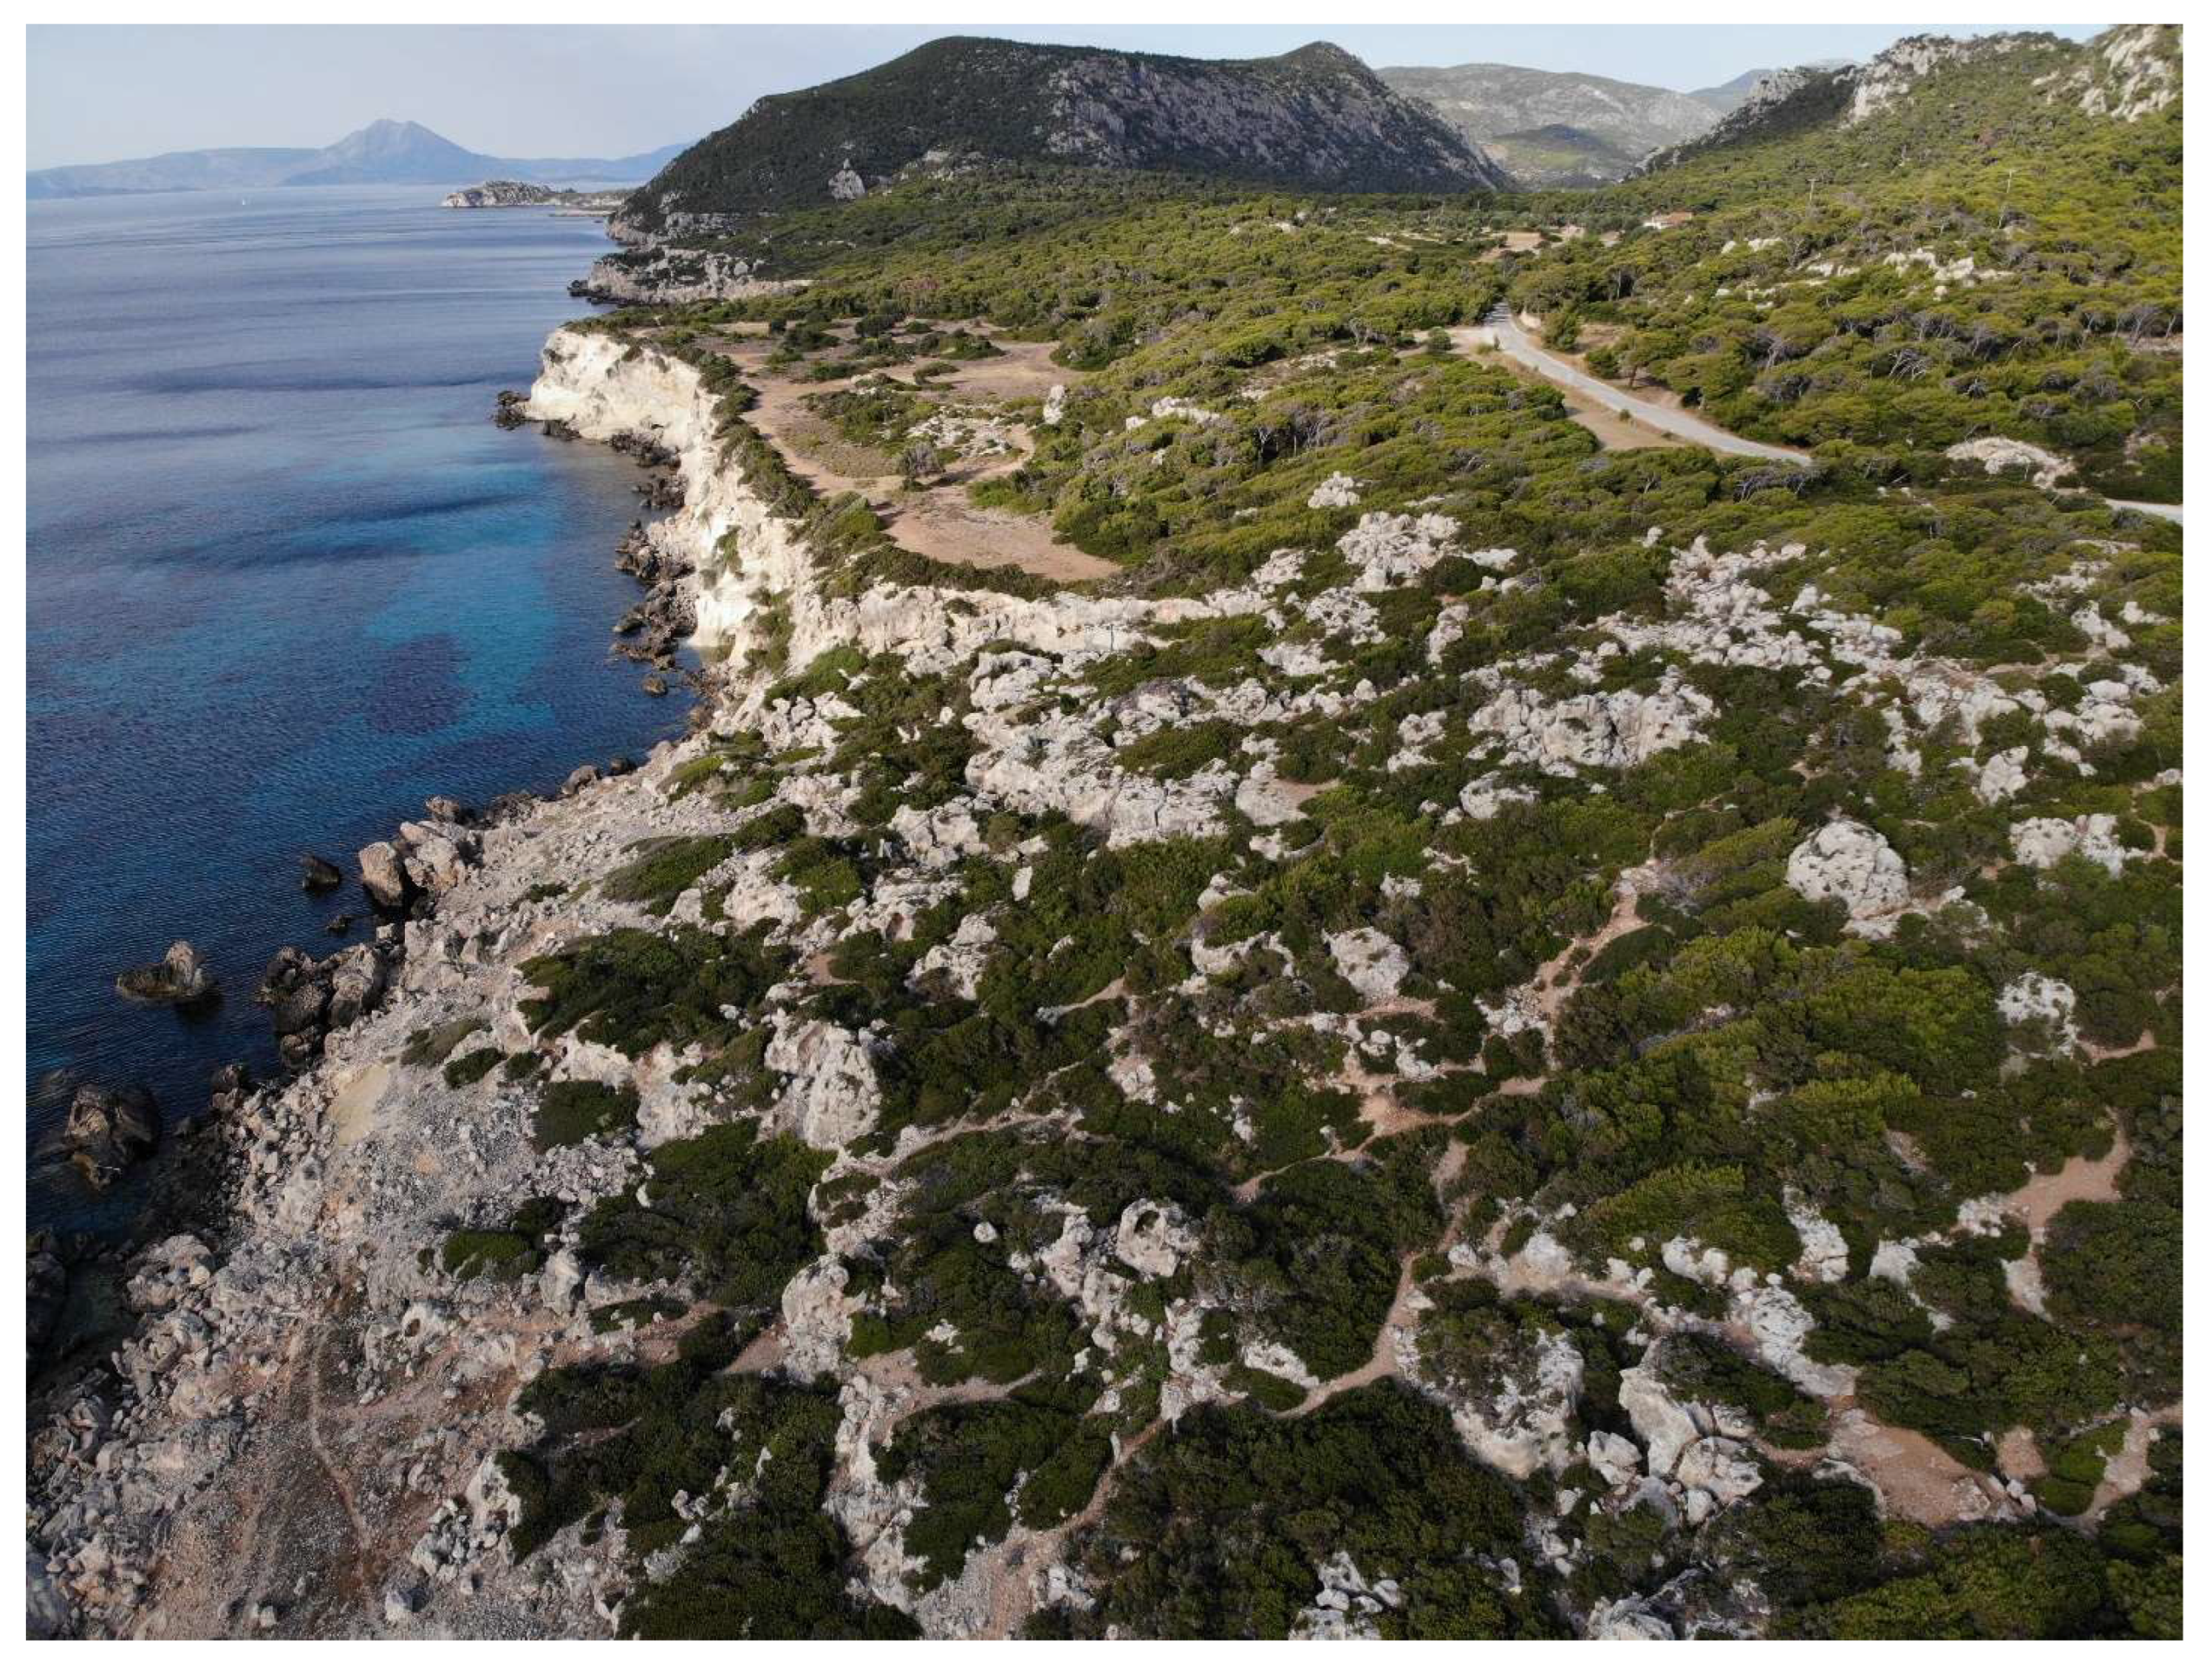
Perachora Peninsula is located in the eastern part of the gulf that segregates it from the Gulf of Alkyonides. The western part of Perachora Peninsula is a deformed segment boundary between the Xylokastro and the South Alkyonides faults, which both have an approximately E–W direction [30]. In the broader area of Perachora Peninsula and Lechaion, several uplifted geomorphological and biological indicators have been identified, such as beachrocks [147,148], marine terraces [29] (Figure 7), Lithophaga shells and other bioerosion marks [147,148].
In Perachora Peninsula, four uplifted coastlines exist (Figure 8a). The lowest, youngest, and best preserved has an inner edge at altitudes varying from 35 to 80 m, which is correlated with OIS 5e (125 ka) [29]. The second terrace is located at an altitude of 80–120 m, which is correlated with stage 7e (240 ka) [29]. The third one is located at an altitude of 120–245 m, which is correlated with stage 9c (330 ka) [29]. Maroukian et al. [145] identified another older marine terrace in Perachora Peninsula, at elevations of 280–360 m, with an age of 400 ka (OIS 11c).
Robertson et al. [55] studied the sea cliffs, palaeo-sea cliffs and wave-cut platforms of Perachora Peninsula and conducted several measures and datings. They mainly used 230U/230Th dating of corals as well as 36Cl. They found uplifted marine terraces at elevations of 6 to 99 m in Cape Heraion. Their findings, together with their observations of uplifted notches, limestone blocks bearing Lithophaga holes, etc., suggest indeed that these terraces were a result of wave erosion and subsequently uplifted through the action of normal faults. One of the terraces, at 44 m elevation, was dated at 136–137 ka, corresponding to the MIS 5e stage (125 ka-highstand) [55]. Regarding bioerosion, they found rates between 0.1 and 6 mm/ka, which gave ages that agree with the above date (125 ka-highstand) for this terrace [55].
Maroukian et al. [145] conducted a geomorphological survey in Perachora Peninsula in order to assess the impact of neotectonic movements on the relief of the drainage basins and reconstruct the area’s palaeogeography. They mainly focused on knick points, gorges, planation surfaces, alluvial fans, talus cones and slope changes. Upon mapping the geomorphological features of the peninsula’s two drainage basins, Maroukian et al. [145] concluded that the peninsula has been affected by both local and regional tectonics and, to a lesser extent, by eustasy. Locations of knickpoints and gorges in the basin of Perachora were investigated in relation to uplifted coastlines corresponding to Oxygen Isotope Stages 5e, 7e and 9c (125, 240 and 330 ka, respectively [145]. Maroukian et al. [145] found two depositional surfaces, which they linked to the sea-level highstand of OIS 11c (400 ka) and the 7e highstand (240 ka). The apex of the lowest alluvial cone was linked to the most recent Tyrrhenian sea-level stage (5e) [145]. Perachora basin has been affected by both Loutraki (south-dipping) and East Xylokastro (north-dipping) normal faults [55]. The Xylokastro fault has caused an uplift of the northern part of the basin [145].
Pirazzoli et al. [97] conducted several measurements in the tidal notches of the archaeological site of Heraion, Perachora Peninsula, including erosional landforms (e.g., tidal notches and shell Lithophaga holes), in situ bioconstructions from vermetids and barnacles and beachrocks (Figure 8b). According to their findings, in the archaeological area of Heraion, raised tidal notches are present at altitudes of +3.2 m (4157–3681 B.C.), 2.6 m (2106–1588 B.C.), 1.7 m and +1.1 m (455–989 A.D.). These researchers also found Lithophaga holes below the level of +3.1 m, but their clearest appearance was above +2 m, where shell remnants were also found. Pirazzoli et al. [97] attributed this to a very rapid, possibly co-seismic uplift event, which led to the uppermost notches being raised to a level where the impact of waves is non-existent and thus protected by further bioerosion [130]. The +1.1 m shoreline reflects the most recent uplift event, which was also rapid [97]. The uplift that took place between 455 and 989 A.D. was the last major uplift event, even though the area may have been slightly uplifted in 1981 [97]. Pirazzoli et al. [97] found no evidence of subsidence (such as submerged notches) for the area of Heraion. In the area of Mylokopi (see Figure 1 for location), they also found Lithophaga holes. A shell at +3.0 m, corresponding to the uppermost notch of the area, was dated 4336–4808 B.C. [97]. They dated a vermetid shell at 0.8 m, which reflected the sea-level prior to the recent uplift, at 663–1036 A.D. In conclusion, the uppermost notch was raised after 4157 B.C. in Heraion and after 2859 B.C. in Mylokopi. There seems to have been a period of high seismicity between the 4th and the 6th century B.C. not only in this area but also in other areas such as the southern Hellenic arc, Turkey, Cyprus and the Lebanon [97,175,176].
Mitzopoulos [177] describes of a shoreline of the last interglacial (Tyrrhenian) stage at +28 m in the area of Heraion with an average uplift rate of either 0.2 mm/a since 125 ka, if it corresponds to the OIS stage 5e, or 0.3 mm/a since 100 ka if it corresponds to the OIS stage 5c [97]. Pirazzoli et al. [97] mention that such rates would have only caused an uplift of 1.3 to 2 m since 6400 BP, therefore concluding that during the Holocene, the uplift rate accelerated. Alternatively, it remained stable at around 0.5 mm/a during the last 81 ka, but this would only be the case if the shoreline mentioned by Mitzopoulos [177] belongs to the 5a stage, but this still does not seem to be the case [97]. Uplift rates seem to have been higher during the Holocene than during the Pleistocene [97].
Vita-Finzi [139] has stated that the uplift of Perachora Peninsula was uniform. On the other hand, according to Kershaw and Guo [178], the notches of Lake Vouliagmeni, Heraion and Mylokopi (Figure 1) do not share the same morphological characteristics (profiles), and this is owed to differentiations in bedrock resistance and wave activity, but differential uplift has also had an impact on the notches’ profile both regarding uplift rates and uplift characteristics [178].
The uplift events in Perachora Peninsula were, according to Pirazzoli et al. [97], owed to seismic movements. Specifically, the uplift at Heraion was caused by three earthquakes, namely in 4157 B.C., 2859 B.C. and sometime between 455 and 989 A.D. In Mylokopi, the uplift was caused by two seismic events, namely 2859 B.C. and sometime between 663 and 1036 A.D. [97]. Stewart and Vita-Finzi [91] calibrated their data and found that the uplift was uniform in the two areas and mainly (but not solely) aseismic.
According to Turner et al. [144], the rates of uplift near Heraion reach at least 0.5 mm/a and decrease to 0.22 mm/a toward the southeast based on uplifted notches. The marine terraces of Heraion that were dated to the MIS 5e show an uplift rate of 0.18 mm/a, contrary to those dated at MIS 7e, whose rate is faster, at 0.25 mm/a [144]. The average uplift rate for the south coast of Perachora peninsula was found to be 0.31 mm/a [144].
To the east of Perachora, Jackson et al. [13] suggested that the coast from Schinos to Alepochori is characterized by subsidence as well as along the coast of Psatha (Figure 1; north from Alepochori). The intermediate coast (between Alepochori and Psatha) undergoes uplift. Through the study of beachrocks, Karkani et al. [150] suggest a rate of tectonic uplift of ~0.26 mm/a on average, since 4160 ± 320 years BP. Leeder et al. [179], based on an accumulation of raised beach gravels, considering a sea level at about −10 ± 4 m at MIS 5a at ~83,000 years BP, and they estimate a mean uplift of 0.24 ± 0.05 mm/a.

4.2. Northern Gulf of Corinth–Gulf of Alkyonides

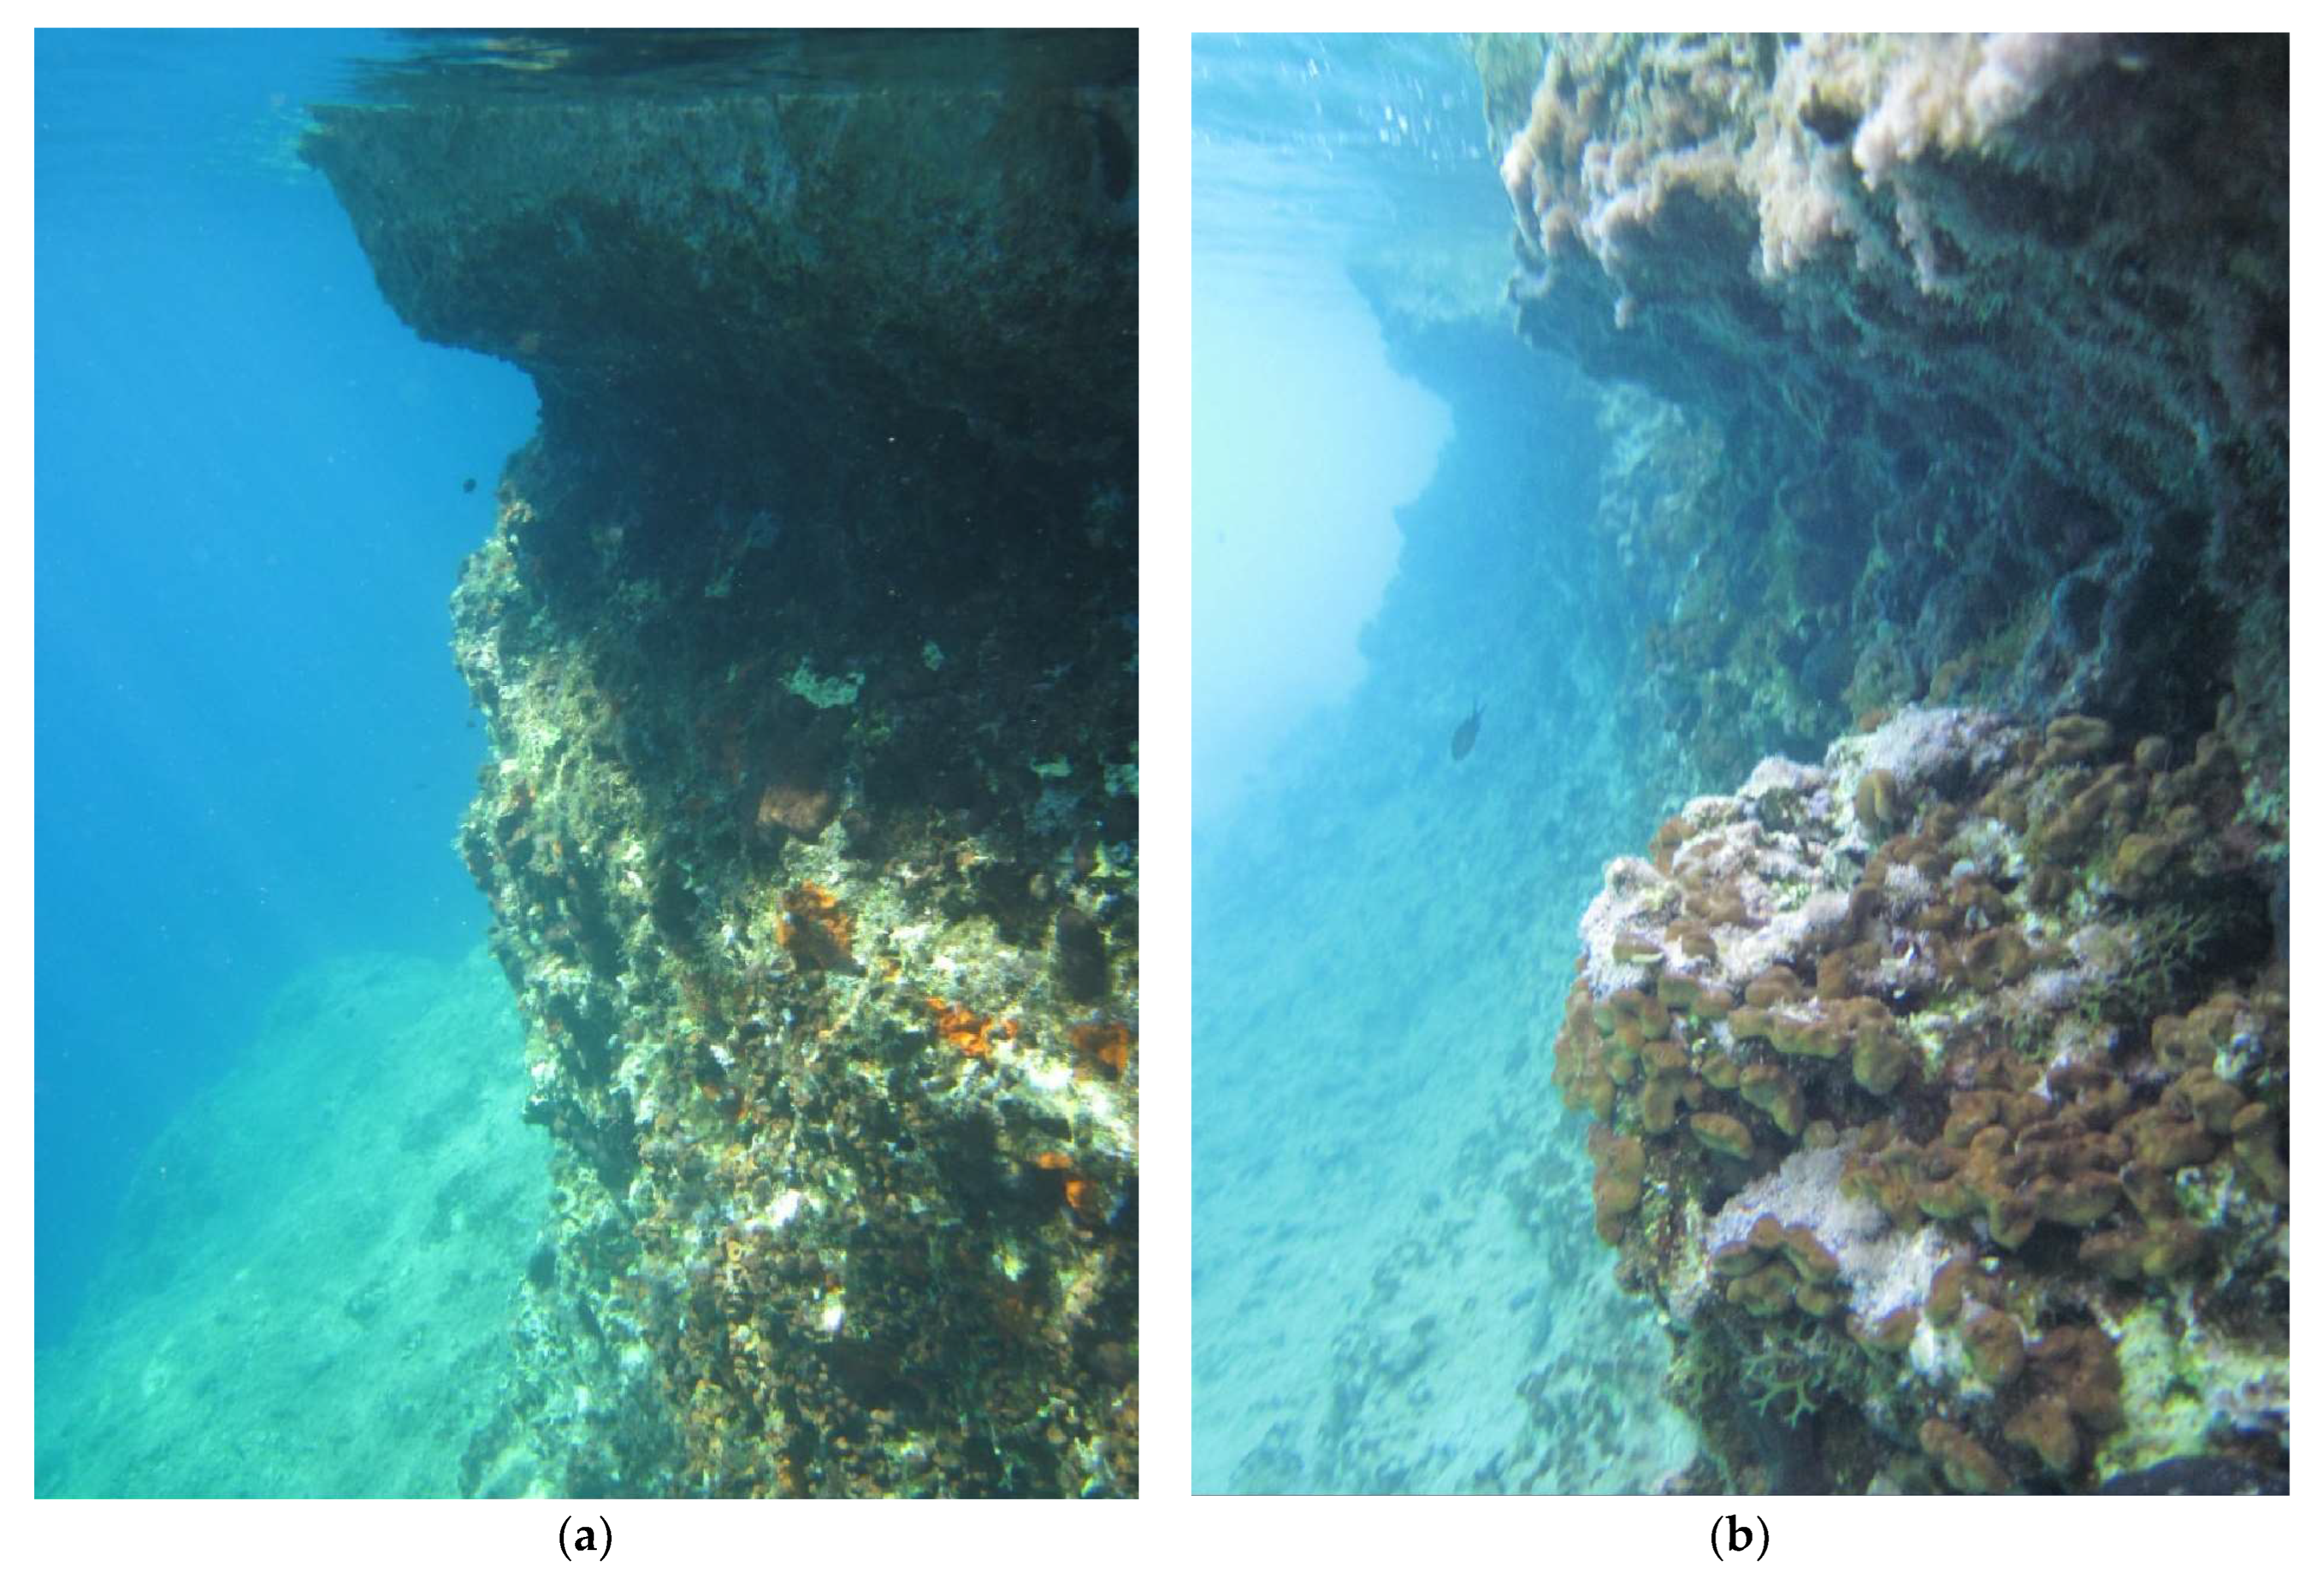
Evelpidou et al. [142] studied the submerged tidal notches of the northern Corinthian Gulf. Vertex depths range from 20 to 120 cm below sea level except for two sites, where depths of more than 200 cm have been measured. As they found no tidal notches in the present-day sea level, they concluded that the sea reached this level only recently, whereas the most recent subsidence event was co-seismic and led to a vertical displacement of approximately 0.5 m. Evelpidou et al. [142] emphasize that the subsidence was not uniform along their study area and probably not owed to the same earthquake across all the coast. Yet, some of the studied notches were characterized by a significant vertical development, which could indicate that in these cases, the relative sea-level rise was gradual [142] (Figure 9). During their research, Evelpidou et al. [142] found no evidence of uplift in the northern Corinthian Gulf.
Emmanouilidis et al. [180] conducted a survey in the area of Domvraina Gulf (Gulf of Alkyonides) using various methods. They performed boreholes in the Alyki lagoon, which were later analyzed regarding their sedimentological and mineralogical characteristics. At 1600 B.C., they found evidence of tectonic uplift of the lagoon’s beachrock barrier, which resulted in the closing of the lagoon and its separation from the sea.

5. Discussion

Based on the above review on the relative sea-level changes in the Gulf of Corinth during the Holocene, one can observe that the gulf has followed a mixed pattern regarding the rates of tectonic movements, yet an overall pattern (trend) of vertical motions seems clear. In active rifting settings such as the Gulf of Corinth, one would expect different rates in different locations at the same time due to the partitioning of crustal extension accommodated by normal faulting both onshore and offshore (cf. [6,8,15,18,39,43,86,142]), while the variation in late Quaternary fault activity across the strike of the rift controls the rift flank topography [163]. The along-strike variation may be reflected in the distribution of uplift rates because footwall uplift is a result of seismic motion along normal faults [9,15,26,34,36,133,181]. Therefore, by studying the distribution of footwall uplift along an active rift, we may infer the pattern of a symmetric or asymmetric localization of strain along the active faults. In the Gulf of Corinth, the GNSS data have established that horizontal crustal extension is oriented roughly N–S, and it peaks at 11–13 mm per year near Aigion [16,18,19,21] with decreasing values eastwards. We discuss below this set of observations in relation to uplift rates along the south coast of the gulf (recorded by sea-level indicators and GNSS data).
Regarding vertical tectonic motions in Corinth, our combined dataset suggests that the gulf can be divided into two sections: the northern part of the basin that is generally undergoing tectonic subsidence and the southern part that is undergoing uplift (Appendix B, Table A1; Figure 4, Figure 10 and Figure 11). On the northern part, several geomorphic indexes of tectonic subsidence have been found, but no uplift indexes have been identified [86,142].
On the contrary, the northern coast of the Peloponnese, that is the southern section of the gulf, shows a general tendency for tectonic uplift. However, we note that only a few sites indicate a “pure”—that is, continuous—uplift during the Holocene. A few sites have undergone repetitive phases of subsidence and uplift (cf. Diolkos [129]; Lechaion [157]; Helike fault system (Figure 4; [149])). This localized behavior may be due to the competition of motions due to seismic slip along neighboring normal faults, as it depends on the location of the coastal site with respect to the displaced block (i.e., footwall vs. hanging wall location). This investigation is interesting but beyond the scope of this regional review. Therefore, based on geomorphological and archaeological indexes, as well as carbon and OSL dating, we can conclude that the long-term tendency for the south coast is uplift ([139,140,151]; Appendix B, Table A1 and Figure 10). Most authors have suggested an average uplift rate of 1.5 mm/a, yet this is not a firm rate. From east to west, the uplift rate shows significant divergence (Figure 10). The eastern part exhibits rates rarely exceeding 0.2 to 0.5 mm/a. In particular, mean uplift rates have been calculated at 0.4 mm/a for Corinth town and the Isthmus [153], 0.3 mm/a for Alepochori [153], and 0.2 to 0.5 mm/a in Heraion [97,144].
The central–western part of the coastline of the northern Peloponnese shows the highest uplift rates, fluctuating between 0.8 and 3.11 mm/a (Figure 10). In the area of Xylokastron (Figure 1), the rates are, 0.5 to 1.6 mm/a [15,154,172,173], which are followed by the Helike and Aigion fault systems (1–1.3 mm/a; [151]). The highest uplift rates have been found in the area of Aigeira–Diakofto–Platanos [47,91,131,166]. We did not include the +23.2 mm/y site of Stewart and Vita-Finzi [91] near Aigeira on the map of Figure 10, as we consider it as an outlier (an order of magnitude greater than that of neighboring sites). Further west, i.e., the northwestern part of the Peloponnese, shows intermediate uplift rates, ranging from 0.7 to 1.8 mm/a (Figure 10; [45,46,174]).
In addition, the most recent geodetic data [19] indicate that all seven (7) GNSS stations on the northern coast are subsiding with rates exceeding 1 mm/a (Figure 11; stations ITEA, ITEU, GALA, PSAR, TRIZ, EYPA, XILI). Along the south coast stations, KORI, KRYO, VALI, AIGI, AIGU and LAMB show uplift with rates 0.5 ≤ Vup ≤ 3.5 mm/a, which is comparable to the geological data. Stations KRYO and KORI are also reported with positive vertical velocities by Serpeloni et al. [60] (0.77 ± 0.77 and 0.47 ± 0.92 mm/a, respectively) which also indicate an upwards, yet small, motion of the crust. Two stations (KOUN and PSAT; Figure 11) indicate subsidence, but these trends are attributed to local effects such as the compaction of sandy soils [19]. Station KIAT also indicates subsidence; however, this station is located next to a pier at the Kiato harbor where local effects are also possible. We note that the Kiato port also appears subsiding at the European Ground Motion Service dataset (EGMS [73]; Layer Ortho-Level 3, period 2015–2021; Figure 4). Uplift rates are higher in the western part of the gulf, near the city of Aigion where station AIGI moves with a rate of +3.5 ± 1.1 mm/a (Figure 10).
The spatial correlation between high uplift rates and amount (rate) of extension is the highest near the city of Aigion (up to Akrata–Derveni (Figure 1)). This pattern is followed by both sea-level and GNSS data (Figure 10 and Figure 11) with comparable rates. This key observation points to an asymmetric tectonic control on the Upper Pleistocene–Holocene configuration of uplift along the rift axis and demonstrates that the highest tectonic uplift (~3 mm/a) is found where the present-day rate of the crustal extension is the highest, i.e., around Aigion.
The joint consideration of the geomorphological (long-term) and geodetic (short-term) data is a key advance for this area of central Greece that is characterized by fast rates of N–S crustal extension and strong earthquakes that rupture normal faults. We suggest that these data fit the model of an active half-graben structure (120 km long) where the hanging wall (northern coast) subsides while the footwall (southern coast) is undergoing uplift.

6. Conclusions

In the Gulf of Corinth, several geomorphological, geodetic, archaeological and biological features testify to the intense tectonic activity of the area. An overview of published sea-level indicators, with a focus on tidal notches and biological features, clearly reveals that the southern part of the Corinth Gulf has undergone a tectonic uplift over the last thousand years, whereas the northern part has undergone a tectonic subsidence. The evidence suggests that the magnitude of RSL fall in the south Corinth Gulf is larger than that of RSL rise in the north. The highest uplift rates (~3.1 mm/a) are found in the western part of the Corinthian Gulf’s southern margin, i.e., the west–central part of the northern Peloponnese, that is in the area of Aigion–Aigeira (Figure 10). The northwestern Peloponnese is characterized by lesser uplift rates, whereas the northeastern Peloponnese is characterized by even smaller uplift rates, even though relatively higher uplift rates can be locally found. The geodetic rates of land motion are comparable to the geological ones. The joint dataset indicates an asymmetry in strain localization inside the Gulf of Corinth.
It is important to mention that as the Corinth Gulf is rich in sea-level indicators, a very large proportion of them, including sites of particular interest that could potentially offer many pieces of information, are undated up to the present day. In future work, the undated sea-level indicators from the Corinth Gulf need to be dated, so that they confirm our results or reconsider them and contribute to a better understanding of past sea-level changes in the Corinth Gulf and other areas of similar tectonic regime.
As new data (sea-level, GNSS, InSAR, etc.) keep on appearing, this review will be updated in the future to include more dense observations on the ground motion patterns (uplift vs. subsidence). The gap in geodetic data that exists on the eastern gulf (Figure 11) is one of the issues that needs to be looked at. Another point is the need for more geomorphological observations along the northern coast of the gulf opposite Aigion (Figure 4). The accumulation of additional data in the Gulf of Corinth will contribute toward testing models for rift development and normal fault growth.

Author Contributions

Conceptualization, N.E. and A.K.; methodology, A.K., N.E., A.G., E.S. and G.S.; software, A.K. and E.S.; validation, N.E., E.S., A.G. and A.K.; investigation, E.S., A.G. and N.E.; data curation, A.K., G.S. and E.S.; writing—original draft preparation, E.S, A.G., N.E. and A.K.; writing—review and editing, E.S., G.S., A.K. and N.E.; visualization, A.K., G.S., A.G. and E.S.; supervision, N.E. and A.G.; project administration, N.E. All authors have read and agreed to the published version of the manuscript.

Funding

This research received no external funding.

Data Availability Statement

The data created in this research are included as a database in form of a webmap, in the following address: https://evelpidou.maps.arcgis.com/apps/instant/sidebar/index.html?appid=fa9556300b8c433492e7f7e2784eb4f0 (published in 20 September 2023). Seismological data comprise the open-source National Observatory of Athens catalogue, period 2008–2023 (last accessed on 16 October 2023).

Acknowledgments

We thank three anonymous reviewers for comments and suggestions. Raw GNSS data were provided by CRL, NOANET, HxGN Smartnet, and Uranus networks. Seismicity data can be accessed at https://bbnet.gein.noa.gr/HL/databases/database (accessed on 16 October 2023). The maps of Figure 2 and Figure 11 were created using the open-source Generic Mapping Tools (GMT) software 5.4.0 (https://www.generic-mapping-tools.org/).

Conflicts of Interest

The authors declare no conflict of interest.

Appendix A

This appendix includes a map with the earthquake activity in the region (with magnitude M ≥ 4.0 and focal depth 0–20 km in red; 20–50 km in brown and 50+ km in blue). Green stars indicate the three (3) epicenters of events with M ≥ 5.0. The seismicity data were downloaded from the online NOA catalogue (www.gein.noa.gr (accessed on 16 October 2023)). Light brown lines are active faults from the NOAFAULTs database [182].
Figure A1. Map of the Gulf of Corinth showing the 2008–2023 earthquake activity in the region (with magnitude M ≥ 4.0 and focal depth 0–20 km in red; 20–50 km in brown and 50+ km in blue). Green stars indicate the three (3) epicenters of events with M ≥ 5.0.
Geosciences 13 00329 g0a1

Appendix B

This appendix shows the dated sea-level indicators indicating uplift as well as the calculated tectonic rates.
Table A1. The dated sea-level indicators indicating uplift as well as the calculated tectonic rates.
LocalityRegionSea Level Indicator TypeRate (mm/y)Reference
AegiraSouth coastBiological+23.28[91]
AegiraSouth coastBiological+1.57[91]
AegiraSouth coastBiological+1.38[91]
AkrataSouth coastGeomorphological+0.62[140]
AkrataSouth coastGeomorphological+0.67[140]
AkrataSouth coastGeomorphological+0.64[140]
AkrataSouth coastGeomorphological+0.63[140]
AkrataSouth coastGeomorphological+0.60[140]
AkrataSouth coastGeomorphological+0.75[140]
AkrataSouth coastGeomorphological+0.82[140]
AkrataSouth coastGeomorphological+0.72[140]
DiakoftoSouth coastGeomorphological+3.12[143]
DiakoftoSouth coastGeomorphological+2.26[143]
DiakoftoSouth coastBiological+3.12[91]
DiakoftoSouth coastBiological+2.40[91]
DiolkosSouth coastGeomorphological+0.10[129]
DiolkosSouth coastGeomorphological+0.04[129]
FlampouronPerachora PeninsulaGeomorphological+0.29[144]
FlampouronPerachora PeninsulaGeomorphological+0.11[144]
FlampouronPerachora PeninsulaGeomorphological+0.15[144]
FlampouronPerachora PeninsulaGeomorphological+0.36[144]
HeraeonPerachora PeninsulaGeomorphological+0.54[144]
HeraeonPerachora PeninsulaGeomorphological+0.12[144]
HeraeonPerachora PeninsulaGeomorphological+0.46[29]
HeraeonPerachora PeninsulaGeomorphological+0.55[29]
HeraeonPerachora PeninsulaGeomorphological+0.42[29]
HeraeonPerachora PeninsulaGeomorphological+0.55[29]
HeraeonPerachora PeninsulaGeomorphological+0.46[29]
HeraeonPerachora PeninsulaGeomorphological+0.80[145]
HeraeonPerachora PeninsulaGeomorphological+0.25–0.52[39]
HeraeonPerachora PeninsulaGeomorphological+0.49[55]
HeraeonPerachora PeninsulaGeomorphological+0.57[55]
HeraeonPerachora PeninsulaGeomorphological+0.39[55]
HeraeonPerachora PeninsulaGeomorphological+0.38[55]
HeraeonPerachora PeninsulaGeomorphological+0.26[55]
HeraionPerachora PeninsulaGeomorphological+0.55[97]
HeraionPerachora PeninsulaGeomorphological+0.68[97]
HeraionPerachora PeninsulaGeomorphological+0.90[97]
LambiriSouth coastGeomorphological+1.60[146]
LechaionSouth coastBiological+0.68[147]
LechaionSouth coastBiological+0.38[148]
LechaionSouth coastBiological+0.42[148]
LechaionSouth coastBiological+0.36[148]
LechaionSouth coastBiological+0.41[148]
Mavra LithariaSouth coastBiological+1.28[47]
Mavra LithariaSouth coastBiological+1.47[47]
Mavra LithariaSouth coastBiological+1.47[131]
Mavra LithariaSouth coastBiological+1.37[149]
MylokopiPerachora PeninsulaGeomorphological+0.77[97]
MylokopiPerachora PeninsulaGeomorphological+0.73[97]
Platanos beachSouth coastBiological+1.08[91]
Platanos beachSouth coastBiological+2.18[91]
Platanos beachSouth coastBiological+1.75[91]
Platanos beachSouth coastBiological+2.32[91]
Platanos beachSouth coastBiological+1.26[91]
Platanos beachSouth coastBiological+0.44[149]
PsathaAlkyonides GulfGeomorphological+0.29[150]
PsathaAlkyonides GulfGeomorphological+0.23[150]
PsathopirgosSouth coastGeomorphological+0.70[46]
VouliagmeniPerachora PeninsulaBiological+0.84[139]
VouliagmeniPerachora PeninsulaBiological+0.61[139]
VouliagmeniPerachora PeninsulaBiological+0.79[139]

References

  1. Azor, A.; Keller, E.A.; Yeats, R.S. Geomorphic Indicators of Active Fold Growth: South Mountain-Oak Ridge Anticline, Ventura Basin, Southern California. Bull. Geol. Soc. Am. 2002, 114, 745–753. [Google Scholar] [CrossRef]
  2. King, G.; Sturdy, D.; Whitney, J. The Landscape Geometry and Active Tectonics of Northwest Greece. Geol. Soc. Am. Bull. 1993, 105, 137–161. [Google Scholar] [CrossRef]
  3. Burbank, D.W.; Anderson, R.S. Tectonic Geomorphology. Dep. Geosci. Pa. State Univ. 2001, 140, 284–291. [Google Scholar]
  4. Doutsos, T.; Piper, D.J.W. Listric Faulting, Sedimentation, and Morphological Evolution of the Quaternary Eastern Corinth Rift, Greece: First Stages of Continental Rifting. Bull. Geol. Soc. Am. 1990, 102, 812–829. [Google Scholar] [CrossRef]
  5. Moretti, I.; Sakellariou, D.; Lykousis, V.; Micarelli, L. The Gulf of Corinth: An Active Half Graben? J. Geodyn. 2003, 36, 323–340. [Google Scholar] [CrossRef]
  6. Gaki-papanastassiou, K.; Papanastassiou, D.; Maroukian, H. Recent Uplift Rates at Perachora Peninsula, East Gulf of Corinth, Greece, Based on Geomorphological—Archaeological Evidence and Radiocarbon Dates. Hell. J. Geosci. 2007, 42, 45–56. [Google Scholar]
  7. Charalampakis, M.; Lykousis, V.; Sakellariou, D.; Papatheodorou, G.; Ferentinos, G. The Tectono-Sedimentary Evolution of the Lechaion Gulf, the South Eastern Branch of the Corinth Graben, Greece. Mar. Geol. 2014, 351, 58–75. [Google Scholar] [CrossRef]
  8. Mesimeri, M.; Ganas, A.; Pankow, K.L. Multisegment Ruptures and Vp/Vs Variations during the 2020–2021 Seismic Crisis in Western Corinth Gulf, Greece. Geophys. J. Int. 2022, 230, 334–348. [Google Scholar] [CrossRef]
  9. Ganas, A.; Chousianitis, K.; Batsi, E.; Kolligri, M.; Agalos, A.; Chouliaras, G.; Makropoulos, K. The January 2010 Efpalion Earthquakes (Gulf of Corinth, Central Greece): Earthquake Interactions and Blind Normal Faulting. J. Seism. 2013, 17, 465–484. [Google Scholar] [CrossRef]
  10. Taylor, B.; Weiss, J.R.; Goodliffe, A.M.; Sachpazi, M.; Laigle, M.; Hirn, A. The Structures, Stratigraphy and Evolution of the Gulf of Corinth Rift, Greece. Geophys. J. Int. 2011, 185, 1189–1219. [Google Scholar] [CrossRef]
  11. Brooks, M.; Ferentinos, G. Tectonics and Sedimentation in the Gulf of Corinth and the Zakynthos and Kefallinia Channels, Western Greece. Tectonophysics 1984, 101, 25–54. [Google Scholar] [CrossRef]
  12. McKenzie, D. Active Tectonics of the Alpine-Himalayan Belt: The Aegean Sea and Surrounding Regions. Geophys. J. R. Astron. Soc. 1978, 55, 217–254. [Google Scholar] [CrossRef]
  13. Jackson, J.; Gagnepain, G.; Houseman, G.; King, G.C.P.; Papadimitriou, P.; Soufleris, C.; Virieux, J. Seismicity, Normal Faulting, and the Geomorphological Development of the Gulf of Corinth (Greece): The Corinth Earthquakes of February and March 1981. Earth Planet. Sci. Lett. 1982, 57, 377–397. [Google Scholar] [CrossRef]
  14. Tselentis, G.A.; Makropoulos, K.C. Rates of Crustal Deformation in the Gulf of Corinth (Central Greece) as Determined from Seismicity. Tectonophysics 1986, 124, 55–66. [Google Scholar] [CrossRef]
  15. Armijo, R.; Meyer, B.; King, G.C.P.; Rigo, A.; Papanastassiou, D. Quaternary Evolution of the Corinth Rift and Its Implications for the Late Cenozoic Evolution of the Aegean. Geophys. J. Int. 1996, 126, 11–53. [Google Scholar] [CrossRef]
  16. Clarke, P.J.; Davies, R.R.; England, P.C.; Parsons, B.E.; Billiris, H.; Paradissis, D.; Veis, G.; Denys, P.H.; Cross, P.A.; Ashkenazi, V.; et al. Geodetic Estimate of Seismic Hazard in the Gulf of Korinthos. Geophys. Res. Lett. 1997, 24, 1303–1306. [Google Scholar] [CrossRef]
  17. Clarke, P.J.; Davies, R.R.; England, P.C.; Parsons, B.; Billiris, H.; Paradissis, D.; Veis, G.; Cross, P.A.; Denys, P.H.; Ashkenazi, V.; et al. Crustal Strain in Greece from Repeated GPS Measurements in the Interval 1989-1997. Geophys. J. Int. 1998, 135, 195–214. [Google Scholar] [CrossRef]
  18. Briole, P.; Rigo, A.; Lyon-Caen, H.; Ruegg, J.C.; Papazissi, K.; Mitsakaki, C.; Balodimou, A.; Veis, G.; Hatzfeld, D.; Deschamps, A. Active Deformation of the Corinth Rift, Greece: Results from Repeated Global Positioning System Surveys between 1990 and 1995. J. Geophys. Res. 2000, 105, 25605–25625. [Google Scholar] [CrossRef]
  19. Briole, P.; Ganas, A.; Elias, P.; Dimitrov, D. The GPS Velocity Field of the Aegean. New Observations, Contribution of the Earthquakes, Crustal Blocks Model. Geophys. J. Int. 2021, 226, 468–492. [Google Scholar] [CrossRef]
  20. McNeill, L.C.; Shillington, D.J.; Carter, G.D.O.; Everest, J.D.; Gawthorpe, R.L.; Miller, C.; Phillips, M.P.; Collier, R.E.L.; Cvetkoska, A.; De Gelder, G.; et al. High-Resolution Record Reveals Climate-Driven Environmental and Sedimentary Changes in an Active Rift. Sci. Rep. 2019, 9, 3116. [Google Scholar] [CrossRef]
  21. Avallone, A.; Briole, P.; Agatza-Balodimou, A.M.; Billiris, H.; Charade, O.; Mitsakaki, C.; Nercessian, A.; Papazissi, K.; Paradissis, D.; Veis, G. Analyse de Onze Années de Mesures de Deformations Collectées Par GPS Dans La Zone Du Laboratoire Du Rift de Corinthe. Comptes Rendus Geosci. 2004, 336, 301–311. [Google Scholar] [CrossRef]
  22. Davies, R.; England, P.; Parsons, B.; Billiris, H.; Paradissis, D.; Veis, G. Geodetic Strain of Greece in the Interval 1892–1992. Distribution 1997, 102, 24571–24588. [Google Scholar] [CrossRef]
  23. Roberts, S.; Jackson, J. Active Normal Fault in Central Greece: An Overview. In The Geometry of Normal Faults; Special Publications; Roberts, A.M., Yielding, G., Freeman, B., Eds.; Geological Society of London: London, UK, 1991; Volume 56, pp. 125–142. [Google Scholar]
  24. Roberts, G.P. Noncharacteristic Normal Faulting Surface Ruptures from the Gulf of Corinth, Greece. J. Geophys. Res. 1996, 101, 25255–25267. [Google Scholar] [CrossRef]
  25. Roberts, G.P. Variation in Fault-Slip Directions along Active and Segmented Normal Fault Systems. J. Struct. Geol. 1996, 18, 835–845. [Google Scholar] [CrossRef]
  26. Roberts, G.P.; Koukouvelas, I. Structural and Seismological Segmentation of the Gulf of Corinth Fault System: Implications for Models of Fault Growth. Ann. Geophy. 1996, 39, 619–646. [Google Scholar] [CrossRef]
  27. Koukouvelas, I.K.; Asimakopoulos, M.; Doutsos, T.T. Fractal Characteristics of Active Normal Faults: An Example of the Eastern Gulf of Corinth, Greece. Tectonophysics 1999, 308, 263–274. [Google Scholar] [CrossRef]
  28. Micarelli, L.; Moretti, I.; Daniel, J.M. Structural Properties of Rift-Related Normal Faults: The Case Study of the Gulf of Corinth, Greece. J. Geodyn. 2003, 36, 275–303. [Google Scholar] [CrossRef]
  29. Morewood, N.C.; Roberts, G.P. Lateral Propagation of the Surface Trace of the South Alkyonides Normal Fault Segment, Central Greece: Its Impact on Models of Fault Growth and Displacement-Length Relationships. J. Struct. Geol. 1999, 21, 635–652. [Google Scholar] [CrossRef]
  30. Morewood, N.C.; Roberts, G.P. Geometry, Kinematics and Rates of Deformation in a Normal Fault Segment Boundary, Central Greece. Geophys. Res. Lett. 1997, 24, 3081–3084. [Google Scholar] [CrossRef]
  31. Pavlides, S.B.; Koukouvelas, I.K.; Kokkalas, S.; Stamatopoulos, L.; Keramydas, D.; Tsodoulos, I. Late Holocene Evolution of the East Eliki Fault, Gulf of Corinth (Central Greece). Quat. Int. 2004, 115–116, 139–154. [Google Scholar] [CrossRef]
  32. Koukouvelas, I.K.; Doutsos, T.T. Implications of Structural Segmentation during Earthquakes: The 1995 Egion Earthquake, Gulf of Corinth, Greece. J. Struct. Geol. 1996, 18, 1381–1388. [Google Scholar] [CrossRef]
  33. Ori, G.G. Geologic History of the Extensional Basin of the Gulf of Corinth (?Miocene-Pleistocene), Greece. Geology 1989, 17, 918–921. [Google Scholar] [CrossRef]
  34. Doutsos, T.; Poulimenos, G. Geometry and Kinematics of Active Faults and Their Seismotectonic Significance in the Western Corinth-Patras Rift (Greece). J. Struct. Geol. 1992, 14, 689–699. [Google Scholar] [CrossRef]
  35. Sorel, D. A Pleistocene and Still-Active Detachment Fault and the Origin of the Corinth-Patras Rift, Greece. Geology 2000, 28, 83–86. [Google Scholar] [CrossRef]
  36. Goldsworthy, M.; Jackson, J. Migration of Activity within Normal Fault Systems: Examples from the Quaternary of Mainland Greece. J. Struct. Geol. 2001, 23, 489–506. [Google Scholar] [CrossRef]
  37. Rohais, S.; Joannin, S.; Colin, J.P.; Suc, J.P.; Guillocheau, F.; Eschard, R. Age and Environmental Evolution of the Syn-Rift Fill of the Southern Coast of the Gulf of Corinth (Akrata-Derveni Region, Greece). BSGF Earth Sci. Bull. 2007, 178, 231–243. [Google Scholar] [CrossRef]
  38. Rohais, S.; Eschard, R.; Ford, M.; Guillocheau, F.; Moretti, I. Stratigraphic Architecture of the Plio-Pleistocene Infill of the Corinth Rift: Implications for Its Structural Evolution. Tectonophysics 2007, 440, 5–28. [Google Scholar] [CrossRef]
  39. Roberts, G.P.; Houghton, S.L.; Underwood, C.; Papanikolaou, I.; Cowie, P.A.; Van Calsteren, P.; Wigley, T.; Cooper, F.J.; McArthur, J.M. Localization of Quaternary Slip Rates in an Active Rift in 105 Years: An Example from Central Greece Constrained by 234U–230Th Coral Dates from Uplifted Paleoshorelines. J. Geophys. Res. 2009, 114, B10406. [Google Scholar] [CrossRef]
  40. Jolivet, L.; Brun, J.P.; Gautier, P.; Lallemant, S.; Patriat, M. 3D-Kinematics of Extension in the Aegean Region from the Early Miocene to the Present, Insights from the Ductile Crust. Bull. Soc. Geol. Fr. 1994, 165, 195–209. [Google Scholar]
  41. Doutsos, T.; Kontopoulos, N.; Poulimenos, G. The Corinth-Patras Rift as the Initial Stage of Continental Fragmentation behind an Active Island Arc (Greece). Basin Res. 1988, 1, 177–190. [Google Scholar] [CrossRef]
  42. Jolivet, L. A Comparison of Geodetic and Finite Strain Pattern in the Aegean, Geodynamic Implications. Earth Planet. Sci. Lett. 2001, 187, 95–104. [Google Scholar] [CrossRef]
  43. Sachpazi, M.; Galvé, A.; Laigle, M.; Hirn, A.; Sokos, E.; Serpetsidaki, A.; Marthelot, J.M.; Pi Alperin, J.M.; Zelt, B.; Taylor, B. Moho Topography under Central Greece and Its Compensation by Pn Time-Terms for the Accurate Location of Hypocenters: The Example of the Gulf of Corinth 1995 Aigion Earthquake. Tectonophysics 2007, 440, 53–65. [Google Scholar] [CrossRef]
  44. Bernard, P.; Briole, P.; Meyer, B.; Lyon-Caen, H.; Gomez, J.M.; Tiberi, C.; Berge, C.; Cattin, R.; Hatzfeld, D.; Lachet, C.; et al. The Ms = 6.2, June 15, 1995 Aigion Earthquake (Greece): Evidence for Low Angle Normal Faulting in the Corinth Rift. J. Seismol. 1997, 1, 131–150. [Google Scholar] [CrossRef]
  45. Palyvos, N.; Sorel, D.; Lemeille, F.; Mancini, M.; Pantosti, D.; Julia, R.; Triantaphyllou, M.; De Martini, P.M. Review and New Data on Uplift Rates at the W Termination of the Corinth Rift and the Ne Rion Graben Area (Achaia, NW Peloponnesos). Bull. Geol. Soc. Greece 2007, 40, 412–424. [Google Scholar] [CrossRef]
  46. Houghton, S.L.; Roberts, G.P.; Papanikolaou, I.D.; Mcarthur, J.M.; Gilmour, M.A. New 234 U–230 Th Coral Dates from the Western Gulf of Corinth: Implications for Extensional Tectonics. Geophys. Res. Lett. 2003, 30, 13/1–13/4. [Google Scholar] [CrossRef]
  47. Pirazzoli, P.A.; Stiros, S.C.; Fontugne, M.; Arnold, M. Holocene and Quaternary Uplift in the Central Part of the Southern Coast of the Corinth Gulf (Greece). Mar. Geol. 2004, 212, 35–44. [Google Scholar] [CrossRef]
  48. Zelilidis, A. Drainage Evolution in a Rifted Basin, Corinth Graben, Greece. Geomorphology 2000, 35, 69–85. [Google Scholar] [CrossRef]
  49. Doutsos, T.; Kontopoulos, N.; Frydas, D. Neotectonic Evolution of Northwestern-Continental Greece. Geol. Rundsch. 1987, 76, 433–450. [Google Scholar] [CrossRef]
  50. Zelilidis, A.; Koukouvelas, I.; Doutsos, T. Neogene Paleostress Changes behind the Forearc Fold Belt in the Patraikos Gulf Area, Western Greece. Neues Jahrb. Für Geol. Und Paläontologie-Monatshefte 1988, 5, 311–325. [Google Scholar] [CrossRef]
  51. Ferentinos, G.; Brooks, M.; Doutsos, T. Quaternary Tectonics in the Gulf of Patras, Western Greece. J. Struct. Geol. 1985, 7, 713–717. [Google Scholar] [CrossRef]
  52. Papadopoulos, G.A.; Vassilopoulou, A.; Plessa, A. A New Catalogue of Historical Earthquakes in the Corinth Rift, Central Greece: 480 BC–AD 1910. In Historical Earthquakes and Tsunamis in the Corinth Rift, Central Greece; National Observatory of Athens: Athens, Greece, 2000. [Google Scholar]
  53. Burton, P.W.; Qin, C.; Tselentis, G. Extreme Earthquake and Earthquake Perceptibility Study in Greece and Its Surrounding Area. Nat. Hazards 2004, 32, 277–312. [Google Scholar] [CrossRef]
  54. Pavlides, S.; Caputo, R.; Koukouvelas, I.; Kokkalas, S.; Chatzipetros, A. Paleoseismological Investigations of Aegean-Type Active Faults in Mainland Greece and Their Implications. In Post-Collisional Tectonics and Magmatism in the Mediterranean Region and Asia; Special Paper; Dilek, Y., Pavlides, S., Eds.; Geological Society of America: Boulder, Colorado, USA, 2006; Volume 409, pp. 175–188. [Google Scholar]
  55. Robertson, J.; Roberts, G.P.; Iezzi, F.; Meschis, M.; Gheorghiu, D.M.; Sahy, D.; Bristow, C.; Sgambato, C. Distributed Normal Faulting in the Tip Zone of the South Alkyonides Fault System, Gulf of Corinth, Constrained Using 36Cl Exposure Dating of Late-Quaternary Wave-Cut Platforms. J. Struct. Geol. 2020, 136, 104063. [Google Scholar] [CrossRef]
  56. Vita-Finzi, C.; King, G.C.P. The Seismicity, Geomorphology and Structural Evolution of the Corinth Area of Greece. Philos. Trans. R. Soc. London, Ser. A 1985, 314, 379–407. [Google Scholar]
  57. Evelpidou, N.; Karkani, A.; Tzouxanioti, M.; Spyrou, E.; Petropoulos, A.; Lakidi, L. Inventory and Assessment of the Geomorphosites in Central Cyclades, Greece: The Case of Paros and Naxos Islands. Geosciences 2021, 11, 512. [Google Scholar] [CrossRef]
  58. Evelpidou, N.; Karkani, A.; Spyrou, E.; Gavalas, A.-T. Assessing and Promoting the Coastal Geomorphological Heritage of the Eastern Coast of Rhodes Island, Southeastern Aegean, Greece. Sci. Cult. 2023, 9, 13–43. [Google Scholar]
  59. D’Agostino, N.; Métois, M.; Koci, R.; Duni, L.; Kuka, N.; Ganas, A.; Georgiev, I.; Jouanne, F.; Kaludjerovic, N.; Kandić, R. Active Crustal Deformation and Rotations in the Southwestern Balkans from Continuous GPS Measurements. Earth Planet. Sci. Lett. 2020, 539, 116246. [Google Scholar] [CrossRef]
  60. Serpelloni, E.; Cavaliere, A.; Martelli, L.; Pintori, F.; Anderlini, L.; Borghi, A.; Randazzo, D.; Bruni, S.; Devoti, R.; Perfetti, P.; et al. Surface Velocities and Strain-Rates in the Euro-Mediterranean Region From Massive GPS Data Processing. Front. Earth Sci. 2022, 10, 907897. [Google Scholar] [CrossRef]
  61. Altamimi, Z.; Rebischung, P.; Métivier, L.; Collilieux, X. ITRF2014: A New Release of the International Terrestrial Reference Frame Modeling Nonlinear Station Motions. J. Geophys. Res. Solid Earth 2016, 121, 6109–6131. [Google Scholar] [CrossRef]
  62. Serpetsidaki, A.; Elias, P.; Ilieva, M.; Bernard, P.; Briole, P.; Deschamps, A.; Lambotte, S.; Lyon-Caen, H.; Sokos, E.; Tselentis, G.A. New Constraints from Seismology and Geodesy on the Mw = 6.4 2008 Movri (Greece) Earthquake: Evidence for a Growing Strike-Slip Fault System. Geophys. J. Int. 2014, 198, 1373–1386. [Google Scholar] [CrossRef]
  63. Ganas, A.; Serpelloni, E.; Drakatos, G.; Kolligri, M.; Adamis, I.; Tsimi, C.; Batsi, E. The Mw 6.4 SW-Achaia (Western Greece) Earthquake of 8 June 2008: Seismological, Field, GPS Observations, and Stress Modeling. J. Earthq. Eng. 2009, 13, 1101–1124. [Google Scholar] [CrossRef]
  64. Sokos, E.; Zahradník, J.; Kiratzi, A.; Janský, J.; Gallovič, F.; Novotny, O.; Kostelecký, J.; Serpetsidaki, A.; Tselentis, G.A. The January 2010 Efpalio Earthquake Sequence in the Western Corinth Gulf (Greece). Tectonophysics 2012, 530–531, 299–309. [Google Scholar] [CrossRef]
  65. Ganas, A.; Briole, P.; Bozionelos, G.; Barberopoulou, A.; Elias, P.; Tsironi, V.; Valkaniotis, S.; Moshou, A.; Mintourakis, I. The 25 October 2018 Mw = 6.7 Zakynthos Earthquake (Ionian Sea, Greece): A Low-Angle Fault Model Based on GNSS Data, Relocated Seismicity, Small Tsunami and Implications for the Seismic Hazard in the West Hellenic Arc. J. Geodyn. 2020, 137, 101731. [Google Scholar] [CrossRef]
  66. Cirella, A.; Romano, F.; Avallone, A.; Piatanesi, A.; Briole, P.; Ganas, A.; Theodoulidis, N.; Chousianitis, K.; Volpe, M.; Bozionellos, G.; et al. The 2018 Mw 6.8 Zakynthos (Ionian Sea, Greece) Earthquake: Seismic Source and Local Tsunami Characterization. Geophys. J. Int. 2020, 221, 1043–1054. [Google Scholar] [CrossRef]
  67. Kaviris, G.; Elias, P.; Kapetanidis, V.; Serpetsidaki, A.; Karakonstantis, A.; Plicka, V.; De Barros, L.; Sokos, E.; Kassaras, I.; Sakkas, V.; et al. The Western Gulf of Corinth (Greece) 2020–2021 Seismic Crisis and Cascading Events: First Results from the Corinth Rift Laboratory Network. Seism. Rec. 2021, 1, 85–95. [Google Scholar] [CrossRef]
  68. Biggs, J.; Wright, T.J. How Satellite InSAR Has Grown from Opportunistic Science to Routine Monitoring over the Last Decade. Nat. Commun. 2020, 11, 3863. [Google Scholar] [CrossRef] [PubMed]
  69. Elias, P.; Briole, P. Ground Deformations in the Corinth Rift, Greece, Investigated Through the Means of SAR Multitemporal Interferometry. Geochem. Geophys. Geosystems 2018, 19, 4836–4857. [Google Scholar] [CrossRef]
  70. Melgar, D.; Ganas, A.; Taymaz, T.; Valkaniotis, S.; Crowell, B.W.; Kapetanidis, V.; Tsironi, V.; Yolsal-Çevikbilen, S.; Öcalan, T. Rupture Kinematics of 2020 January 24 Mw 6.7 Doǧanyol-Sivrice, Turkey Earthquake on the East Anatolian Fault Zone Imaged by Space Geodesy. Geophys. J. Int. 2020, 223, 862–874. [Google Scholar] [CrossRef]
  71. Crosetto, M.; Solari, L.; Balasis-Levinsen, J.; Bateson, L.; Casagli, N.; Frei, M.; Oyen, A.; Moldestad, D.A.; Mróz, M. Deformation Monitoring at European Scale: The Copernicus Ground Motion Service. Int. Arch. Photogramm. Remote Sens. Spat. Inf. Sci. 2021, 43, 141–146. [Google Scholar] [CrossRef]
  72. Costantini, M.; Minati, F.; Trillo, F.; Ferretti, A.; Passera, E.; Rucci, A.; Dehls, J.; Larsen, Y.; Marinkovic, P.; Eineder, M.; et al. EGMS: A New Copernicus Service for Ground Motion Mapping and Monitoring. In Proceedings of the EGU General Assembly 2022, Vienna, Austria, 23–27 May 2022; p. EGU22-9733. [Google Scholar]
  73. Copernicus European Ground Motion Service. Available online: https://egms.land.copernicus.eu/ (accessed on 2 July 2023).
  74. Miller, K.G.; Kominz, A.; Browning, J.V.; Wright, J.D.; Mountain, G.S.; Katz, M.E.; Sugarman, P.J.; Cramer, B.S.; Christie-Blick, N.; Pekar, S.F. The Phanerozoic Record of Global Sea-Level Change. Science 2005, 310, 1293–1298. [Google Scholar] [CrossRef]
  75. Gornitz, V. Eustasy. In Encyclopedia of Coastal Science; Schwartz, M., Ed.; Springer: Dordrecht, The Netherlands, 2005; pp. 439–442. [Google Scholar]
  76. Kemp, A.C.; Dutton, A.; Raymo, M.E. Paleo Constraints on Future Sea-Level Rise. Curr. Clim. Chang. Rep. 2015, 1, 205–215. [Google Scholar] [CrossRef]
  77. Ferentinos, G.; Papatheodorou, G.; Collins, M.B. Sediment Transport Processes on an Active Submarine Fault Escarpment: Gulf of Corinth, Greece. Mar. Geol. 1988, 83, 43–61. [Google Scholar] [CrossRef]
  78. Jackson, J.; Mckenzie, D. The Relationship between Plate Motions and Seismic Moment Tensors, and the Rates of Active Deformation in the Mediterranean and Middle East. Geophys. J. 1988, 93, 45–73. [Google Scholar] [CrossRef]
  79. Sakellariou, D.; Likousis, B.; Rousakis, I.; Georgiou, P. Sliding Phenomena on Active Fault Slopes: Panagopoula Site. Bull. Geol. Soc. Greece 2001, 34, 1723–1731. [Google Scholar]
  80. Pirazzoli, P.A. Marine Notches. In Sea-Level Research; Plassche, O., Ed.; Springer: Dordrecht, The Netherlands, 1986; pp. 361–400. [Google Scholar]
  81. Antonioli, F.; Lo Presti, V.; Rovere, A.; Ferranti, L.; Anzidei, M.; Furlani, S.; Mastronuzzi, G.; Orru, P.E.; Scicchitano, G.; Sannino, G.; et al. Tidal Notches in Mediterranean Sea: A Comprehensive Analysis. Quat. Sci. Rev. 2015, 119, 66–84. [Google Scholar] [CrossRef]
  82. Evelpidou, N.; Kampolis, I.; Pirazzoli, P.A.; Vassilopoulos, A. Global Sea-Level Rise and the Disappearance of Tidal Notches. Glob. Planet. Change 2012, 92–93, 248–256. [Google Scholar] [CrossRef]
  83. Laborel, J.; Laborel-Deguen, F. Sea-Level Indicators, Biologic. In Encyclopedia of Coastal Science; Schwartz, M., Ed.; Springer: Dordrecht, The Netherlands, 2005; pp. 833–834. [Google Scholar]
  84. Furlani, S.; Biolchi, S.; Cucchi, F.; Antonioli, F.; Busetti, M.; Melis, R. Tectonic Effects on Late Holocene Sea Level Changes in the Gulf of Trieste (NE Adriatic Sea, Italy). Quat. Int. 2011, 232, 144–157. [Google Scholar] [CrossRef]
  85. Furlani, S.; Cucchi, F.; Biolchi, S.; Odorico, R. Notches in the Northern Adriatic Sea: Genesis and Development. Quat. Int. 2011, 232, 158–168. [Google Scholar] [CrossRef]
  86. Evelpidou, N.; Pirazzoli, P.A.; Vassilopoulos, A.; Tomasin, A. Holocene Submerged Shorelines on Theologos Area (Greece). Z. Für Geomorphol. 2011, 55, 31–44. [Google Scholar] [CrossRef]
  87. Evelpidou, N.; Pirazzoli, P.A. Holocene Relative Sea-Level Changes from Submerged Tidal Notches: A Methodological Approach. Quaternaire 2014, 25, 313–320. [Google Scholar] [CrossRef]
  88. Pirazzoli, P.A.; Evelpidou, N. Tidal Notches: A Sea-Level Indicator of Uncertain Archival Trustworthiness. Palaeogeogr. Palaeoclim. Palaeoecol. 2013, 369, 377–384. [Google Scholar] [CrossRef]
  89. Trenhaile, A.S. Coastal Notches: Their Morphology, Formation, and Function. Earth Sci. Rev. 2015, 150, 285–304. [Google Scholar] [CrossRef]
  90. Pirazzoli, P.A. A Review of Possible Eustatic, Isostatic and Tectonic Contributions in Eight Late-Holocene Relative Sea-Level Histories from the Mediterranean Area. Quat. Sci. Rev. 2005, 24, 1989–2001. [Google Scholar] [CrossRef]
  91. Stewart, I.; Vita-Finzi, C. Coastal Uplift on Active Normal Faults: The Eliki Fault, Greece. Geophys. Res. Lett. 1996, 23, 1853–1856. [Google Scholar] [CrossRef]
  92. Cooper, F.J.; Roberts, G.P.; Underwood, C.J. A Comparison of 103–105 Year Uplift Rates on the South Alkyonides Fault, Central Greece: Holocene Climate Stability and the Formation of Coastal Notches. Geophys. Res. Lett. 2007, 34, L14310. [Google Scholar] [CrossRef]
  93. Boulton, S.J.; Stewart, I.S. Holocene Coastal Notches in the Mediterranean Region: Indicators of Palaeoseismic Clustering? Geomorphology 2015, 237, 29–37. [Google Scholar] [CrossRef]
  94. Pirazzoli, P.A. World Atlas of Holocene Sea-Level Changes; Elsevier Oceanography Series; Elsevier Science: Amsterdam, The Netherlands; New York, NY, USA, 1991. [Google Scholar]
  95. Pirazzoli, P.A.; Thommeret, J.; Thommeret, Y.; Laborel, J.; Montaggioni, L.F. Crustal Block Movements from Holocene Shorelines: Crete and Antikythira (Greece). Tectonophysics 1982, 86, 27–43. [Google Scholar] [CrossRef]
  96. Pirazzoli, P.A.; Montaggioni, L.; Saliège, J.F.; Segonzac, G.; Thommeret, Y.; Vergnaud-Grazzini, C. Crustal Block Movements from Holocene Shorelines: Rhodes Island (Greece) Related Papers Crust Al Block Movement s from Holocene Shorelines: Cret e and Ant Ikyt Hira (Greece LUCIEN MONTAGGIONI Lat e Holocene Relat Ive Sea-Level Changes in Lebanon, East Ern. Tectonophysics 1989, 170, 89–114. [Google Scholar] [CrossRef]
  97. Pirazzoli, P.A.; Stiros, S.C.; Arnold, M.; Laborel, J.; Laborel-Deguen, F.; Papageorgiou, S. Episodic Uplift Deduced from Holocene Shorelines in the Perachora Peninsula, Corinth Area, Greece. Tectonophysics 1994, 229, 201–209. [Google Scholar] [CrossRef]
  98. Liew, P.M.; Pirazzoli, P.A.; Hsieh, M.L.; Arnold, M.; Barusseau, J.P.; Fontugne, M.; Giresse, P. Holocene Tectonic Uplift Deduced from Elevated Shorelines, Eastern Coastal Range of Taiwan. Tectonophysics 1993, 222, 55–68. [Google Scholar] [CrossRef]
  99. Hantoro, W.S.; Pirazzoli, P.A.; Jouaunic, C.; Faure, H.; Hoang, C.T.; Radtke, U.; Causse, C.; Best, M.B.; Lafont, R.; Bieda, S.; et al. Quaternary Uplifted Coral Reef Terraces on Alor Island, East Indonesia. Coral Reefs 1994, 13, 215–223. [Google Scholar] [CrossRef]
  100. Bard, E.; Jouannic, C.; Hamelin, B.; Pirazzoli, P.; Arnold, M.; Faure, G.; Sumosusastro, P. Syaefudin Pleistocene Sea Levels and Tectonic Uplift Based on Dating of Corals from Sumba Island, Indonesia. Geophys. Res. Lett. 1996, 23, 1473–1476. [Google Scholar] [CrossRef]
  101. Stewart, I.S.; Cundy, A.; Kershaw, S.; Firth, C. Holocene Coastal Uplift in the Taormina Area, Northeastern Sicily: Implications for the Southern Prolongation of the Calabrian Seismogenic Belt. J. Geodyn. 1997, 24, 37–50. [Google Scholar] [CrossRef]
  102. Stiros, S.C.; Laborel, J.; Laborel-Deguen, F.; Papageorgiou, S.; Evin, J.; Pirazzoli, P.A. Seismic Coastal Uplift in a Region of Subsidence: Holocene Raised Shorelines of Samos Island, Aegean Sea, Greece. Mar. Geol. 2000, 170, 41–58. [Google Scholar] [CrossRef]
  103. Stiros, S.C.; Pirazzoli, P.A.; Fontugne, M. New Evidence of Holocene Coastal Uplift in the Strophades Islets (W Hellenic Arc, Greece). Mar. Geol. 2009, 267, 207–211. [Google Scholar] [CrossRef]
  104. Morhange, C.; Pirazzoli, P.A.; Marriner, N.; Montaggioni, L.F.; Nammour, T. Late Holocene Relative Sea-Level Changes in Lebanon, Eastern Mediterranean. Mar. Geol. 2006, 230, 99–114. [Google Scholar] [CrossRef]
  105. Faivre, S.; Butorac, V. Recently Submerged Tidal Notches in the Wider Makarska Area (Central Adriatic, Croatia). Quat. Int. 2018, 494, 225–235. [Google Scholar] [CrossRef]
  106. Chappell, J. Geology of Coral Terraces, Huon Peninsula, New Guinea: A Study of Quaternary Tectonic Movements and Sea-Level Changes. Bull. Geol. Soc. Am. 1974, 85, 553. [Google Scholar] [CrossRef]
  107. Valensise, G.; Ward, S.N. Long-Term Uplift of the Santa Cruz Coastline in Response to Repeated Earthquakes along the San Andreas Fault. Bull. Seismol. Soc. Am. 1991, 81, 1694–1704. [Google Scholar]
  108. Rosenbloom, N.A.; Anderson, R.S. Hillslope and Channel Evolution in a Marine Terraced Landscape, Santa Cruz, California Abstract. A Flight of Marine Terraces along California Coastline Provides a Unique Posits m Tall Decaying Sea Become Rounded of the Five Bedrock Sueam Channels to Th. J. Geophys. Res. 1994, 99, 14013–14029. [Google Scholar] [CrossRef]
  109. Robertson, J.; Meschis, M.; Roberts, G.P.; Ganas, A.; Gheorghiu, D.M. Temporally Constant Quaternary Uplift Rates and Their Relationship with Extensional Upper-Plate Faults in South Crete (Greece), Constrained with 36Cl Cosmogenic Exposure Dating. Tectonics 2019, 38, 1189–1222. [Google Scholar] [CrossRef]
  110. Limber, P.W.; Murray, A.B. Beach and Sea-Cliff Dynamics as a Driver of Long-Term Rocky Coastline Evolution and Stability. Geology 2011, 39, 1147–1150. [Google Scholar] [CrossRef]
  111. Saillard, M.; Hall, S.R.; Audin, L.; Farber, D.L.; Hérail, G.; Martinod, J.; Regard, V.; Finkel, R.C.; Bondoux, F. Non-Steady Long-Term Uplift Rates and Pleistocene Marine Terrace Development along the Andean Margin of Chile (31° S) Inferred from 10Be Dating. Earth Planet. Sci. Lett. 2009, 277, 50–63. [Google Scholar] [CrossRef]
  112. Marquardt, C.; Lavenu, A.; Ortlieb, L.; Godoy, E.; Comte, D. Coastal Neotectonics in Southern Central Andes: Uplift and Deformation of Marine Terraces in Northern Chile (27° S). Tectonophysics 2004, 394, 193–219. [Google Scholar] [CrossRef]
  113. Trenhaile, A.S. Modeling the Development of Marine Terraces on Tectonically Mobile Rock Coasts. Mar. Geol. 2002, 185, 341–361. [Google Scholar] [CrossRef]
  114. Muhs, D.R.; Rockwell, T.K.; Kennedy, G.L. Late Quaternary Uplift Rates of Marine Terraces on the Pacific Coast of North America, Southern Oregon to Baja California Sur. Quat. Int. 1992, 15–16, 121–133. [Google Scholar] [CrossRef]
  115. Imbrie, J.; Hays, J.D.; Martinson, D.G.; Mclntyre, A.; Mix, A.C.; Morley, J.J.; Pisias, N.G.; Prell, W.L.; Shackleton, N.J. The Orbital Theory of Pleistocene Climate: Support from a Revised Chronology of the Marine O180 Record. In Milankovitch and Climate; Berger, A.L., Imbrie, J., Hays, J., Kukla, G., Saltzman, B., Eds.; Springer: Dordrecht, The Netherlands, 1984; pp. 269–305. [Google Scholar]
  116. Chappell, J.; Shackleton, N.J. Oxygen Isotopes and Sea Level. Nature 1986, 324, 137–140. [Google Scholar] [CrossRef]
  117. Bassinot, F.C.; Labeyrie, L.D.; Vincent, E.; Quidelleur, X.; Shackleton, N.J.; Lancelot, Y. The Astronomical Theory of Climate and the Age of the Brunhes-Matuyama Magnetic Reversal. Earth Planet. Sci. Lett. 1994, 126, 91–108. [Google Scholar] [CrossRef]
  118. Waelbroeck, C.; Labeyrie, L.; Michel, E.; Duplessy, J.C.; McManus, J.F.; Lambeck, K.; Balbon, E.; Labracherie, M. Sea-Level and Deep Water Temperature Changes Derived from Benthic Foraminifera Isotopic Records. Quat. Sci. Rev. 2002, 21, 295–305. [Google Scholar] [CrossRef]
  119. Rohling, E.J.; Grant, K.; Bolshaw, M.; Roberts, A.P.; Siddall, M.; Hemleben, C.; Kucera, M. Antarctic Temperature and Global Sea Level Closely Coupled over the Past Five Glacial Cycles. Nat. Geosci. 2009, 2, 500–504. [Google Scholar] [CrossRef]
  120. Anderson, R.S.; Densmore, A.L.; Ellis, M.A. The Generation and Degradation of Marine Terraces. Basin Res. 1999, 11, 7–19. [Google Scholar] [CrossRef]
  121. Bricker, O.P. Introduction: Beachrock and Intertidal Cement. In Carbonate Cements; Bricker, O.P., Ed.; Johns Hopkins Press: Baltimore, MD, USA, 1971; pp. 1–13. [Google Scholar]
  122. Kelly, C.S.; Green, A.N.; Cooper, J.A.G.; Wiles, E. Beachrock Facies Variability and Sea Level Implications: A Preliminary Study. J. Coast. Res. 2014, 70, 736–742. [Google Scholar] [CrossRef]
  123. Mauz, B.; Vacchi, M.; Green, A.; Hoffmann, G.; Cooper, A. Beachrock: A Tool for Reconstructing Relative Sea Level in the Far-Field. Mar. Geol. 2015, 362, 1–16. [Google Scholar] [CrossRef]
  124. Russell, R.J. Caribbean Beach Rock Observation. Z. Für Geomorphol. 1959, 3, 227–236. [Google Scholar]
  125. Frankel, E. Rate of Formation of Beach Rock. Earth Planet. Sci. Lett. 1968, 4, 439–440. [Google Scholar] [CrossRef]
  126. Kelletat, D. Beachrock as Sea-Level Indicator? Remarks from a Geomorphological Point of View. J. Coast. Res. 2006, 22, 1558–1564. [Google Scholar] [CrossRef]
  127. Falkenroth, M.; Schneider, B.; Hoffmann, G. Beachrock as Sea-Level Indicator—A Case Study at the Coastline of Oman (Indian Ocean). Quat. Sci. Rev. 2019, 206, 81–98. [Google Scholar] [CrossRef]
  128. Karkani, A.; Evelpidou, N.; Vacchi, M.; Morhange, C.; Tsukamoto, S.; Frechen, M.; Maroukian, H. Tracking Shoreline Evolution in Central Cyclades (Greece) Using Beachrocks. Mar. Geol. 2017, 388, 25–37. [Google Scholar] [CrossRef]
  129. Saitis, G.; Karkani, A.; Evelpidou, N.; Maroukian, H. Palaeogeographical Reconstruction of Ancient Diolkos Slipway by Using Beachrocks as Proxies, West Corinth Isthmus, Greece. Quaternary 2022, 5, 7. [Google Scholar] [CrossRef]
  130. Stiros, S.C.; Arnold, M.; Pirazzoli, P.A.; Laborel, J.; Laborel, F.; Papageorgiou, S. Historical Coseismic Uplift on Euboea Island, Greece. Earth Planet. Sci. Lett. 1992, 108, 109–117. [Google Scholar] [CrossRef]
  131. Papageorgiou, S.; Arnold, M.; Laborel, J.; Stiros, S.C. Seismic Uplift of the Harbour of Ancient Aigeira, Central Greece. Int. J. Naut. Archaeol. 1993, 22, 275–281. [Google Scholar] [CrossRef]
  132. Laborel, J.; Laborel-Deguen, F. Biological Indicators of Relative Sea-Level Variations and of Co-Seismic Displacements in the Mediterranean Region. J. Coast. Res. 1994, 10, 395–415. [Google Scholar]
  133. Ganas, A.; Buck, V.A. A Model for Tectonic Subsidence of the Allai Archaeological Site, Lokris, Central Greece. In Proceedings of the 8th International Congress of the Geological Society of Greece, Patras, Greece, 17–19 October 1998; Volume 32, pp. 181–187. [Google Scholar]
  134. Aucelli, P.P.C.; Mattei, G.; Caporizzo, C.; Cinque, A.; Troisi, S.; Peluso, F.; Stefanile, M.; Pappone, G. Ancient Coastal Changes Due to Ground Movements and Human Interventions in the Roman Portus Julius (Pozzuoli Gulf, Italy): Results from Photogrammetric and Direct Surveys. Water 2020, 12, 658. [Google Scholar] [CrossRef]
  135. Galili, E.; Salamon, A.; Gambash, G.; Zviely, D. Archaeological and Natural Indicators of Sea-Level and Coastal Changes: The Case Study of the Caesarea Roman Harbor. Geosciences 2021, 11, 306. [Google Scholar] [CrossRef]
  136. Oikonomou, P.; Karkani, A.; Evelpidou, N.; Kampolis, I.; Spada, G. The Fish Tanks of the Mediterranean Sea. Quaternary 2023, 6, 24. [Google Scholar] [CrossRef]
  137. Auriemma, R.; Solinas, E. Archaeological Remains as Sea Level Change Markers: A Review. Quat. Int. 2009, 206, 134–146. [Google Scholar] [CrossRef]
  138. Papazachos, B.P.; Papazachou, C.B. The Earthquakes of Greece; Ziti: Thessaloniki, Greece, 1997. [Google Scholar]
  139. Vita-Finzi, C. Evaluating Late Quaternary Uplift in Greece and Cyprus. In Magmatic Processes and Plate Tectonics; Prichard, H.M., Alabaster, T., Harris, N.B.W., Neary, C.R., Eds.; Geological Society Special Publication: London, UK, 1993; Volume 76, pp. 417–424. [Google Scholar]
  140. McNeill, L.C.; Collier, R.E.L. Uplift and Slip Rates of the Eastern Eliki Fault Segment, Gulf of Corinth, Greece, Inferred from Holocene and Pleistocene Terraces. J. Geol. Soc. Lond. 2004, 161, 81–92. [Google Scholar] [CrossRef]
  141. Moretti, I.; Lykousis, V.; Sakellariou, D.; Reynaud, J.Y.; Benziane, B.; Prinzhoffer, A. Sedimentation and Subsidence Rate in the Gulf OfCorinth: What We Learn from the Marion Dufresne’s Long-Piston Coring. Comptes Rendus Geosci. 2004, 336, 291–299. [Google Scholar] [CrossRef]
  142. Evelpidou, N.; Pirazzoli, P.A.; Saliège, J.-F.; Vassilopoulos, A. Submerged Notches and Doline Sediments as Evidence for Holocene Subsidence. Cont. Shelf Res. 2011, 31, 1273–1281. [Google Scholar] [CrossRef]
  143. Stewart, I. Holocene Uplift and Palaeoseismicity on the Eliki Fault, Western Gulf of Corinth, Greece. Ann. Geophys. 1996, 34, 575–588. [Google Scholar] [CrossRef]
  144. Turner, J.A.; Leeder, M.R.; Andrews, J.E.; Rowe, P.J.; van Calsteren, P.V.; Thomas, L. Testing Rival Tectonic Uplift Models for the Lechaion Gulf in the Gulf of Corinth Rift. J. Geol. Soc. Lond. 2010, 167, 1237–1250. [Google Scholar] [CrossRef]
  145. Maroukian, H.; Gaki-Papanastassiou, K.; Karymbalis, E.; Vouvalidis, K.; Pavlopoulos, K.; Papanastassiou, D.; Albanakis, K. Morphotectonic Control on Drainage Network Evolution in the Perachora Peninsula, Greece. Geomorphology 2008, 102, 81–92. [Google Scholar] [CrossRef]
  146. Palyvos, N.; Lemeille, F.; Sorel, D.; Pantosti, D.; Pavlopoulos, K. Geomorphic and Biological Indicators of Paleoseismicity and Holocene Uplift Rate at a Coastal Normal Fault Footwall (Western Corinth Gulf, Greece). Geomorphology 2008, 96, 16–38. [Google Scholar] [CrossRef]
  147. Morhange, C.; Pirazzoli, P.A.; Evelpidou, N.; Marriner, N. Late Holocene Tectonic Uplift and the Silting Up of Lechaion, the Western Harbor of Ancient Corinth, Greece. Geoarchaeology 2012, 27, 278–283. [Google Scholar] [CrossRef]
  148. Stiros, S.; Pirazzoli, P.; Rothaus, R.; Papageorgiou, S.; Laborel, J.; Arnold, M. On the Date of Construction of Lechaion, Western Harbor of Ancient Corinth, Greece. Geoarchaeology 1996, 263, 251–263. [Google Scholar] [CrossRef]
  149. Mouyaris, N.; Papastamatiou, D.; Vita-Finzi, C. The Helice Fault? Terra Nov. 1992, 4, 124–128. [Google Scholar] [CrossRef]
  150. Karkani, A.; Evelpidou, N.; Saitis, G.; Tsanakas, K.; Drinia, H.; Vassilakis, E.; Karymbalis, E.; Batzakis, D.V. Coastal Evolution and Relative Sea Level Changes at Psatha (Alkyonides Bay, Greece). J. Mar. Sci. Eng. 2023, 11, 199. [Google Scholar] [CrossRef]
  151. De Martini, P.M.; Pantosti, D.; Palyvos, N.; Lemeille, F.; McNeill, L.; Collier, R. Slip Rates of the Aigion and Eliki Faults from Uplifted Marine Terraces, Corinth Gulf, Greece. Comptes Rendus Geosci. 2004, 336, 325–334. [Google Scholar] [CrossRef]
  152. Lykousis, V.; Sakellariou, D.; Moretti, I.; Kaberi, H. Late Quaternary Basin Evolution of the Gulf of Corinth: Sequence Stratigraphy, Sedimentation, Fault-Slip and Subsidence Rates. Tectonophysics 2007, 440, 29–51. [Google Scholar] [CrossRef]
  153. Collier, R.E.L.; Leeder, M.R.; Rowe, P.J.; Atkinson, T.C. Rates of Tectonic Uplift in the Corinth and Megara Basins, Central Greece. Tectonics 1992, 11, 1159–1167. [Google Scholar] [CrossRef]
  154. Keraudren, B.; Falguères, C.; Bahain, J.-J.; Sorel, D.; Yokoyama, Y. Nouvelles Datations Radiométriques Des Terrasses Marines de Corinthie (Péloponnèse Septentrional, Grèce). Comptes Rendus L’académie Des Sci. Paris Série II A 1995, 320, 483–489. [Google Scholar]
  155. Sébrier, M. Tectonique Recente d’une Transversale a l’Arc Egeen: Le Golfe de Corinthe et Ses Regions Peripheriques. Ph.D. Thesis, Université Paris Xi-Orsay, Paris, France, 1977. [Google Scholar]
  156. Keraudren, B.; Sorel, D. The Terraces of Corinth (Greece)—A Detailed Record of Eustatic Sea-Level Variations during the Last 500,000 Years. Mar. Geol. 1987, 77, 99–107. [Google Scholar] [CrossRef]
  157. Mourtzas, N.D.; Kissas, C.; Kolaiti, E. Archaeological and Geomorphological Indicators of the Historical Sea Level Changes and the Related Palaeogeographical Reconstruction of the Ancient Foreharbour of Lechaion, East Corinth Gulf (Greece). Quat. Int. 2014, 332, 151–171. [Google Scholar] [CrossRef]
  158. Merritts, D.; Bull, W.B. Interpreting Quaternary Uplift Rates at the Mendocino Triple Junction, Northern California, from Uplifted Marine Terraces. Geology 1989, 17, 1020–1024. [Google Scholar] [CrossRef]
  159. Schumm, S.A. Alluvial River Response to Active Tectonics. In Active Tectonics; National Academy Press: Washington, DC, USA, 1986; pp. 80–94. [Google Scholar]
  160. Leeder, M.R.; Seger, M.J.; Stark, C.P. Sedimentation and Tectonic Geomorphology Adjacent to Major Active and Inactive Normal Faults, Southern Greece. J. Geol. Soc. Lond. 1991, 148, 331–343. [Google Scholar] [CrossRef]
  161. Eliet, P.P.; Gawthorpe, R.L. Drainage Development and Sediment Supply within Rifts, Examples from the Sperchios Basin, Central Greece. J. Geol. Soc. 1995, 152, 883–893. [Google Scholar] [CrossRef]
  162. Pechlivanidou, S.; Cowie, P.A.; Duclaux, G.; Nixon, C.W.; Gawthorpe, R.L.; Salles, T. Tipping the Balance: Shifts in Sediment Production in an Active Rift Setting. Geology 2019, 47, 259–262. [Google Scholar] [CrossRef]
  163. Fernández-Blanco, D.; de Gelder, G.; Lacassin, R.; Armijo, R. Geometry of Flexural Uplift by Continental Rifting in Corinth, Greece. Tectonics 2020, 39, e2019TC005685. [Google Scholar] [CrossRef]
  164. Demoulin, A.; Beckers, A.; Hubert-Ferrari, A. Patterns of Quaternary Uplift of the Corinth Rift Southern Border (N Peloponnese, Greece) Revealed by Fluvial Landscape Morphometry. Geomorphology 2015, 246, 188–204. [Google Scholar] [CrossRef]
  165. Small, E.E.; Anderson, R.S. Pleistocene Relief Production in Laramide Mountain Ranges, Western United States. Geology 1998, 26, 123–126. [Google Scholar] [CrossRef]
  166. Stiros, S.C. Archaeological Evidence for Unusually Rapid Holocene Uplift Rates in an Active Normal Faulting Terrain: Roman Harbor of Aigeira, Gulf of Corinth, Greece. Geoarchaeology 1998, 13, 731–741. [Google Scholar] [CrossRef]
  167. Riddick, N.L.; Boyce, J.I.; Reinhardt, E.G.; Rothaus, R.M.; Chomicki, K.M.; McCarthy, F.M.G. Multi-Proxy Palaeoenvironmental Record of Coastal Tectonic Uplift and Abandonment (ca. 6th c. CE) of Lechaion’s Inner Harbour, Ancient Corinth, Greece. Quat. Sci. Rev. 2021, 267, 107080. [Google Scholar] [CrossRef]
  168. Stefatos, A.; Papatheodorou, G.; Ferentinos, G.; Leeder, M.; Collier, R. Seismic Reflection Imaging of Active Offshore Faults in the Gulf of Corinth: Their Seismotectonic Signifcance. Basin Res. 2002, 14, 487–502. [Google Scholar] [CrossRef]
  169. Verrios, S.; Zygouri, V.; Kokkalas, S. Morphotectonic Analysis in the Eliki Fault Zone (Gulf of Corinth, Greece). Bull. Geol. Soc. Greece 2004, 36, 1706–1715. [Google Scholar] [CrossRef]
  170. Tsimi, C.; Ganas, A.; Soulakellis, N.; Kairis, O.; Valmis, S. Morphotectonics of the Psathopyrgos Active Fault, Western Corinth Rift, Central Greece. Bull. Geol. Soc. Greece 2007, 40, 500–511. [Google Scholar] [CrossRef]
  171. McNeill, L.C.; Collier, R.E.L.; De Martini, P.M.; Pantosti, D.; D’Addezio, G. Recent History of the Eastern Eliki Fault, Gulf of Corinth: Geomorphology, Palaeoseismology and Impact on Palaeoenvironments. Geophys. J. Int. 2005, 161, 154–166. [Google Scholar] [CrossRef]
  172. Dufaure, J.J.; Zamanis, A. Styles Néotectoniques et Étagements de Niveaux Marins Sur Un Segment d’arc Insulaire, Le Péloponnèse. In Proceedings of the Conference: Niveaux marins et Tectonique Quaternaire dans l ‘Aire Méditerranéenne, CNRS, Paris, France, 29 November 1980; Volume 77. [Google Scholar]
  173. Rigo, A. Etude Sismotectonique et Géodésique Du Golfe de Corinthe (Grèce). Ph.D. Thesis, University of Paris, Paris, France, 1994. [Google Scholar]
  174. Palyvos, N.; Mancini, M.; Sorel, D.; Lemeille, F.; Pantosti, D.; Julia, R.; Triantraphyllou, M.; De Martini, P.M. Geomorphological, Stratigraphic and Geochronological Evidence of Fast Pleistocene Coastal Uplift in the Westernmost Part of the Corinth Gulf Rift (Greece). Geol. J. 2010, 45, 78–104. [Google Scholar] [CrossRef]
  175. Pirazzoli, P.A. The Early Byzantine Tectonic Paroxysm. Z. Für Geomorphol. N.F. Suppl. 1986, 62, 31–49. [Google Scholar]
  176. Pirazzoli, P.A.; Laborel, J.; Saliège, J.F.; Erol, O.; Kayan, I.; Person, A. Holocene Raised Shorelines on the Hatay Coasts (Turkey): Palaeoecological and Tectonic Implications. Mar. Geol. 1991, 96, 295–311. [Google Scholar] [CrossRef]
  177. Mitzopoulos, M.K. Le Quaternaire Marin (Tyrrhénien) Dans La Presqu’île de Perachora. Prakt. Akad. Athens 1933, 8, 286–292. [Google Scholar]
  178. Kershaw, S.; Guo, L. Marine Notches in Coastal Cliffs: Indicators of Relative Sea-Level Change, Perachora Peninsula, Central Greece. Mar. Geol. 2001, 179, 213–228. [Google Scholar] [CrossRef]
  179. Leeder, M.R.; Portman, C.; Andrews, J.E.; Collier, R.E.L.; Finch, E.; Gawthorpe, R.L.; McNeill, L.C.; Pérez-Arlucea, M.; Rowe, P. Normal Faulting and Crustal Deformation, Alkyonides Gulf and Perachora Peninsula, Eastern Gulf of Corinth Rift, Greece. J. Geol. Soc. Lond. 2005, 162, 549–561. [Google Scholar] [CrossRef]
  180. Emmanouilidis, A.; Unkel, I.; Triantaphyllou, M.; Avramidis, P. Late-Holocene Coastal Depositional Environments and Climate Changes in the Gulf of Corinth, Greece. Holocene 2020, 30, 77–89. [Google Scholar] [CrossRef]
  181. Ganas, A.; Elias, P.; Briole, P.; Valkaniotis, S.; Escartin, J.; Tsironi, V.; Karasante, I.; Kosma, C. Co-Seismic and Post-Seismic Deformation, Field Observations and Fault Model of the 30 October 2020 Mw = 7.0 Samos Earthquake, Aegean Sea. Acta Geophys. 2021, 69, 999–1024. [Google Scholar] [CrossRef]
  182. Ganas, A.; Tsironi, V.; Efstathiou, E.; Konstantakopoulou, E.; Andritsou, N.; Georgakopoulos, V.; Tsimi, C.; Fokaefs, A.; Madonis, N. The National Observatory of Athens active faults of Greece database (NOAFAULTs), Version 2023. In Past Earthquakes and Advances in Seismology for Informed Risk Decision-Making, Book of Abstracts, Proceedings of the 8th International Colloquium on Historical Earthquakes, Palaeo—Macroseismology and Seismotectonics; Special Publication; Bulletin of the Geological Society of Greece: Athens, Greece, 2023; pp. 36–38. ISBN 978-618-86841-1-9. [Google Scholar]
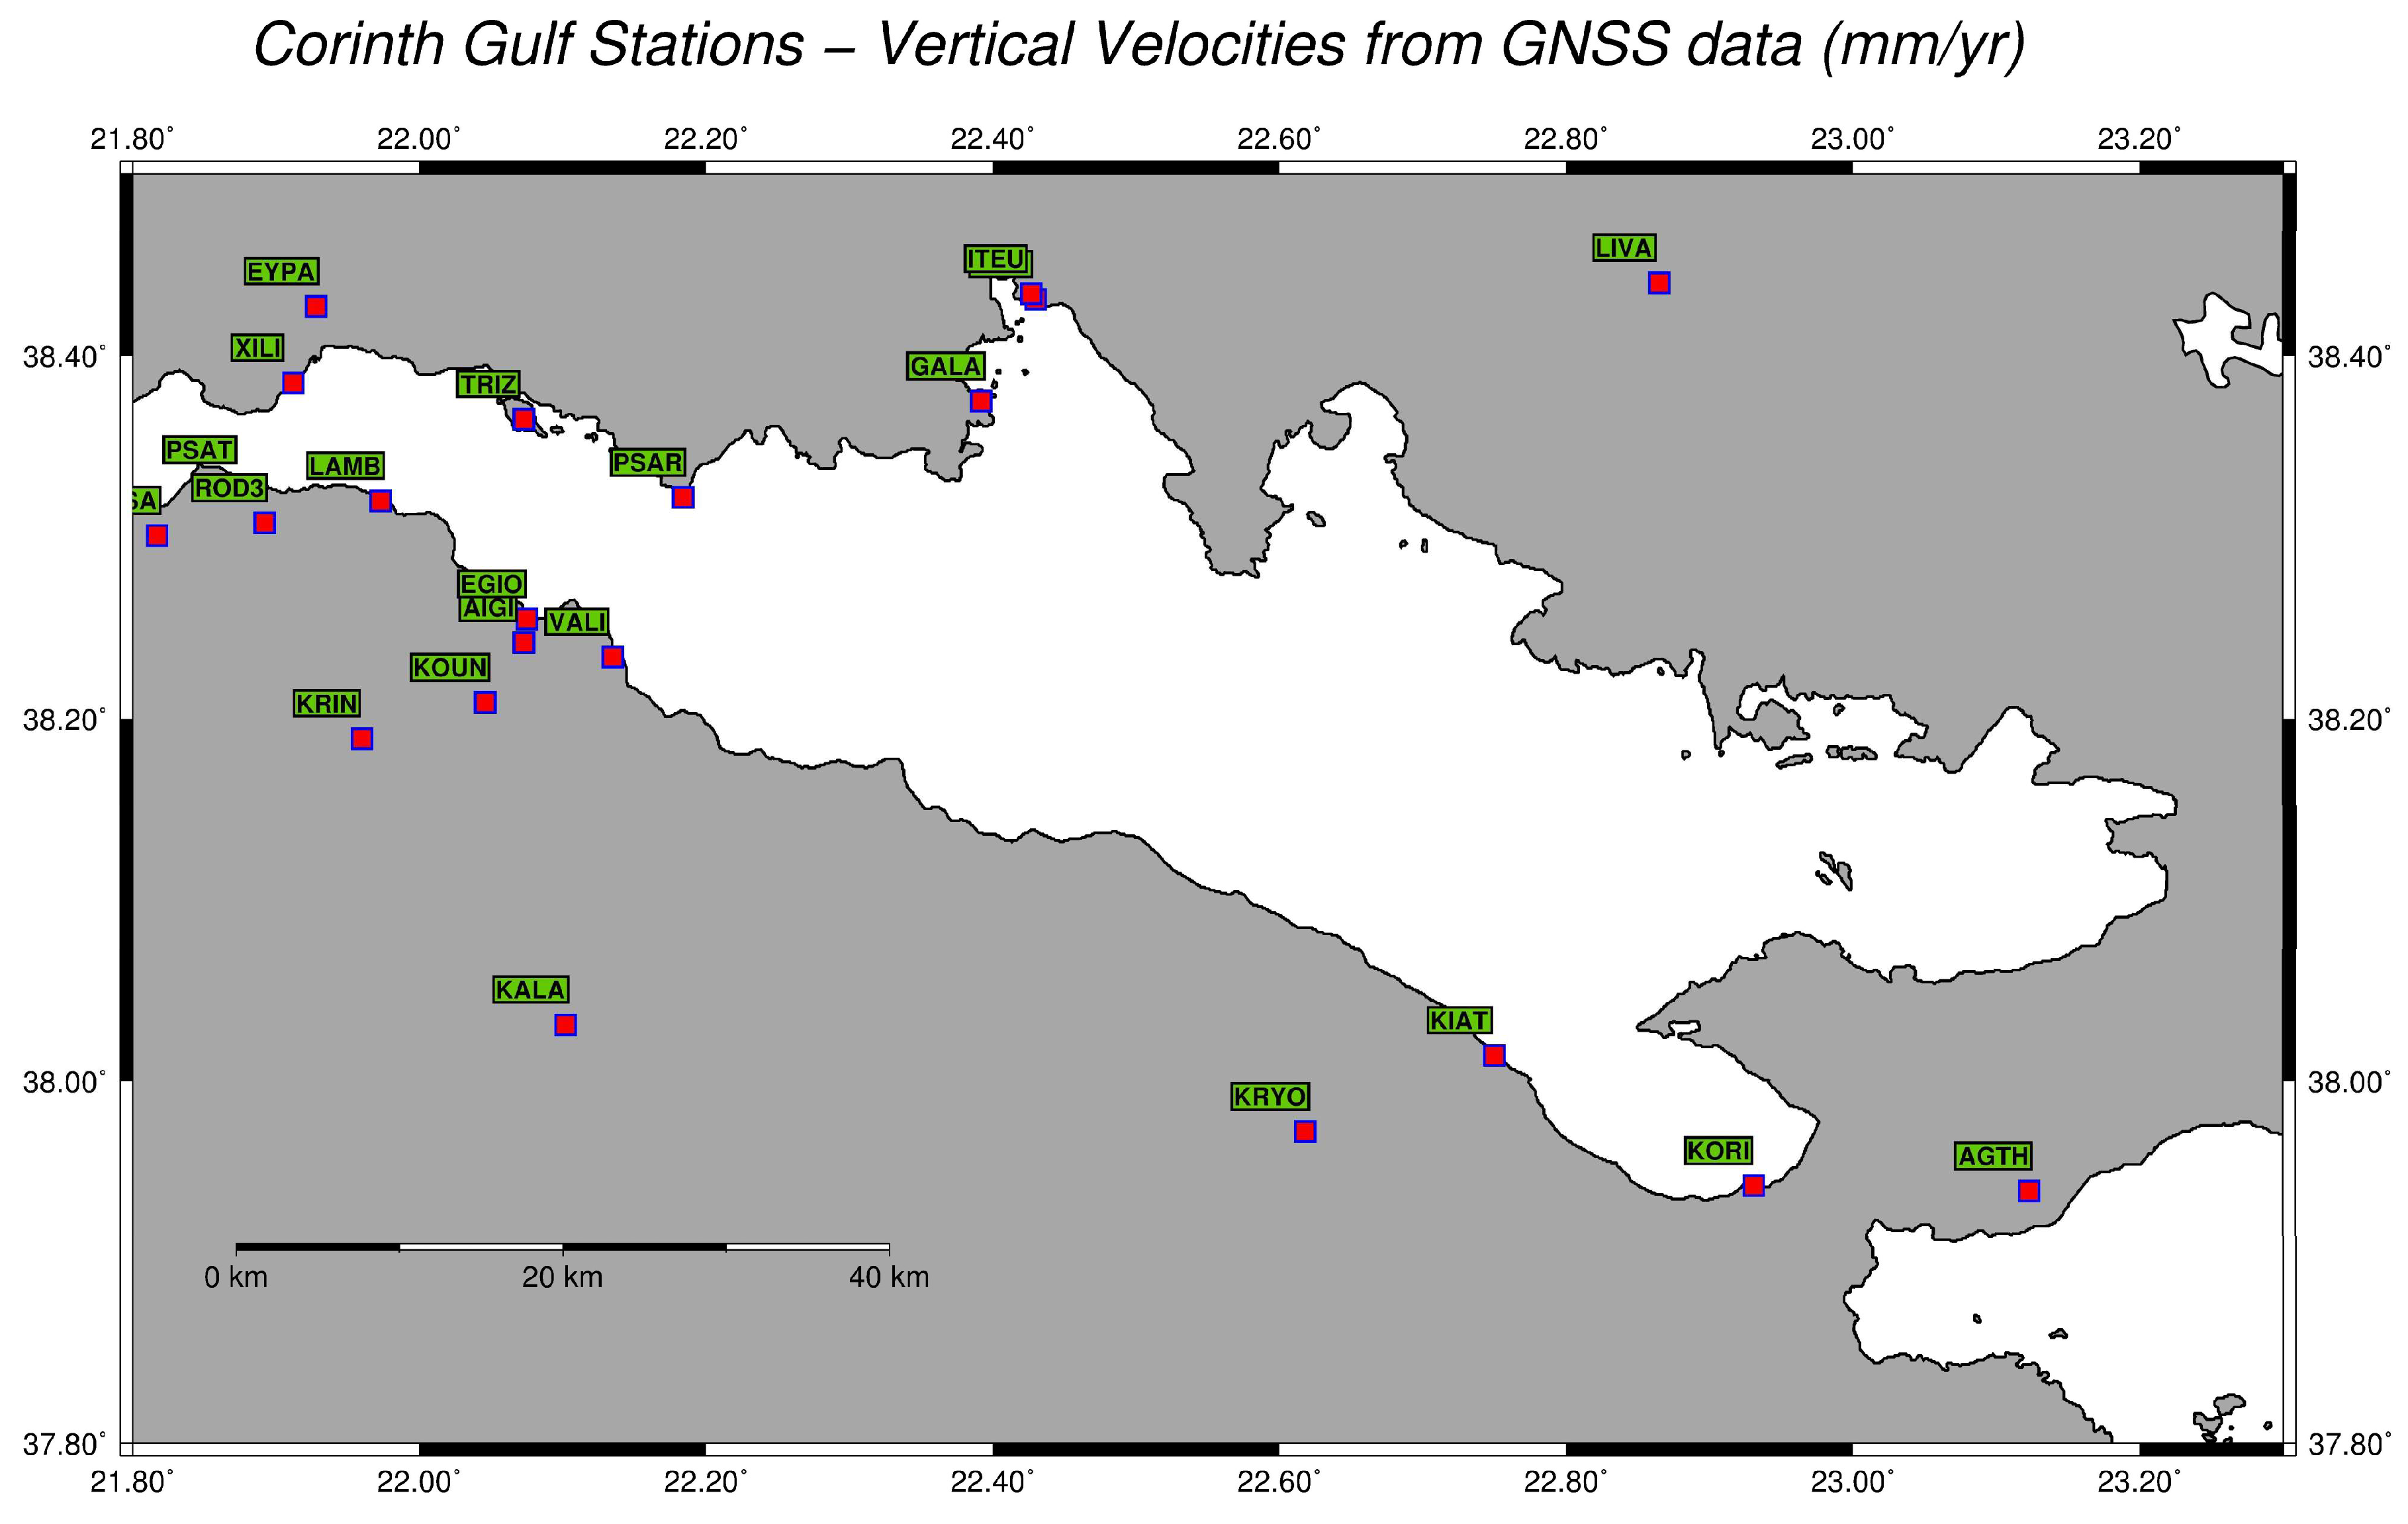
Figure 2. Map of permanent GNSS stations used in this study.
Geosciences 13 00329 g002
Figure 3. Vertical ground motion map in the Gulf of Corinth area [73]. Color scale is −10 to +10 mm/y (red to blue; red indicates subsidence).
Geosciences 13 00329 g003
Figure 4. Map of the Gulf of Corinth, showing sites of uplift (in blue) and subsidence (in red). The data indicate a subsidence of the northern coast of the gulf, while the southern coast is mostly undergoing uplift.
Geosciences 13 00329 g004
Figure 5. Slightly uplifted beachrocks at Diolkos (see yellow arrows; photograph: Niki Evelpidou, 20 June 2020).
Geosciences 13 00329 g005
Figure 6. (a) Uplifted carbonate rocks bearing Lithophaga and other mollusk shells at Lechaion (Photograph: Niki Evelpidou, 30 July 2010); (b) Slightly uplifted beachrocks at Lechaion (photograph: Niki Evelpidou, 12 February 2012).
Geosciences 13 00329 g006aGeosciences 13 00329 g006b
Figure 7. Uplifted marine terrace in Perachora Peninsula (photograph: Niki Evelpidou, 20 June 2020).
Geosciences 13 00329 g007
Figure 8. (a) The four uplifted shorelines in Perachora Peninsula (photograph: Niki Evelpidou, 2 February 2015); (b) one of the uplifted tidal notches, where the Lithophaga borings can also be seen (photograph: Niki Evelpidou, 31 July 2010).
Geosciences 13 00329 g008aGeosciences 13 00329 g008b
Figure 9. (a,b) Submerged tidal notches in the northern Corinthian Gulf, south of Antikyra (see location in Figure 1; photographs: Niki Evelpidou, 31 July 2010).
Geosciences 13 00329 g009
Figure 10. Map of the Gulf of Corinth showing geomorphological sites with uplift data (in mm/a) Blue circle size is proportional to uplift rate. The details on each site are reported in Appendix B, Table A1.
Geosciences 13 00329 g010
Figure 11. Map of the Gulf of Corinth showing trends of GNSS velocity vectors (vertical component). Sense of motion of the vector (up–down) indicates uplift (blue arrowhead) or subsidence (red arrowhead), respectively. Thin lines are active faults (NOAFAULTs database; [182]). Red boxes indicate the location of stations.
Geosciences 13 00329 g011
Table 1. List of GNSS stations around the Gulf of Corinth and their vertical velocities (after Briole et al. [19]). Vup is vertical velocity (in mm/a), Sd is standard deviation.
Longitude (°)Latitude (°)Vup (mm/a)Sd (mm/a)Station Code
23.12337.9390.22.1AGTH
22.07338.2423.51.1AIGI
23.44037.7341.40.9AIGU
22.07538.255−0.81.7EGIO
21.92838.427−1.40.6EYPA
22.39238.375−2.31.1GALA
22.43038.431−1.80.9ITEA
22.42738.434−1.31.1ITEU
22.10238.031−0.71.2KALA
22.75038.014−1.71.1KIAT
22.93137.9420.50.6KORI
22.04638.209−1.00.7KOUN
22.61837.9720.61.1KRYO
21.97338.3201.71.0LAMB
22.86538.4401.31.2LIVA
22.18438.322−0.80.7PSAR
21.87138.329−3.41.0PSAT
22.07338.365−2.10.6TRIZ
22.13538.2342.30.9VALI
21.91238.385−6.21.0XILI
Disclaimer/Publisher’s Note: The statements, opinions and data contained in all publications are solely those of the individual author(s) and contributor(s) and not of MDPI and/or the editor(s). MDPI and/or the editor(s) disclaim responsibility for any injury to people or property resulting from any ideas, methods, instructions or products referred to in the content.