Article

Comparison of Rating Systems for Alberta Rock Slopes, and Assessment of Applicability for Geotechnical Asset Management

by
Taylor Del Gerhard Wollenberg-Barron
1,*,
Renato Macciotta Pulisci
1,
Chris Gräpel
2,
Kristen Tappenden
3 and
Roger Skirrow
3
1
UAlberta Geotechnical Centre, University of Alberta, Edmonton, AB T6G 1H9, Canada
2
Klohn Crippen Berger Ltd., Edmonton, AB T6E 5Z9, Canada
3
Alberta Transportation and Economic Corridors, Edmonton, AB T6B 2X3, Canada
*
Author to whom correspondence should be addressed.
Geosciences 2023, 13(11), 348; https://doi.org/10.3390/geosciences13110348
Submission received: 10 October 2023 / Revised: 31 October 2023 / Accepted: 7 November 2023 / Published: 14 November 2023

Abstract

:
In 1999, Alberta Transportation and Economic Corridors (TEC) implemented the Geohazard Risk Management Program (GRMP) to identify, assess, monitor, and prioritize the mitigation of risk resulting from geohazard events at specific sites along the provincial highway network. The GRMP was developed to address a variety of geohazard types including rockfall hazards that occur at natural and constructed (cut) highway backslopes. An evaluation of various methods for the condition assessment of rockfall geohazards, including TEC’s current GRMP risk rating system, has been completed with the intent of better understanding the suitability of each method as TEC transitions to a formalized GAM program. The GRMP risk rating values for selected rockfall geohazard sites along highway corridors in Alberta were compared to values developed from the results of five established rock mass and rock slope rating systems. The results of this study demonstrate that TEC’s current GRMP risk rating system is a viable tool for the condition assessment and performance monitoring of rockfall geohazards, which could be utilized within a formalized GAM program, further benefitting from years of recorded application in Alberta. Of the other rating systems tested, the rockfall hazard rating system (RHRS) showed a strong correlation with the GRMP risk rating while Q-Slope, the Geological Strength Index (GSI) and Rock Mass Rating (RMR) correlation were marginal but displayed a potential for use as condition assessment tools. The work presented in this paper provides the first evaluation of rock slope rating systems for rockfall hazards along corridors in Alberta, directly comparing them to the slope performance as observed by TEC in a quantitative manner.

1. Introduction

The concept of asset management, in a formalized sense, has been present in the minds of civil engineers for nearly half a century, with the earliest implementation of Transportation Asset Management (TAM) programs dating back to the 1980s and 1990s [1]. One definition of asset management by the American Association of State Highway and Transportation Officials (AASHTO) is a “strategic and systematic process of operating, maintaining, upgrading, and expanding physical assets effectively throughout their life cycle [2] (p. 4)”. Although the definition may differ depending on the types of assets present, the goal of an asset management program is to build, operate, and maintain assets in a cost-effective manner in the hopes to inevitably improve asset performance [1].
Geotechnical Asset Management (GAM) has emerged from TAM due to the impact and interrelated performance of geotechnical assets on transportation infrastructure. Geotechnical assets may range from inclusive to completely exclusive of transportation assets. Examples of inclusive assets are culverts, drainage ditches, bridge foundations, and pavement subgrade. Exclusively or partially exclusive geotechnical assets comprise both natural and constructed assets, including rock and soil slopes, embankments, retaining structures, and tunnels [3]. These lists are not exhaustive and often vary depending on the GAM owner requirements.
GAM includes an undeniable degree of increased uncertainty when compared to TAM. This uncertainty may be attributed to natural variability and/or knowledge uncertainty. Natural variability can be both spatial and temporal, e.g., changes in soil and rock stratigraphy, material strengths, and presence of groundwater. Knowledge uncertainty is associated with a lack of data regarding past events or lack of understanding of the physical laws or processes taking place within a particular geotechnical asset [4]. For GAM, this means similar assets with varying geological conditions may require different measures to quantify and evaluate asset performance.
Alberta Transportation and Economic Corridors (TEC) is currently working toward the development of a formalized GAM program to enhance the province’s ability to monitor the condition and deterioration of geotechnical assets and to effectively prioritize candidate mitigation projects based on the risk an asset poses to highway safety and efficiency. This requires the assessment of available tools to effectively collect and manage data for evidence-based decision making when prioritizing investments and advocating for future funding needs [5]. TEC has documented approximately 500 geohazard sites, 250 of which are actively monitored through the department’s Geohazard Risk Management Program (GRMP) [5]. The GRMP inventory includes soil and rock slopes, highway embankments, retaining walls, and highway subgrades [6]. These sites are assessed using TEC’s GRMP risk level rating methodology, presented in Section 2.1, which allows the direct comparison of relative risk level for earthflow and debris flow, rockfall, and erosion geohazards. Geotechnical asset management programs include several asset classes, as described above, and may encounter difficulty when cross-asset comparisons are undertaken to establish capital funding distributions. The concept of risk can be useful to determine which sites are in more urgent need of remediation. In the interests of furthering a risk-based GAM program, TEC can benefit from research that progresses the development of a framework to provide a morphological inspection and monitoring basis for rockfall geohazards.
This study focuses on the tools available to assess and monitor rockfall geohazards, which are some of the more frequent geohazards encountered along highways in Alberta and around the world [7,8,9,10,11]. Rockfalls are a geomorphic process in which a rock block or mass travels downslope after it detaches from a slope [12]. The initiation of a rockfall event may be the result of several factors. Higgins et al. [12] describe two main influence categories: internal and external. Internal influences include lithology, discontinuities, and groundwater. External influences include climatic conditions [13,14,15], weathering, anthropogenic causes, earthquakes, and stress relief. Regardless of the influences, rockfalls from slopes comprising competent rock generally result from the characteristics of its discontinuities [16].
In this paper, rock slope and rock mass rating systems, including TEC’s GRMP risk rating system, are compared to evaluate their consistency and provide insight into the suitability of these methods as the basis for a future GAM program. The study involved application of the various rating systems to several rockfall-prone slopes along the Alberta highway network to test their practicability while considering future integration and consistency with monitored slope performance (e.g., deformation monitoring, rock fall frequencies). The paper presents the results of five rock mass and rock slope rating systems applied to eight rockfall geohazard sites in Alberta, which are compared against the documented GRMP risk rating values for each site. Although some of the selected rating systems are not intended to quantify risk, they were included regardless as widely accepted industry tools for characterizing rock slopes or rock masses that can provide a measure of the slope condition within a GAM framework. The selection of rating systems also considered the scope and limitations of TEC’s standard slope inspection tour. Due to the large number of slopes inspected, a relatively short period of time is available to assess each site. There is an understanding that sites identified as critical, indicated by their GRMP risk rating, would then be subject to a more comprehensive site investigation and laboratory analyses of the slope-forming materials as part of detailed site-specific hazard assessments. The sites were selected with the intention of capturing a wide range of risk levels. Three of the included sites with relatively high GRMP risk ratings have existing remote sensing data that will be incorporated with the results of this study for the future evaluation of slope rating tools. A brief description of each geohazard site including the geologic context, available history of geohazard occurrences, and difficulties encountered during the application of each of the rating systems are also presented herein.

2. Rock Slope and Rock Mass Rating Systems

2.1. GRMP Risk Level Rating

TEC’s GRMP was established in 1999 with the objective of supporting and maintaining the safety and reliability of the province’s highway network [5]. The GRMP is TEC’s method for documenting unstable geohazard sites, assessing their relative risk, and determining strategies for both short-term and long-term risk management, maintenance, and rehabilitation [5].
The GRMP uses field inspection observations and instrumentation readings to assign a relative risk level (RL) rating on a scale of 1 to 200 for each geohazard site. The RL is calculated utilizing a multiplication-based rating system presented in Equation (1). A probability factor (PF) ranging on a scale from 1 to 20 and a consequence factor (CF) ranging on a scale of 1 to 10 are selected for each geohazard site, based upon the likelihood of a highway service disruption due to a geohazard occurrence, and the attendant consequences. The product of these factors results in the RL of the site. The PF, CF, and resulting RL are determined through a workshop style discussion on site between consultant representatives, TEC engineers, and local highway operations staff. This ensures the selected parameters reflect an aggregate of opinions from various perspectives.
Risk Level (RL) = (Probability Factor, PF) × (Consequence Factor, CF)
TEC has four tables of probability and consequence factors for (a) earth slides and debris flows, (b) rockfalls, (c) erosion, and (d) voids-dispersive soil sites to address the majority of geohazards that affect transportation corridors in Alberta [17]. The tables pertaining to the probability and consequence factors for rockfall geohazards are presented in Table 1 and Table 2, respectively. TEC and their consultants use these factors and corresponding RL to prioritize sites for intervention. The reliability of the GRMP risk rating system requires thoughtful deliberation when selecting appropriate parameter values. The scorers must consider the limitations imposed by visual inspection and the GRMP’s qualitative categories, such as limited access to the slope, height and distance from the slope, and information (or lack thereof) regarding historical geohazard activity for each site. Tappenden and Skirrow [5] acknowledge that the current GRMP risk rating system does not include a direct measure of risk exposure; low traffic volume highways can have the same RL as an analogous feature on a high traffic volume highway. Tappenden and Skirrow [5] suggest that this shortcoming could be mitigated for rock slopes with the inclusion of additional components incorporating a measure of the average annual daily traffic (AADT), which is similar to the Rockfall Hazard Rating System (RHRS) discussed further in Section 2.2.

2.2. Rockfall Hazard Rating System

The RHRS was published in the early 1990s following an extensive development and testing program, involving over 3000 sites, by the Oregon Department of Transportation in collaboration with several other United States transportation agencies and the Federal Highway Administration [18]. Their goal was to provide transportation departments with a rational way to make informed decisions on where and how to spend construction funds to reduce the risk associated with rockfall [18].
The RHRS uses an exponential scoring system of 12 categories, 10 of which are summed together to generate a hazard score. Categories cover a range of slope characteristics (slope height, geological character, and volume of rockfall/block size), environmental factors (climate and presence of water on slope), rockfall history, and traffic vulnerability (ditch effectiveness, average vehicle risk (AVR), decision sight distance, and road width) [19]. AVR is a value developed to estimate the amount of time a vehicle spends within a rockfall-prone area. AVR is calculated using Equation (2) based on the AADT, posted speed limit (PSL), and length of a slope (LS) [19]. With the inclusion of categories which cover rockfall consequences, the RHRS may be directly compared to the GRMP RL.
AVR = 100% × (ADT (vehicles/day) × (LS(km))/24 (h/day))/PSL (km/h))
Slopes with scores below 300 may be considered as low priority, while slopes with scores over 500 are considered urgent priority for remedial action [20,21]. After its conception, the RHRS has been directly adopted or modified for use by at least 25 Departments of Transportation (DOTs) of US states [22]. Through its extensive use, it has proven to be a capable tool for the preliminary risk assessment of rock slopes and the development of asset inventories to facilitate the implementation of GAM programs. The simplicity of the RHRS allows for the categorization of vast slope databases without requiring specialized training, equipment, or subsurface exploration. The simplicity of the RHRS does not come without some downfalls: the subjective terminology for several of the RHRS categories may introduce inconsistency between different scorers [23], some of the internal and external influences known to contribute to rockfalls are not captured, and only two parameters exist to gauge the impact of geologic conditions which may lead to high scoring when the geological conditions are unlikely to produce rockfalls [24].

2.3. Modified Colorado Rockfall Hazard Rating System

The current version of Colorado’s RHRS was developed at the Colorado School of Mines [24,25]. The significantly increased complexity of the modified Colorado RHRS (CRHRS), compared to its predecessor, mitigates some of the limitations present in the original RHRS. While the original RHRS uses the sum of 10 parameters to determine the slope score, the CRHRS increases the number of parameters to 21. The CRHRS breaks down the geologic character of a slope into three categories: sedimentary rock, crystalline rock, and block-in-matrix, e.g., conglomerates and till, each with differing hazard morphology and trigger characteristics. These additions help the scorer distinguish between failure mechanisms and structural influences. For the sedimentary rock categories, Jar Slake test [26] results are required for scoring. A modified Jar Slake testing procedure was proposed by Santi et al. [25] to improve the consistency of the results and make the test more “field friendly”. This testing procedure was reviewed, and the Colorado Department of Transportation [27] published testing procedures to determine the Jar Slake category scores for each of the applicable Alberta study areas.
The CRHRS also incorporates three additional parameters to better account for climatic factors, including score ranges for annual precipitation, annual freeze–thaw cycles, and slope aspect. The collection and review of weather data is required to address the categories pertaining to the average yearly precipitation and number of freeze–thaw cycles. For this study, the Alberta Climate Service [28] database was used to collect daily and monthly precipitation and air temperature data near the project sites. The CRHRS also revised several other parameters from the original RHRS to reduce the subjectivity by providing specific ranges for scoring. The goal for these modifications was to ultimately improve the consistency of the scoring system while increasing its complexity and requiring more specific geotechnical training and measurement tools to properly implement. Considering its advantages and disadvantages, the CRHRS was accepted in this study as a refined RHRS model developed in a similar geologic and climatic setting as Alberta’s transportation corridors, and it is suitable for direct comparison to the GRMP RL.

2.4. Q-Slope

The original Q-system introduced by Barton et al. [29] is a rock mass classification method with the capability of providing tunnel support and reinforcement design recommendations. After nearly 60 years of use, the Q-System remains a staple tool in geotechnical engineering, having been applied in thousands of civil and mining engineering projects around the world [30]. The Q-Slope System, introduced by Barton and Bar [31], is intended for use on slope cuts adjacent to roads or railways and benches of open pit mines [32]. Q-Slope uses the same six parameters as the original Q-System with some modifications to account for different structurally controlled failure mechanisms, a wider range of environmental conditions, and additional reduction factors relevant to slopes [32]. The Q-Slope system is essentially a function of three parameters: block size (RQD/Jn); shear strength of the least favorable joint set or average shear strength for potential wedge failure (Jr/Ja)0; and external influences including environmental and in situ stress (Jwice/SRFslope) [33]. Equation (3) presents the modified parameters to determine the Q-Slope value.
Q-Slope = (RQD/Jn) × (Ja/Ja)0 × (Jwice/SRFslope)
Equation (4) then allows the calculated Q-Slope value to be converted into a theoretical steepest slope angle (β) not requiring support by reinforcement [31].
β = 20 × log10 (Q-Slope) + 65°
The input parameters for Q-Slope are amenable to visual slope inspections, with the exception of the Rock Quality Designation (RQD) which requires direct measurement from rock cores. Applicability through visual inspection alone has positive implications for Q-Slope’s viability when applied to GAM, although more specialized training and geological experience is required to select appropriate rock mass and discontinuity parameters. A major limitation of Q-Slope, which appears as a common limitation for many rock mass rating systems, is that it was not developed as a tool to quantify risk and can only rationally be correlated to the GRMP PF and not the overall RL. Q-slope values range from 0.001 (exceptionally poor) to 1000 (exceptionally good).

2.5. Geological Strength Index

The Geological Strength Index (GSI) was first introduced by Hoek [34] and Hoek et al. [35] as a system to estimate the reduction in rock mass strength for various geological conditions [36]. The parameters of the generalized Hoek–Brown failure criterion incorporate GSI so that rock mass strength can be estimated for larger scales on the basis of intact rock samples and rock mass characteristics [37]. The GSI was established as a rock mass characterization tool which accounts for the two principal factors influencing the mechanical properties of a rock mass: the structure and condition of its joints [38]. The two categories required to determine the GSI of a rock mass reflect the principal factors discussed above, i.e., the structure and surface condition of joints/discontinuities. Both categories can be assessed through the visual inspection of slopes or outcrops for a variety of rock masses. It should be noted that the GSI is a qualitative approach that requires specialized geological experience to implement in a repeatable and reliable manner. Furthermore, it was originally envisioned for different degrees of “blockiness” of the rock mass and not for addressing near-intact ranges or very sheared and altered masses, where soil-like behavior exerts significant influence. Even so, experienced practitioners should expect a range of potential values and avoid isolating a single value. Typical GSI ranges for a variety of rock types have been published by Marinos and Hoek [39] to assist practitioners in the application of GSI.
GSI has no capability to quantify risk or assist in support/reinforcement design like Rock Mass Rating (RMR) or the Q-System [40]. With only two categories required to determine GSI, it is an efficient tool for the assessment of rock that can be applied quickly in the field via visual inspection and therefore implemented at multiple sites during highway inspections covering hundreds of kilometers. For this study, GSI will be compared against the GRMP PF, as it cannot directly quantify risk or consequence. Theoretically, GSI does not measure likelihood of failure either, i.e., two slopes with the same geology but vastly different likelihood of failure would score the same. For these reasons, the applicability of GSI with regard to GAM implementation remains unclear. Since GSI is not intended for rock masses with a clearly defined dominant structural orientation [40] or with structurally dependent gravitational instability [37], it has limited applicability as a GAM assessment tool in the context of Alberta’s geohazards comprising sedimentary deposits. Marinos et al. [40] noted that GSI can still be applied, with caution, if the rock’s anisotropy does not control its failure.

2.6. Rock Mass Rating

The Rock Mass Rating (RMR) system was originally introduced by Bieniawski [41] and refined over the next 15 years through successful application to many civil and mining engineering related projects. A commonly used version of the RMR system was published in 1989 [42]. The RMR system utilizes six rock mass parameters for individual structural regions:
  • Uniaxial compressive strength of the rock;
  • Rock Quality Designation (RQD);
  • Spacing of discontinuities;
  • Condition of discontinuities;
  • Groundwater condition; and
  • Orientation of discontinuities.
Values are assigned to ranges of the six parameters and summed to determine the RMR score. RMR was originally developed for the tunnelling and mining sectors for which it is widely use [43] but is also applicable to slopes [44]. Since the RMR requires measured values to fall within specified ranges for each of the six input parameters, it is very challenging and subjective when applied to a slope using visual inspection alone. The method requires additional time, laboratory and field resources, and specialized geotechnical training. This is exacerbated by the lack of published guidelines for the definition of each class of the orientation of discontinuities factor. Romana et al. [45] notes that this parameter was very difficult to apply due to the extreme range of this factor.
The viability of RMR as an economically feasible asset condition assessment method as part of a GAM plan remains in question, especially since it does not account for the consequence of failure. Therefore, the resulting RMR score, similarly to Q-Slope and GSI, should only be compared with the GRMP PF, not the overall RL. Equation (5) was established as a correlation between GSI and the 1989 version of RMR by Hoek and Brown [36].
GSI = RMR89′ − 5
Hoek and Brown [36] note that RMR is unreliable for very poor-quality rock masses (GSI < 25). The use of this relationship increases the viability of RMR for use in this study as a means of verifying GSI values gathered through visual inspection alone. Note that the RMR89′ indicates that the groundwater rating parameter is set to 15 and the orientation of discontinuities parameter is set to zero. The Slope Mass Rating (SMR) system [46] uses four additional parameters to the RMR system to address the range of failure modes that impact slopes. These parameters were added to an earlier version of the RMR system prior to the introduction of the ‘Orientation of discontinuities’ factor. The SMR system was considered for use in this research but ultimately was not included since detailed rock mapping was considered outside the scope of TEC’s standard slope inspection tour. This does not discredit SMR as a valuable tool for assessing rock slopes, which has seen success worldwide as a tool for preliminary slope assessment [45].

3. Study Sites

Rock slopes were selected for inclusion in this study primarily based on their GRMP RL to provide a broad range of values for comparison. Three sites included in this research were previously recommended for additional monitoring and have several years of remote sensing data. Some selected sites with corresponding low RL are categorized by TEC as ‘expired’, meaning they have not been recently active and are no longer being regularly inspected. The historical records are limited for some of these sites with more than a decade since their last official inspection. This issue is compounded over time as institutional memory of these sites fades. The sites with higher RL ratings, which remain unmitigated due to funding limitations and hence are subject to continued rockfall activity, are inspected annually as part of TEC’s GRMP.
The slope inspections and application of rating systems were completed on 12 November 2021 for site C018 in Central Alberta and between 24 and 25 September 2022 for sites S018, S020, S042, S057, S070, and S074 in Southern Alberta. Limited tools were required for the application of the selected rating systems, which included the following: a range finder with a built-in clinometer, a 2 m long measuring stick, and two measuring tapes with lengths of 6 m and 30 m. Preliminary ratings developed for C018 were published by Wollenberg-Barron et al. [47] and have been updated for inclusion in this study. The locations of the study sites and representative photographs are shown in Figure 1.

3.1. C018—Red Deer River Valley Slope Instability

Site C018, the Red Deer River Valley Slope Instability, is located along Highway 837:02 approximately 14 km northwest of Drumheller, Alberta. The AADT at this location is 294 vehicles per day (vpd). The slope bedrock is part of the Horseshoe Canyon formation comprising feldspathic sandstone interbedded with siltstone, bentonitic mudstone, carbonaceous mudstone, concretionary sideritic layers, and laterally continuous coal seams [49]. The highly disaggregated nature of the sedimentary deposits at C018 lead to a variety of complex failure mechanisms on the backslope above the highway. The active portion of C018 is approximately 60 m high and extends approximately 500 m along the highway adjacent to the Red Deer River.
From TEC’s records, Highway 837 was constructed in the 1980s and was identified early on as a geohazard site that may require reinforcement or protective measures. A nominal ditch was constructed along the highway, at the toe of the backslope, but no other improvement work was undertaken at that time [50]. C018 has been included in TEC’s annual Central Region geohazards inspection tour since 2001. Up until 2017, riverbank erosion and instability on the downslope side of the highway embankment was the primary concern at C018; this was mitigated by reconstructing the slope with geogrid reinforcement and armoring the toe of the slope with riprap. An annual to biannual remote sensing program utilizing drone photogrammetry was implemented at C018 in 2017 following a rockfall of blocky frozen material from the backslope above the highway. Other major events occurred through 2017 and 2018 including an earthflow, translational slide, and additional rockfalls. These hazards resulted in the installation of jersey barriers to contain the fallen debris, reducing Highway 837 to one-lane-alternating traffic. Change detection analysis for C018 between 2017 and 2019 was previously published by Rodriguez et al. [51] and Roustaei et al. [49]. Additional details regarding the initial slope ratings from the 12 November 2021 inspection and difficulties encountered during the inspection of C018 are presented in Wollenberg-Barron et al. [47].

3.2. S018—Galatea Creek Rock Cut

Site S018, the Galatea Creek Rock Cut, is located along Highway 40, approximately 32 km south of the junction between Highway 40 and Highway 1, in southwest Alberta. This portion of Highway 40 has an AADT of 2530 vpd. The slope consists of dark gray shale to siltstone with some white quartz inclusions [52]. The S018 backslope is approximately 18 m high and 310 m long along the highway.
The highway through-cut at S018 was originally constructed in the 1970s. According to TEC’s records, the S018 backslope rock cut was initially inspected in 2004 and has been included in TEC’s annual Southern Region geohazards inspection tour since 2007. Rock bolts were installed at the site—possibly during the original highway construction. In 2016, additional rockfall mitigation comprising a high tensile strength mesh drape was installed, covering most of the eastern slope. This analysis focuses on the eastern portion of the cut due to its historically higher RL recorded via the GRMP.
During the time of the inspection, numerous fallen rocks were present in the eastern ditch along the highway. Most of the observed debris had accumulated at three locations along the toe of the backslope but had not reached the highway due to the effectiveness of the wire mesh rockfall drape. The unfavorable orientation of the sedimentary bedding plane daylighting out of the slope at S018 leads to planar sliding, while wedge failures were observed where a perpendicular joint set, sub-parallel to the slope face, intersects the bedding plane. Rockfall blocks noted at the site ranged from gravel to boulder sizes. Due to the high volume of traffic at the time of the inspection, some slope and highway measurements could not be collected due to safety considerations. It was necessary to estimate the highway width using a range finder with a built-in clinometer.

3.3. S020—Highwood House Rockfall Hazard

Site S020, the Highwood House Rockfall Hazard, is located along Highway 541:02, approximately 800 m east of the junction between Highways 40, 541, and 940. This portion of Highway 541 has an AADT of 647 vpd. The backslope above the highway comprises interbedded coal, shale, mudstone, and sandstone with a sub-vertical bedding plane. The mudstone and sandstone are notably less weathered than the coal and shale [53]. Geological maps corroborate this assessment, indicating the slope is composed of Mesozoic sandstone, shale, and coal [54]. S020 measures approximately 150 m long and 35 m high with an erosion gully at the west end of the site extending beyond the crest of the backslope (approximately 50 m in length).
Highway 541 and the rock cut at S020 were originally constructed in the 1970s. TEC records indicate S020 was initially inspected in 2004 and has been included in TEC’s annual Southern Region geohazards inspection tour since 2007. Remote sensing data, via drone photogrammetry, have been collected at S020 between 2020 and 2022, which provides a database for calculating the slope surface change that can be used to correlate visual inspections and slope performance.
At the time of the inspection, rockfall debris had collected at the toe of the cut slope across nearly the entire length of the slope. The largest quantity of rockfalls had accumulated below the western portion of the slope underneath an erosion gully which extends above the rock slope. This is likely attributed to both erosion of the surficial soils and the higher degree of differential weathering leading to undercutting of the rock mass within the gully. The gully has formed above the slope, leaving loose blocks and boulders within the soil at the brow of the slope that will eventually fall. Other failure mechanisms present include the raveling of coal layers, which acts to reduce the confinement of the surrounding rock and leads to further rockfalls. Block toppling is also marginally possible along the slope face with joints nearly parallel to the slope face. Rockfall block sizes noted during the inspection ranged from sand to boulder sizes. Due to the high degree of activity at S020, with small rockfalls of sand to gravel sizes occurring during the inspection, approaching the slope for RQD measurements was deemed unsafe. Estimates of the rock masses RQD had to be taken at less active portions of the slope and later corroborated with slope imagery.

3.4. S042—Spray Lakes Rockfall

Site S042, the Spray Lakes Rockfall, is located on Highway 742 (Spray Lakes Road) approximately 5 km southwest of Canmore, Alberta. This portion of Highway 742 is gravel surfaced and has an AADT of 1468 vpd. S042 is located in the Mount Rundle range which comprises Paleozoic limestones, dolomitic limestones, dolostones, and shales which have been thrust onto the sedimentary rocks present in the Bow Valley [55]. The north portion of S042 (S042-North), with an eastern slope aspect, extends approximately 200 m while the south portion (S042-South), with a southern slope aspect, extends approximately 110 m. The slope has a maximum height of approximately 165 m. A broad talus slope has developed along the base of the slope which narrows significantly at the transition between the two opposing slope aspects.
From the information available, S042 was identified as a rockfall geohazard before 2009 and included multiple locations along a 2.3 km section of Highway 742 which includes the S042—Spray Lakes Rockfall site. A call-out inspection was conducted in 2013 following a relatively large rockfall event that narrowly missed a vehicle and group of people traveling along Highway 742 [56]. Since then, S042 has been included in TEC’s annual Southern Region geohazards inspection tour. An annual remote sensing program utilizing ground-based LiDAR was initiated in 2018 for the S042 site, which has initiated a database for calculating slope surface change that can be used to correlate visual inspections and slope performance.
Slope ratings were developed for both S042-North and S042-South to accommodate the opposing slope aspects and capture the relative difference in rock mass quality and rockfall potential. At the time of inspection, rockfall debris appeared to have recently been cleared from the roadway by highway maintenance staff and was concentrated across the base of the talus slope forming a small berm. The majority of rockfall was concentrated toward the center of the slope, coinciding with the decrease in the talus slope height and presence of a catch fence installed at that location between 2016 and 2017. It is difficult to determine if the accumulation of rockfalls at the base of the broad talus slope is a result of detachment from the rock slope above the talus or attenuation and sloughing of talus slope itself. A kinematic analysis presented in Macciotta et al. [55] found that wedge failure is the most probable failure mechanisms at S042, and planar sliding is possible along the northern slope. To estimate the RQD of the rock mass, measurements were made on a rock outcrop adjacent to the highway. The distance from the highway to the rock slope introduces some uncertainty when transposing road-side outcrop rock mass properties to the upper rock slope.

3.5. S057—Highway 1A, Exshaw

Site S057, Hwy 1A, Exshaw, consists of two rock-cut slopes, Site A and Site B. This portion of Highway 1A has an AADT of 3781 vpd. The sites comprise the cut backslopes along Highway 1A:02 between kilometer 12.52 and 11.91, approximately 2 km northwest of the Hamlet of Exshaw, Alberta. Geological maps of the area indicate S057 is part of the Exshaw and Banff formations, comprising Paleozoic silty limestone, calcareous siltstone, shale, and siltstone [57]. While both sites have similar geology, Site A is in a more advanced state of weathering. Both slopes have a height of approximately 15 m. Site A and Site B extend approximately 210 m and 300 m, respectively, along the eastbound lane of the highway.
TEC records of S057 date back to a rock slope scaling program carried out along Highway 1A in the early 2000s. Although identified as a potential rockfall geohazard, S057 was not included in the annual Southern Region geohazards inspection tour until 2019, when the highway maintenance contractor reported an unusually high amount of rockfall debris had accumulated in the catchment ditch [58]. Prior to 2019, periodic clearing of rockfalls from the ditches and road surface at S057 was carried out as part of routine road maintenance.

3.5.1. Site A

At the time of the inspection at S057—Site A, the majority of rockfall debris was present at the toe of the backslope, which was concentrated in three primary locations where the bedding plane adversely dips out of the slope and intersects another joint set, creating collection chutes. This intersection leads to rockfalls via planar sliding and wedge failure. Most of the rockfall blocks contained in the catchment ditches were relatively small, gravel to cobbles sizes, while there were larger blocks present with multiple boulders in one of the chutes. No notable difficulties were encountered at S057 Site A when applying the rating systems.

3.5.2. Site B

When inspecting S057—Site B, rockfall blocks present were, on average, larger than those at Site A, including cobble and boulder sizes. Accumulation of rockfall debris along the toe of the backslope was more evenly distributed than Site A apart from two locations where boulder-sized rockfall blocks were concentrated. These locations displayed evidence of structurally controlled wedge failures related to intersecting joint sets and possible planar sliding along a prominent bedding plane. A small berm of rockfall debris was present off the shoulder of the highway, indicating recent highway maintenance efforts to remove rockfall blocks from the highway shoulder. During the inspection, mountain goats were seen traversing the crest of the slope while appearing to bypass Site A, which could be attributed to the higher degree of rockfalls present at this site. Similar to Site A, no notable difficulties were encountered when applying the rating systems.

3.6. S070—East of Fir Creek Rock Cut

Site S070, East of Fir Creek Rock Cut, is situated along Highway 541:02 approximately 7 km east of the junction between Highways 40, 541, and 940 at Highwood House. This portion of Highway 541 has an AADT of 647 vpd. Geology maps for the area are dated but indicate the slope is comprised of Mesozoic sandstone, shale, and coal of the Kootenay and Blairmore formations [54]; additionally, conglomerates were noted within the slope during the field inspection. The varying stratum are interbedded with a sub-vertical bedding plane. The slope has a measured height of approximately 22 m and extends approximately 70 m along the highway.
Slope history for S070 as a geohazard site is limited. The first available inspection report dates back to a 2005 Highway 40/Highway 541 corridor review. The next inspection of S070 was conducted in 2009, and the consultant recommended that S070 presented minimal risk to highway operations and could be discontinued from the annual GRMP inspection tour [59].
At the time of the inspection, a significant accumulation of rockfalls and sediment was concentrated at the base of an erosion channel near the western extent of the slope. The channel appears to be facilitating the transport of eroded surficial soils from the crest of the slope, accelerating the erosion of the rock slope at this location. Coal dominates the east portion of the slope where raveling leads to the loss of confinement around more competent sedimentary layers, which leads to further weakening and rockfalls along the slope face. This mechanism also presents itself along the western portion of the slope, where differential weathering of weaker layers is evident. Block toppling is also marginally possible along the western slope with joints nearly parallel to the slope face. Gravel- to cobble-sized rockfalls have accumulated at the toe below this portion of S070. Other rockfalls ranging from gravel to boulder sizes were present along the toe of the slope just off the shoulder of the highway. There were boulders noted resting at the brow of the slope that are likely to fall in the future and may impact the road surface.

3.7. S074—Lipsett Ridge Rock Cut

Site S074, the Lipsett Ridge Rock Cut, is located along Highway 40:12, approximately 28 km south and 26 km north of the junction with Highway 742 and Highway 40, respectively. This portion of Highway 30 has an AADT of 560 vpd. The slope comprises Mesozoic sandstone, siltstone, coal, mudstone, and shale [60]. The slope has an adverse bedding plane orientation, dipping toward the highway. The slope is approximately 10 m high and extends approximately 210 m along the highway.
Limited information regarding S074 is available from TEC records. One inspection was conducted as part of a 2005 Highway 40/Highway 541 corridor review [61]. At the time of the inspection, significant differential erosion between the interbedded weak coal and other sedimentary deposits has resulted in large overhangs and the accumulation of rockfalls at five locations along the toe of the slope. This appears to be the dominant mechanism leading to rockfalls at this site. Planar sliding and wedge failure are also possible due to the very unfavorable bedding plane orientation and intersecting joint sets. The rockfall blocks range from sand to boulder sizes. Although no rockfalls are known to have reached the road surface, the effectiveness of the ditch has been significantly diminished. At the most prominent overhang, a large rock block has released from the rock face and will eventually release from the slope, possibly impacting the road surface.

4. Rating System Results and Discussion

To quantify the varying risk associated with different slope failure mechanisms and rockfall block volumes, multiple GRMP RLs have been published for C018 and S042. KCB [62] introduced three separate RLs for C018 following the major events in 2017 discussed in Section 3.1. RLs were generated to cover the varying failure mechanisms present at the site: for event volumes greater than 0.5 m3 (C018-L), less than 0.5 m3 (C018-S), and for earth slide events. To capture the impact of increased failure event volume on the applicable rating systems, a volume of 10 m3 was selected to represent an event greater than 0.5 m3. With historical event volumes upwards of 500 m3 recorded at C018, this is considered conservative for a major event while having a significant impact on the applicable rating systems. For this study, the RL for an earthside event was not included, as the rating systems selected are intended to assess rockfall events. Similar to C018, AMEC [56] introduced two RLs for S042 following the rockfall event in 2013 which was applied to both the north and south slopes, resulting in four individual S042 ratings. These distinguished the relative difference in RL for small (S042-North-S and S042-South-S), or frequent, and large (S042-North-L and S042-South-L), or infrequent, rockfall block volumes corresponding to isolated rockfalls from block detachment and larger wedge failures, respectively. Large rockfall blocks volumes were defined as greater than 15 m3 by KCB [63]. The small rockfall block volume was selected as less than 0.3 m3 following the observations and analysis presented in Macciotta et al. [13] and Macciotta et al. [55] for S042. Subsequently, for the changes in rockfall event volumes, the Rockfall History and Rockfall Frequency categories pertaining to the RHRS and CRHRS, respectively, were adjusted to reflect the likelihood of the varying volumes. Note that small and large rockfall block volumes were applied to both the north and south slope portions of S042. The varying RLs associated with different failure mechanisms were incorporated into this study as additional data points to analyze the effectiveness of each rating system at capturing the change. The inclusion of the additional RL data increased the total number of slopes to 12 for each of the following comparative analyses. The GRMP ratings, estimated slope angles, and results of each rock slope and rock mass rating system for each study area are presented in Table 3 and may be inspected together with the slope photos presented in Figure 1.

4.1. RHRS and CRHRS

With categories to assign values for both probability and consequence, as discussed in Section 2.2 and Section 2.3, RHRS and CRHRS were compared directly against the GRMP RL. Traffic data to determine the AVR for both the RHRS and CRHRS were gathered for each of the study areas using the weighed annual average daily traffic (WAADT) published by TEC [64]. The WAADT is a synthesis of several AADT point volumes into a single value.
The minimum and maximum possible scores for the RHRS are 20 and 905, respectively. The RHRS scores for the sites range from 234 to 512; seven sites scored below 300 indicating low priority, four were between 300 and 500 indicating moderate priority, and one was over 500: C018-L, indicating urgent priority. The slopes scoring well below 300, i.e., S070 and S074, are currently “expired” sites and were last assigned GRMP RLs in 2009 and 2006, respectively. The resulting low RHRS scores gives credence to TEC’s decision to retire these sites. The other four sites scoring below 300 only did so by a small margin, and due to the subjectivity of the RHRS categories, they may fall above 300 if conditions encountered during scoring were interpreted differently. Slopes scoring between 300 and 500 included C018-S, S020, and both S042-North-L and S042-South-L. A linear trendline was applied to Figure 2a to measure the degree of correlation between the prescribed GRMP RL and RHRS scores. The resulting coefficient of determination (R2) was quite high with a value of 0.87 for the 12 data points.
The CRHRS scores ranged from 735 to 849 for the sites. The minimum and maximum possible scores for the CRHRS are 63 and 1701, respectively. The CRHRS system is more complex to implement, and there is no provision for determining site priority. It is therefore not a simple matter to determine a rock slope’s priority level on an individual basis. The method developers’ intentions were to have CRHRS results stand out more so that high rockfall hazard sites would be more easily identifiable [25]. The results of this study seem contradictory to this intention with the total range of CRHRS scores much less than that of the RHRS scores. This is likely an effect of selecting slopes with pre-existing rockfall potential, which inherently score higher. A total of nine Jar Slake tests were conducted, three tests for samples collected from S057-A, S057-B, and S070 as representative geologic samples to estimate the Jar Slake results for S018, S020, and S074. All nine samples were non-reactive after 30 min of submersion. The slaking potential of samples from C018 was previously tested by Roustaei et al. [49] where two out of three samples began to disaggregate after 24 h of submersion.
The resulting R2 value of 0.20 indicates a poor correlation between GRMP RL and CRHRS. The suspected reasoning for the low R2 value is attributed to the complexity of the CRHRS and relatively low range of scores between the study areas. The summation of 21 category scores provides ample opportunity to deviate from the GRMP RL and potentially diminish or mask features that could have a marked influence on the probability of rockfalls. The most significant CRHRS outliers were S042-South-L, S042-South-S, and S018.
S042-South-S and S042-South-L resulted in the highest CRHRS scores of all the slopes included in this study as well as the greatest deviations from the GRMP RL trend. Between S042-South-L and S042-South-S, the only change in scoring is attributed to Block Size/Volume and Rockfall Frequency. The deviation is largely attributed to the Slope Aspect CRHRS category. The change in slope aspect from the northern to southern slope portions increase the overall S042-South CRHRS scores by 72 points. The rockfall mitigation measures installed at S018, while not captured by the RHRS categories, reduced the CRHRS Ditch Catchment category, which stipulates a scoring of 3 (lowest possible score) if mitigation measures exist. Without the mesh drape, the CRHRS score for S018 would have been 24 points higher.
The RHRS and CRHRS scores were compared directly (Figure 2c) to review the impact of the additional parameters at each of the rock slopes. The significant deviation from the trend of S042-South-L, S042-South-S, and S018 resulted in an overall poor correlation between the two rating systems with an R2 value of 0.20. Excluding S042-South-S and S042-South-L from Figure 2b,c increases the R2 to 0.72 and 0.69, respectively. While having less than half of the total summed parameters, the relative risk of a slope is well predicted through the RHRS categories alone when taking the GRMP RL as a good proxy for the documented risks at these sites. A similar conclusion was reached via the statistical analysis conducted for the CRHRS [24,25], indicating that the total scores could be reasonably estimated measuring only four to six key parameters.

4.2. Q-Slope

The calculated Q-Slope values were directly plotted against the GRMP PF in Figure 3a with a corresponding R2 value of 0.40. Equation (3) was applied to each Q-slope value, and the difference from the actual slope angle and calculated β angle was plotted against the GRMP PF (Figure 3b) where the resulting R2 value was 0.48. Finally, each Q-Slope value was plotted on the Q-Slope stability chart (Figure 3c) to see where they lay within the published ranges of stable slopes, unstable slopes, or uncertain stability as a preliminary indicator for slope stability [31]. Although Q-Slope was developed to allow engineers to assess the changing stability of a slope in the field during construction, parameter selection is generally supplemented with borehole data [31]. Q-Slope values in this study were determined successfully via basic measurements and visual inspection with some engineering judgement and deployment of the field RQD measuring technique proposed by Hutchinson and Diederichs [65] for exposed rock walls. Due to the limited accuracy in measuring the actual slope angle at each site using a range finder with a digital clinometer, a general error range was applied to the values shown in Figure 3b,c of ± 5 degrees. For the sites with remote sensing data (C018, S020, and S042), the range was determined through the direct measurement of slopes with virtual surface models generated from available remote sensing data.
S042-North-S and S042-South-S were identified as outliers in the Q-Slope analysis, while S042-North-L and S042-South-L fit reasonably well. This is likely attributed to Q-Slope not accounting for rockfall event sizes; only the mechanism through which the r event occurs is accounted for by the application of appropriate O-factors. The increased GRMP PF between the two failure mechanisms results in a large deviation from the trend in Figure 3a,b. Additionally, it is worth noting that the Q-Slope Equation (4) was developed only for slope heights less than 30 m [33]. Considering S042 extends over 125 m high, a deviation from the trend of Figure 3b is not unexpected. The Q-Slope results of C018-S and C018-L plot well below the trend in Figure 3a,b. This is a product of highly disaggregated sedimentary rock present at the site. Furthermore, C018 is approximately 65 m high and, like S042, is beyond the intended slope height to apply Equation (4). The resulting Q-Slope value yields uncertain slope stability plotting outside the range of Figure 3c. S018 is an interesting case for Q-Slope, since multiple rockfall mitigation measures exist at the site (mesh drape and rock bolts). The Q-Slope adjustment factor for slope reinforcement measures utilized for this case does not appear to fully capture the reinforcement impact. No factor exists for mesh drapes, which theoretically diminishes the consequence of a rockfall event but is not captured by Q-Slope. While the S018 Q-Slope value shows good correlation with the trend in Figure 2a, it deviates significantly from the trend of Figure 2b. This is attributed to the definition of the β angle as the steepest slope angle not requiring reinforcement [33]. The fact that the β angle calculated more closely resembles the approximate dip angle of the bedding plane at S018 rather than the vertical slope cut gives credit to this reasoning. The same reasoning can be applied to explain why S018 plots well into the unstable slope range in Figure 3c. It is interesting to note that while S070 and S074 consistently correlate well with a relatively low RL and PF, they plot within the unstable slope portion of Figure 3c. The inclusion of these slopes in this study and their existence within TEC’s rockfall geohazard database serves as an indicator that they are, or have previously been, unstable. This logic applies to each of the nine slopes in this study, since none plot well inside the stable slope portion of Figure 3c.

4.3. GSI and RMR

A representative GSI range was assigned to each of the study sites based on visual inspection and detailed review. Due to the subjectivity of GSI’s categories and reliance on the geological expertise of the scorer for the selection of values, the GSI values were selected in the field and later reviewed by experienced practitioners in a workshop setting. Visual records are presented as material supplementary to this manuscript (Figures S1–S9). Another challenge was encountered when applying GSI to slopes comprising varying rock mass characteristics, i.e., S070 where coal dominates the eastern portion of the slope. In such a case, a GSI range must be determined for each rock mass and reported separately, or a weighted average could be used to provide a single range. For the purpose of this study, since only one site displayed such changes in rock mass characteristics, the GSI for each was weighted based on the estimated percent composition of the slope to determine an overall average GSI range. The same methodology was applied to adjust the RMR value for S070. Through visual inspection alone, it is not possible to determine the appropriate values for each of the RMR parameters. Some measurements of the rock face were required but were duplicate measurements from the determination of CRHRS and Q-Slope.
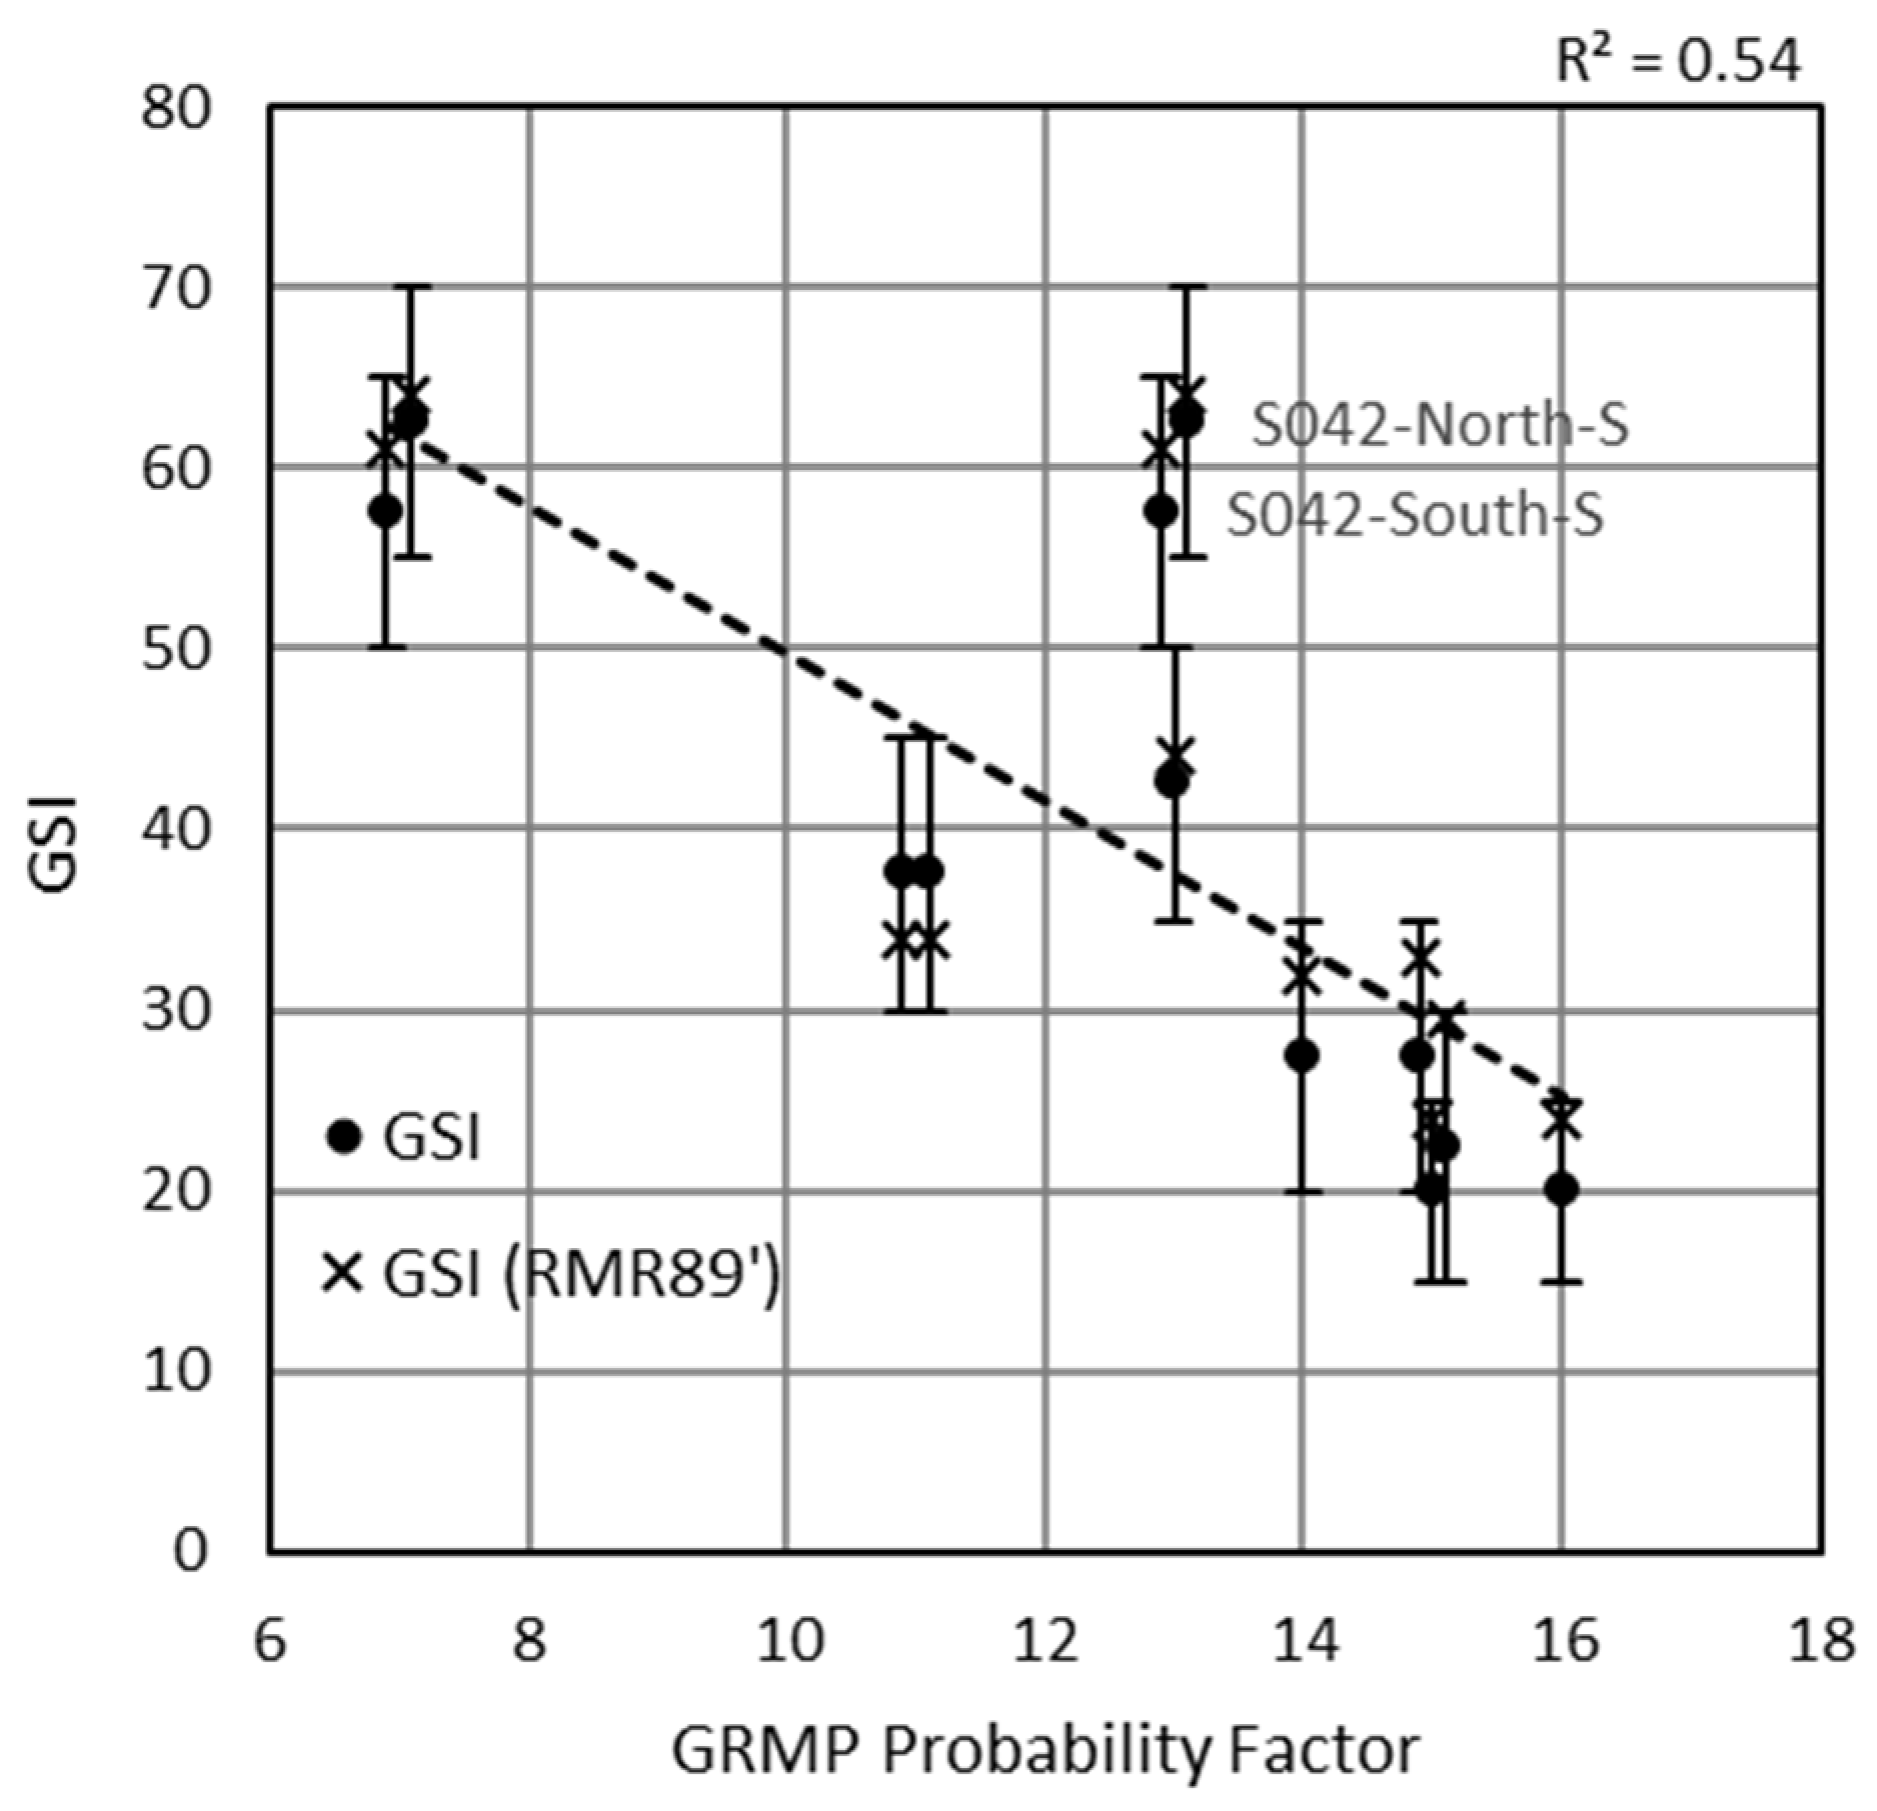
An appropriate RMR score was determined for each slope and adjusted to fit the RMR89′ requirements for direct comparison to GSI using Equation (5). Figure 4 presents the correlation between GSI, RMR89′, and GRMP PF for each of the slopes included in this study. Vertical error bars correspond to the representative bounds of the GSI range selected for each of the slopes. The computed GSI value using RMR89′ and Equation (5) proved very effective and fell within the representative GSI range for each of the slopes included in this study. The average percent difference of RMR89′ to the median GSI value was 9% which is not significant from a practical geotechnical engineering perspective.
The only significant deviation from the trend presented in Figure 3 was S042-North-S and S042-South-S. This is attributed to the same reasoning as in Figure 3a,b for Q-Slope, where the rating system has no capacity to capture the increase in rockfall event volume. While Q-Slope can account for different failure mechanisms, GSI and RMR lack this capacity as well. Overall, with the exception of S042, a reasonable correlation between GSI and the GRMP PF resulted from this analysis with an R2 value of 0.54.

4.4. Summary of Results

The comparison between the GRMP rating system and other industry-accepted rock mass and rock slope rating systems is intended to gauge the effectiveness of each at quantifying risk from rockfall geohazards along linear infrastructure. From the results of this study, a range of correlation strengths was obtained. Major outliers for each correlation were largely justifiable after a detailed review of key categories for each rating system that led to a deviation from the generated trend. A strong correlation was derived between the GRMP RL and RHRS, which gives credit to TEC’s GRMP and consultants taking part in the program. For the poor correlation derived between the GRMP RL and the CRHRS values, it is unclear which rating system is better suited for Alberta rock slopes. While the simplicity of the GRMP RL may be a limitation of TEC’s current system, the complexity of the CRHRS does not lend itself to easy implementation. Additionally, the narrow range of CRHRS scores determined for the study sites may make it more difficult for agencies to prioritize sites. It is also possible that the poor correlation between CRHRS and the GRMP RL is a result of the GRMP’s simplicity. When considering S042, the slope must be viewed from a distance, and little data regarding past rockfall events are available. This may lead the GRMP scorers to select more conservative PF or CF values, resulting in a higher RL. From an asset management perspective, a slope with a high RL would trigger additional monitoring of the slope’s performance and ultimately determine if adjustment to the rating is required. Since the CRHRS is actively in use as a GAM assessment tool in Colorado, a clear conclusion cannot be drawn of the CRHRS applicability to GAM from the twelve Alberta rock slopes assessed in this study. However, the results from this limited study indicate that the CRHRS ranking does not provide adequate differentiation for rockfall hazards for highway-related sites in Alberta. The correlation resulting between Q-Slope and the GRMP PF was marginal when looking at both the Q-Slope score and difference between the actual slope angle and calculated β angle (Figure 3a and Figure 3b, respectively). It is unclear if Q-Slope would hold up as an effective preliminary assessment tool in a comprehensive GAM program. A reasonable correlation between the GRMP PF and GSI was achieved considering GSI and RMR do not consider the failure mechanisms at work within a rock slope, giving credit to GSI’s strength as a rock mass characterization tool. Although, like Q-Slope, its applicability as a condition assessment tool for GAM remains in question. A range of values for each asset adds unnecessary complexity for an agency to assign priority for resource allocation.

5. Conclusions

This paper presents the results of a variety of rock mass and rock slope rating systems applied to rockfall geohazards present along highway corridors in Alberta, Canada. The applicability of each for use as a tool for slope condition assessment was tested as alternative methods for TEC to implement as part of a GAM program. Overall, Alberta’s GRMP system held up as a viable condition assessment tool to be used within a GAM program against other comprehensive rock slope and rock mass rating systems, which require more in-depth and explicit geological ratings and measured values. The GRMP RL and RHRS are considered short-listed as viable tools for quantifying risk. Q-Slope and GSI may be short-listed for use as viable tools to assess the likelihood or probability of rockfall occurrence, supplementary to the GRMP PF, with GSI better suited for implementation through visual inspection alone.

5.1. RHRS and CRHRS

The RHRS clearly aligned well with TEC’s existing GRMP methodology, as illustrated by the correlations presented in Figure 2a with an R2 of 0.87. Even though the GRMP RL does not incorporate a measure of risk exposure as mentioned in Section 2.1, from the correlation derived with the RHRS ratings, it appears that the technical expertise of TEC and its consultants has inherently accounted for this limitation to some degree. The RHRS and its modified versions are used extensively by American Departments of Transportation and have demonstrated value as effective preliminary assessment tools for rockfall geohazards. The poor correlation between the CRHRS and GRMP risk level (RL) was not unexpected due to the relatively high complexity of the rating system compared to the simplicity of the GRMP RL. The increased complexity provides many outlets for deviation from a trend that may be improved with the inclusion of lower activity slopes to better define a range of slopes which does not require attention through monitoring or rehabilitation measures. However, the CRHRS did not provide a clear ranking for prioritizing resource allocation for these sites in Alberta. It should be noted that the RHRS (and subsequently the CRHRS) is the only rating system discussed in this paper which includes a methodology for estimating the cost of rockfall remedial measures. This is an important aspect when considering a rating systems’ applicability to an agency GAM program.

5.2. Q-Slope, GSI, and RMR

Q-Slope, GSI, and RMR are not formally considered preliminary assessment tools for the application of GAM but still resulted in moderately acceptable correlations to the GRMP probability factor (PF), as shown in Figure 3 for Q-Slope, with an R2 of 0.40 to 0.48, and in Figure 4 for GSI and RMR, with an R2 of 0.54. Outliers for each methodology could be explained with reasoning pertaining to site-specific characteristics, e.g., varying failure mechanisms and rockfall event volumes (S042 and C018), the presence of rockfall mitigation measures (S018), or slope heights extending beyond the rating system’s input ranges (C018 and S042 for Q-Slope). The limitations of Q-Slope, GSI, and RMR pertaining to their applicability to GAM are evident since they do not carry the capacity to measure consequence and, subsequently, risk. However, when considering the likelihood of failure alone, Q-Slope could be employed as a tool to determine PF if varying rockfall event volumes are considered through their failure mechanism and not strictly volume. The selection of an appropriate Discontinuity Orientation Factor (O-factor) proved to be the most challenging aspect when implementing Q-Slope due to the ambiguity of discontinuity orientation descriptions. Careful consideration must be made by the scorer to maintain consistency throughout an asset inventory when applying Q-Slope. GSI should be considered as a solid baseline methodology to determine the likelihood of a rockfall occurring. Its correlation with the GRMP PF gives credit to TEC’s PF at capturing the reality of low-quality rock masses bearing a greater likelihood of rock block detachment.

Supplementary Materials

The following supporting information can be downloaded at https://www.mdpi.com/article/10.3390/geosciences13110348/s1, Figure S1: C018—Red Deer River Valley Slope Instability—GSI and Joint Set Number; Figure S2: S018—Galatea Creek Rock Cut—GSI and Joint Set Number; Figure S3: S020—Highwood House Rockfall Hazard—GSI and Joint Set Number; Figure S4: S042—Spray Lakes Rockfall (North)—GSI and Joint Set Number; Figure S5: S042—Spray Lakes Rockfall (South)—GSI and Joint Set Number; Figure S6: S057—Hwy 1A, Exshaw, Site A—GSI and Joint Set Number; Figure S7: S057—Hwy 1A, Exshaw, Site B—GSI and Joint Set Number; Figure S8: S070—East of Fir Creek Rock Cut—GSI and Joint Set Number; Figure S9: S074—Lipsett Ridge Rock Cut—GSI and Joint Set Number.

Author Contributions

Conceptualization, T.D.G.W.-B., R.M.P., C.G., K.T. and R.S.; methodology, T.D.G.W.-B. and R.M.P.; validation, R.M.P., C.G., K.T. and R.S.; formal analysis, T.D.G.W.-B.; investigation, T.D.G.W.-B.; data curation, T.D.G.W.-B. and R.M.P.; writing—original draft preparation, T.D.G.W.-B.; writing—review and editing, T.D.G.W.-B., R.M.P., C.G., K.T. and R.S.; visualization, T.D.G.W.-B. and R.M.P.; supervision, R.M.P.; funding acquisition, R.M.P. All authors have read and agreed to the published version of the manuscript.

Funding

This research was funded by Klohn Crippen Berger and NSERC through a Collaborative Research and Development Grant (CRD), grant number CRDP J 543429-2019.

Data Availability Statement

Information regarding the case study sites is available on the Alberta Transportation website. Rating System data and results are owned by the University of Alberta and can be made available upon request.

Acknowledgments

The authors wish to thank Klohn Crippen Berger Ltd. and Alberta Transportation and Economic Corridors for their contributions to the work presented in this paper and for facilitating access to the sites and historic information. Special thanks to Sonam Choden and Gustavo Velarde from the University of Alberta Geotechnical Centre for assisting in the collection of field data and review of GSI ratings, respectively.

Conflicts of Interest

Author Chris Gräpel was employed by the company Klohn Crippen Berger Ltd. The remaining authors declare that the research was conducted in the absence of any commercial or financial relationships that could be construed as a potential conflict of interest.

References

  1. Wolf, R.E.; Bouali, E.H.; Oommen, T.; Dobson, R.J.; Vitton, S.; Brooks, C.; Lautala, P. Sustainable Geotechnical Asset Management Along the Transportation Infrastructure Environment Using Remote Sensing: Final Report; Michigan Technological University: Houghton, MI, USA, 2015. [Google Scholar]
  2. American Association of State Highway Transportation Officials (AASHTO). Transportation Asset Management Guide; AASHTO: Washington, DC, USA, 2020. [Google Scholar]
  3. Bernhardt, K.L.S.; Loehr, J.E.; Huaco, D. Asset Management Framework for Geotechnical Infrastructure. J. Infrastruct. Syst. 2003, 9, 107–116. [Google Scholar] [CrossRef]
  4. Baecher, G.B.; Christian, J.T. Reliability and Statistics in Geotechnical Engineering; John Wiley & Sons: Hoboken, NJ, USA, 2005. [Google Scholar]
  5. Tappenden, K.M.; Skirrow, R.K. Vision for Geotechnical Asset Management at Alberta Transportation. In Proceedings of the 2020 Canadian Geotechnical Conference (GeoVirtual), 14–16 September 2020. [Google Scholar]
  6. Anderson, S.A.; Schaefer, V.R.; Nichols, S.C. Taxonomy for Geotechnical Assets, Elements, and Features. In Proceedings of the Transportation Research Board 95th Annual Meeting, Washington, DC, USA, 10–14 January 2016. [Google Scholar]
  7. Macciotta, R.; Martin, C.D. Preliminary Approach for Prioritizing Resource Allocation for Rock Fall Hazard Investigations Based on Susceptibility Mapping and Efficient Three-Dimensional Trajectory Modelling. Bull. Eng. Geol. Environ. 2019, 78, 2803–2815. [Google Scholar] [CrossRef]
  8. Macciotta, R.; Gräpel, C.; Skirrow, R. Fragmented Rockfall Volume Distribution from Photogrammetry-Based Structural Mapping and Discrete Fracture Networks. Appl. Sci. 2020, 10, 6977. [Google Scholar] [CrossRef]
  9. Youssef, A.M.; Maerz, N.H. Overview of Some Geological Hazards in the Saudi Arabia. Environ. Earth Sci. 2013, 70, 3115–3130. [Google Scholar] [CrossRef]
  10. Ansari, M.K.; Ahmad, M.; Singh, R.; Singh, T.N. Rockfall Hazard Rating System along SH-72: A Case Study of Poladpur–Mahabaleshwar Road (Western India), Maharashtra, India. Geomat. Nat. Hazards Risk 2016, 7, 649–666. [Google Scholar] [CrossRef]
  11. Sazid, M. Analysis of Rockfall Hazards along NH-15: A Case Study of Al-Hada Road. Int. J. Geo-Eng. 2019, 10, 1. [Google Scholar] [CrossRef]
  12. Higgins, J.; Andrew, R.; Turner, K.; Schuster, R. Rockfall Types and Causes. In Rockfall Characterization and Control; Transportation Research Board: Washington, DC, USA, 2012; pp. 21–55. [Google Scholar]
  13. Macciotta, R.; Grapel, C.; Duxbury, J.; Keegan, T.; Skirrow, R. Explicit Estimation of Rock Slope Failure Likelihood for Hazard Assessment and Safety Engineering near Canmore, AB. In Proceedings of the 7th Canadian Conference on Geohazards: Geohazards, Canmore, AB, Canada, 3–6 June 2018; Volume 7. [Google Scholar]
  14. Macciotta, R. Review and Latest Insights into Rock Fall Temporal Variability Associated with Weather. Proc. Inst. Civ. Eng.-Geotech. Eng. 2019, 172, 556–568. [Google Scholar] [CrossRef]
  15. Pratt, C.; Macciotta, R.; Hendry, M. Quantitative Relationship between Weather Seasonality and Rock Fall Occurrences North of Hope, BC, Canada. Bull. Eng. Geol. Environ. 2019, 78, 3239–3251. [Google Scholar] [CrossRef]
  16. Wyllie, D.C. Rock Fall Engineering; CRC Press: Boca Raton, FL, USA, 2014. [Google Scholar]
  17. AMEC Earth & Environmental. Geohazards Review: Highway 40/Highway 541 Corridor, Southwestern Alberta; Report submitted to Alberta Infrastructure and Transportation; AMEC Earth & Environmental: Scotland, UK, 2006. [Google Scholar]
  18. Pierson, L.A. Rockfall Hazard Rating System. Transp. Res. Rec. 1992, 1343, 6–13. [Google Scholar]
  19. Pierson, L.A.; Van Vickle, R. Rockfall Hazard Rating System: Participant’s Manual; Federal Highways Administration: Washington, DC, USA, 1993; p. 104. [Google Scholar]
  20. Justice, S.M. Application of a Hazard Rating System for Rock Slopes Along a Transportation Corridor Using Remote Sensing; Michigan Technological University: Houghton, MI, USA, 2015. [Google Scholar]
  21. Budetta, P. Assessment of Rockfall Risk along Roads. Nat. Hazards Earth Syst. Sci. 2004, 4, 71–81. [Google Scholar] [CrossRef]
  22. Pierson, L.A.; Turner, K.A. Rockfall Characterization and Control; Turner, A.K., Schuster, R.L., Eds.; Transportation Research Board: Washington, DC, USA, 2012; pp. 73–112. [Google Scholar]
  23. Rose, B.T. Tennessee Rockfall Management System; Virginia Polytechnic Institute and State University: Blacksburg, VA, USA, 2005. [Google Scholar]
  24. Russell, C.P.; Santi, P.; Higgins, J.D. Modification and Statistical Analysis of the Colorado Rockfall Hazard Rating System; CDOT-2008-7; Colorado School of Mines: Golden, CO, USA, 2008. [Google Scholar]
  25. Santi, P.M.; Russell, C.P.; Higgins, J.D.; Spriet, J.I. Modification and Statistical Analysis of the Colorado Rockfall Hazard Rating System. Eng. Geol. 2009, 104, 55–65. [Google Scholar] [CrossRef]
  26. Walkinshaw, J.; Santi, P. Landslides Investigation and Mitigation, Special Report 247, Chapter 21: Shales and Other Degradable Materials; Transportation Research Board: Washington, DC, USA, 1996. [Google Scholar]
  27. Colorado Department of Transportation. Laboratory Manual of Test Procedures, Determining the Durability of Shales for Use as Embankments; Colorado Department of Transportation: Denver, CO, USA, 2020. [Google Scholar]
  28. Agriculture and Irrigation, Alberta Climate Information Service (ACIS) Climate Data. Available online: https://acis.alberta.ca (accessed on 26 September 2022).
  29. Barton, N.; Lien, R.; Lunde, J. Engineering Classification of Rock Masses for the Design of Tunnel Support. Rock Mech. 1974, 6, 189–236. [Google Scholar] [CrossRef]
  30. Barton, N.; Grimstad, E. Forty Years with the Q-System in Norway and Abroad. Fjellsprengningsteknikk Bergmek. Geotek. NFF Oslo 2014, 4, 1–25. [Google Scholar]
  31. Barton, N.; Bar, N. Introducing the Q-Slope Method and Its Intended Use within Civil and Mining Engineering Projects. In Proceedings of the ISRM Regional Symposium EUROCK 2015, Salzburg, Austria, 7–10 October 2015. [Google Scholar]
  32. Bar, N.; Barton, N.; Ryan, C. Application of the Q-Slope Method to Highly Weathered and Saprolitic Rocks in Far North Queensland; Taylor & Francis Group: London, UK, 2016. [Google Scholar]
  33. Bar, N.; Barton, N. The Q-Slope Method for Rock Slope Engineering. Rock Mech. Rock Eng. 2017, 50, 3307–3322. [Google Scholar] [CrossRef]
  34. Hoek, E. Strength of Rock and Rock Masses. ISRM News J. 1994, 2, 4–16. [Google Scholar]
  35. Hoek, E.; Kaiser, P.K.; Bawden, W.F. Support of Underground Excavations in Hard Rock; Balkema: Rotterdam, The Netherlands, 1995. [Google Scholar]
  36. Hoek, E.; Brown, E.T. Practical Estimates of Rock Mass Strength. Int. J. Rock Mech. Min. Sci. 1997, 34, 1165–1186. [Google Scholar] [CrossRef]
  37. Marinos, P.G.; Marinos, V.; Hoek, E. The Geological Strength Index (GSI): A Characterization Tool For Assessing Engineering Properties For Rock Masses. In Proceedings of the International Workshop on Rock Mass Classification in Underground Mining, Pittsburgh, PA, USA, 1 May 2007. [Google Scholar]
  38. Hoek, E.; Brown, E.T. The Hoek–Brown Failure Criterion and GSI–2018 Edition. J. Rock Mech. Geotech. Eng. 2019, 11, 445–463. [Google Scholar] [CrossRef]
  39. Marinos, P.; Hoek, E. Gsi: A Geologically Friendly Tool for Rock Mass Strength Estimation. In Proceedings of the ISRM International Symposium, Melbourne, Australia, 19–24 November 2000. [Google Scholar]
  40. Marinos, V.; Marinos, P.; Hoek, E. The Geological Strength Index: Applications and Limitations. Bull. Eng. Geol. Environ. 2005, 64, 55–65. [Google Scholar] [CrossRef]
  41. Bieniawski, Z.T. Engineering Classification of Jointed Rock Masses. Civ. Eng. 1973, 1973, 335–343. [Google Scholar]
  42. Bieniawski, Z.T. Engineering Rock Mass Classifications: A Complete Manual for Engineers and Geologists in Mining, Civil, and Petroleum Engineering; John Wiley & Sons: Hoboken, NJ, USA, 1989; ISBN 0-471-60172-1. [Google Scholar]
  43. Aksoy, C.O. Review of Rock Mass Rating Classification: Historical Developments, Applications, and Restrictions. J. Min. Sci. 2008, 44, 51–63. [Google Scholar] [CrossRef]
  44. Bieniawski, Z.T. Classification of Rock Masses for Engineering: The RMR System and Future Trends. In Rock Testing and Site Characterization; Elsevier: Amsterdam, The Netherlands, 1993; pp. 553–573. [Google Scholar]
  45. Romana, M.; Tomás, R.; Serón, J.B. Slope Mass Rating (SMR) Geomechanics Classification: Thirty Years Review. In Proceedings of the 13th ISRM International Congress of Rock Mechanics, Montreal, QC, Canada, 10–13 May 2015; OnePetro: Quebec, QC, Canada, 2015; p. 10. [Google Scholar]
  46. Romana, M. The Geomechanical Classification SMR For Slope Correction. In Proceedings of the 8th ISRM Congress, Tokyo, Japan, 25–29 September 1995. ISRM-8CONGRESS-1995-202. [Google Scholar]
  47. Wollenberg-Barron, T.D.G.; Macciotta Pulisci, R.; Grapel, C.; Tappenden, K.M.; Skirrow, R.K. Use of Rock Slope Rating Systems with Remote Sensing for Geotechnical Asset Management and Preliminary Application at a Rock Slope in Southern AB. In Proceedings of the 8th Canadian Conference on Geotechnique and Natural Hazards, Quebec, QC, Canada, 12–15 June 2022; Canadian Geotechnical Society: Quebec City, QC, Canada, 2022. [Google Scholar]
  48. Google Earth 7.0, Central and Southern Alberta. Available online: https://earth.google.com/web (accessed on 6 December 2022).
  49. Roustaei, M.; Macciotta Pulisci, R.; Hendry, M.; Rodriguez, J.; Grapel, C.; Skirrow, R. Characterisation of a Rock Slope Showing Three Weather-Dominated Failure Modes. In Proceedings of the 2020 International Symposium on Slope Stability in Open Pit Mining and Civil Engineering, Perth, WA, Australia, 12–14 May 2020; Australian Centre for Geomechanics: Perth, Australia, 2020; pp. 427–438. [Google Scholar]
  50. Klohn Crippen Consultants Ltd. Alberta Transportation Central Region, Site C018 Annual Inspection Report; Klohn Crippen Consultants Ltd.: New York, NY, USA, 2001. [Google Scholar]
  51. Rodriguez, J.; Macciotta, R.; Hendry, M.T.; Roustaei, M.; Gräpel, C.; Skirrow, R. UAVs for Monitoring, Investigation, and Mitigation Design of a Rock Slope with Multiple Failure Mechanisms—A Case Study. Landslides 2020, 17, 2027–2040. [Google Scholar] [CrossRef]
  52. AMEC. Site S018–Galatea Rockfall, Highway 40:12, Kananaskis River Valley, Alberta; Site Data–Summary Binder, Section A–File Review; AMEC: London, UK, 2009. [Google Scholar]
  53. Klohn Crippen Berger. Southern Region GRMP Site Inspection Report, S020 Highwood House Rock Cut; Klohn Crippen Berger: New York, NY, USA, 2018. [Google Scholar]
  54. Stewart, J.S.; Rose, B.; Marshall, J.R. Upper Elk and Upper Highwood Rivers, British Columbia and Alberta; Department of Mines, Geological Survey: Ottawa, ON, Canada, 1924. [Google Scholar]
  55. Macciotta, R.; Gräpel, C.; Keegan, T.; Duxbury, J.; Skirrow, R. Quantitative Risk Assessment of Rock Slope Instabilities That Threaten a Highway near Canmore, Alberta, Canada: Managing Risk Calculation Uncertainty in Practice. Can. Geotech. J. 2020, 57, 337–353. [Google Scholar] [CrossRef]
  56. AMEC Environment and Infrastructure. Southern Region Geohazard Assessment, 2014 Annual Inspection Report, Site S42: Highway 742:02; Spray Lakes Rock Fall; AMEC Environment & Infrastructure, Inc.: London, UK, 2015. [Google Scholar]
  57. Price, R.A. Geology, Canmore (West Half); West of Fifth Meridian: Edmonton, AB, Canada, 1970. [Google Scholar]
  58. Klohn Crippen Berger. Southern Region Geohazard Risk Management Plan, Hwy 1A:02, Km 12.52 to 11.91 Call-Out Report; Klohn Crippen Berger: New York, NY, USA, 2019. [Google Scholar]
  59. AMEC. Southern Region Geohazard Assessment Program, Highway 541:02, East of Fir Creek Rock Cut Site, June 2009 Inspection Report; AMEC: London, UK, 2009. [Google Scholar]
  60. McHechan, M.E. Rocky Mountain Foothills and Front Ranges in Kananaskis Country; West of Fifth Meridian: Edmonton, Alberta, Canada, 1995. [Google Scholar]
  61. AMEC. Geohazards Review–Highway 40/Highway 541 Corridor, Site 28–Lipsett Ridge Rock Cut; AMEC: London, UK, 2006. [Google Scholar]
  62. Klohn Crippen Berger. Central Region GRMP–Call-Out Report, C018 Hwy 837:02 Call-Out Report; Klohn Crippen Berger: New York, NY, USA, 2018. [Google Scholar]
  63. Klohn Crippen Berger. Southern Region GRMP Site Inspection Report, S042–I & II Spray Lakes Rockfall; Klohn Crippen Berger: New York, NY, USA, 2019. [Google Scholar]
  64. Alberta Transportation and Economic Corridors (TEC) Highway Traffic Counts. Traffic Volume Data Map. Available online: http://www.transportation.alberta.ca/mapping/ (accessed on 9 October 2023).
  65. Hutchinson, D.J.; Diederichs, M. The Cablebolting Cycle–Underground Support Engineering. CIM Bull. 1996, 89, 1001. [Google Scholar]
Figure 1. (a) Location of rock slope study areas (red circles) with map of Alberta and populated centres (red squares) as reference [48]. Site photos and approximate slope heights of (b) C018, (c) S018, (d) S020, (e) S042-North, (f) S042-South, (g) S057-A, (h) S057-B, (i) S070, and (j) S074.
Geosciences 13 00348 g001
Figure 2. Correlation between (a) RHRS and GRMP risk level, (b) CRHRS and GRMP risk level, and (c) CRHRS and RHRS. Slope scores with greatest deviation from correlation trendline identified.
Geosciences 13 00348 g002
Figure 3. Developed correlation between GRMP probability factor and (a) Q-Slope on Log scale and (b) difference between Q-Slope β and actual slope angle; (c) slopes plotted on Q-Slope stability chart [31]. Unstable slopes and scores with greatest deviation from correlation trendline identified.
Geosciences 13 00348 g003
Figure 4. Correlation between and observed GSI, GSI from RMR89′, and the prescribed GRMP probability factor for each slope.
Geosciences 13 00348 g004
Table 1. GRMP risk level rating—rockfall geohazard probability factors [17].
Probability Factor (Ranked on a Scale of 1 to 20)
1Inactive, very low probability of fall occurrence.
3Inactive, low probability of fall occurrence.
5Inactive, moderate probability of fall occurrence.
7Inactive, high probability of fall occurrence (e.g., seasonal, following freeze/thaw cycles) and/or a fall has occurred in the past.
9Active, falls occur after exceptional weather (e.g., the melting of greater than average snow accumulations or exceptionally intense precipitation), fall frequency is in the order of once a decade.
11Active, one or two falls occur each year triggered by annually recurring weather conditions.
13Active, several falls occur each year and/or the frequency of falls is increasing in comparison to equivalent time periods in previous years.
15Active, many falls occur each year and/or the area producing rock falls is expanding. Ongoing or persistent rockfalls during specific times of the year.
20Active, a large volume of rock is surrounded by open cracks. Toppling or sliding of the displacing mass is accelerating. Sites where rapid movement of a large fall is possible.
Table 2. GRMP risk level rating—rockfall geohazard consequence factors [17].
Consequence Factor (Ranked on a Scale of 1 to 10)
1Rockfall contained by ditch if cleaned as required to maintain capacity.
2Rockfall onto roadway removable by maintenance crews by hand or with shovels. Road closure not required. Minor damage to the road surface that can be repaired during annual patching and sealing of the road. Minor to no damage to vehicles being struck by falling rocks or striking rocks deposited onto road.
3Rockfall onto road that could damage a vehicle (e.g., flat tire, dent body of vehicle). Rocks bounce or roll onto the road surface but likely not with a trajectory that would pass through the windows or windshield of a passing vehicle.
4Individual rocks or the total volume of rocks deposited on the road large enough to cause the following:
  • Damage vehicles or cause accidents if struck by traffic or damage vehicles and injure occupants if they strike a moving vehicle.
  • Cause partial closure of the road or require a detour lane prior to cleanup.
  • Damage to the road surface may require temporary repair in order to re-open road.
6Individual rocks or the total volume of rocks deposited on the road large enough to cause the following:
  • Damage/destroy vehicles and severely injure occupants if struck by traffic or damage/destroy vehicles and severely injure/kill occupants if they strike a moving vehicle.
  • Cause complete closure of the road with a rough detour/diversion possible within hours to days.
  • Require days to weeks to restore the road to normal service.
  • Possibly significant damage to the road surface that requires immediate repair.
8Same as weighting of 6 but with several days required to develop a rough detour/diversion around the rockfall site.
10Individual rocks or the total volume of rocks deposited on the road large enough to cause the following:
  • Damage/destroy vehicles and severely injure occupants if struck by traffic.
  • Bury vehicles if they strike a moving vehicle.
  • Cause complete closure of the road, with a temporary, rough detour or diversion possible in days to weeks.
  • Require complete reconstruction or rerouting of the road after the rockfall.
Table 3. Slope details and results of rock slope and rock mass rating systems.
Slope IDGRMPRHRSCRHRSSlope Angle (°)Q-Slopeβ Angle (°)GSIRMR89
PFCFRL
C018-S1569041377742 *0.0008333.415–2529
C018-L16914451280142 *0.0008333.415–2529
S01813339292729850.13347.535–5049
S0201457039475960 *0.035736.120–3537
S042-East-S1345229374760 *0.98364.855–7069
S042-East-L774935877760 *0.98364.850–6566
S042-West-S1345228781960 *0.98664.955–7069
S042-West-L774935284960 *0.98664.950–6566
S057-A11111275735400.084443.530–4539
S057-B11333285753450.13347.530–4539
S07015230234759550.060540.615–3035
S07415115242735500.019530.820–3538
* Slope angle approximated in the field and corroborated with remote sensing data when available.
Disclaimer/Publisher’s Note: The statements, opinions and data contained in all publications are solely those of the individual author(s) and contributor(s) and not of MDPI and/or the editor(s). MDPI and/or the editor(s) disclaim responsibility for any injury to people or property resulting from any ideas, methods, instructions or products referred to in the content.

