Article

Escape Mechanism with Shallow Ramp and Décollements in Southwest Taiwan

1
Institute of Oceanography, National Taiwan University, Taipei 106216, Taiwan
2
Institute of Earth Sciences, Academia Sinica, Taipei 11529, Taiwan
*
Author to whom correspondence should be addressed.
Geosciences 2023, 13(2), 41; https://doi.org/10.3390/geosciences13020041
Submission received: 14 November 2022 / Revised: 27 January 2023 / Accepted: 29 January 2023 / Published: 30 January 2023

Abstract

:
The escape structure in southwest Taiwan has long been discussed. The counterclockwise rotation in GPS ground motion is argued to be evidence of tectonic escape. However, tectonic escape events worldwide are always bounded by lithosphere-cutting strike-slip faults at the boundary of the lithospheric-scale rotating block, and these have not observed in Taiwan. In this study, we propose that the escape structure in southwest Taiwan is a thin-skinned deformation due to the open boundary in the continental slope, the ramp, and the shallow décollements. We tested this shallow escape hypothesis using a 3D numerical simulation with elastoplastic rheology. We found that a conjugate pair of forethrust and backthrust developed above the ramp. The strike and location of the forethrust mainly follow the ramp. However, the strike of the forethrust rotates perpendicular to the open boundary when in proximity. From north to south, the strike of the forethrust transfers from NNE to NE, and the deformation transfers from thrust to dextral thrust. This leads to a counterclockwise rotation in ground motion, which matches the GPS observation. This research provides a different explanation of the mechanism for the escape structure in southwest Taiwan.

1. Introduction

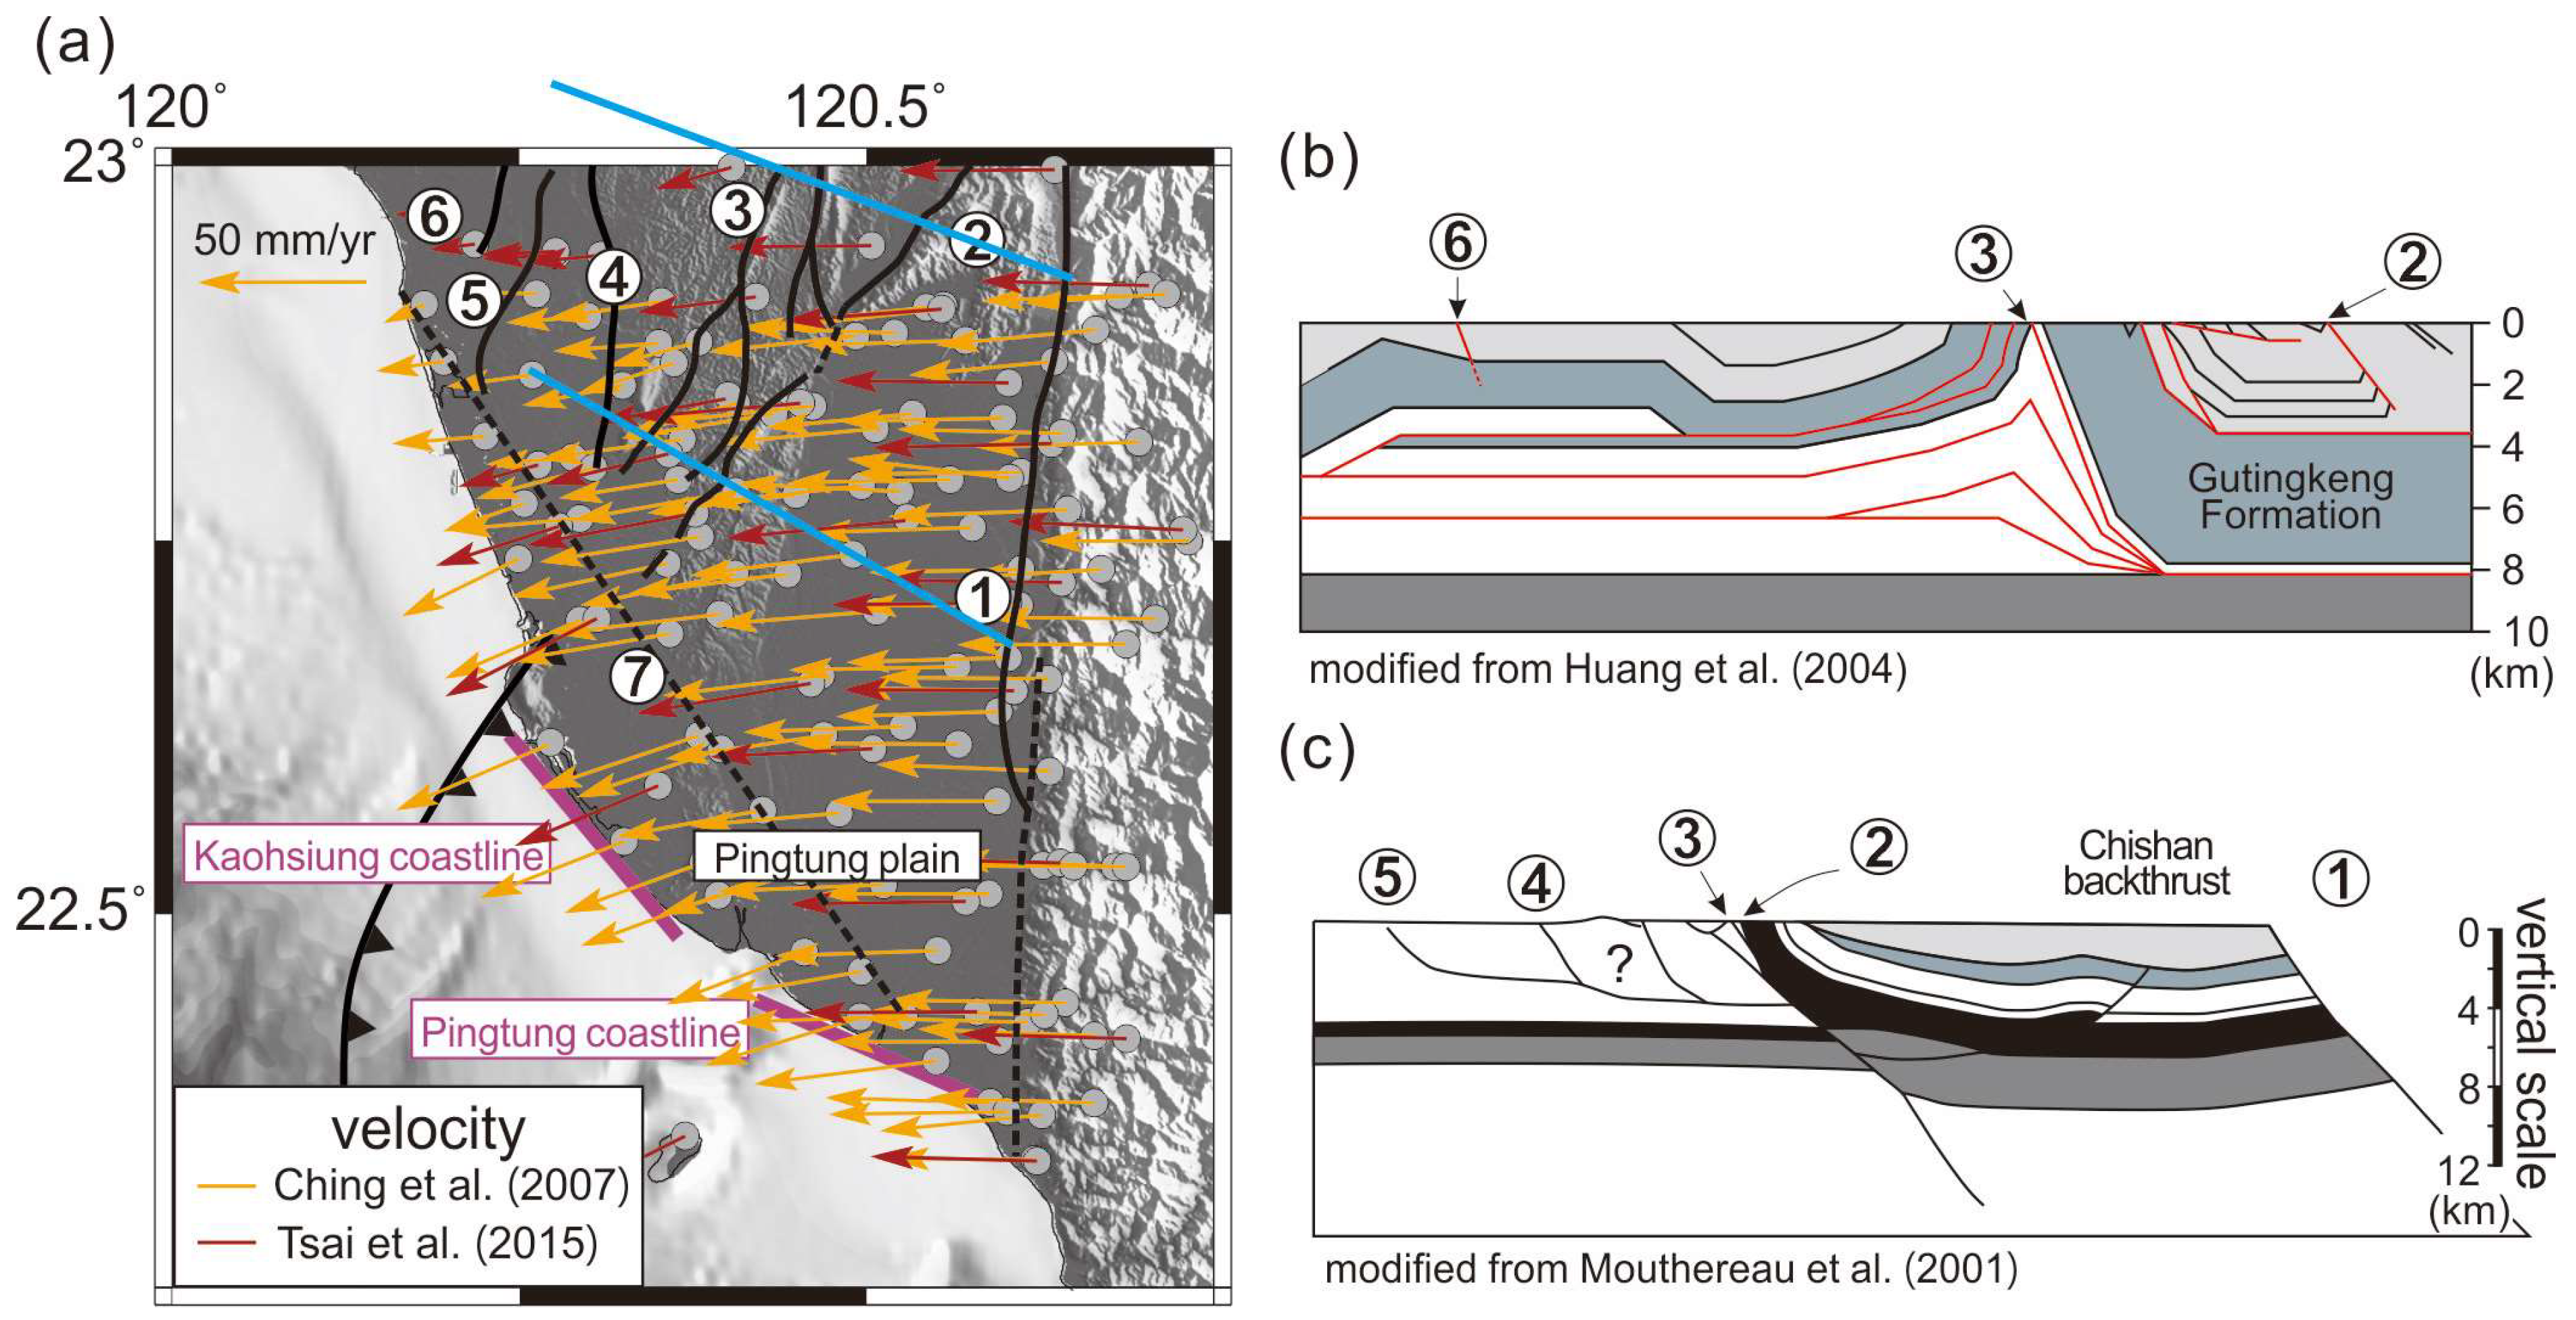
The island of Taiwan is located on an oblique collision between the Philippine Sea Plate and the Eurasian Plate [1,2] (Figure 1). The collision has formed the fold-and-thrust belt (FTB) and mountain ranges from north to south due to obliquity. One of the most active deforming areas in Taiwan is the southern end of the fold-and-thrust belt, i.e., southwest Taiwan. This region has been studied and two GPS datasets have been produced [3,4]. Both reveal significant ground motions in southwest Taiwan, especially in the coastal area (Figure 1 and Figure 2). The E–W shortening rate is ~25 mm/year across the Pingtung Plain, which is attributed to the convergent deformation of several N–S and NNE–SWS thrust faults (Figure 2) across the Pingtung Plain [3,4,5]. An active shear zone is located west of the Pingtung Plain in strikes NNE and NE of its northern and southern sections, respectively, and its width broadens southward (Figure 1). The velocity vector is approximately 50 mm/year westward at the eastern boundary of the Pingtung Plain and is reduced westward at the western boundary according to the GPS observations. However, ground motions increase from north to south in southwest Taiwan. Velocity vectors of ~50 mm/year have been measured southwestward near the coast, and these have led to a southwestward extrusion and an apparent counterclockwise rotation of the Pingtung Plain. This block rotation has been described as an escape structure [5,6,7,8].
The NE–SW shear zone in southwest Taiwan is located between the Chishan fault (② in Figure 2) and the Houchiali fault (⑥ in Figure 2). This shear zone is mainly composed of faults striking N–S (④, ⑤, and ⑥ in Figure 2) and NNE–SWS (② and ③ in Figure 2). All of these are thrusts, and some also have right-lateral slip components [9]. As a result, the shear zone has right-lateral thrusting deformation. The Fengshan fault (⑦ in Figure 2) is a left-lateral fault embedded in a group of folds [4,10,11]. The Chaochou fault (① in Figure 2) is located at the boundary between the western foothills and the central mountain range, which is regarded as the backstop of the convergence in southwest Taiwan. The westward convergence triggers the reactivation of inherited extensional features and the initiation of thrusts. The initiation of thrusts developed mainly from the east to the west from 5 Ma to 1 Ma, while several out-of-sequence thrusts developed in the past 1 Myr and caused the deformation to accumulate at the rear of the thrust wedge [12]. The balanced cross-sections show multiple décollements underlying southwest Taiwan. These décollements are located at different depths and are connected by either a ramp [12] or a duplex [13]. Mouthereau et al. (2001) [12] has suggested that there is an aseismic shallow décollement leading to a thin-skinned deformation in southwest Taiwan. This ductile décollement may correspond to the Gutingkeng Formation. We adopt the flat–ramp–flat structure in our model setting.
Structural and seismotectonic studies also testify to the escape in southwest Taiwan. An incipient quaternary right-lateral movement along the NNE-trending Chishan fault (② in Figure 2) and the southward-increasing occurrence of the extensional feature were also interpreted as evidence of tectonic escape [11]. The focal mechanism-derived stress field also shows a southward increase in extensional features [6]. The seismotectonic stress regimes are purely compressive in the mountain ranges, transcurrent on the coast, and simple shear in the western offshore area. It has been suggested that such a spatial transition of stresses may correspond with the southwestward material extrusion [6]. However, most regional seismicity is deeper than 15 km [14] and may be related to the subducted plate below the décollement. Therefore, the stress state above the décollement is still unclear.
Tectonic escape, driven by the collision of two plates, is manifested in the lateral ground motion, which reorients the convergent deformation according to the shape of the local indenter [8,15,16,17]. Contraction, transcurrent faulting, and block rotation are common deformation patterns in tectonic escape regions, such as SE Asia [17,18] and Anatolia [19,20]. Both regions have been under the effects of lithospheric collision for millions of years. Their GPS data show significant block rotations [18,21,22,23,24]. Another characteristic is major strike-slip faults at the boundaries of rotating blocks. For example, the tectonic escape of the Anatolian microplate is revealed by modern geodetic measurements. The Anatolian microplate moves westward along the bounding strike-slip faults, the North Anatolian fault, and the North Aegean Trough [23] due to the indentation of Arabia.
However, the regional tectonic activity in southwest Taiwan is incompatible with typical tectonic escape. Blocks of tectonic escape are typically bounded by active strike-slip faults, such as the Red River fault of SE Asia and the North Anatolia fault of Anatolia. These strike-slip faults are oblique to the convergence direction and allow the aforementioned blocks to slip toward mechanically weak domains. However, there is no great strike-slip fault in southwest Taiwan. The Chishan fault is the most active fault in southwest Taiwan, with a ~10 mm/year right-lateral slip rate component [4]. However, it is located within the rotating block, not on the boundary (Figure 2). Additionally, there is no strike-slip fault at the eastern boundary of the rotating block. Without bounding strike-slip faults, it is a challenge to explain the kinematics of tectonic escape in southwest Taiwan. This has motivated us to seek an alternative mechanism for the observed deformation.
The décollement for the thin-skinned deformation in southwest Taiwan is believed to be the Gutingkeng Formation [12,25], which is a late Plio–Pleistocene mudstone deposited off the Chinese continental margin [2,26,27] with younger sediments on top. The Gutingkeng Formation is characterized by overpressure of fluid with many mud volcanoes and diapirs. The overpressure reduces the effective normal stress and the material strength. Due to the subduction of the underlying Eurasian plate, the strata are tilted to the east [28]. As a result, the sediment layer above the décollement is thinner toward the west [12,13]. The lower load above the décollement in the west may not be enough to lock up the décollement. The state of the décollement could transition from locked in the eastern inland area to unlocked in the western offshore area. We hypothesized that the sediment above the unlocked décollement could move in a different direction relative to that above the locked décollement, which would lead to surface deformation compatible with the GPS observations. We tested this hypothesis, which we termed shallow escape, with a numerical simulation.
A numerical simulation was adopted for this discussion of deformation in Taiwan. Most simulations are in 2D profile view or map view. Fuller et al. [29] and Yamato et al. [30] provided 2D profile simulations of Taiwan to discuss mountain building and exhumation in Taiwan. Huchon et al. [31], Hu et al. [32], and Hu et al. [33] performed 2D map view experiments for the lateral convergence of Taiwan. Using 2D distinct element modeling, these 2D map view experiments successfully reproduced the first-order geophysical characteristics of Taiwan. However, these 2D models cannot explain the depth extent of the escape structure, i.e., whether it involves the whole lithosphere or only the shallow layer. Lin and Kuo [34] and Wang et al. [35] used 3D numerical simulations to discuss opposite-verging subduction in Taiwan and successfully explained the anisotropy observation and the exhumation. These successes show that numerical simulation is a useful tool for discussing deformation in the Taiwan orogen. However, the 3D models do not have enough spatial resolution for the escape structure in southwest Taiwan.
This study aimed to discuss the escape tectonics in southwest Taiwan using 3D numerical modeling. We (1) propose a thin-skinned model inspired by geological observations with shallow décollements, a ramp, and an open boundary, (2) present the simulated model evolution in time and space, and (3) compare the simulated ground motion with modern GPS observations to elaborate the regional deformation mechanism.

2. Methods and Materials—Numerical Solver and Models

2.1. Numerical Solver

DynEarthSol (DES) [36,37] (available at https://github.com/tan2/dynearthsol; accessed on 30 January 2023) is an explicit unstructured finite element solver for tectonic deformation. DES solves the momentum balance of forces on a Lagrangian mesh. The solver uses contingent mesh adaptivity in regions with localized shear strain, which results in refined grid spacing at shear zones. As a result, this mesh adaptivity can provide very high resolution in the fault zones while maintaining a reasonable mesh size (i.e., number of elements). The governing equations and solution procedures are based on the Fast Lagrangian Analysis of Continua (FLAC) algorithm [38]. This explicit time-marching and large-strain Lagrangian algorithm locally solves the Newtonian equation of motion in continuum mechanics approximation and updates them in large-strain mode.
The equation of motion solved by DES is:
ρ u ˙ = · σ + ρ g
where ρ is the material density, u ˙ is the time derivative of the velocity vector, σ is the stress tensor, g is the acceleration of gravity, and ∇· represents the divergence operator. The constitutive relationship is linear elasticity combined with Mohr–Coulomb plasticity. In the elastic regime, the stress and strain are linearly dependent:
σ i j = 2 G ε i j + λ δ i j ε k k
where σ is the stress tensor, ε is the strain tensor, G is the shear modulus, λ is Lame’s first parameter, and δij is the Kronecker delta. In the plastic regime, the yield stress can be expressed as:
τ = σ n × tan φ + c
where τ is the shear yield stress, σn is the normal stress, φ is the friction angle, and c is the cohesion. In the simulation, σn is the most compressive principal stress of the stress tensors, and the least compressive principal stress is compared with the yield stress τ. When the yield stress is exceeded, plastic deformation occurs according to non-associated plastic flow. The friction angle and cohesion are both physical parameters of the material. The cohesion is subjected to strain weakening when plastic strains localize into shear zones. The cohesion decreases from the initial cohesion to the weakened cohesion in each element as plastic strain accumulates from 0 to 0.1.
Hill slope diffusion is applied to the surface topography [39] to model the erosion and redeposition of sediments. It assumes that the rate of topographic change is proportional to the second-order spatial derivative of the slope:
h t = Κ e r o   2 x 2 h
where h is the topography, t is time, and Κero is the hill slope diffusivity. The models use moderate hill slope diffusivity to prevent steep fault scarps.

2.2. Model Settings

To simulate shallow escape in southwest Taiwan, we consulted the sediment isopach [28], fault geometry [9], balanced cross-sections [12,13,40,41], Bouguer gravity anomalies [42,43,44], and geological map [2] to design the model geometry. From the seismic survey and balanced cross-sections [12,40,41], the basement under southwest Taiwan is of a flat–ramp–flat geometry. Therefore, we designed a two-layer model. The upper layer is the sedimentary rock, and the lower layer is the mechanically weak layer, the Gutingkeng Formation, which is the décollement in southwest Taiwan [12].
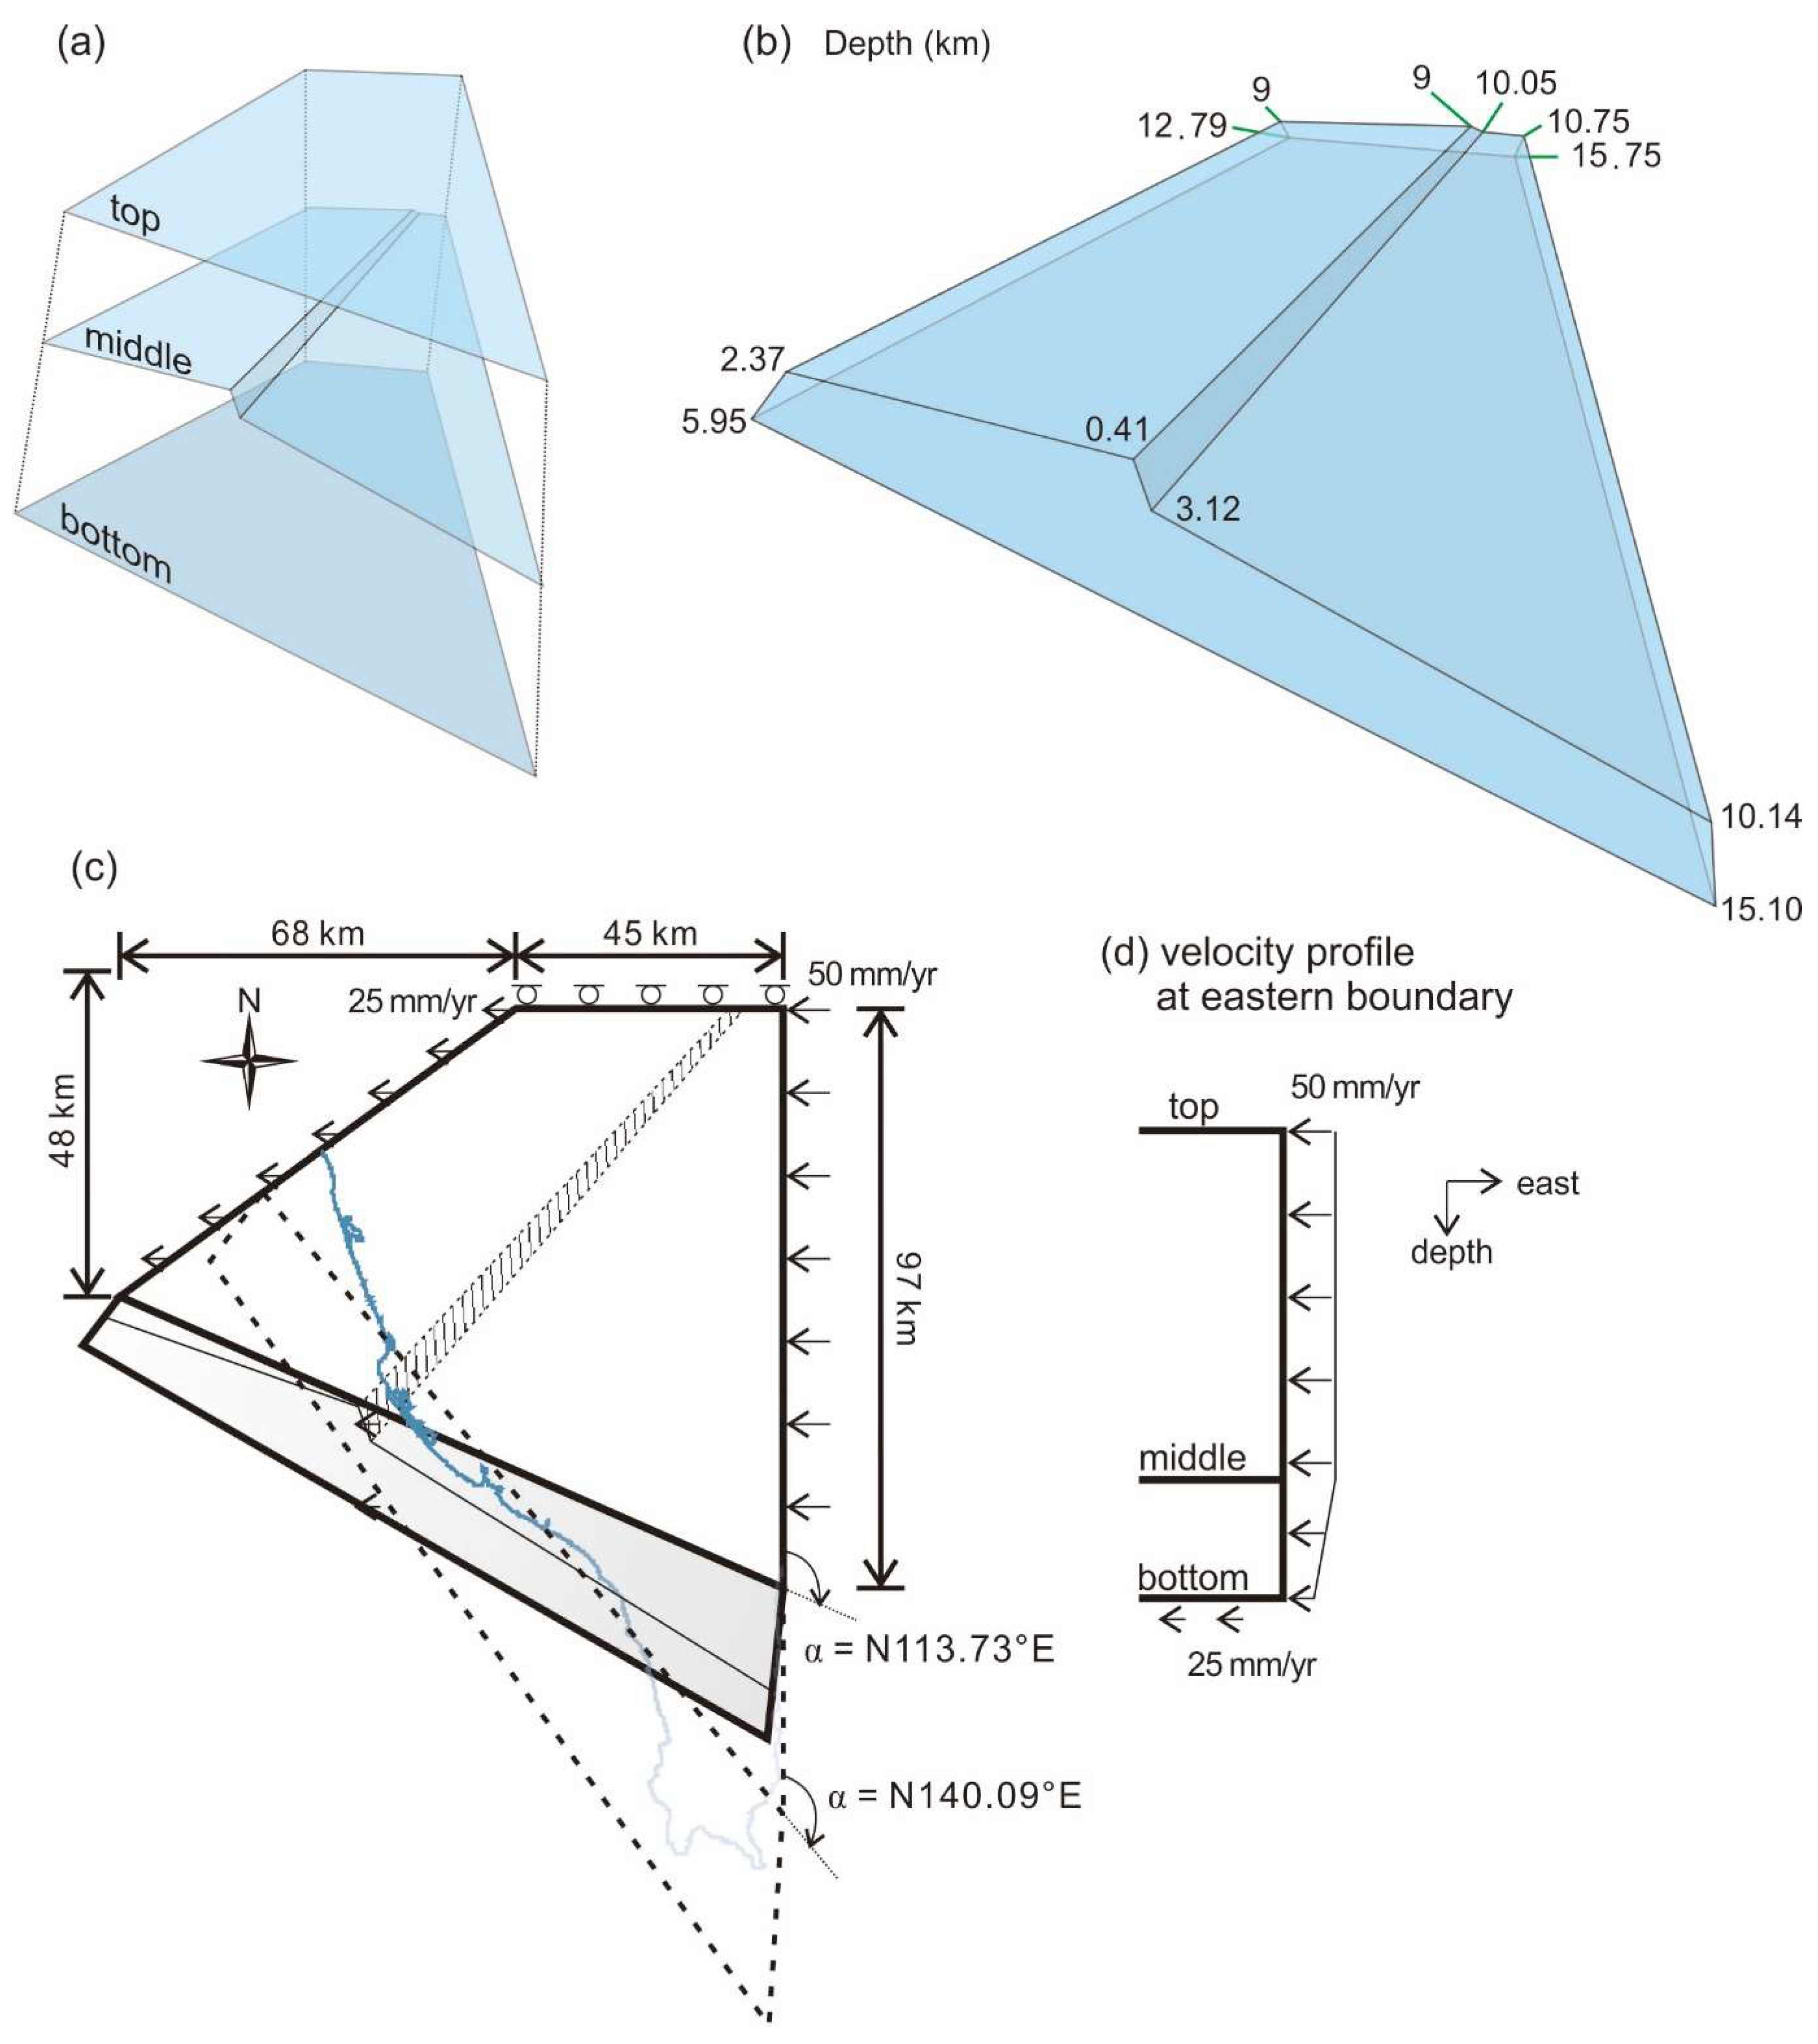
The model has a trapezoidal shape in the map view. The western boundary striking N54.03°E is set along the discontinuity in the experiments of Hu et al. [33] with a dip angle of 70°. The northern boundary, which strikes E–W with a vertical dip, is parallel to the GPS velocity east of the Pingtung Plain. The eastern boundary, which strikes N–S with a vertical dip, is parallel to the eastern boundary of the Pingtung Plain, i.e., the Chaochou fault. The northern and eastern boundaries are placed a few tens of kilometers away from the discussed area to avoid boundary effects (Figure 1 and Figure 3). The southwestern boundary is located along the continental slope and is a dipping open boundary for the escape. The actual continental slope dip is less than 2°, but our tetrahedral mesh has difficulty dealing with such a small dip. Therefore, the dip angle is 30° instead. The coastline in southwest Taiwan is not in a constant strike, so we tested two strikes of the southwestern boundary (α): 113.73° as in the Pingtung coast and 140.09° as in the Kaohsiung coast (Figure 2 and Figure 3c).
The two layers are separated by a flat–ramp–flat interface (the middle plane in Figure 3a). The location of the ramp is set around the Chishan fault. The ramp strike is set so that the resultant thrust is parallel to the Chishan fault. The interface is composed of three planes. The left middle plane is the upper flat and dips 7.35° to the north. The right middle plane is the lower flat and dips 0.3° to the north and 6° to the east. The ramp between the two flats strikes N47°E and dips 20° to the SE [26]. The bottom surface is the lower boundary of the décollement layer. It dips 4.4° to the east and 7.53° to the north. Our precursory 2D flat–ramp–flat experiments found that the dip angles of the upper and lower flats can affect the slip partition between the forethrust and backthrust above the ramp. The conjugate forethrust and backthrust developed above the ramp are equally active if the lower flat is horizontal. The conjugate backthrust becomes significantly less active if the lower flat dips more than 6°. Since the Chishan fault has no associated conjugate backthrust, we adopt 6° as the dip angle of the lower flat in our model. Previous studies have also suggested a 6°-dipping décollement in southern central Taiwan [27,45]. As the upper flat covers more offshore areas, its geometric setting is constrained by the Cenozoic isopach [28].
The initial top surface is slightly south-dipping and has a relief of 200 m above sea level at the northernmost edge and −200 m at the southernmost point of the model with α = 113.73°. The top surface in the model with α = 140.09° has the same dip as the α = 113.73° model at 0.18° (Figure 3). The difference in α between the models results in different thicknesses of the upper layer, basement depths at the southwestern edge, and lengths of the western backstop (Figure 3c). The effects of α will be discussed later in the discussion section. The detailed geometry settings used in our models are shown in Figure 3.
We proceeded with pretests concerning the effects of the basal friction angle (Φb) and the conditions of the western boundary. We found that the basal friction angle should be less than 5°. Otherwise, the décollement would be locked. Therefore, our models employed the basal friction angles Φb = 5° and 2.5° to explore the basal mechanism (Table 1). Different dip angles and velocity conditions at the western boundary were also tested to fit the observed E–W shortening. When the western boundary is free-slip, a very active sinistral fault develops along the western boundary, which does not match the situation in reality, and the Chishan fault is less active than in observations. When a shear zone with a friction angle of 10° to 15° is attached to the no-slip western boundary to mimic a frictional boundary, or when the dip angle of this boundary is set to 70°, the results are similar to the GPS observations. A 70°-dipping western boundary has a similar effect as a frictional western boundary. However, the model with a dipping western boundary is computationally less costly due to the absence of additional material attached to the boundary and was therefore chosen for this study.
The setting of the velocity boundary conditions follows the GPS observations [4] (Figure 2c). A westward velocity of 50 mm/year is applied to the eastern boundary. A westward velocity of 25 mm/year is applied to the western boundary and the bottom boundary. The northern boundary is free-slip. The southwestern boundary is free to allow shallow escape. The top boundary is free for topography to develop. The velocity boundary condition at the eastern boundary has vertical variation. The velocity decreases from 50 mm/year to 25 mm/year at the lowest 1 km thickness (Figure 2d). Water loading is applied to the top and southern surface under 0 elevation. The material properties of our models are shown in Table 1.

3. Results

All our models proceed for 40 kyr. The results are output every 1000 years. Velocity and strain rate outputs are averaged every 100 steps for smoother visualization. The time interval between steps is approximately 0.4 years, so the average temporal span is approximately 40 years.
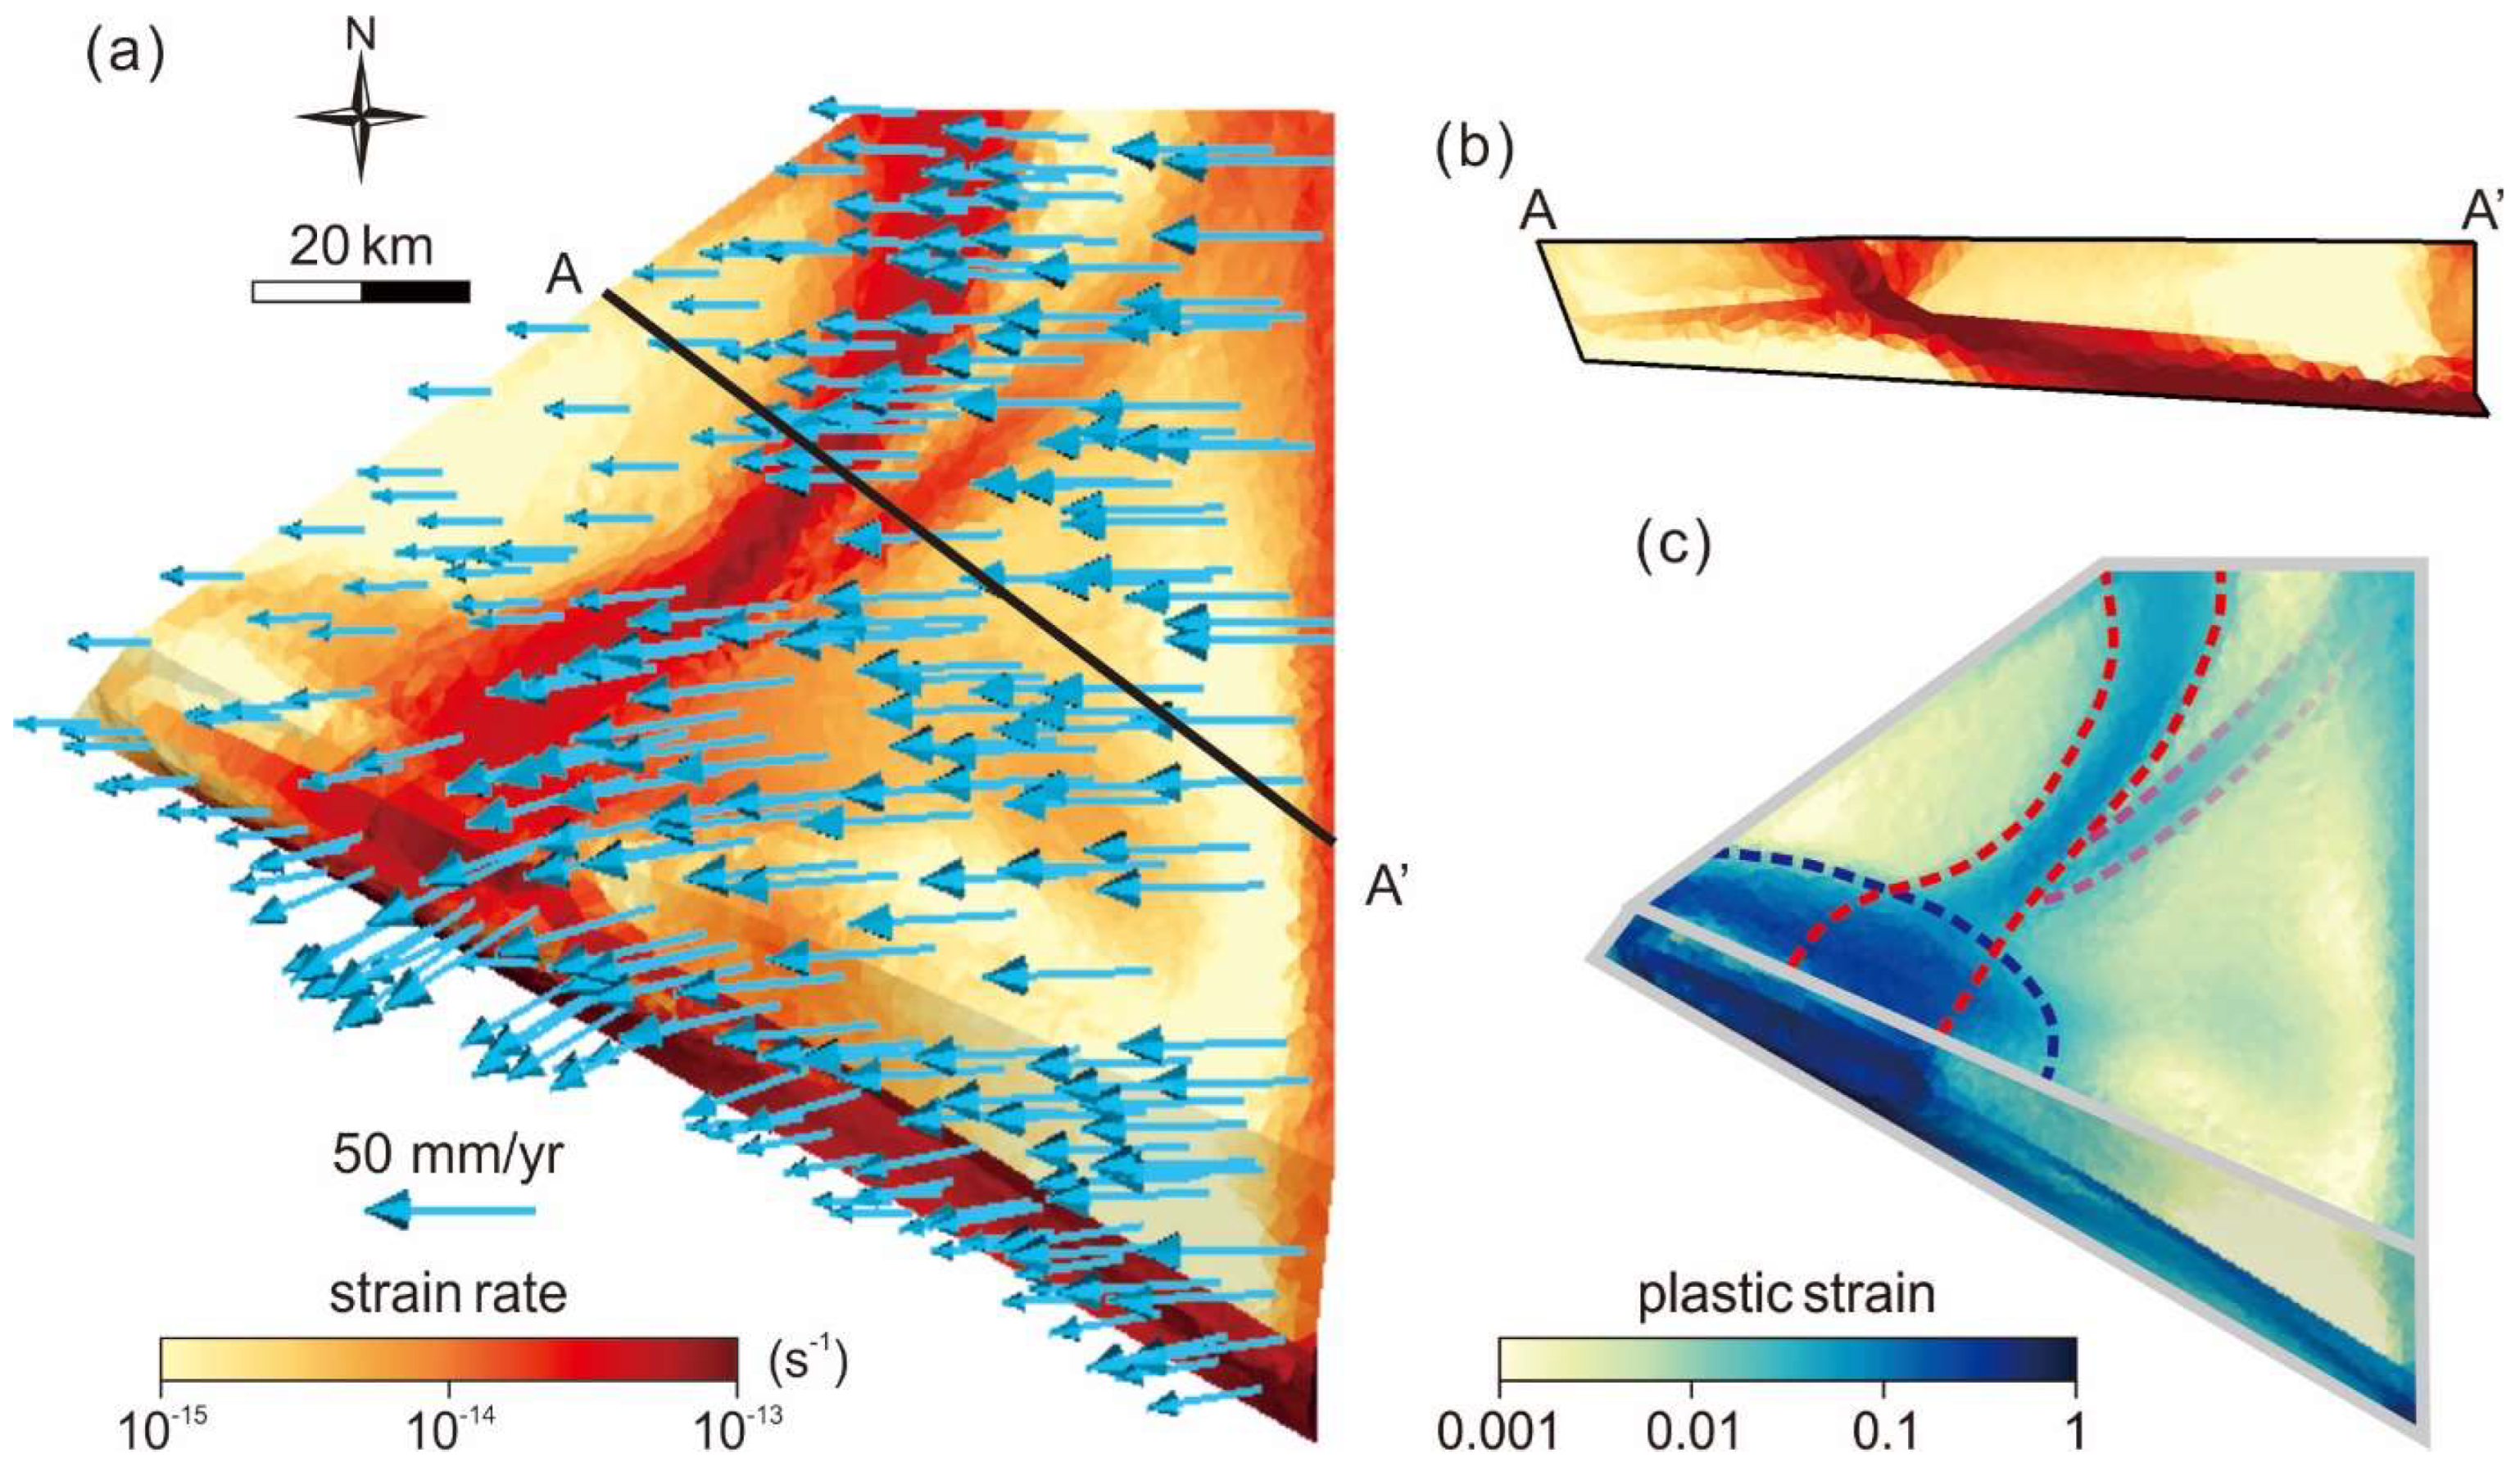
The strain rate, plastic strain, and velocity under the conditions of Φb = 2.5° and α = 113.73° at 40 kyr are presented in Figure 4. Regions with high strain rates, also known as shear zones, represent active fault zones. The plastic strain field is the total accumulated plastic deformation over the whole modeling period. The deformation pattern becomes stable after 10 kyr (Figure 5b). A dominant forethrust (shear zone marked by red dashed lines in Figure 4c) with a ~10 km-wide shear zone, develops along the basement ramp. The strike of the forethrust is roughly parallel to the ramp but turns to the N–S direction near the northern boundary due to the free-slip boundary condition there. A less active backthrust (marked by purple dashed lines in Figure 4c) also develops along the ramp. The activity of the backthrust is further reduced toward the north. The forethrust and backthrust form a conjugate pair of faults and join at the ramp top (Figure 4b). As the thickness of the top layer is thinner toward the south, the spacing at the surface between the forethrust and backthrust also decreases toward the south. The two thrusts meet and the backthrust disappears in the southernmost quarter (Figure 4c). Near the southwestern boundary, the forethrust shear zone broadens westward to ~25 km. Its strike deviates from the ramp and becomes NE–SW. The broadening occurs because this region has been weakened by early slumping deformation. In the velocity field, there are two relevant features. One is the shortening across the forethrust, and the other is the counterclockwise rotation. The southwestward extrusion is especially prominent at the southern end of the forethrust.
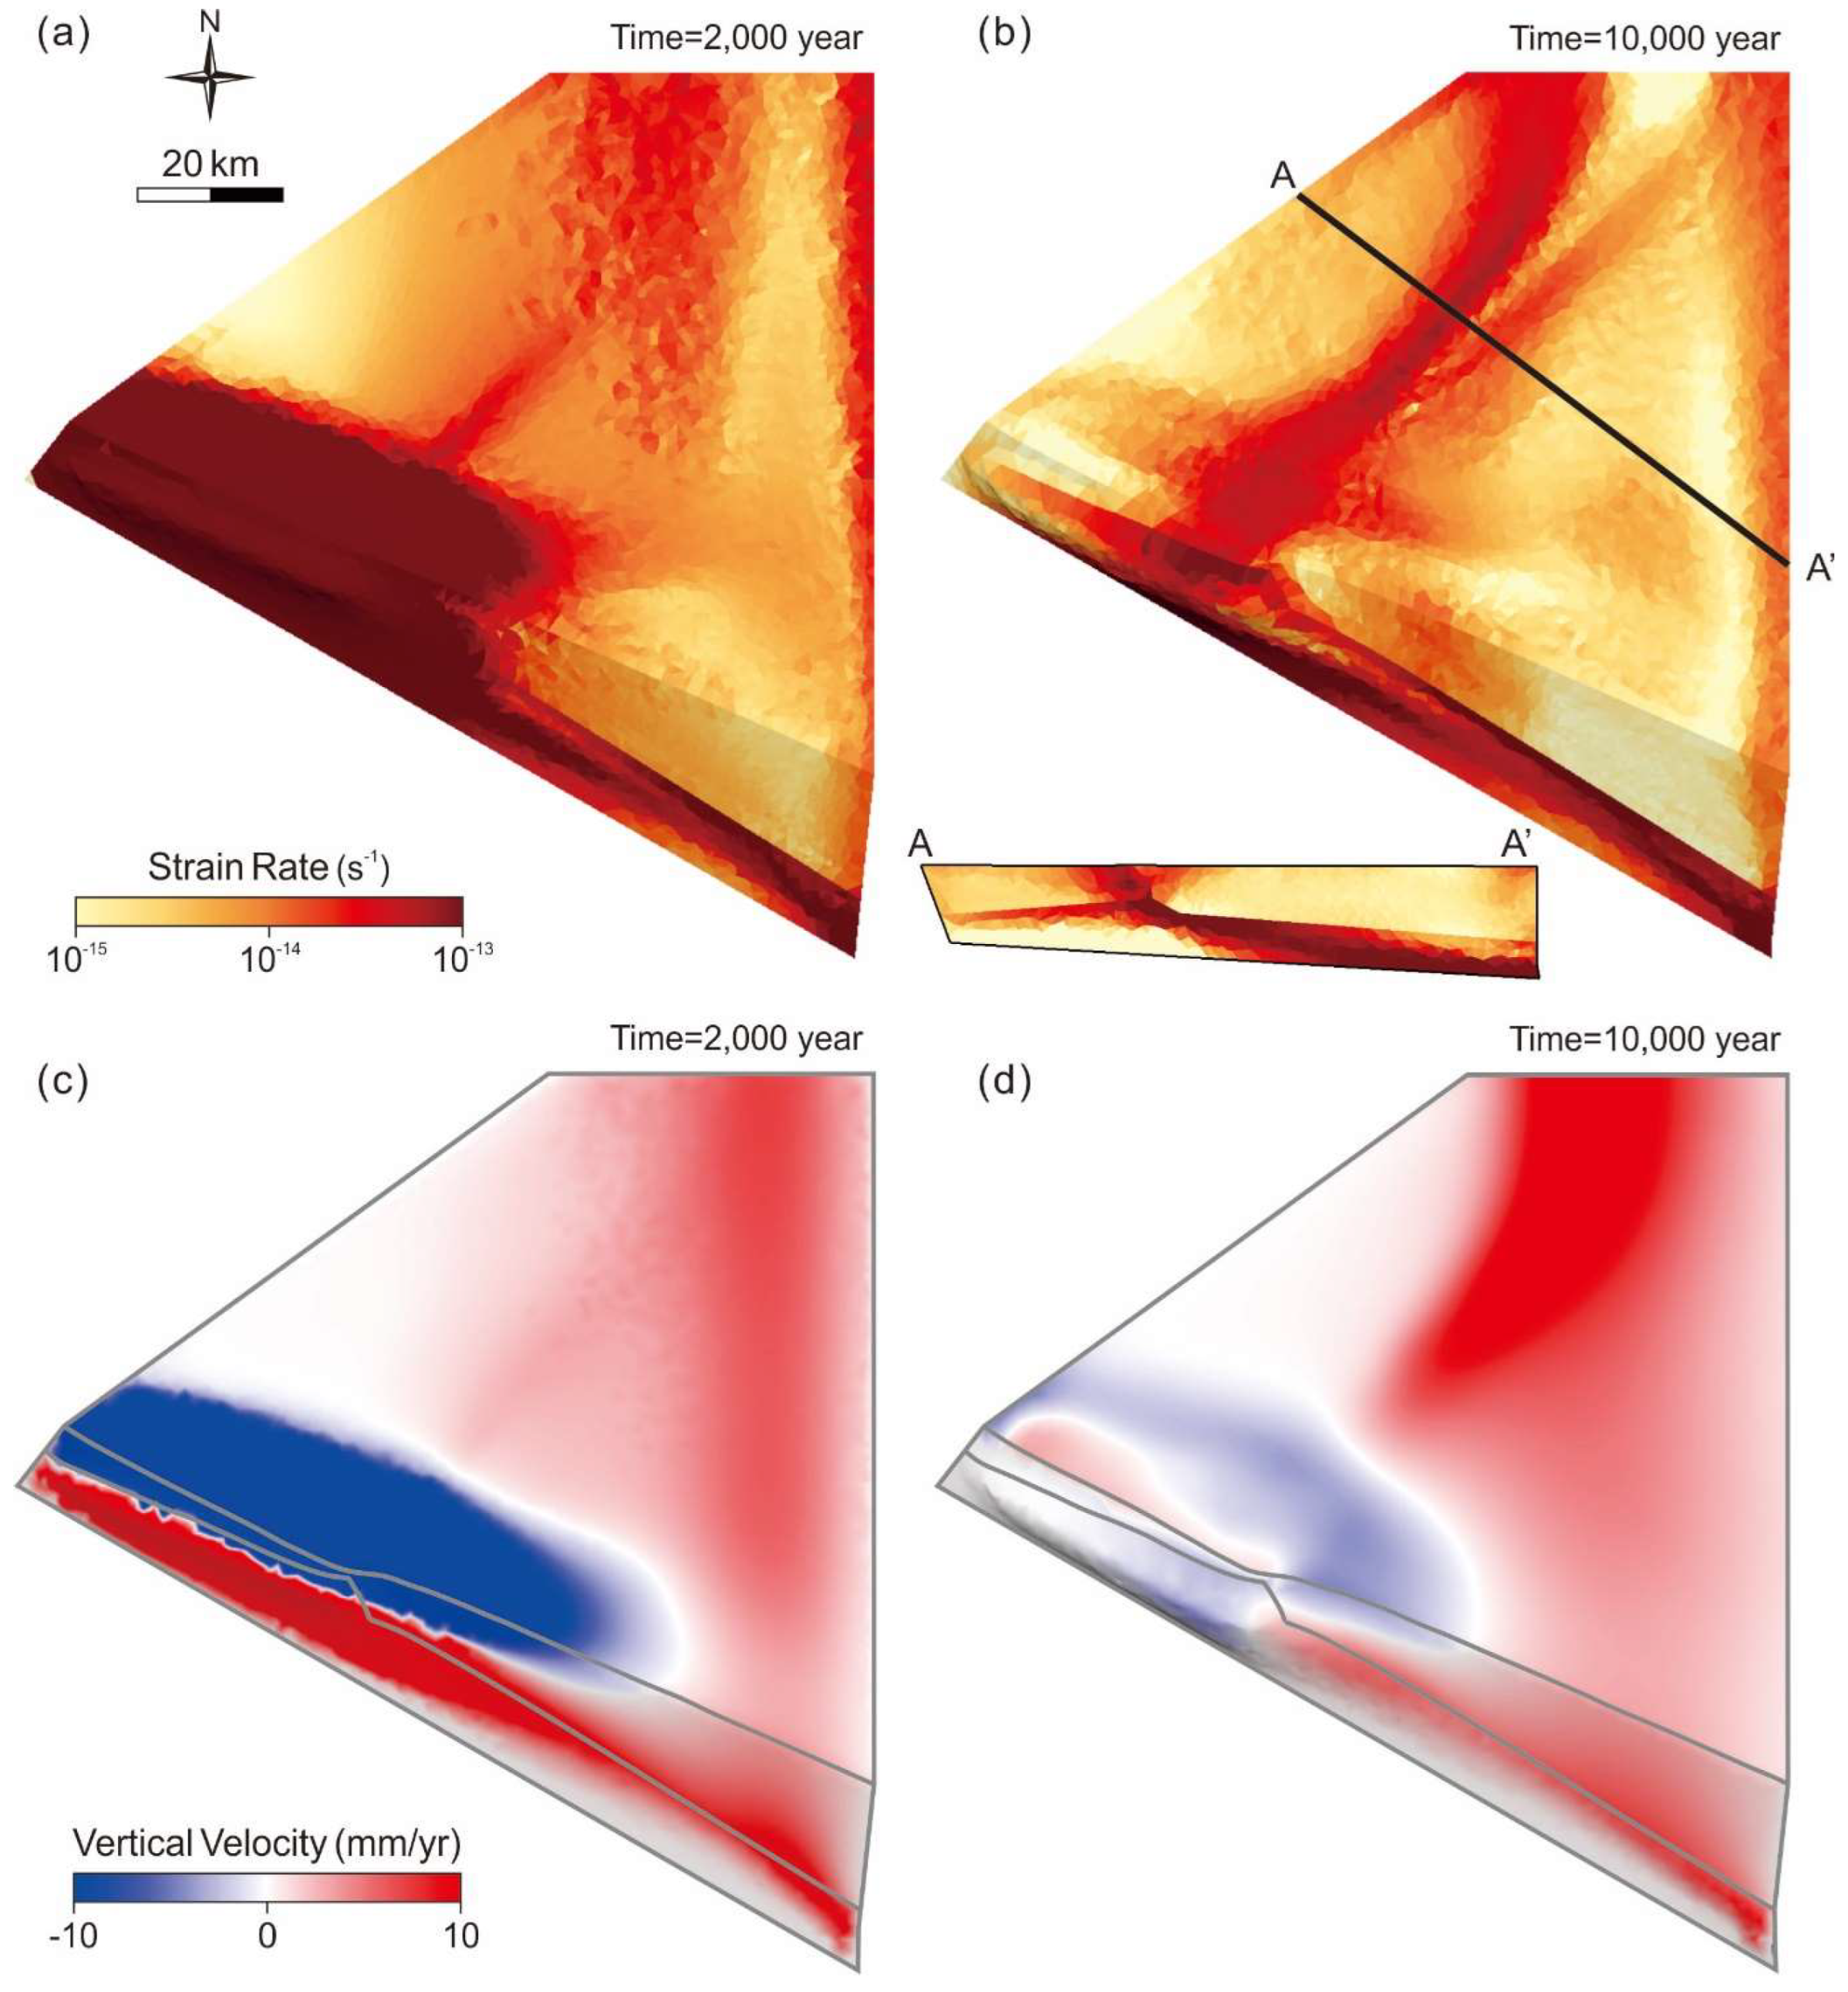
During the simulation, transient structures develop in the early stage of the model. Strong deformation due to slumping occurs near the southwestern boundary after 2 kyr (Figure 5a). The vertical velocity field clearly shows the slumping area in the early stage (Figure 5c). The subsidence rate can reach 15 mm/year, and the extent of the slumping area is approximately 80 km. Simultaneously, a transient N–S forethrust develops, which connects to the bottom of the eastern boundary. However, at 10 kyr, this transient forethrust becomes inactive as the main forethrust matures (Figure 5b). The subsidence rate near the southwestern boundary also decreases to less than 3 mm/year, and the slumping area shrinks to 60 km (Figure 5d). The strain rate field at 10 kyr (Figure 5b) is similar to that at 40 kyr (Figure 4), showing that the model deformation has been stable since then.
The orientation of the ramp and open boundary direct the shape and motion of the shear zones. In the northern part of the model with the NNE–SWS ramp, the thrust develops along the ramp with dextral motions. Near the southwestern open boundary, the strike of the fault is rotated to become nearly perpendicular to the boundary (Figure 4). The strike change is located where the backthrust and the forethrust merge and where the vertical velocity changes between uplift and subsidence (Figure 5b,d). Due to the strike change, the southern shear zone contains significantly more right-lateral components than thrusting components. Under the interaction between the geometry, faults, and the open boundary, our model has created a counterclockwise rotation in ground motions.

4. Discussion

4.1. Comparison with GPS Ground Motion

Our model showed a strain rate pattern similar to that found in the GPS data (Figure 1 and Figure 4). Both have an NNE-trending shear zone that broadens and changes to an NE-trending zone in the very south. This shear zone corresponds to the south end of the Western Foothills in terms of Taiwan’s tectonics, where several thrusts, including the Chishan fault, are located (Figure 2).
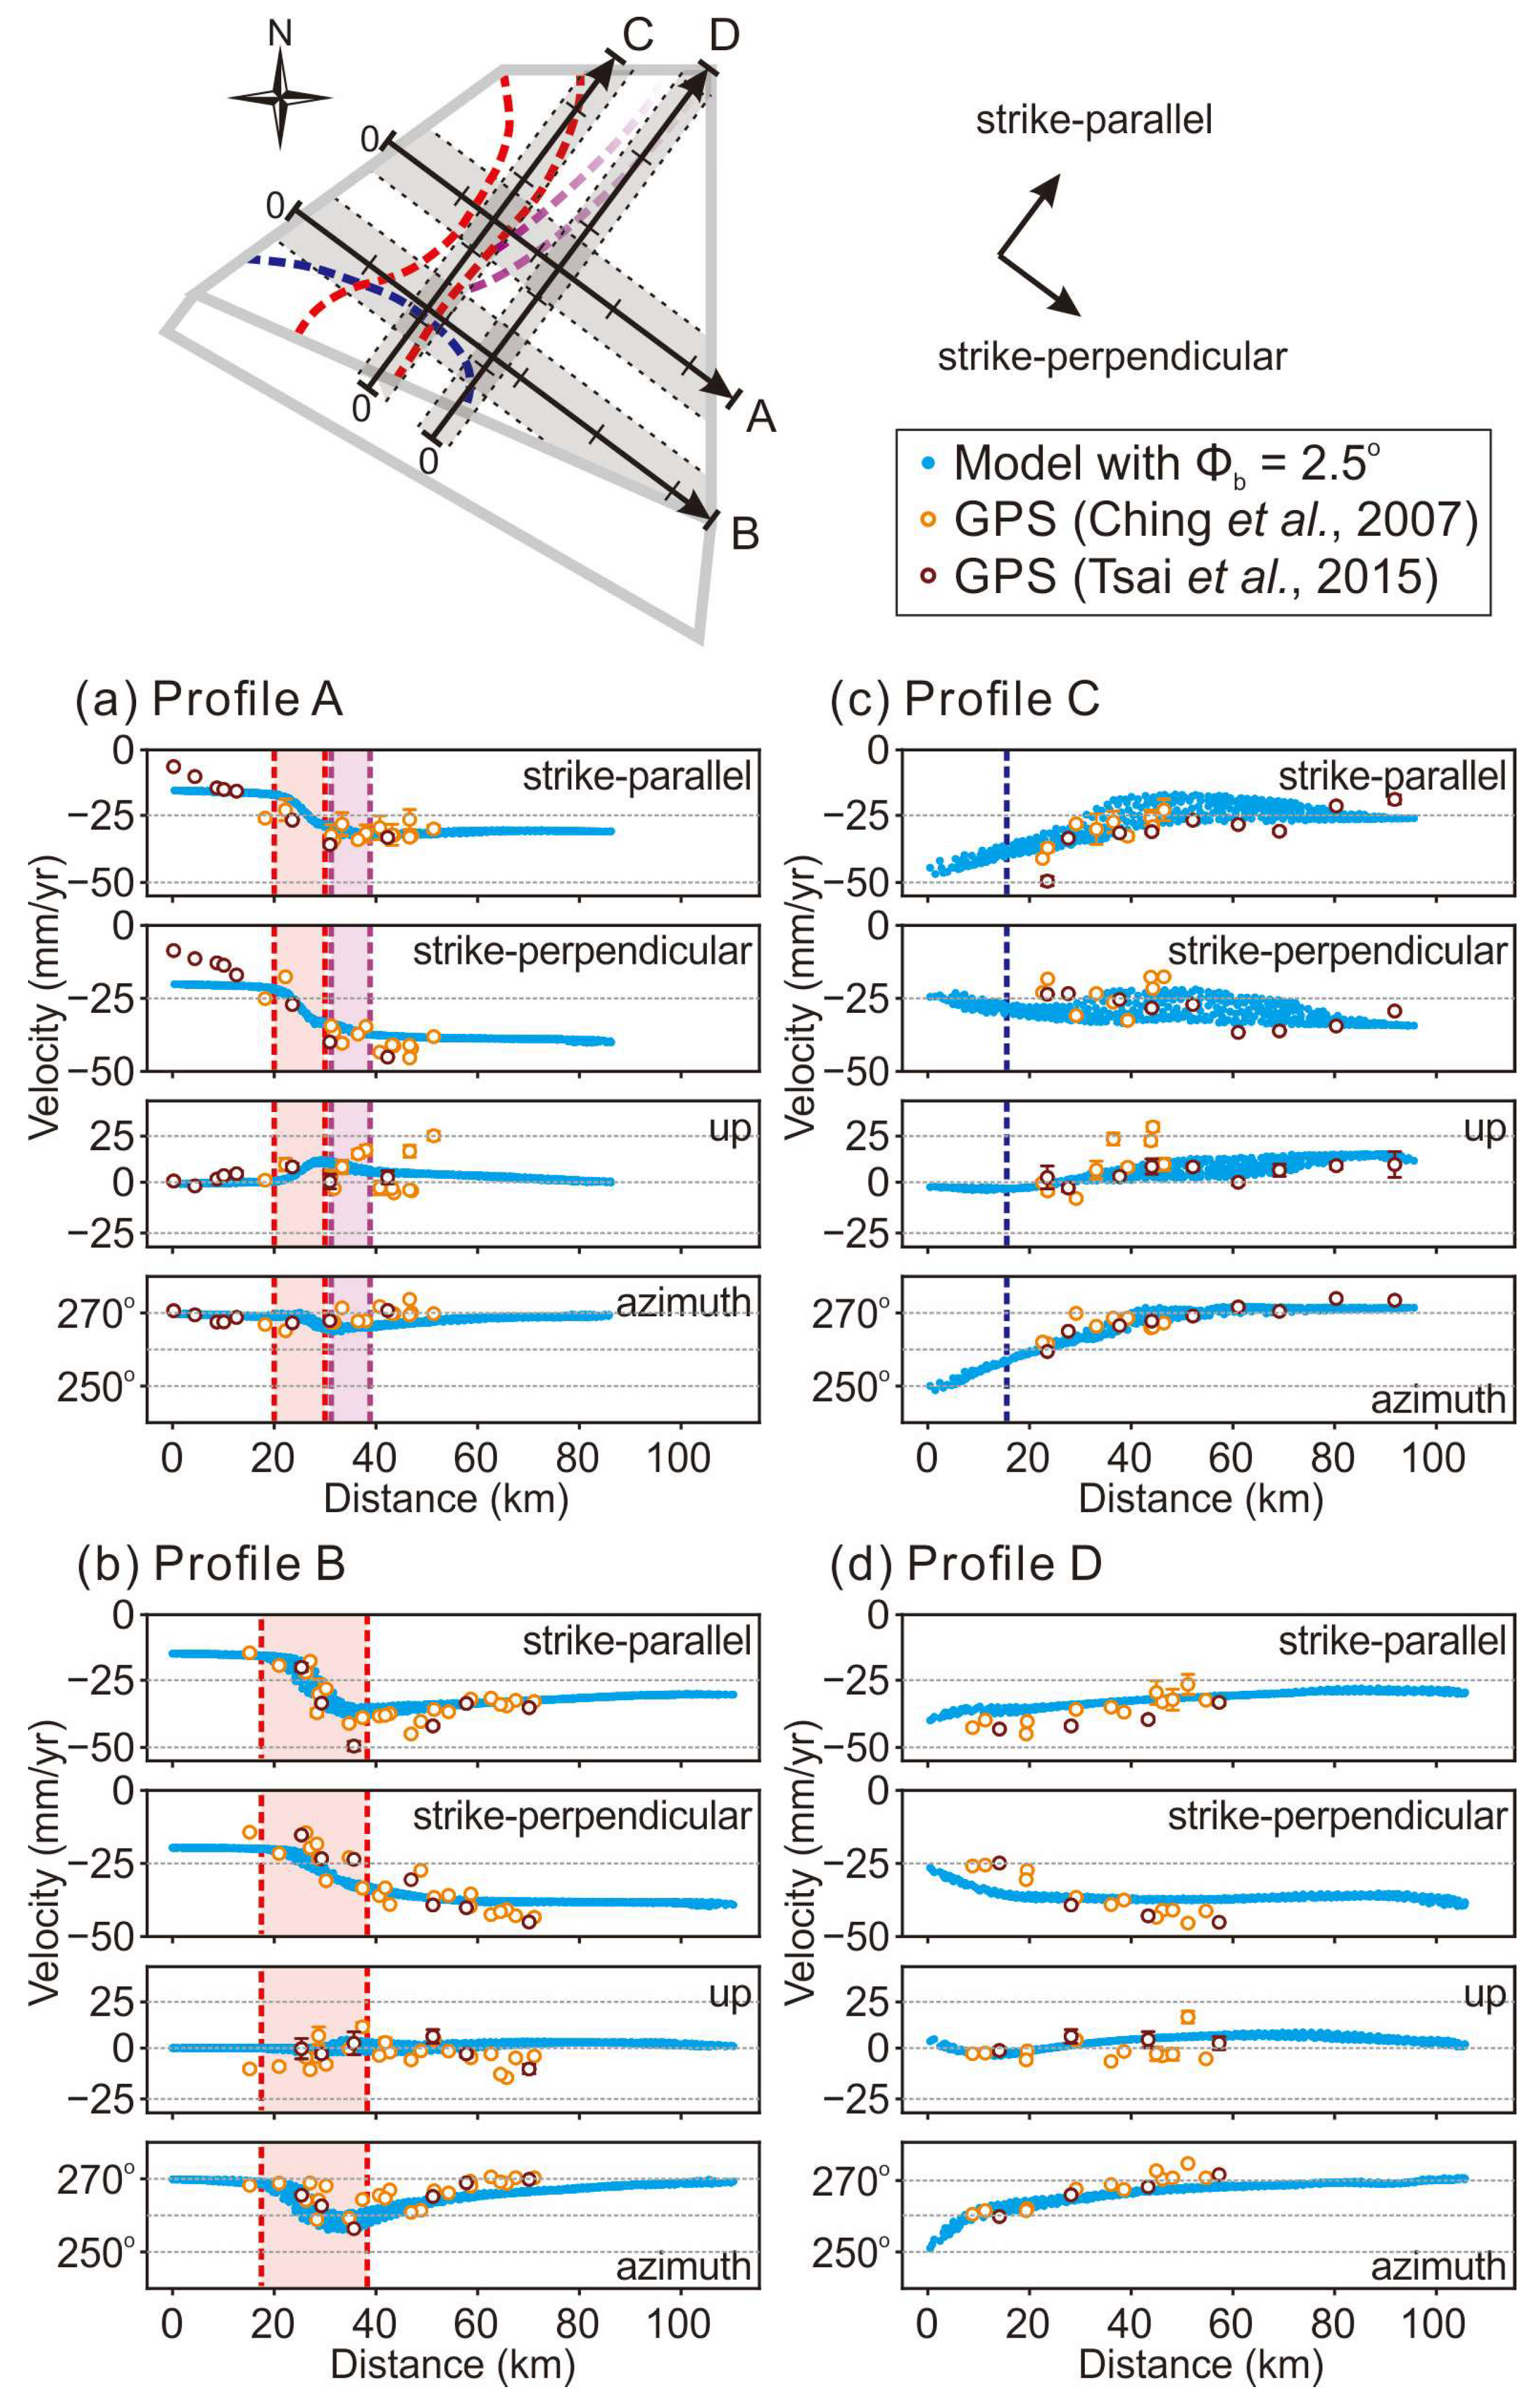
We compared the surface velocity field at 40 kyr with the GPS data for the study area [3,4]. Two GPS datasets were used for the comparison. The data of Ching et al. [4] are the most comprehensive, with the densest concentration in southwest Taiwan, and their data were compiled from 1995 to 2005. The data of Tsai et al. [3] are the most recent ground motion data for Taiwan in publication, and their data were compiled from 2007 to 2013. These two datasets share a few stations. For every GPS station, we interpolate the model surface velocity to the station’s location and plot their velocity together (Figure 6). The velocity vectors are generally in agreement. Major features, such as E–W shortening and southward turning near the coast, are well captured.
To take a closer look at the model’s performance, we compared the ground velocity along four profiles (Figure 7). Profiles A and B are perpendicular to the Chishan fault (the forethrust in our model). Profile A is the same as profile AA’ in Figure 4b, while profile B is 20 km south of it. Both profiles have 20 km widths. Profiles C and D are parallel to the Chishan fault, and their widths are reduced to 10 km to avoid the complication of data across the strike-parallel structures. profiles C and D are located across the Pingtung Plain in the NE–SW direction, which approximates the Chishan fault’s strike. Shear zones are marked with corresponding colors in the profiles. The GPS data are usually more scattered than the model results. Therefore, we will focus on the trend in the GPS data and ignore individual outliers.
In profile A (Figure 7a), we can identify the active shear zones of the forethrust and the backthrust. The forethrust (red zone) is a very active reverse fault with ~17 mm/year horizontal shortening and 18 mm/year right-lateral components. The backthrust (purple zone) has no strike-parallel component and only a weak (3 mm/year) strike-perpendicular component. The region between the forethrust and the backthrust is uplifted with a maximum rate of 13 mm/year. The GPS data also show a right-lateral thrusting motion across the shear zone, but have a large scattering. Near the western boundary, the model results deviate from the GPS data because our model does not have thrusts there. In the azimuthal profile, the model showed a slight southward rotation between thrusts; its magnitude is small and comparable to the scattering of the GPS data.
In profile B (Figure 7b), the forethrust shear zone is broader than in the other profiles and has 12 mm/year horizontal shortening and 26 mm/year right-lateral components. The model fits the GPS data fairly well in this profile. Compared with profile A, the shortening is reduced, but the lateral component is enhanced. The backthrust disappears, and the uplift is negligible. A southwestward rotation occurs within and east of the forethrust shear zone, which is close to the slumping area. Southwestward escape can be seen in the strike-parallel and up components. In the strike-parallel component, the southwestward velocity significantly increases in the shear zone and reaches its largest value at ~35 km; the southwestward velocity then gradually decreases to the east, as does the azimuthal profile. The azimuthal profile shows a 15° maximum rotation, consistent with the GPS data. In this profile, we can infer that the southwestward escape mainly occurs within the shear zone, and the shear zone also acts as the western boundary of the escape structure.
In profile C (Figure 7c), the model velocity has a large scattering, even with a narrower profile. The most scattered section (at 30–60 km) is located within the forethrust shear zone (Figure 4a). This result suggests that the scattered GPS data in profiles A and B might be caused by some unmodeled shear zones. The strike-parallel component shows that the southern half is moving southwestward, changing ~25 mm/year in a 45 km span. The GPS data also agree with this southwestward motion. The northern half of this profile shows little change. In the strike-perpendicular component, a ~10 mm/year variation occurs across the profile (~100 km in length). The GPS data show a 10 mm/year variation at 80 km in this profile, with a steeper gradient than the model. In the up component, both our model and the GPS data agree with an uplift of ~10 mm/year at the northern end of this profile. At 40 km along profile C, data from Ching et al. [4] show active and scattered uplift, which our model does not reproduce. Ching et al. [4] argued that a mud diapir causes uplift. In the azimuthal profile, our model fits the GPS data well. Both show a 20° rotation in the southern 40 km.
In profile D (Figure 7d), which is far from most of the shear zones, the model and the GPS show similar tendencies in the horizontal components, but the trend in the GPS data is larger than that in the model. In the strike-perpendicular component, the variation in GPS data is ~10 mm/year larger than that in the model across 60 km, indicating an unmodeled shear zone, which is likely the Fengshan transfer fault (⑦ in Figure 2) [3]. In the vertical component, the GPS data are scattered. However, on close examination, scattering occurs only in the data of Ching et al. [4], while the data of Tsai et al. [3] show little vertical variation in this profile, as is the case for the model results. In the azimuthal profile, the azimuth of the velocity vectors changes from 270° to 260° in both the GPS observations and the model.
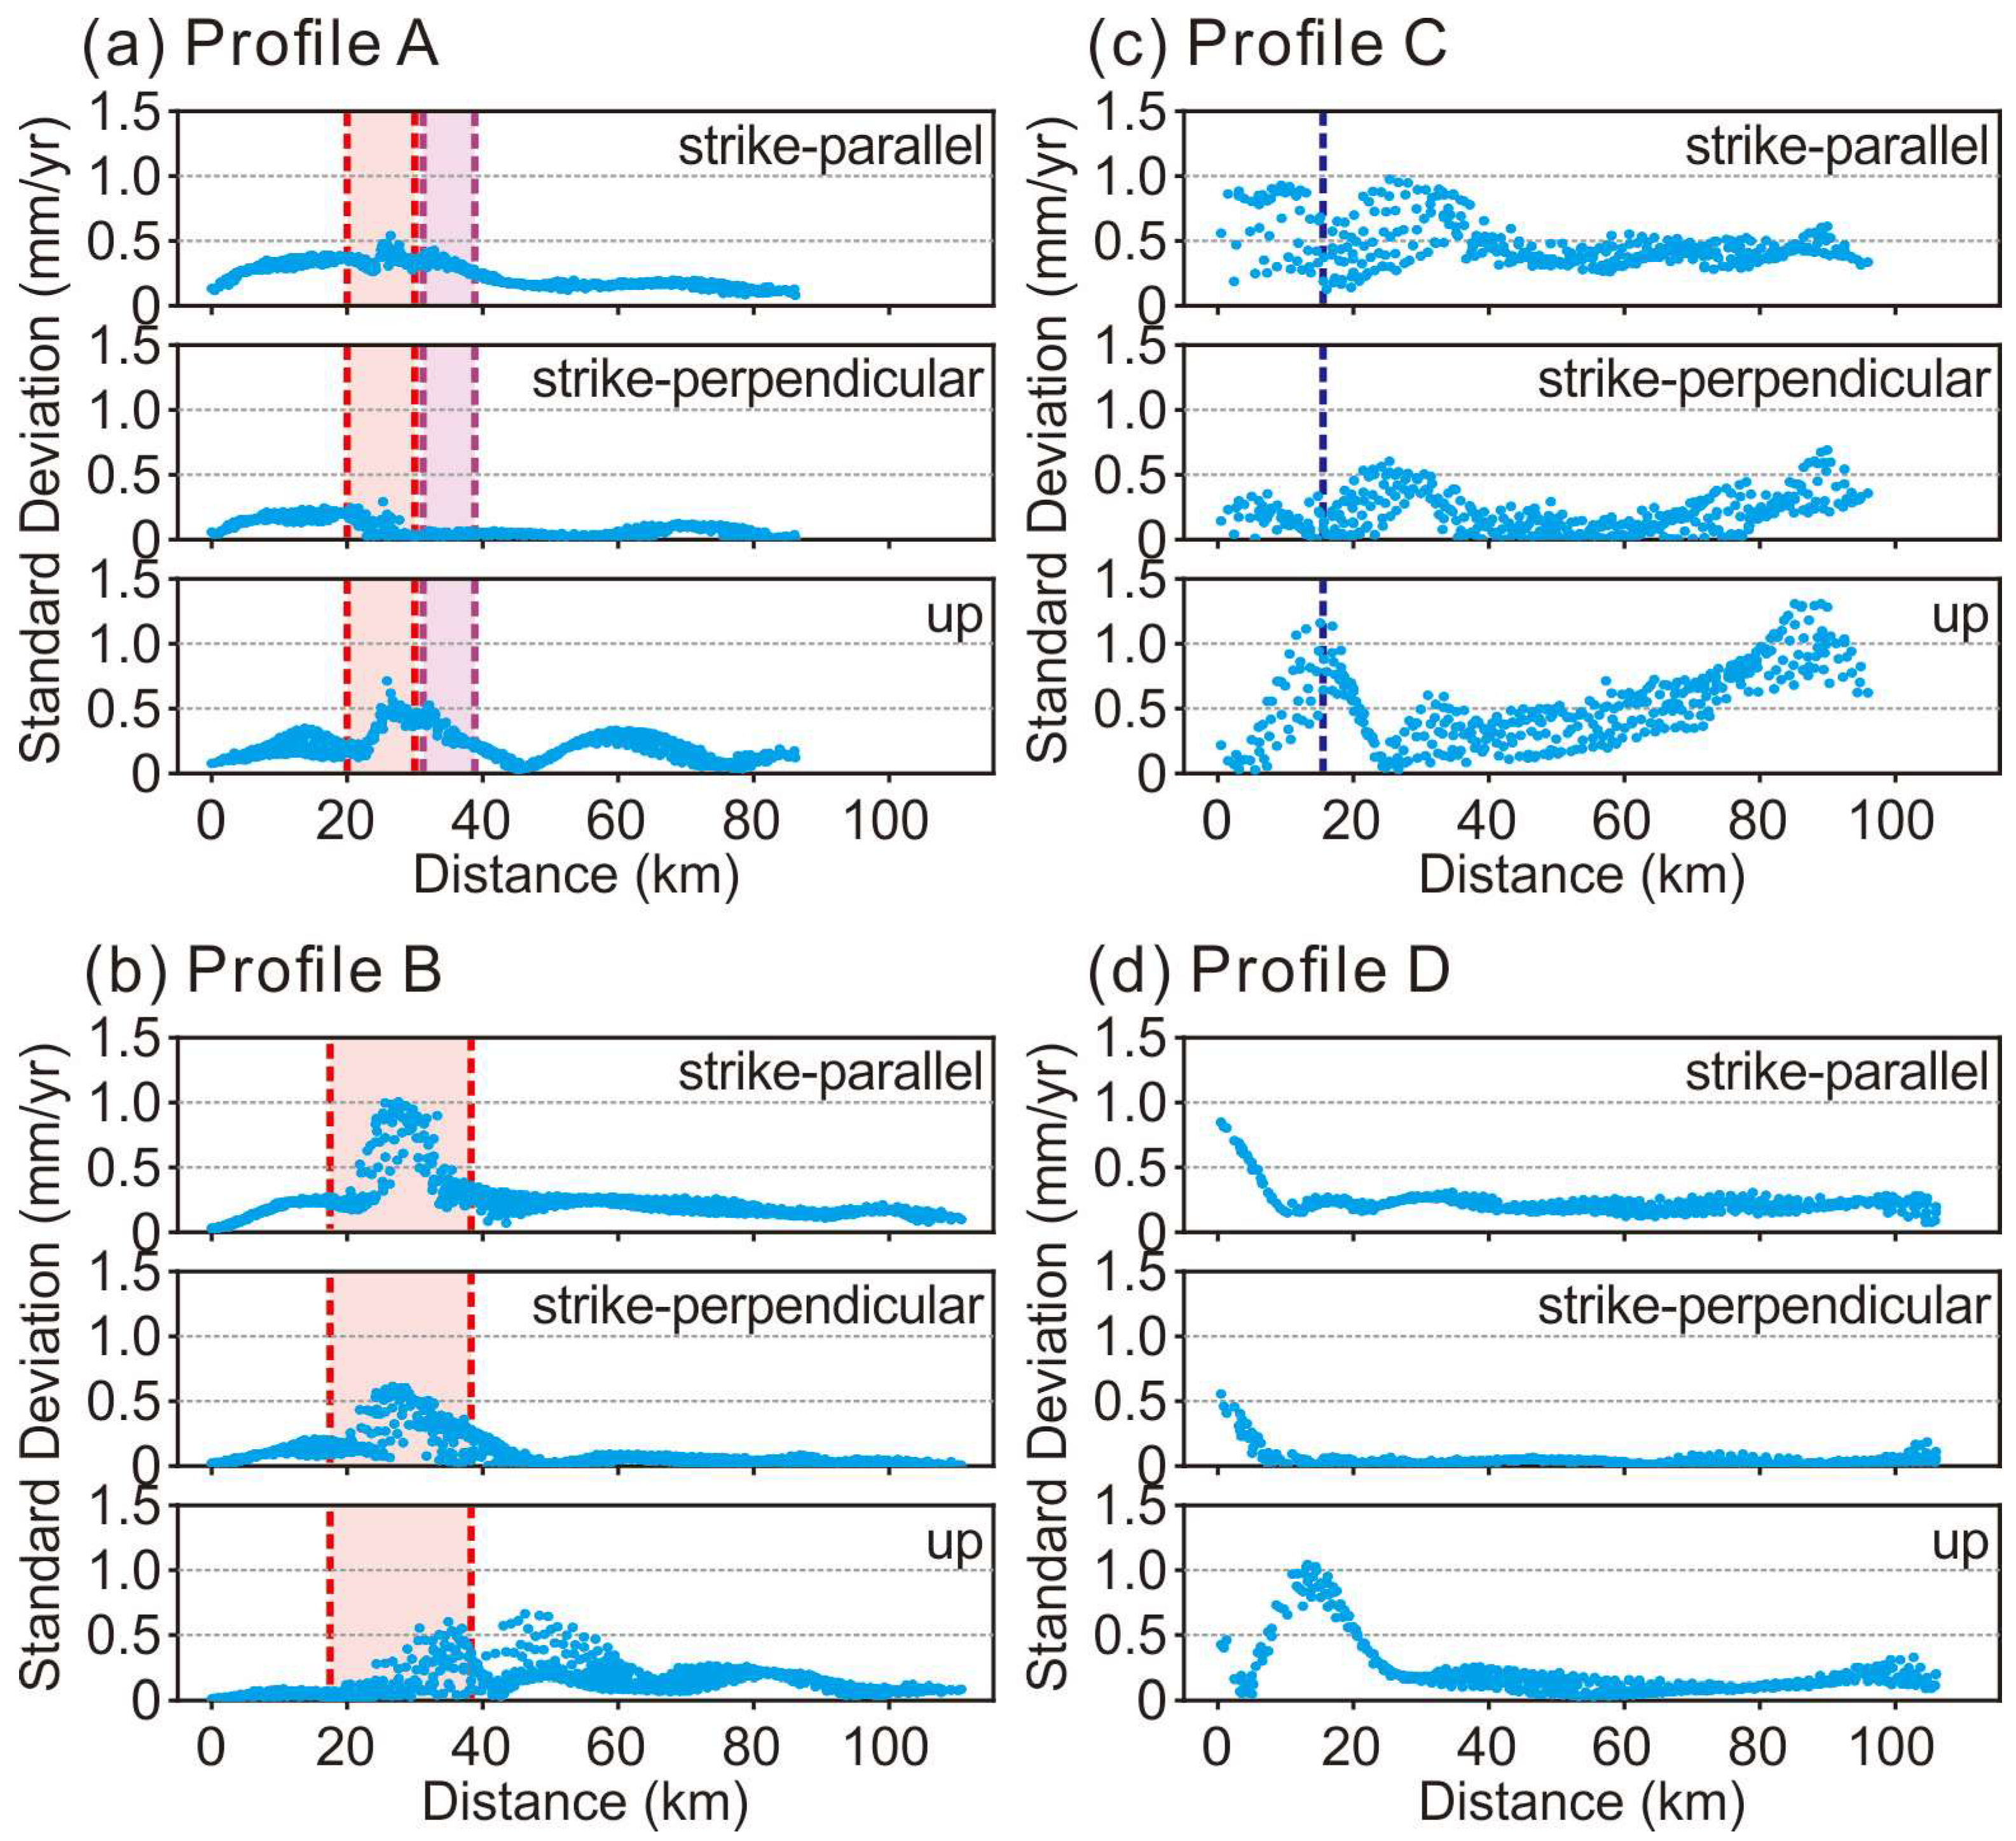
The standard deviation of the model velocity from 10 kyr, when the model reached a quasi-stable state, to 40 kyr is shown in Figure 8. The amplitude of the standard deviation is high in the slumping area and the shear zone. All standard deviations are significantly less than 1.5 mm/year. We can conclude that the ground motion in the model is reliable and can be safely compared with the GPS observations. Note that the uncertainties presented here are based on model simulations, which explains the variability of the mean in our modeling. The variability of the process or population of the system response would be much larger.

4.2. Extremely low Basal Friction

The mechanical behavior of a décollement under convergence has long been discussed. The relationship between its mechanical strength and the wedge geometry, where the taper angle of a wedge is a function of the internal friction of the wedge material and the basal friction, has been formulated [46,47,48]. Additionally, many analog and numerical models have shown that stronger basal friction would lead to steeper thrusts and larger displacements along thrusts [49,50,51,52].
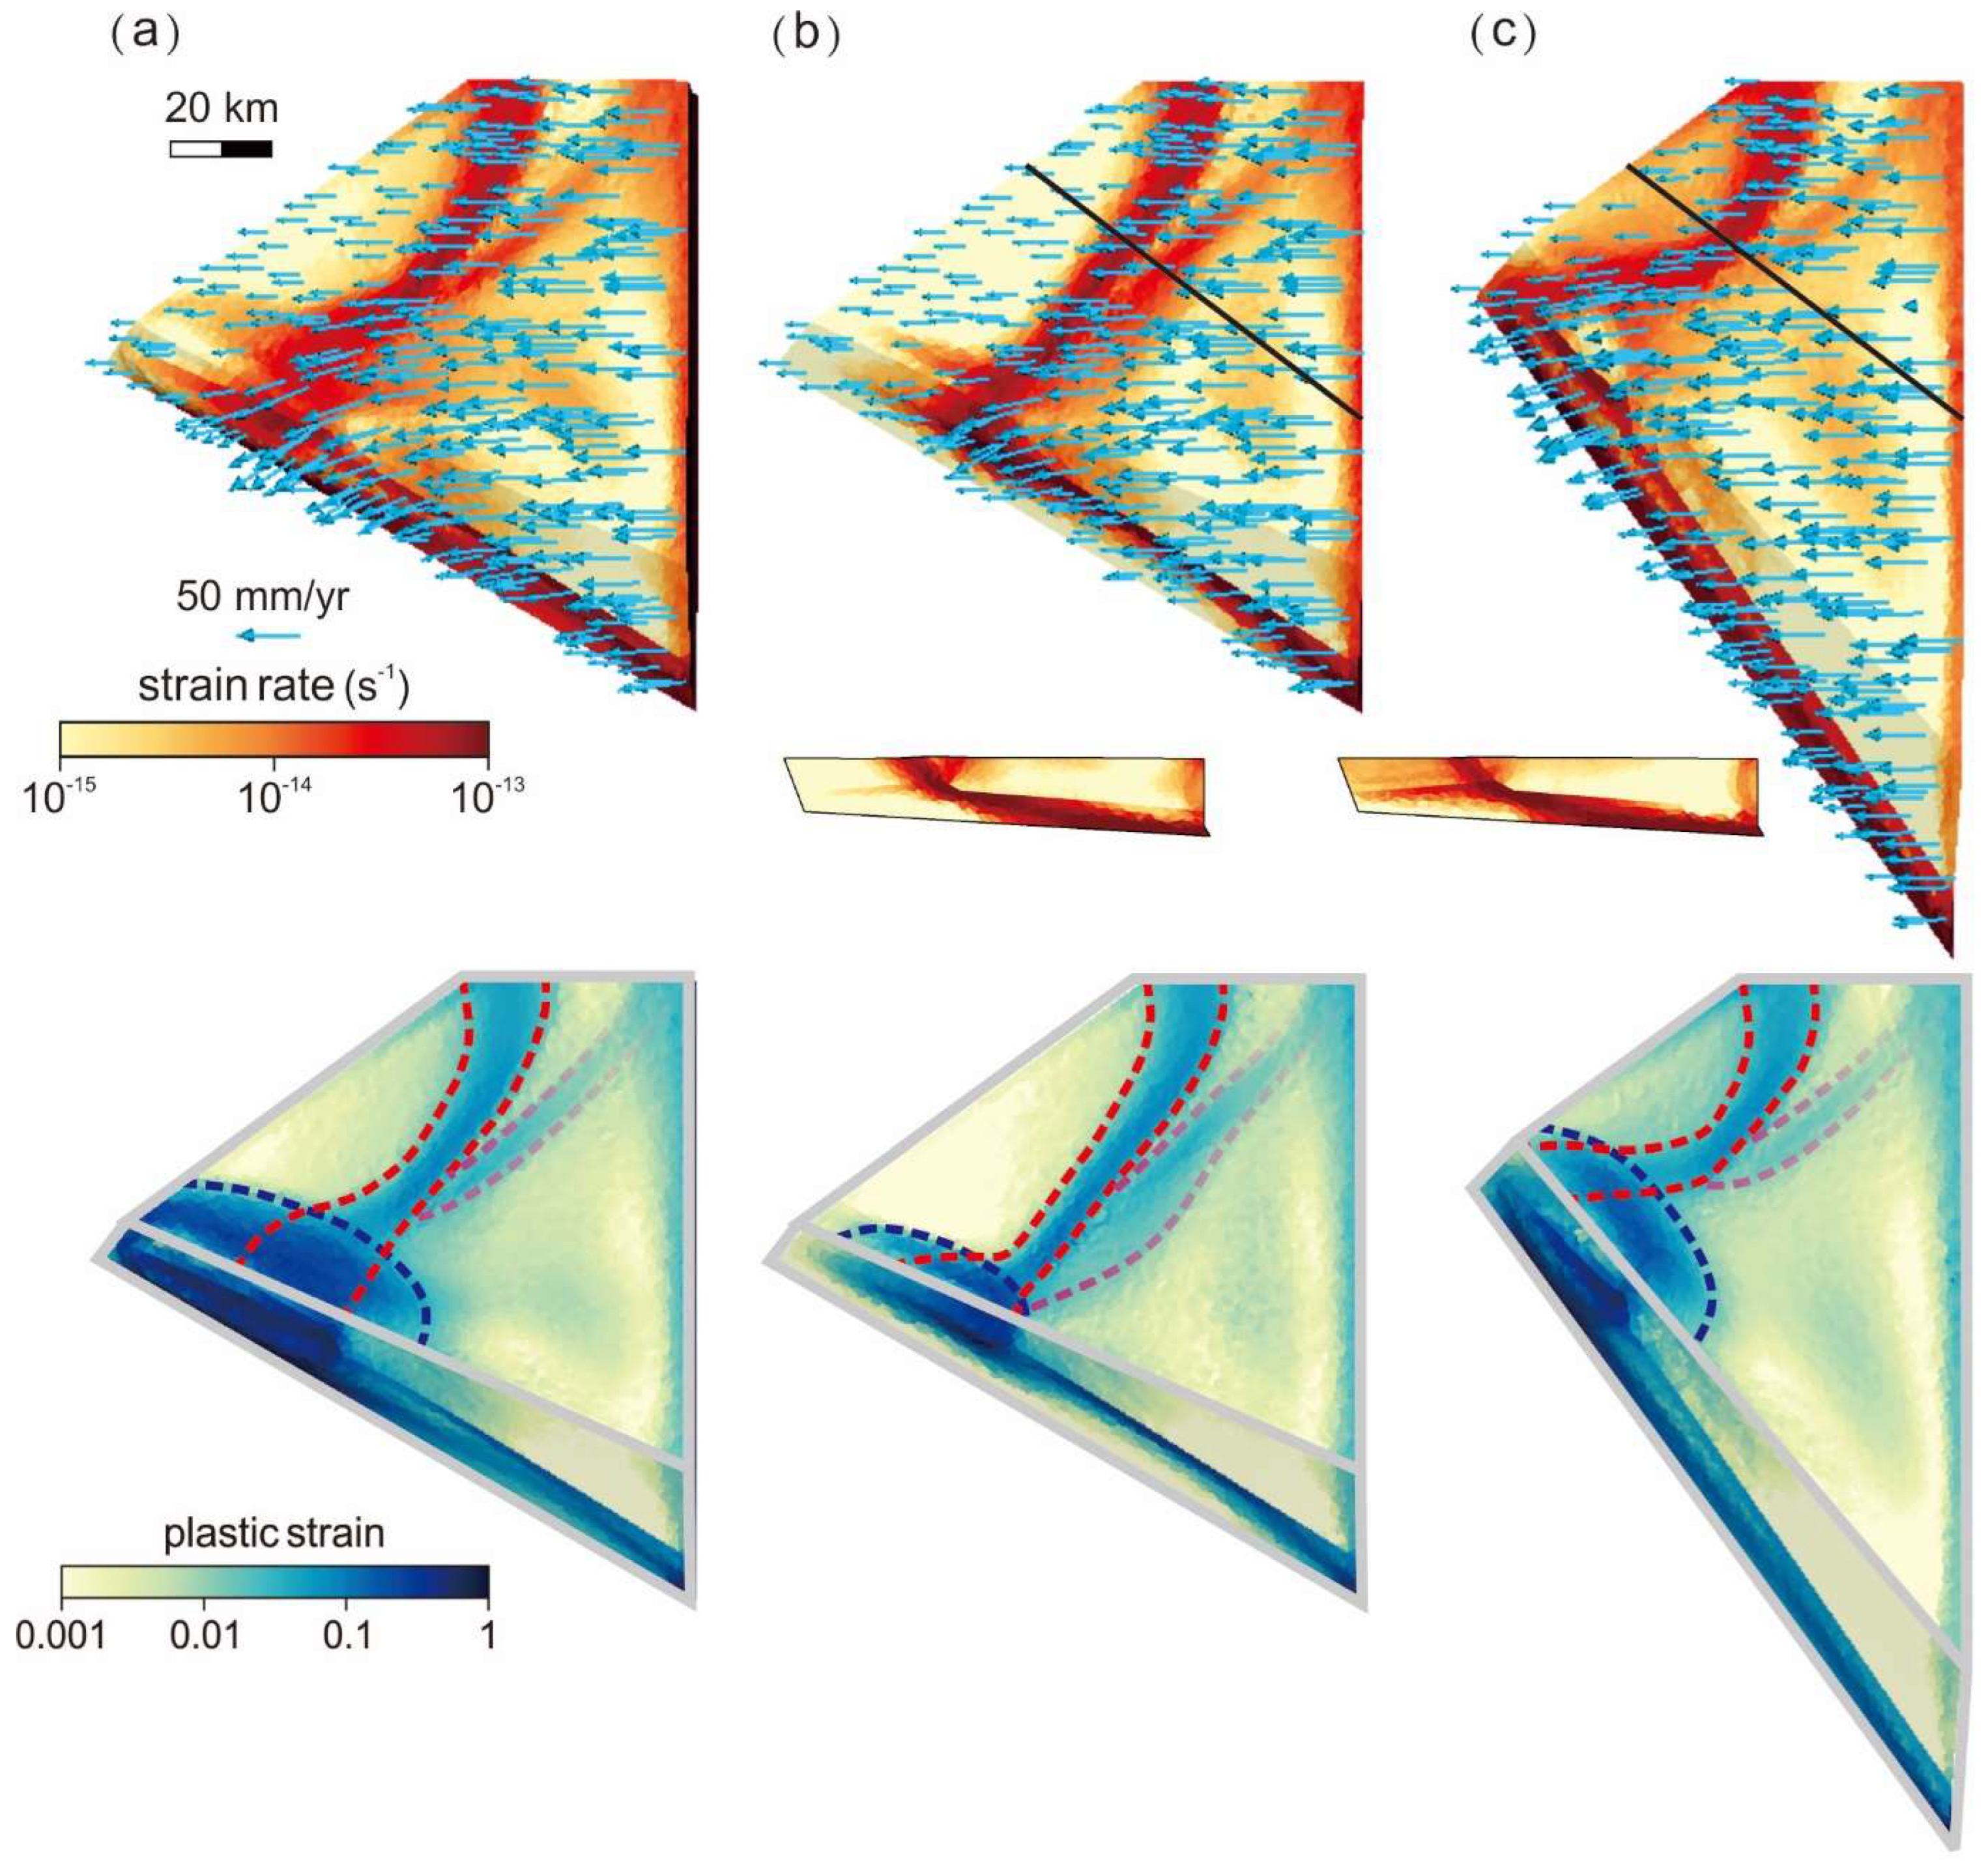
Two models with the same boundary conditions and model geometry but different basal frictions are discussed here (Figure 9a,b). In one, Φb = 2.5° (friction coefficient ≈ 0.044), which has been described in detail in Section 3. In another, Φb = 5° (friction coefficient ≈ 0.087). When Φb = 5°, the strain rate field shows the main shear zone developing along the ramp and keeping its strike to the south. In addition, deformation concentrates at the fault zones. Profiles across the ramp also show that the décollement is not activated west of the ramp when Φb = 5° (Figure 9b), while most of the décollement is activated when Φb = 2.5° (Figure 4b). The strain rate fields also show that the location where the forethrust and backthrust meet moves southward when Φb = 5°. Plastic strain fields show that the range of slumping decreases with increasing Φb. The width of the slumping area shrinks from ~30 km to less than 10 km, and the width shrinks from ~60 km to ~40 km when Φb increases from 2.5° to 5°. When Φb = 5°, the velocity field also presents a counterclockwise rotation. The rotating area is smaller than the rotating area when Φb = 2.5°, and it centralizes at the intersection of the open boundary and the ramp. The southwestward velocities are also smaller than those in the model in which Φb = 2.5°. We conclude that the model with extremely low basal friction better reproduces the lateral extrusion.
These major features were also reproduced by the previous 2D map-view model [33]. However, in the 2D model, the escaped block is between the deformation front (DF in Figure 1) and the Chaochou fault (① in Figure 2), and is not confined to the coastal region. In addition, the lateral bounding faults (DF and the Chaochou fault) have a low friction angle (15°) in the 2D model compared with our model (30°). The escape motion in our model is mainly facilitated by the extremely weak décollement so that lateral bounding faults do not have to be as weak as those in 2D model.

4.3. Orientation and Geometry of the Open Boundary

The open boundary in our model, representing the continental slope, is a straight line, while the continental slope in southwest Taiwan is curved. We tried two different orientations of the open boundary (α) to examine its effects. One was the model presented in the results section, where α = 113.73°, parallel to the Pingtung coastline, and in the other, α = 140.09°, parallel to the Kaohsiung coastline.
The strain rate and plastic strain fields are significantly different in the two models (Figure 9a,c). Both models show strike changes in their main shear zones. The position of the strike change in the model in which α = 140.09° is north of its position in the model in which α = 113.73°. In the model in which α = 140.09°, the southern segment of the forethrust almost strikes E–W. The velocity field reveals that the dextral motion increases from north to south along the forethrust with the change in strike. The velocity field also shows a counterclockwise rotation of small magnitude. The plastic strain fields show that the slumping areas are located at the west end of the open boundary in both models. The slumping areas are similar in shape and range, but the location and strike are different depending on the strike of the southwestern boundary. In the model in which α = 140.09°, the slumping area is located north of the slumping area in the model in which α = 113.73°.
The open boundary can alter the stress field in the neighborhood and make σ3 perpendicular to the southwestern boundary in horizontal components. The direction of the shear zone may change near the open boundary. Additionally, the early slumping, which weakens a wide range of materials, follows the strike and cutoff of the open boundary and directly leads to the differences in strength distribution and vertical velocity fields. When the angle between the open boundary and the convergence direction is large (>50°), materials can escape toward the open boundary without much change in direction [5,8]. All these effects let the strike change of the open boundary influence the results significantly.

5. Conclusions

This research proposes a shallow escape mechanism for the deformation in southwest Taiwan. We performed 3D numerical simulations of thin-skinned deformations with an open boundary at the continental slope, a shallow ramp, and décollements. The open boundary is a free surface through which materials are allowed to escape and which influences the stress field and changes the orientation of the main shear zone. Active slumping occurred around the open boundary in the early stage before the main shear zone developed. The deformation was further enhanced around the ramp due to the geometric effect. These early deformations weakened materials and changed the strength distribution. The main shear zone later developed across strength-inhomogeneous materials along the shallow ramp. The main shear zone broadened westward and dispersed with the decrease in material strength. Its strike rotated clockwise in the southern quarter. As a result, the main shear zone was curved, which made the model velocity field fit the GPS observations. We conclude that (1) the interaction of shallow structures, including the open boundary and shallow ramp, can lead to escape in thin-skin deformation; (2) an extremely low basal friction is necessary to reproduce the velocity field in southwest Taiwan; and (3) the angle between the convergence direction and the strike of the open boundary should not be larger than 50°, otherwise the materials will move toward the open boundary without much change in direction.

Author Contributions

Conceptualization, E.T. and E.T.-Y.C.; data curation, F.-Y.L.; formal analysis, F.-Y.L.; funding acquisition, E.T. and E.T.-Y.C.; project administration, E.T. and E.T.-Y.C.; supervision, E.T. and E.T.-Y.C.; visualization, F.-Y.L.; writing—original draft, F.-Y.L., E.T. and E.T.-Y.C.; writing—review and editing, F.-Y.L., E.T. and E.T.-Y.C. All authors have read and agreed to the published version of the manuscript.

Funding

This study was supported by the Ministry of Science and Technology, Taiwan (Grant Nos. MOST 111-2611-M-002-012, MOST 111-2116-M-001-036, and ANR-MOST 111-2923-M-008-002-MY4).

Data Availability Statement

Data are available upon request. The modeling code is available at https://github.com/tan2/dynearthsol (accessed on 30 January 2023).

Acknowledgments

Figures were generated using the generic mapping tools (GMT) developed by Wessel and Smith (1991) and LLNL’s VisIt, developed by Childs et al. (2011).

Conflicts of Interest

The authors declare no conflict of interest.

References

  1. Byrne, T.; Chan, Y.-C.; Rau, R.-J.; Lu, C.-Y.; Lee, Y.-H.; Wang, Y.-J. The Arc–Continent Collision in Taiwan. In Arc-Continent Collision; Brown, D., Ryan, P.D., Eds.; Frontiers in Earth Sciences; Springer: Berlin, Heidelberg, 2011; pp. 213–245. ISBN 978-3-540-88558-0. [Google Scholar]
  2. Ho, C.S. Introduction to the Geology of Taiwan: Explanatory Text of the Geologic Map of Taiwan; Central Geologic Survey; MOEA: Taipei, Taiwan, 1986; ISBN 978-986-533-178-8. [Google Scholar]
  3. Tsai, M.-C.; Yu, S.-B.; Shin, T.-C.; Kuo, K.-W.; Leu, P.-L.; Chang, C.-H.; Ho, M.-Y. Velocity Field Derived from Taiwan Continuous GPS Array (2007–2013). Terr. Atmos. Ocean. Sci. 2015, 26, 527–556. [Google Scholar] [CrossRef] [Green Version]
  4. Ching, K.-E.; Rau, R.-J.; Lee, J.-C.; Hu, J.-C. Contemporary Deformation of Tectonic Escape in SW Taiwan from GPS Observations, 1995–2005. Earth Planet. Sci. Lett. 2007, 262, 601–619. [Google Scholar] [CrossRef]
  5. Hu, J.-C.; Hou, C.-S.; Shen, L.-C.; Chan, Y.-C.; Chen, R.-F.; Huang, C.; Rau, R.-J.; Chen, K.H.-H.; Lin, C.-W.; Huang, M.-H.; et al. Fault Activity and Lateral Extrusion Inferred from Velocity Field Revealed by GPS Measurements in the Pingtung Area of Southwestern Taiwan. J. Asian Earth Sci. 2007, 31, 287–302. [Google Scholar] [CrossRef]
  6. Angelier, J.; Chang, T.-Y.; Hu, J.-C.; Chang, C.-P.; Siame, L.; Lee, J.-C.; Deffontaines, B.; Chu, H.-T.; Lu, C.-Y. Does Extrusion Occur at Both Tips of the Taiwan Collision Belt? Insights from Active Deformation Studies in the Ilan Plain and Pingtung Plain Regions. Tectonophysics 2009, 466, 356–376. [Google Scholar] [CrossRef]
  7. Lacombe, O.; Mouthereau, F.; Angelier, J.; Deffontaines, B. Structural, Geodetic and Seismological Evidence for Tectonic Escape in SW Taiwan. Tectonophysics 2001, 333, 323–345. [Google Scholar] [CrossRef]
  8. Lu, C.-Y.; Malavieille, J. Oblique Convergence, Indentation and Rotation Tectonics in the Taiwan Mountain Belt: Insights from Experimental Modelling. Earth Planet. Sci. Lett. 1994, 121, 477–494. [Google Scholar] [CrossRef]
  9. Shyu, J.B.H.; Sieh, K.; Chen, Y.-G.; Liu, C.-S. Neotectonic Architecture of Taiwan and Its Implications for Future Large Earthquakes. J. Geophys. Res. Solid Earth 2005, 110. [Google Scholar] [CrossRef] [Green Version]
  10. Deffontaines, B.; Lacombe, O.; Angelier, J.; Chu, H.T.; Mouthereau, F.; Lee, C.T.; Deramond, J.; Lee, J.F.; Yu, M.S.; Liew, P.M. Quaternary Transfer Faulting in the Taiwan Foothills: Evidence from a Multisource Approach. Tectonophysics 1997, 274, 61–82. [Google Scholar] [CrossRef]
  11. Lacombe, O.; Mouthereau, F.; Deffontaines, B.; Angelier, J.; Chu, H.T.; Lee, C.T. Geometry and Quaternary Kinematics of Fold-and-Thrust Units of Southwestern Taiwan. Tectonics 1999, 18, 1198–1223. [Google Scholar] [CrossRef] [Green Version]
  12. Mouthereau, F.; Lacombe, O.; Deffontaines, B.; Angelier, J.; Brusset, S. Deformation History of the Southwestern Taiwan Foreland Thrust Belt: Insights from Tectono-Sedimentary Analyses and Balanced Cross-Sections. Tectonophysics 2001, 333, 293–322. [Google Scholar] [CrossRef]
  13. Huang, S.-T.; Yang, K.-M.; Hung, J.-H.; Wu, J.-C.; Ting, H.-H.; Mei, W.-W.; Hsu, S.-H.; Lee, M. Deformation Front Development at the Northeast Margin of the Tainan Basin, Tainan–Kaohsiung Area, Taiwan. Mar. Geophys. Res. 2004, 25, 139–156. [Google Scholar] [CrossRef]
  14. Wu, Y.-M.; Chang, C.-H.; Zhao, L.; Teng, T.-L.; Nakamura, M. A Comprehensive Relocation of Earthquakes in Taiwan from 1991 to 2005. Bull. Seismol. Soc. Am. 2008, 98, 1471–1481. [Google Scholar] [CrossRef] [Green Version]
  15. Cobbold, P.R.; Davy, P. Indentation Tectonics in Nature and Experiment. II: Central Asia. Indentation Tecton. Nat. Exp. II Cent. Asia 1988, 14, 143–162. [Google Scholar]
  16. Lu, C.-Y.; Angelier, J.; Chu, H.-T.; Lee, J.-C. Contractional, Transcurrent, Rotational and Extensional Tectonics: Examples from Northern Taiwan. Tectonophysics 1995, 246, 129–146. [Google Scholar] [CrossRef]
  17. Molnar, P.; Tapponnier, P. Cenozoic Tectonics of Asia: Effects of a Continental Collision. Science 1975, 189, 419–426. [Google Scholar] [CrossRef] [PubMed]
  18. Tapponnier, P.; Peltzer, G.; Le Dain, A.Y.; Armijo, R.; Cobbold, P. Propagating Extrusion Tectonics in Asia: New Insights from Simple Experiments with Plasticine. Geology 1982, 10, 611–616. [Google Scholar] [CrossRef]
  19. Dewey, J.F.; Şengör, A.M.C. Aegean and Surrounding Regions: Complex Multiplate and Continuum Tectonics in a Convergent Zone. GSA Bull. 1979, 90, 84–92. [Google Scholar] [CrossRef]
  20. McKenzie, D. Active Tectonics of the Mediterranean Region. Geophys. J. Int. 1972, 30, 109–185. [Google Scholar] [CrossRef] [Green Version]
  21. Capitanio, F.A. The Dynamics of Extrusion Tectonics: Insights from Numerical Modeling. Tectonics 2014, 33, 2361–2381. [Google Scholar] [CrossRef]
  22. Tapponnier, P.; Zhiqin, X.; Roger, F.; Meyer, B.; Arnaud, N.; Wittlinger, G.; Jingsui, Y. Oblique Stepwise Rise and Growth of the Tibet Plateau. Science 2001, 294, 1671–1677. [Google Scholar] [CrossRef]
  23. Nyst, M.; Thatcher, W. New Constraints on the Active Tectonic Deformation of the Aegean. J. Geophys. Res. Solid Earth 2004, 109. [Google Scholar] [CrossRef] [Green Version]
  24. Lazos, I.; Sboras, S.; Chousianitis, K.; Kondopoulou, D.; Pikridas, C.; Bitharis, S.; Pavlides, S. Temporal Evolution of Crustal Rotation in the Aegean Region Based on Primary Geodetically-Derived Results and Palaeomagnetism. Acta Geod. Geophys. 2022, 57, 317–334. [Google Scholar] [CrossRef]
  25. Sun, C.-H.; Chang, S.-C.; Kuo, C.-L.; Wu, J.-C.; Shao, P.-H.; Oung, J.-N. Origins of Taiwan’s Mud Volcanoes: Evidence from Geochemistry. J. Asian Earth Sci. 2010, 37, 105–116. [Google Scholar] [CrossRef]
  26. Mouthereau, F.; Deffontaines, B.; Lacombe, O.; Angelier, J. Variations along the Strike of the Taiwan Thrust Belt: Basement Control on Structural Style, Wedge Geometry, and Kinematics. Geol. Soc. Am. 2002, 358. [Google Scholar] [CrossRef]
  27. Suppe, J. Mechanics of Mountain Building and Metamorphism in Taiwan. Mem. Geol. Soc. China Taiwan 1981, 4, 67–89. [Google Scholar]
  28. Lin, A.T.; Watts, A.B.; Hesselbo, S.P. Cenozoic Stratigraphy and Subsidence History of the South China Sea Margin in the Taiwan Region. Basin Res. 2003, 15, 453–478. [Google Scholar] [CrossRef]
  29. Fuller, C.W.; Willett, S.D.; Fisher, D.; Lu, C.Y. A Thermomechanical Wedge Model of Taiwan Constrained by Fission-Track Thermochronometry. Tectonophysics 2006, 425, 1–24. [Google Scholar] [CrossRef]
  30. Yamato, P.; Mouthereau, F.; Burov, E. Taiwan Mountain Building: Insights from 2-D Thermomechanical Modelling of a Rheologically Stratified Lithosphere. Geophys. J. Int. 2009, 176, 307–326. [Google Scholar] [CrossRef] [Green Version]
  31. Huchon, P.; Barrier, E.; de Bremaecker, J.-C.; Angelier, J. Collision and Stress Trajectories in Taiwan: A Finite Element Model. Tectonophysics 1986, 125, 179–191. [Google Scholar] [CrossRef]
  32. Hu, J.-C.; Angelier, J.; Lee, J.-C.; Chu, H.-T.; Byrne, D. Kinematics of Convergence, Deformation and Stress Distribution in the Taiwan Collision Area: 2-D Finite-Element Numerical Modelling. Tectonophysics 1996, 255, 243–268. [Google Scholar] [CrossRef]
  33. Hu, J.-C.; Yu, S.-B.; Angelier, J.; Chu, H.-T. Active Deformation of Taiwan from GPS Measurements and Numerical Simulations. J. Geophys. Res. Solid Earth 2001, 106, 2265–2280. [Google Scholar] [CrossRef]
  34. Lin, S.-C.; Kuo, B.-Y. Dynamics of the Opposite-Verging Subduction Zones in the Taiwan Region: Insights from Numerical Models. J. Geophys. Res. Solid Earth 2016, 121, 2174–2192. [Google Scholar] [CrossRef] [Green Version]
  35. Wang, X.; Kaus, B.J.P.; Yang, J.; Wang, K.; Li, Y.; Chen, L.; Zhao, L. 3D Geodynamic Models for HP-UHP Rock Exhumation in Opposite-Dip Double Subduction-Collision Systems. J. Geophys. Res. Solid Earth 2021, 126, e2021JB022326. [Google Scholar] [CrossRef]
  36. Choi, E.; Tan, E.; Lavier, L.L.; Calo, V.M. DynEarthSol2D: An Efficient Unstructured Finite Element Method to Study Long-term Tectonic Deformation. J. Geophys. Res. Solid Earth 2013, 118, 2429–2444. [Google Scholar] [CrossRef] [Green Version]
  37. Ta, T.; Choo, K.; Tan, E.; Jang, B.; Choi, E. Accelerating DynEarthSol3D on Tightly Coupled CPU–GPU Heterogeneous Processors. Comput. Geosci. 2015, 79, 27–37. [Google Scholar] [CrossRef]
  38. Cundall, P.A. Numerical Experiments on Localization in Frictional Materials. Ing. Arch. 1989, 59, 148–159. [Google Scholar] [CrossRef]
  39. Culling, W.E.H. Analytical Theory of Erosion. J. Geol. 1960, 68, 336–344. [Google Scholar] [CrossRef]
  40. Yang, K.-M.; Rau, R.-J.; Chang, H.-Y.; Hsieh, C.-Y.; Ting, H.-H.; Huang, S.-T.; Wu, J.-C.; Tang, Y.-J. The Role of Basement-Involved Normal Faults in the Recent Tectonics of Western Taiwan. Geol. Mag. 2016, 153, 1166–1191. [Google Scholar] [CrossRef] [Green Version]
  41. Le Béon, M.; Huang, M.-H.; Suppe, J.; Huang, S.-T.; Pathier, E.; Huang, W.-J.; Chen, C.-L.; Fruneau, B.; Baize, S.; Ching, K.-E.; et al. Shallow Geological Structures Triggered during the Mw 6.4 Meinong Earthquake, Southwestern Taiwan. Terr. Atmos. Ocean. Sci. 2017, 28, 663–681. [Google Scholar] [CrossRef] [Green Version]
  42. Doo, W.-B.; Lo, C.-L.; Hsu, S.-K.; Tsai, C.-H.; Huang, Y.-S.; Wang, H.-F.; Chiu, S.-D.; Ma, Y.-F.; Liang, C.-W. New Gravity Anomaly Map of Taiwan and Its Surrounding Regions with Some Tectonic Interpretations. J. Asian Earth Sci. 2018, 154, 93–100. [Google Scholar] [CrossRef]
  43. Doo, W.-B.; Hsu, S.-K.; Lo, C.-L.; Chen, S.-C.; Tsai, C.-H.; Lin, J.-Y.; Huang, Y.-P.; Huang, Y.-S.; Chiu, S.-D.; Ma, Y.-F. Gravity Anomalies of the Active Mud Diapirs off Southwest Taiwan. Geophys. J. Int. 2015, 203, 2089–2098. [Google Scholar] [CrossRef]
  44. Hwang, C.; Hsu, H.-J.; Chang, E.T.Y.; Featherstone, W.E.; Tenzer, R.; Lien, T.; Hsiao, Y.-S.; Shih, H.-C.; Jai, P.-H. New Free-Air and Bouguer Gravity Fields of Taiwan from Multiple Platforms and Sensors. Tectonophysics 2014, 611, 83–93. [Google Scholar] [CrossRef] [Green Version]
  45. Suppe, J. Imbricated Structure of Western Foothills Belt, Southcentral Taiwan. Pet. Geol. Taiwan 1980, 17, 1–16. [Google Scholar]
  46. Dahlen, F.A. Noncohesive Critical Coulomb Wedges: An Exact Solution. J. Geophys. Res. Solid Earth 1984, 89, 10125–10133. [Google Scholar] [CrossRef]
  47. Dahlen, F.A.; Barr, T.D. Brittle Frictional Mountain Building: 1. Deformation and Mechanical Energy Budget. J. Geophys. Res. Solid Earth 1989, 94, 3906–3922. [Google Scholar] [CrossRef]
  48. Davis, D.; Suppe, J.; Dahlen, F.A. Mechanics of Fold-and-Thrust Belts and Accretionary Wedges. J. Geophys. Res. Solid Earth 1983, 88, 1153–1172. [Google Scholar] [CrossRef]
  49. Costa, E.; Vendeville, B.C. Experimental Insights on the Geometry and Kinematics of Fold-and-Thrust Belts above Weak, Viscous Evaporitic Décollement. J. Struct. Geol. 2002, 24, 1729–1739. [Google Scholar] [CrossRef]
  50. Malavieille, J. Impact of Erosion, Sedimentation, and Structural Heritage on the Structure and Kinematics of Orogenic Wedges: Analog Models and Case Studies. GSA Today 2010, 20, 4–10. [Google Scholar] [CrossRef]
  51. Ruh, J.B.; Kaus, B.J.P.; Burg, J.-P. Numerical Investigation of Deformation Mechanics in Fold-and-Thrust Belts: Influence of Rheology of Single and Multiple Décollements: Deformation of fold-and-thrust belts. Tectonics 2012, 31. [Google Scholar] [CrossRef]
  52. Stockmal, G.S.; Beaumont, C.; Nguyen, M.; Lee, B. Mechanics of Thin-Skinned Fold-and-Thrust Belts: Insights from Numerical Models. In Special Paper 433: Whence the Mountains? Inquiries into the Evolution of Orogenic Systems: A Volume in Honor of Raymond A. Price; Geological Society of America: Boulder, CO, USA, 2007; Volume 433, pp. 63–98. ISBN 978-0-8137-2433-1. [Google Scholar]
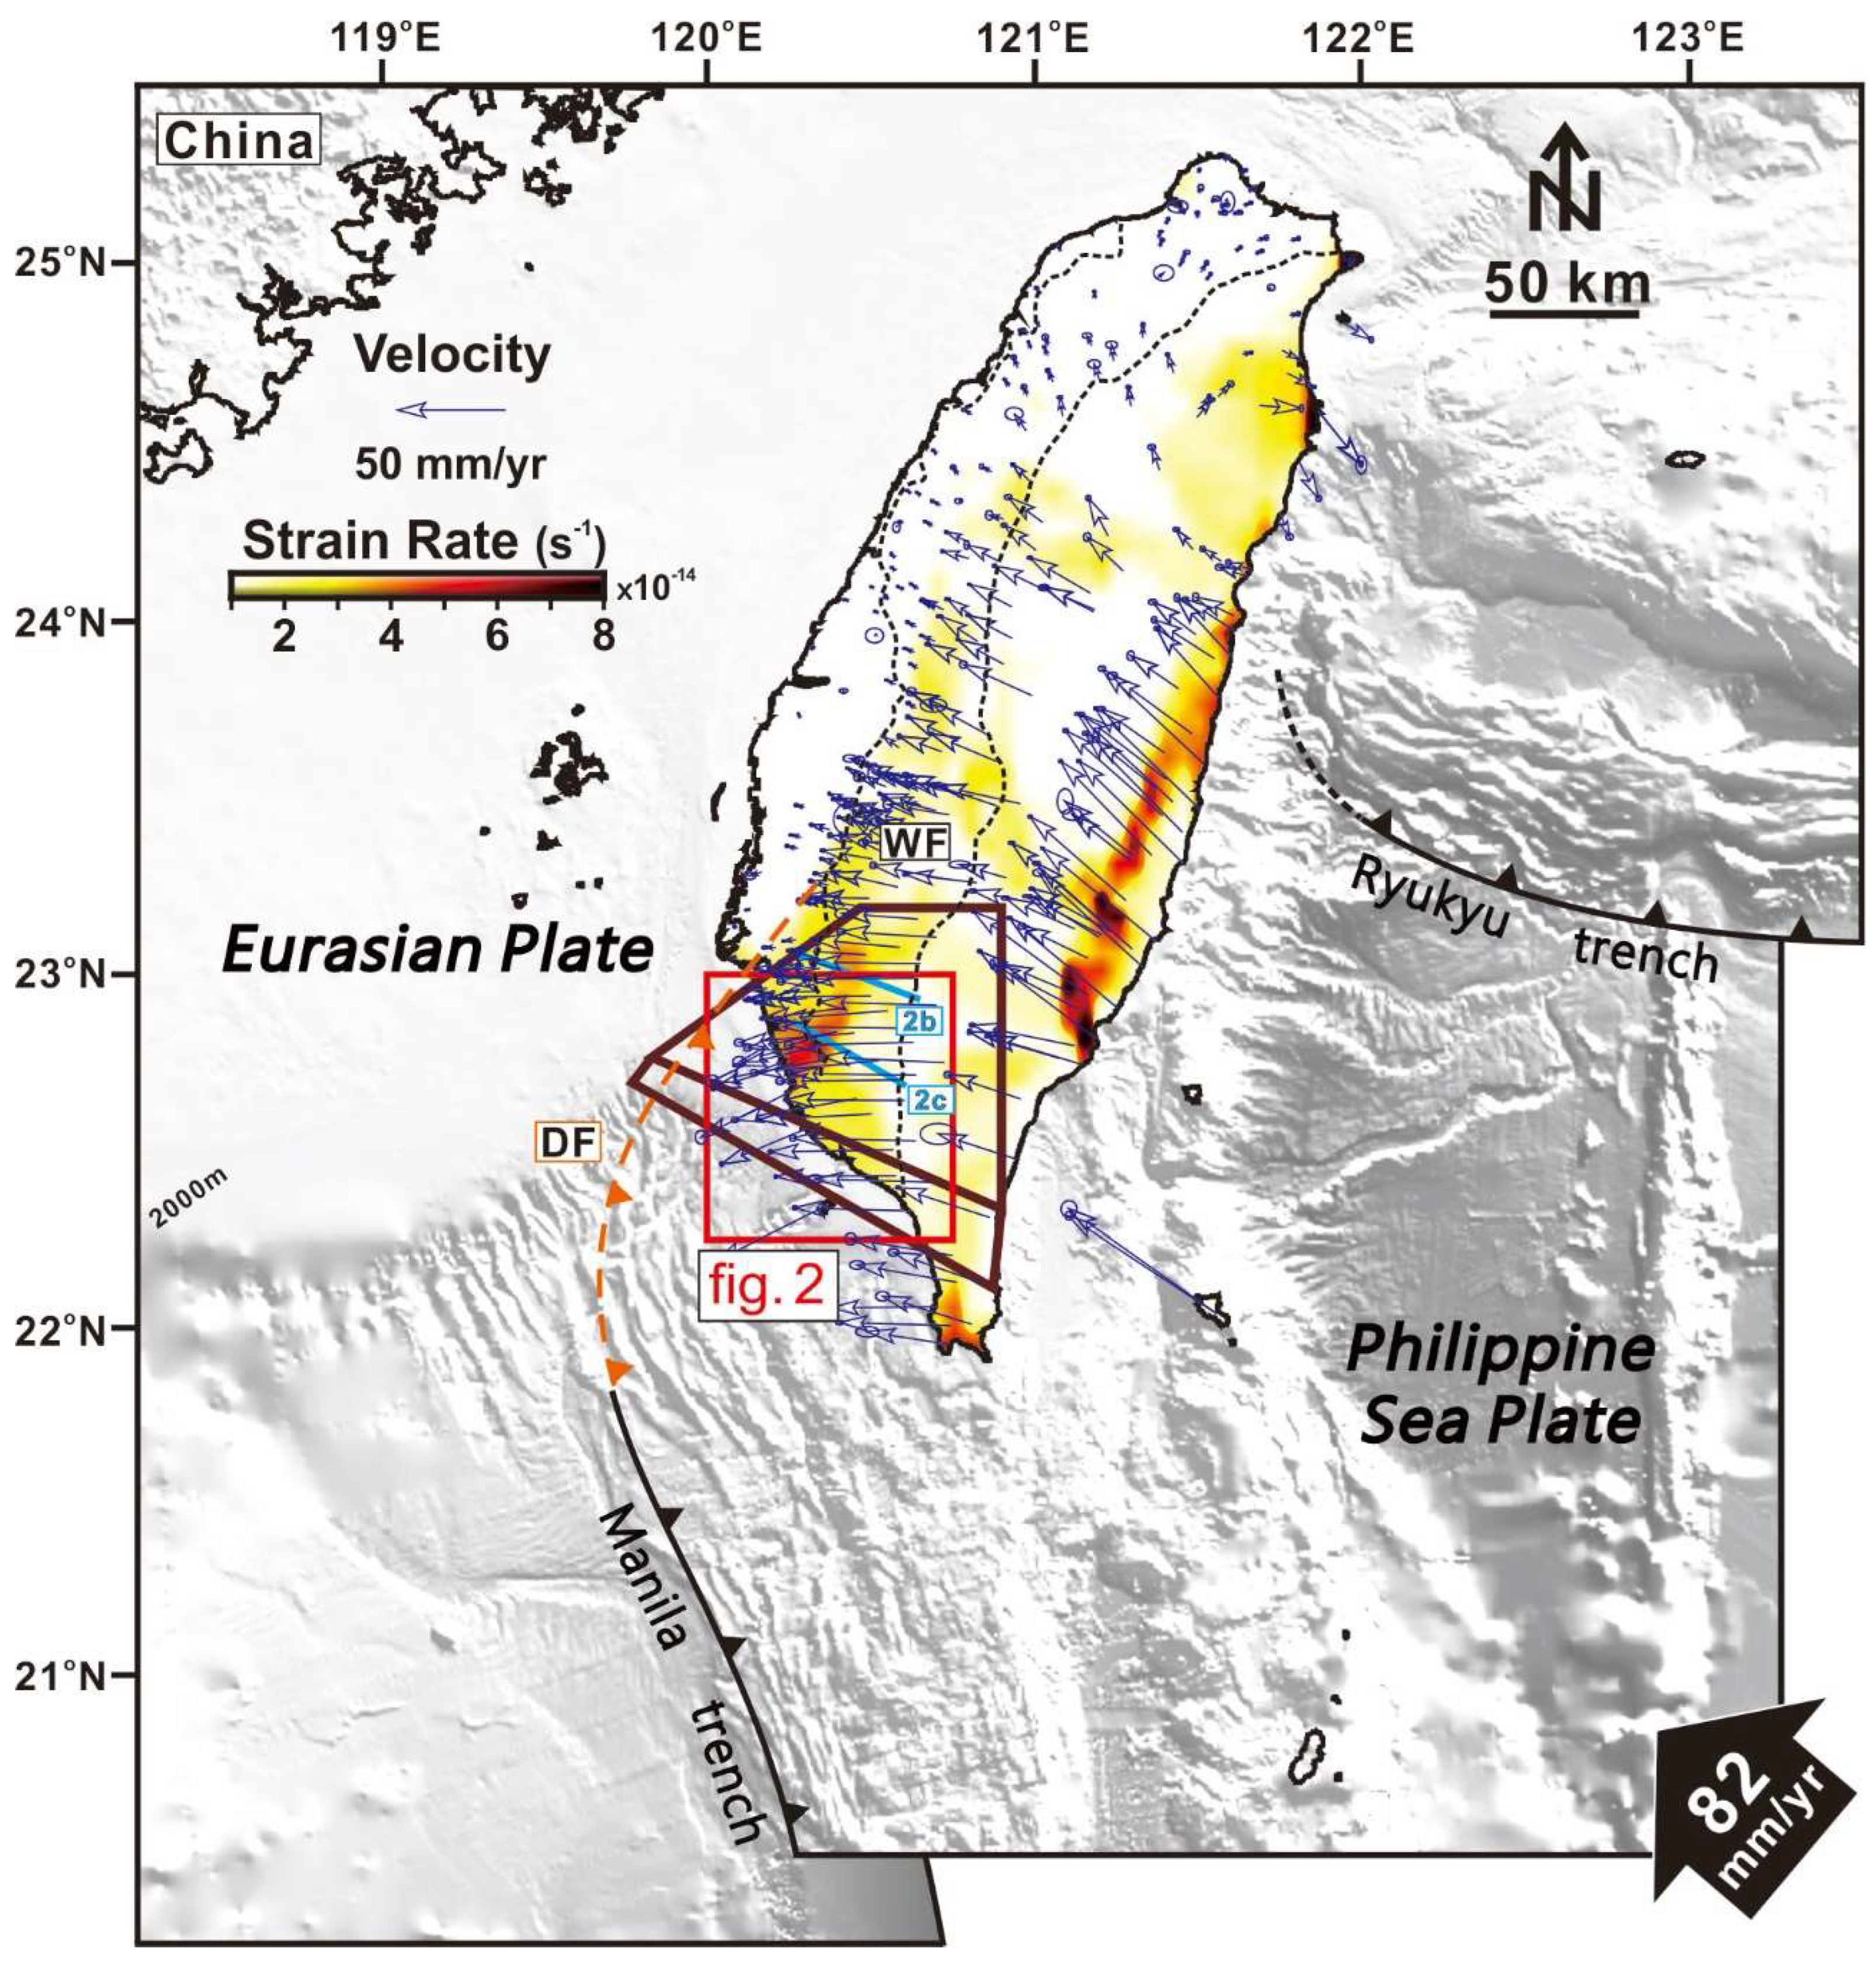
Figure 1. Major geological features of Taiwan. The blue arrows are the GPS velocity vectors [3]. The strain rate field is derived from the GPS data. The red rectangle is the spatial frame of Figure 2a. The bold blue lines indicate the location of the balanced cross-sections in Figure 2b,c. The brown box shows the location of the models in this study. DF: deformation front; WF: western foothills.
Geosciences 13 00041 g001
Figure 2. (a) The studied area. The main active faults are indicated with lines and numbers on the map. Gray dots represent the campaign GPS stations. The general strikes of the Kaohsiung and Pingtung coastlines are indicated, and these will be followed by the open boundary in our numerical models. (b) The balanced cross-section was modified from that of Huang et al. (2004) [13]. (c) The balanced cross-section was modified from that of Mouthereau et al. (2001) [12]. ①: Chaochou fault; ②: Chishan fault; ③: Lungchuan fault; ④: Hsiaokangshan fault; ⑤: Chungchou fault; ⑥: Houchiali fault; ⑦: Fengshan fault.
Geosciences 13 00041 g002
Figure 3. Model settings. (a) The model is composed of two material layers and three lateral surfaces. (b) The depth of the surface intersections in the initial mesh. (c) A 3D perspective drawing of the two geometries in this study and the velocity boundary condition. (d) The velocity boundary condition at the eastern boundary.
Geosciences 13 00041 g003
Figure 4. (a) The strain rate field and surface velocity field of the model at 40 kyr. A A ¯ is the profile perpendicular to the forethrust along the ramp. (b) The strain rate field of profile A A ¯ . (c) The plastic strain field of the model at time = 40 kyr. The red dashed lines mark the forethrust. The purple dashed lines mark the backthrust. The blue dashed line marks the slumping area.
Geosciences 13 00041 g004
Figure 5. (a) The strain rate field at 2 kyr. (b) The strain rate field at 10 kyr. The strain rate field shows a similar pattern from 10 kyr to 40 kyr (Figure 4). The strain rate field reaches a quasi-stable state. (c) The vertical velocity field at 2 kyr. The area around the open boundary experienced strong subsidence. (d) The vertical velocity field at 10 kyr.
Geosciences 13 00041 g005
Figure 6. Model velocity and GPS velocity. Stations east of the Chaochou fault in the southern backbone range are not used here. The gray circles are the positions of the GPS stations. The yellow arrows are the horizontal velocity vectors reported by Ching et al. [4]. The red arrows are the horizontal velocity vectors reported by Tsai et al. [3]. The blue velocity arrows are the velocity vectors linearly interpolated from the model velocity field.
Geosciences 13 00041 g006
Figure 7. The velocity decomposition of the model and GPS velocity fields [3,4]. The location of the sampling areas and the direction of decomposition are shown in the uppermost part. The distance in the sampling area is marked with ticks every 20 km. The dashed lines are the same structures indicated in Figure 3. (ad) present the velocity decomposition of profiles A, B, C, and D, respectively. The colored bands mark the location of the forethrust (red) and backthrust (purple).
Geosciences 13 00041 g007
Figure 8. The standard deviation for the model velocity along the profiles.
Geosciences 13 00041 g008
Figure 9. Comparison of strain rate fields and plastic strain fields between models. Dashed lines indicate structures. The red dashed lines mark the forethrusts; the purple dashed lines mark the backthrusts; the blue dashed lines mark the slumping areas in the early stage. (a) Model in which Φb = 2.5° and α = 113.73°. (b) Model in which Φb = 5° and α = 113.73°. (c) Model in which Φb = 2.5° and α = 140.09°.
Geosciences 13 00041 g009
Table 1. Mechanical properties of strength.
ParameterUpper ZoneBasal Weak Zone
Density (ρ)2800 kg/m3
Shear Modulus (G)30 GPa
Lame’s First Parameter (λ)30 GPa
Surface Diffusivity (Κero)31.5 m2/year
Critical Plastic Strain0.1
Initial Cohesion4 MPa0.4 MPa
Weakened Cohesion2 MPa0.4 MPa
Friction Angle30°2.5°/5°
Disclaimer/Publisher’s Note: The statements, opinions and data contained in all publications are solely those of the individual author(s) and contributor(s) and not of MDPI and/or the editor(s). MDPI and/or the editor(s) disclaim responsibility for any injury to people or property resulting from any ideas, methods, instructions or products referred to in the content.