Article

Impact of Dead Sea Halo-Karst Development on an Earthen Dike Rehabilitation Project

1
Independent Researcher, 1930 Zaventem, Belgium
2
AiDash, Gurugram 122022, Haryana, India
3
L3Harris, Denver, CO 80202, USA
*
Author to whom correspondence should be addressed.
Geosciences 2023, 13(2), 42; https://doi.org/10.3390/geosciences13020042
Submission received: 26 October 2022 / Revised: 20 January 2023 / Accepted: 24 January 2023 / Published: 30 January 2023

Abstract

:
From the 1970s, the Dead Sea experienced severe halo-karstification and anthropogenic modifications. Progressively, but at an accelerating rate, subsidence, landslides, and sinkholes have increased in number and magnitude. The hazards’ triggering factors are the terminal lake level lowering at more than one meter per year and the dynamic equilibrium of the hydrogeological system. Over the Lisan peninsula, archived satellite images revealed the extent of the damaged areas. On 22 March 2000, the destruction of dike 19 represented a loss of 38 M USD. This is the most important event recorded since the beginning of the Dead Sea recession some 50 years ago. In 2018, a rehabilitation project of that dike started. This research analyses the viability of the reinstatement works. The advanced space borne radar interferometry technique is applied to map ground deformations before and during the project. This article reveals that the ongoing rehabilitation and reinstatement works of dike 19 are threatened by ongoing halo-karstification processes. Field observations and subsidence/uplift dynamics support this statement. The past experiences are taken into consideration to adapt industrial expansion strategies. However, the permeability of the salt pan floor could trigger a fast development of a karst system able to destroy the rehabilitated dike 19.

1. Introduction

1.1. Problem Statement

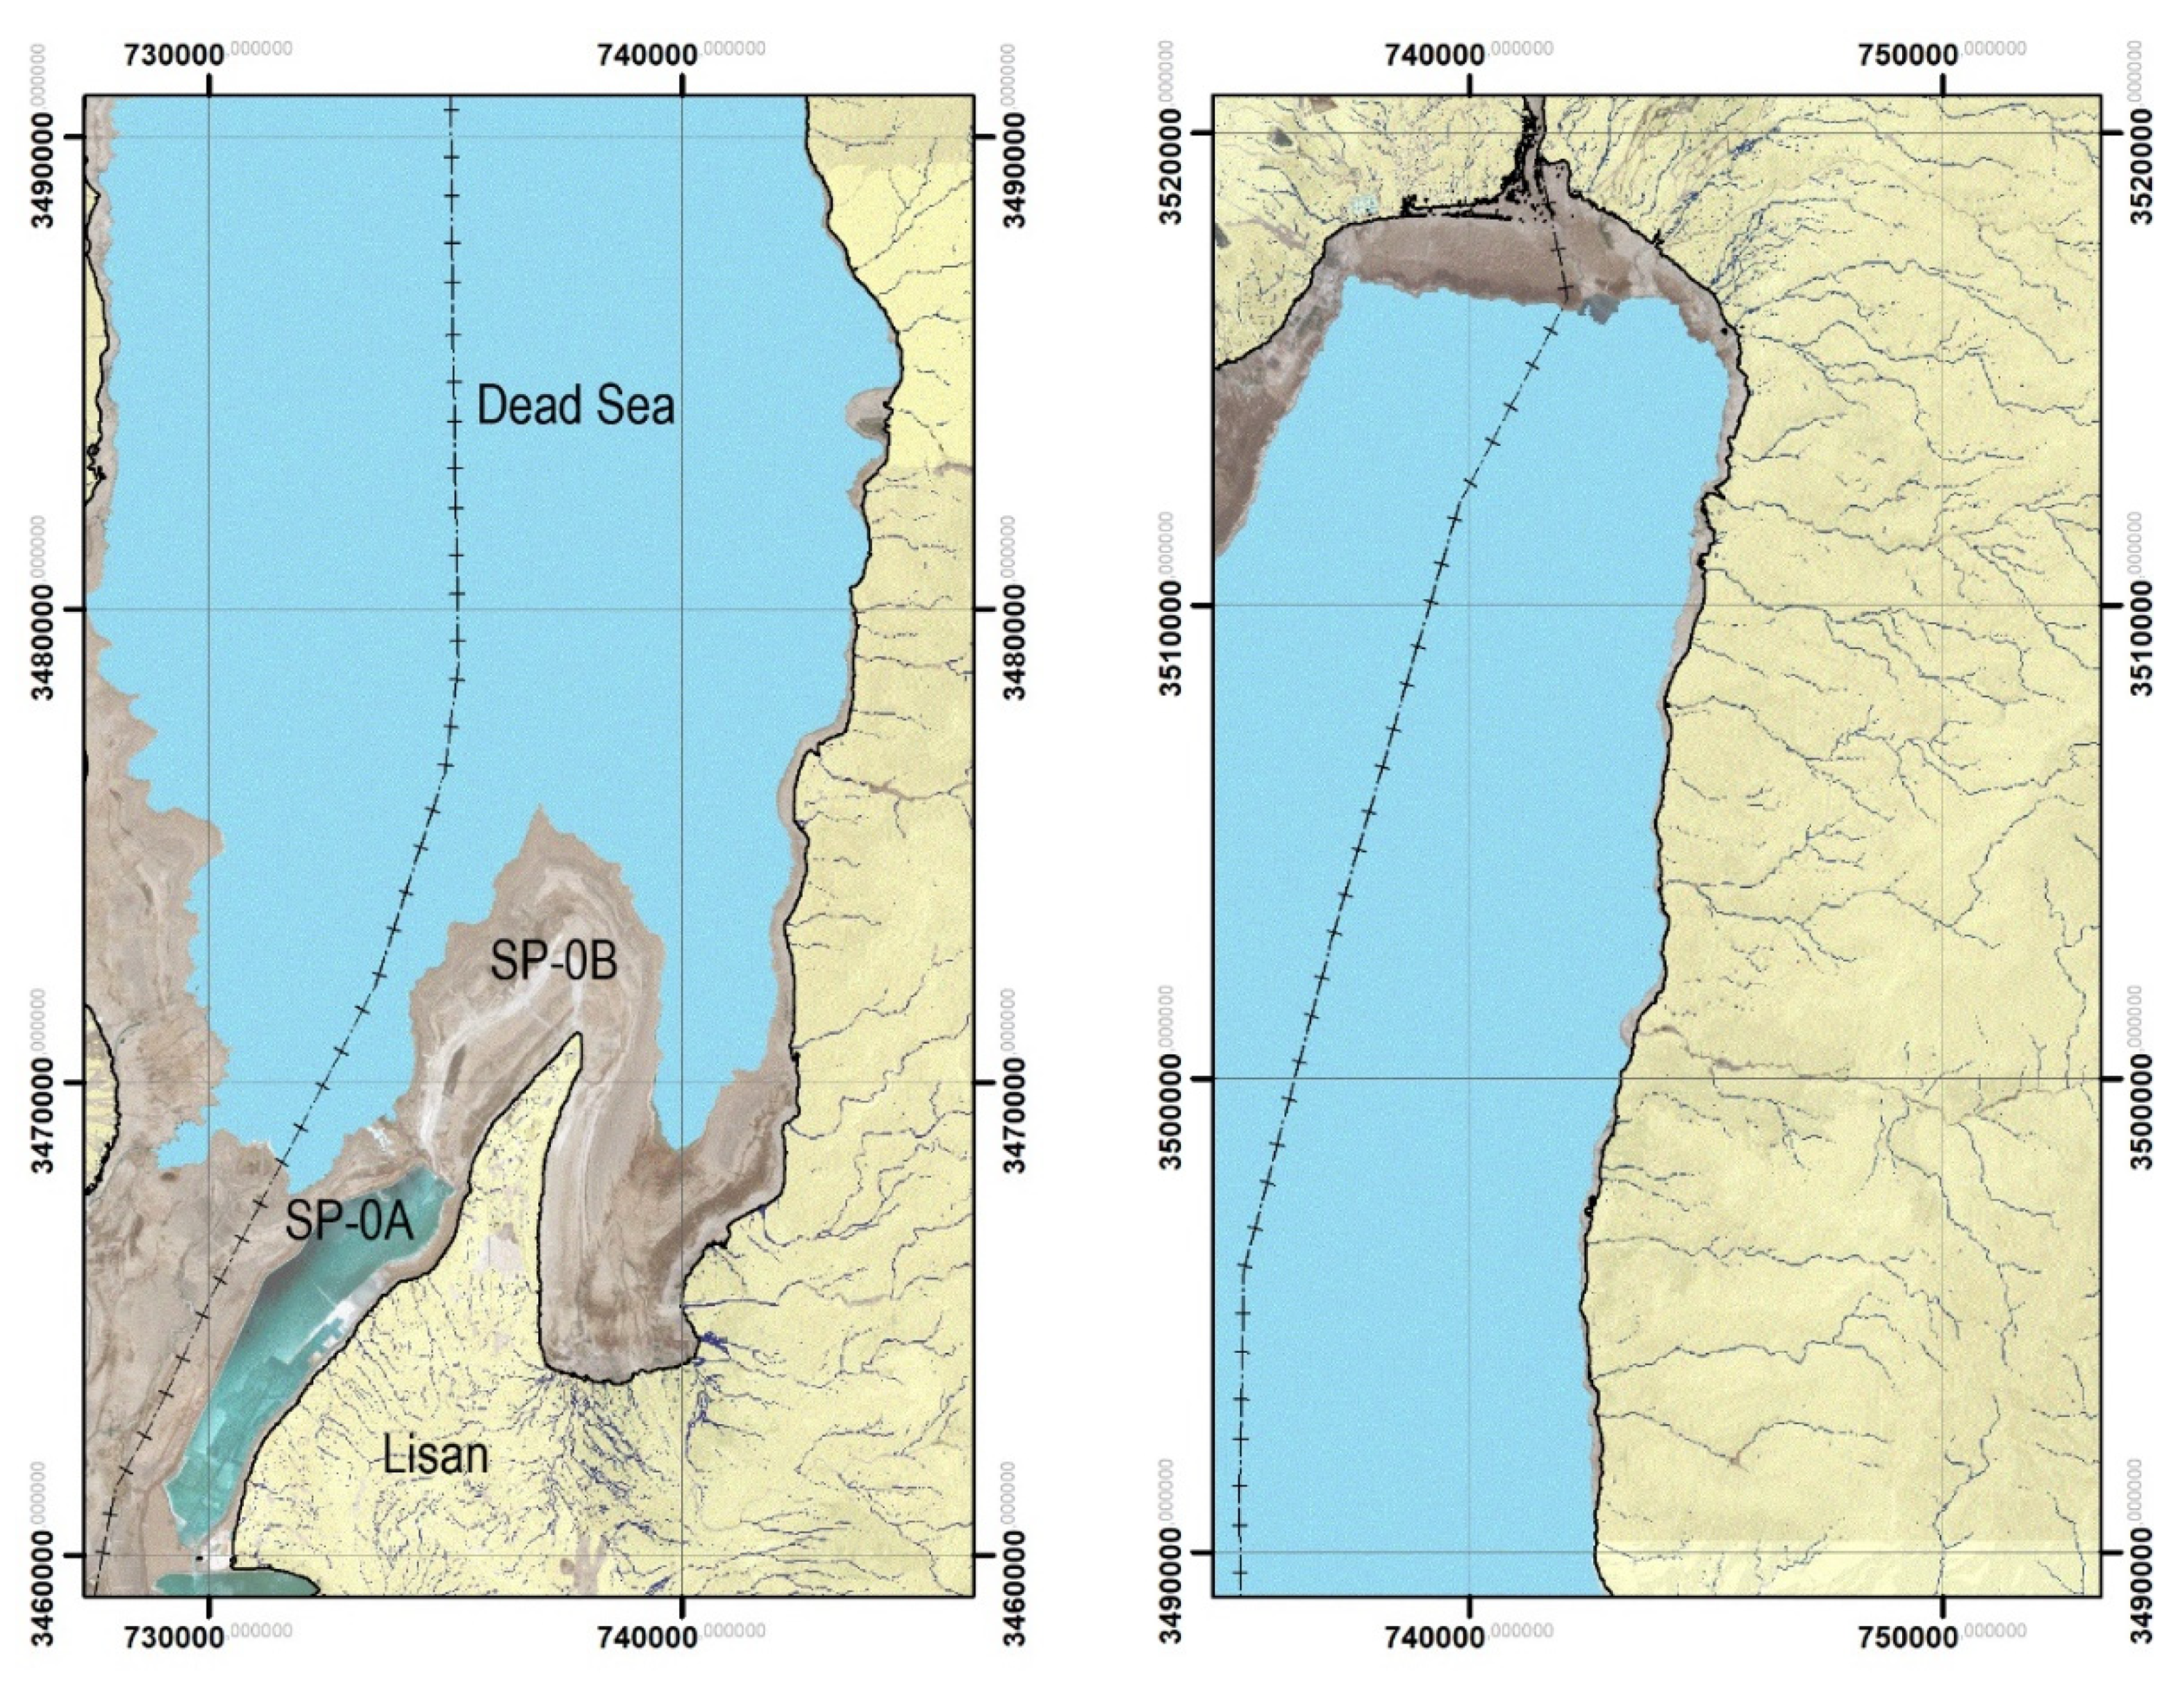
On 22 March 2000, the northern part of the Lisan peninsula, Dead Sea, Jordan, was the scene of a 38 M USD dike collapse [1]. Figure 1 compares two Landsat-5 images acquired respectively on 10 and 26 March 2000. Salt pan “SP-0B” covered 11.5 km2 with a full capacity of 76 M m3. In the mid-1990s, the Arab Potash Company (APC) commissioned dikes 19 and 20 encompassing SP-0B.
Designed in 1997, the two dikes were built between 16 March 1998, and 8 December 1999, in continuity with each other: dike 19 from chainage CH 0 + 000 to CH 8 + 300, and dike 20 from CH 8 + 300 to CH 11 + 597. The term “chainage” is used in surveying to refer to a distance measured in meters along an imaginary line, such as the centerline of a road topping a dike. A datum is set as 0 + 000 at one point along the dike, and cumulative longitudinal distances measured using a device such as an odometer and then quoted along the length of the dike from that datum.
Impounding started on 4 January 2000. On 22 March 2000, when the pumped brine reached almost 56 M m3, a sudden and catastrophic failure occurred. In 30 min, the breach extended over 2.6 km.
Subsequent expert visits established that the collapse could result either from the development of a halo-karst network [2,3] consequent to the sharp drop in the Dead Sea water level, or from the specific nature of the foundations [4], or from a combination of both. For instance, [2] (see author’s picture on page 17) identified solution cavities developed in very soft and deformable salty marls nearby chainage 6 + 900 m of the remaining dike 19.
After 13 years of lawsuits against the designers and contractors of SP-0B, APC managers officially admitted the reality of the karst system over which the dikes they had commissioned had been built. In its Annual Report 2013, APC declared [5] (page 41): “In recent years and due to the decrease in the water level at the Dead Sea, sinkholes were discovered in the site area (i.e., the industrial plant of APC) which may cause harm to the dikes. The sinkholes are most active around the perimeter of dikes no. 1 and 18 (see Figure 1, no. 8 and 9 in the publication of [3]) and this factor, along with subsidence, place our dikes at risk. APC conducts a visual inspection of these dikes daily and employs state of the art technology to monitor dike conditions twice per year. In addition, APC is in the process of a major rehabilitation for these dikes”.
This belated recognition deserves two clarifications. “In the recent year” refers to sinkholes’ incidents dating back to summer 1992 [4]. At that time, the sudden appearance of dozens of ground collapses had forced engineers to redesign the earth fill embankment “dike 18” (13 km long, 14 m high, 7 million m3) encompassing the future salt pan “SP-0A” located South-West of the Lisan peninsula (Figure 2).
Secondly, the term “rehabilitation” practically means the increase of the factor of safety (FOS) by enlarging dikes as much as necessary to comply with a specific FOS value [4]. The standard methodologies for the assessment of dike safety for macro stability are based on limit equilibrium methods, which result in a FOS against shear failure.
In summary, the strategy is: the wider the dike, the greater the reaction time available to fill in the ground collapses and/or empty the brine out the evaporation pond until reaching an acceptable FOS. Expressed in this way, the width of the embankment is an indicator of the karst system dynamics against which the APC engineers must contend. The APC strategy is questionable because at the end the risk of dike collapse is directly linked to the lowering of the Dead Sea and to the dynamic equilibrium of the hydrogeological system. The lowering is accelerating, and APC is aware because the Dead Sea level is monitored with a gauge station. The reason for this is that the lake level is one of the main parameters to determine the lifetime and the position along the shore of the pumping stations from where the raw material (the Dead Sea) is entering the salt pans’ system.
From March 2018 to December 2021, rehabilitation and reinstatement works of SP-0B have been carried out. The 28 M USD project consisted in the setting up of a new 7.5 km dike 19 with a width of 300 m, and a height of 14 m. In the tender documents [6] (27 September 2016), the environmental setting is described as such: “The site of dikes 19 and 20 is characterized by special subsurface conditions including the presence of thick, soft clay deposits that undergo substantial settlement when loaded, presence of multiple ground water aquifers, artesian pressure, and appearance of sinkholes related to continuous lowering in the Dead Sea level”. Further, the penultimate figure shows the extent of the rehabilitation work. The volume of general excavation and removal of materials was 0.5 M m3. The total volume of fill materials was 2.3 M m3. The volume of drilling and grouting for sinkholes treatment was respectively 20,000 m drilling and 20,000 m3 of grout mix (equivalent to 8 Olympic swimming pools with a depth of 2 m).
Regarding the work status, in a document dated to 21 March 2022 [7], APC declared: “On 8 December 2021, Arab Potash Company decided to terminate the contract signed with the Contractor (Hidroconstructia S.A) responsible for executing the Dike 19 project due to the Contractor’s default and violation of the contract. Arab Potash Company liquidated the bank guarantees presented by the Contractor to Arab Potash Company and Arab Potash Company is in the process of claiming its legal and contractual rights against the Contractor. Arab Potash Company is in process of hiring a new contractor to complete the execution of the project”.
In January 2023, the new dike 19 is almost achieved and the impounding operation has not yet started. This context offers ideal conditions to map ground deformations with space borne radar advanced differential interferometry techniques. The hypothesis is that movements are induced either by the load of 2.3 M m3 of landfills and/or by the continuous development of the karst in the underground of the emerging lands. The purpose of our research is to update our knowledge of the ground deformations [8,9] generated by the development of the salt karst system in the northern Lisan peninsula. Hence, 41 Sentinel-1 images covering the period 2015–2022 were analyzed with respect to the sustainability of the rehabilitation works.

1.2. Environmental Setting

The Lisan peninsula is located on the eastern coast, near the south end of the Dead Sea, on the western border of Jordan adjacent to Israel, within the Karak Governorate and 80 km southwest of Jordan’s capital Amman. It is both an industrial and military restricted area.
The Lisan peninsula has a hot desert climate with dry summers and mild wetter winters with a daily mean temperature of 26.1 °C. The lowest temperatures typically occur in January with an average low of 12.7 °C. The highest temperatures occur in August with an average high around 39.7 °C. The wet season is typically December through March and accounts for approximately 78% of the area’s average annual precipitation (~42 mm).
On 1 January 2023, the Dead Sea sat at an elevation of 437.62 m below Mean Sea Level (bMSL) [10], making it the lowest land elevation on Earth. Its water level drops 1.1 m [8] per year on average due to water being diverted or extracted from the Jordan River, which feeds the terminal lake at its northern end.
In the early 1980s, the terminal lake level dropped below an underwater ridge (Lynch strait) that divides the shallower South Basin with the deeper Northern Basin. Water remains in the South Basin, even though it is located ~40 m above the current Dead Sea surface elevation due to the industrial pumping of Dead Sea water into solar evaporation ponds for potash production.
The Lisan peninsula is located between the north and south basins and its surface elevation is approximately 320–400 m bMSL. Few species can survive the harsh desert conditions and are sparsely found in the region. Examples of local flora include the thorny keel, desert mugwort, and zygophyllum bush. They are developing in the sinkholes and along fractures.

1.3. Geo-Structural Setting

The Dead Sea Basin lies within the Dead Sea Transform fault zone which originated in the Late Oligocene/Early Miocene Epochs. It formed between sinistral, left-stepping en-echelon faults. Connection to the Mediterranean Sea allowed for evaporite deposition. The modern Dead Sea formed as Lake Lisan shrank due to evaporation leaving broad beach terraces [11]. The Lisan peninsula is believed to have formed in the Quaternary Period as the result of basin trans-tension and subsidence. It is a salt diapir within the Dead Sea Basin bounded by faulting on the east and west sides. The Lisan salt diapir is estimated to be 5 to 7 km thick [12].
Two SSE–NNW subparallel sinistral en-echelon faults are present to the east, which define the Dead Sea Basin margin. They are the Ghor-Safi and Wadi-Araba fault zones. To the west, the Lisan Peninsula is bound by the Sedom and Western Border faults. The Sedom fault defines the NNW–SSE flexing that created the Lisan peninsula and to the south, the Sedom diapirs. Regarding the stratigraphy, within the Dead Sea Basin, continued syn-sedimentary extensional rifting results in facies changes from conglomerate to marl, sand, and salt from fluvial to lacustrine to deeper water. The general stratigraphy, from the oldest to the youngest, is:
  • The Sedom Formation. It consists of rock salt with lamina of silt and gypsum [13]. In the Dead Sea Basin, it may be shallow in depth within the Lisan peninsula and crops out in Mount Sedom on the western side of the Dead Sea, in a smaller salt dome. The Sedom lagoon developed into the Lisan Lake after being cut off from the Mediterranean Sea.
  • The late Pleistocene Lisan Marl (~120 m). They are thinly laminated marl with gypsum, cross-bedded calcarenite sand, and oolites deposited in the saline lake [14]. Facies change to gravel in the regression deposits at the lake edges.
  • The Holocene surficial deposits. They are made of evaporates, crystalline halite, laminated marl, inter-fingered with clay, silt, sand, and gravel that had been deposited in deep to shallow water.
The Lisan peninsula has relief of no more than 50 m and large parts have karst-generated sinkholes developing due to the Dead Sea drawdown. According to [15], the Lisan is in an area with seismic intensity of VIII on the Modified Mercalli Intensity Scale describes the shaking as severe, with the potential for considerable damage or partial collapse to ordinary surface structures.

1.4. Dead Sea Halo Karst System Resulting from the Lake Level Drop

According to data recorded by [10], the Dead Sea level has decreased by more than 40 m in the last 50 years. From the mid-1980s onwards, coastal areas have been increasingly damaged by decametre-size sinkholes, hectometre-size landslides, and kilometre-size wide shallow subsidence due to mechanical settling of the ground, e.g., [16,17,18].
Given the bathymetry, the emerging surfaces are more extended in the southern Dead Sea. Figure 2 shows the situation in August 2022, Jordan. The areas between contour lines 390 m bMSL (yellow areas crossed by streams) and 437 m bMSL (blue) consist of salty muds, soft clay, marls, fluvial and slope deposits. This 47-m layer was submerged in brine for centuries and the sediments are soaked with salt remains. Since their appearance, they have been exposed to subrosion (removal of substances by a solvent from a solid) by all the surrounding fresh/brackish waters [16,17]. They constitute a young and dynamic halo-karst system.
Of all the damages recorded over the past 30 years related to the Dead Sea ground collapses, those involving APC’s SP-0A and SP-0B evaporation ponds are by far the costliest. Research teams, e.g., [18,19], have inventoried several thousand sinkholes along the Dead Sea shores. They mapped them accurately and followed up their evolution. APC security engineers also did a similar inventory. For several years, they have been exploiting optical, radar, and lidar remotely sensed data. Despite this background, the present-day rehabilitation of dike 19 is a questionable project, even if the new dike’s width is as large as 300 m.
Sinkholes are natural depressions in the surface caused by the removal of the sub-soil by water. Two different types of sinkholes are found at the Dead Sea: erosion driven sinkholes and solution driven sinkholes. Their morphologic differences and impacts are explained in [16,20,21].
Solution driven sinkholes may develop in areas where a change in groundwater conditions creates a situation where fresh (unsaturated with respect to salt) groundwater contacts soluble deposits (salt) in the subsoil. Since the mid-1980s, numerous sinkholes have been forming along the Dead Sea shoreline resulting from the dissolution of halite at shallow depth by freshwater runoff infiltrating the slopes which were formerly saturated with brine before the Dead Sea began dropping noticeably (From the 1930s onwards) [18].
Erosion driven sinkholes develop at locations where very high local groundwater gradients enable internal erosion or piping in granular materials, especially if materials with large differences in grain size are next to each other. Dike 19 was designed to prevent a local gradient that would cause such erosion. However, the continuous lowering of the Dead Sea base-level, at a pace of more than 1 m per year, made the original design parameters and the FOS obsolete.

2. Materials and Methods

2.1. Advanced Differential Radar Interferometry Technique

The Small Baseline Subset (SBAS) [22] DInSAR technique has been applied to map the ground movements over the northern part of the Lisan peninsula from three independent time series: ERS −1/2 (1992–2000), Envisat (2003–2006), and Sentinel-1 (2015–2022). As onboard antennas are (were) operating in C band, this allowed a direct comparison between the deformation fields recorded over three consecutive periods.
This approach based on three datasets has been set up because, on the one hand, the pace of the Dead Sea water level lowering is accelerating, and on the other hand, the cumulated number of sinkholes recorded at the Dead Sea (and especially along the western coast) has been increasing drastically. Therefore, it was expected to detect a similar trend in the subsidence velocity around the Lisan peninsula.
The SBAS technique relies on a combination of image pairs that have short spatial and temporal baselines to produce a stack of interferograms from which it is possible to compute the deformations at centimeter scale.
The COST Sarscape™ was used to compute the ground deformation maps. A cross- validation was performed using the CNR SBAS service on ESA G-POD [23]. An Envisat dataset of 20 SLC images covering the period from 19 December 2003 to 6 June 2010 was processed in G-POD. The hypothesis was that the pattern of ground movements should be similar even if the fine-tuning parameters are not the same (the user interfaces and settings are different).
The signal/noise ratio of the differential interferograms was improved with the Goldstein filter. In Sarscape™, the unwrapping step was performed with the Delaunay Minimum Cost Flow (MCF) method.
Only pixels characterized by coherence values above 0.3 were considered for phase unwrapping to exclude the low coherence areas (i.e., Dead Sea, quarries, and rehabilitation works) and enhance the quality of the results.
The atmospheric phase was estimated by assuming that this signal is characterized by spatially low frequency and very short temporal correlation. The adoption of appropriate spatial (low-pass) and temporal (high-pass) filters was removed. The topographic phase was removed using the Shuttle Radar Topographic Mission (SRTM) digital Surface model (DSM) with a ground resolution of 30 m.
Before proceeding to the geocoding, SBAS products are refined and re-flattened. Geocoded products can be displayed in two types of formats: shapefile(s) of point data and/or Raster files. SBAS’ shapefiles have associated files (e.g., .shx, .dbf, and Google Earth .kml). When the number of points is very large, then several shapefiles are created.
The database includes several useful fields for ground motion analysis. The information allows the production of graphs which illustrate the movements of the ground over time. By default, the measurements provided are oriented along the line of sight. These measurements can be projected vertically or horizontally thanks to the knowledge of the viewing angle [1]. Precision and accuracy, as well as the elevation of each point, are also available.

2.2. Data

The ERS dataset consisted of 27 Single Look Complex (SLC) images acquired from 11 June 1992 to 14 January 2000. Envisat images covered the period from 19 January 2003 to 19 March 2006. Hence, 15 scenes were processed. Thirdly, 41 Sentinel-1 images were used to map the deformations from 7 August 2015 to 18 August 2022. The Sentinel-1 images selected belonged all to the summer season of each year because the period is very hot, and the atmospheric conditions are very stable from one year to another. Although the temporal baseline was relatively large, experience had shown that interferometric coherence is well preserved apart from the extraction and rehabilitation zones.
Figure 3 shows the spatial and temporal distribution of the 41 Sentinel-1 images selected in this study. Validation of the deformation fields was carried out from (1) the knowledge got during multiple field surveys (2004 to 2015); (2) the interpretation of optical-IR satellite images, either archived at the USGS and ESA, or coming from commercial satellites; (3) the process of 20 Envisat images (2003–2010) performed with the ESA G-POD platform.
From that material, we have been able to trace back the evolution of the northern Lisan landscape from 2022 to the mid-1960s. Most optical Inputs consisted of Copernicus Sentinel data (2016–2022), of Landsat 1–8 (1972–2022), and of declassified Corona photographs (1965–1974). Spatial resolutions ranged from less than 10 m to 90 m.

3. Results

3.1. Geomorphological Map of SP-0B

Figure 4 shows a geomorphological sketch map of the northern Lisan peninsula, and a schematic cross-section based on a borehole at the site of the very first brine intake station (see “* Borehole” on the map). The background image is the Copernicus “GLO-30” DSM. The resolution is 30 m. In 2013, the Tandem-X Mission acquired the future “GLO-30” data. During that year, the Dead Sea level was 427 m bMSL. By comparison, early 2023, it is 437 m bMSL. The elevations between −394 m MSL and −352 m MSL (Figure 4: brown to grey colors) represent the peninsula as it was until the 1960s. The area located from −394 m bMSL to −427 m bMSL represents the wave-cut platform that is emerging from the 1970s to the present. It is made of sub horizontal marls of the Lisan formation.
Corona photographs of the Lisan peninsula acquired in the 1960–1970s have shown that vegetation was confined into sinkholes occurring along lineaments of structural origin (dotted lines). Nowadays, most of them are still visible except in the areas that have turned into quarries (especially in the northern part and along the western cliff). Due to their permanence, they are used as ground control points to geocode Corona pictures. The orientation of the fractures is compatible with the directions of the major faults bounding the peninsula (either Strike-slip or normal faults). Very high-resolution satellite images (e.g., GeoEye 17 August 2011) have shown that along the western side of the peninsula there are sinkholes and underwater springs in the shallow waters of the terminal lake.
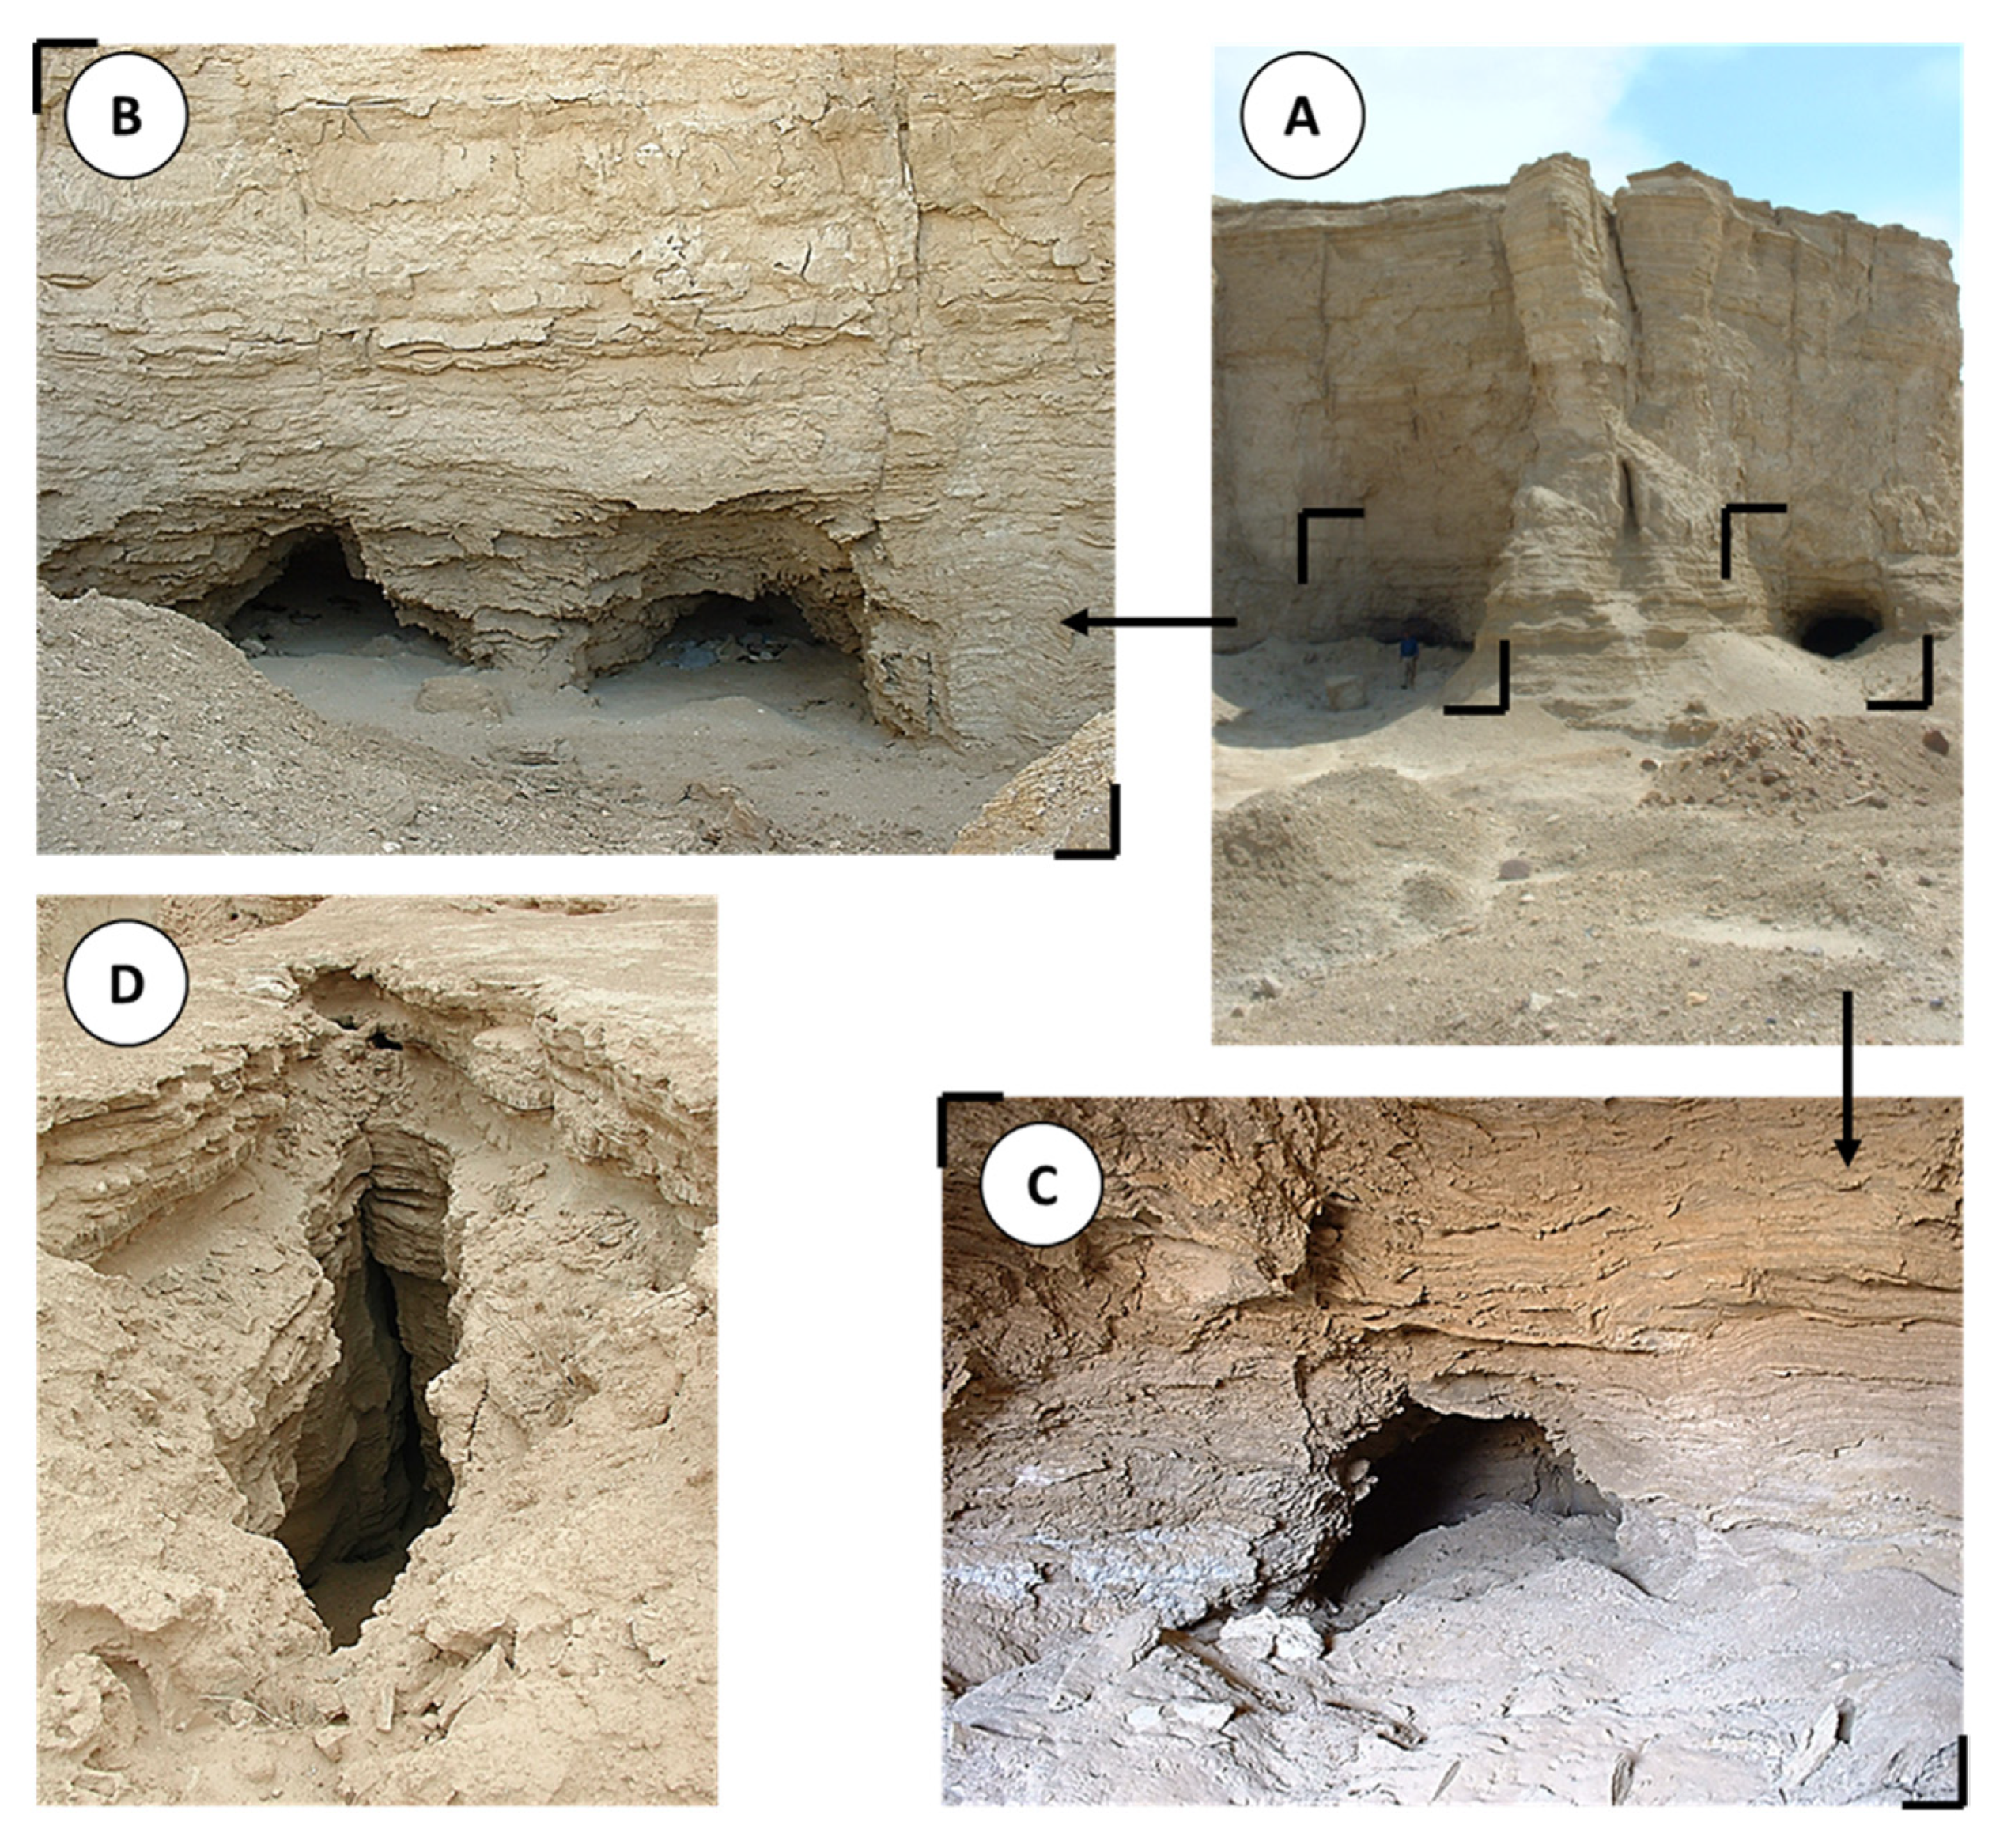
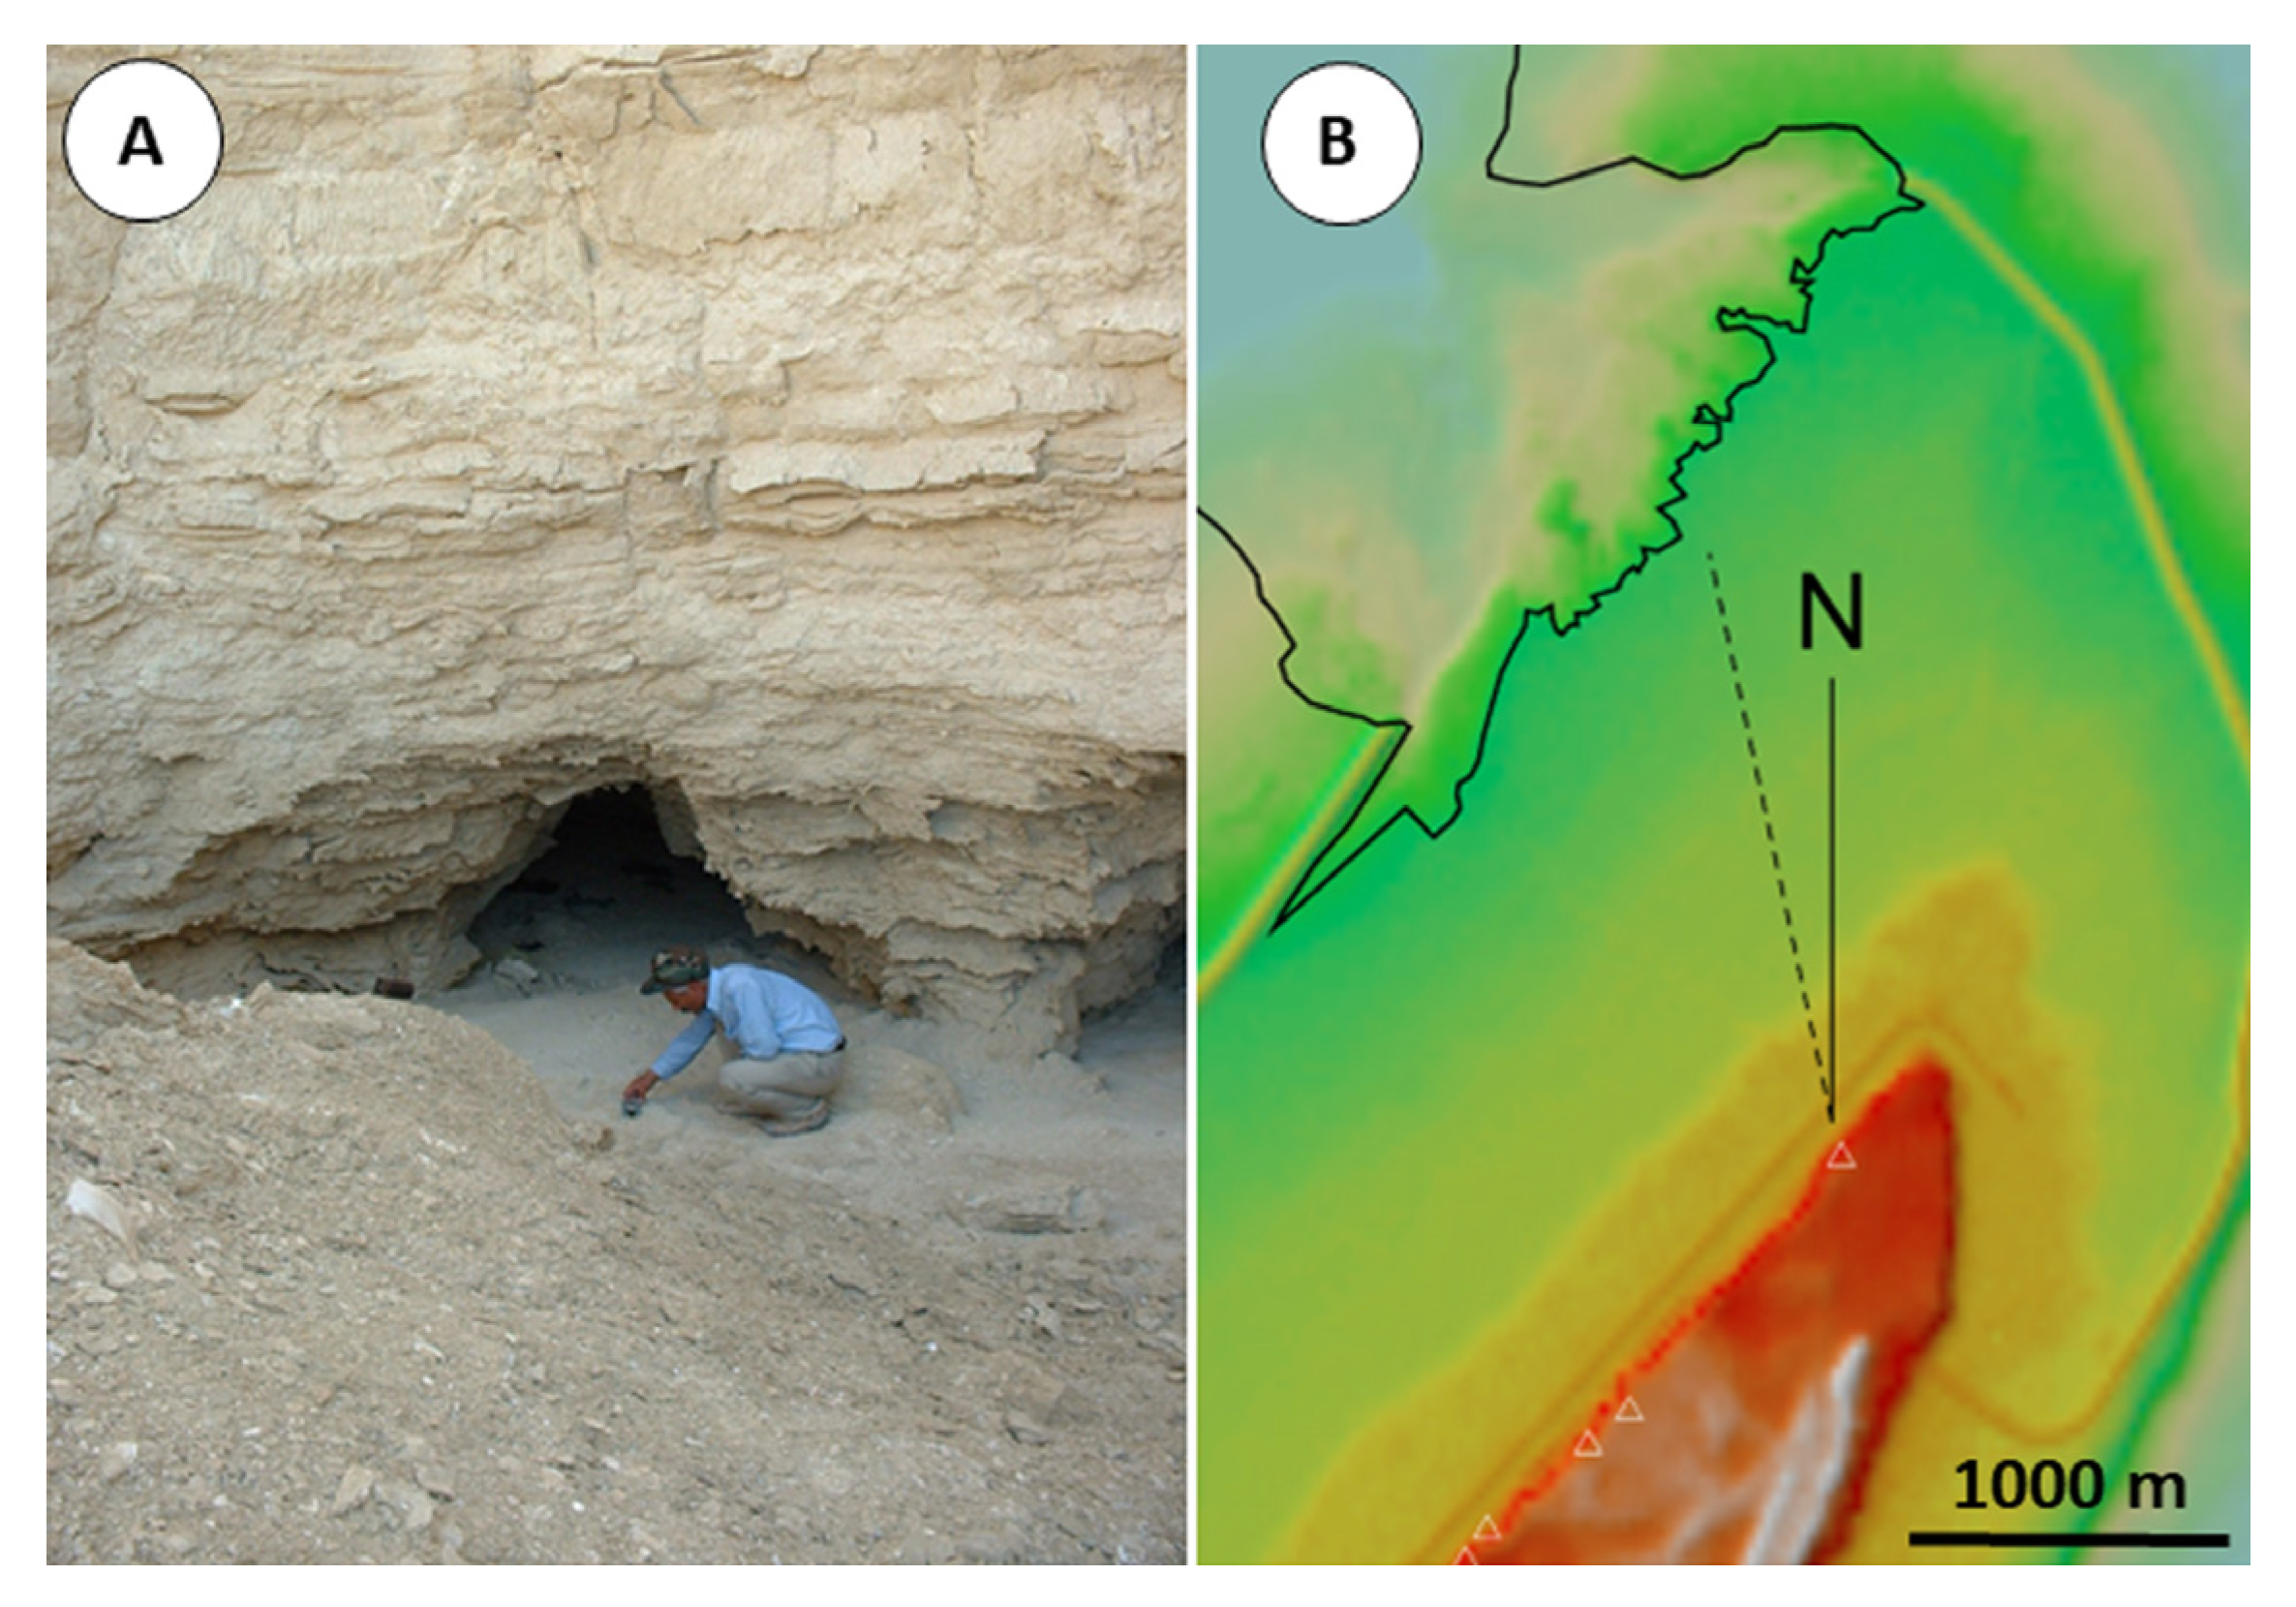
Figure 4 is based on a selection of field observations (Figure 5, Figure 6 and Figure 7) regarding the Lisan karst network system. Five major cave entrances are represented (white triangles) from a survey in April–May 2005. These caves developed along a N10W oriented fracture (Figure 6). Figure 6B is the GLO-30 with the position of the cave entrances and the extension of the direction of the fracture (dotted black line) at the origin of this cavity developed by dissolution. The line crosses the wave-cut platform, and it reaches the geometric center of dike 19′s destroyed area. This zone probably corresponds to the initiation point of the disaster.
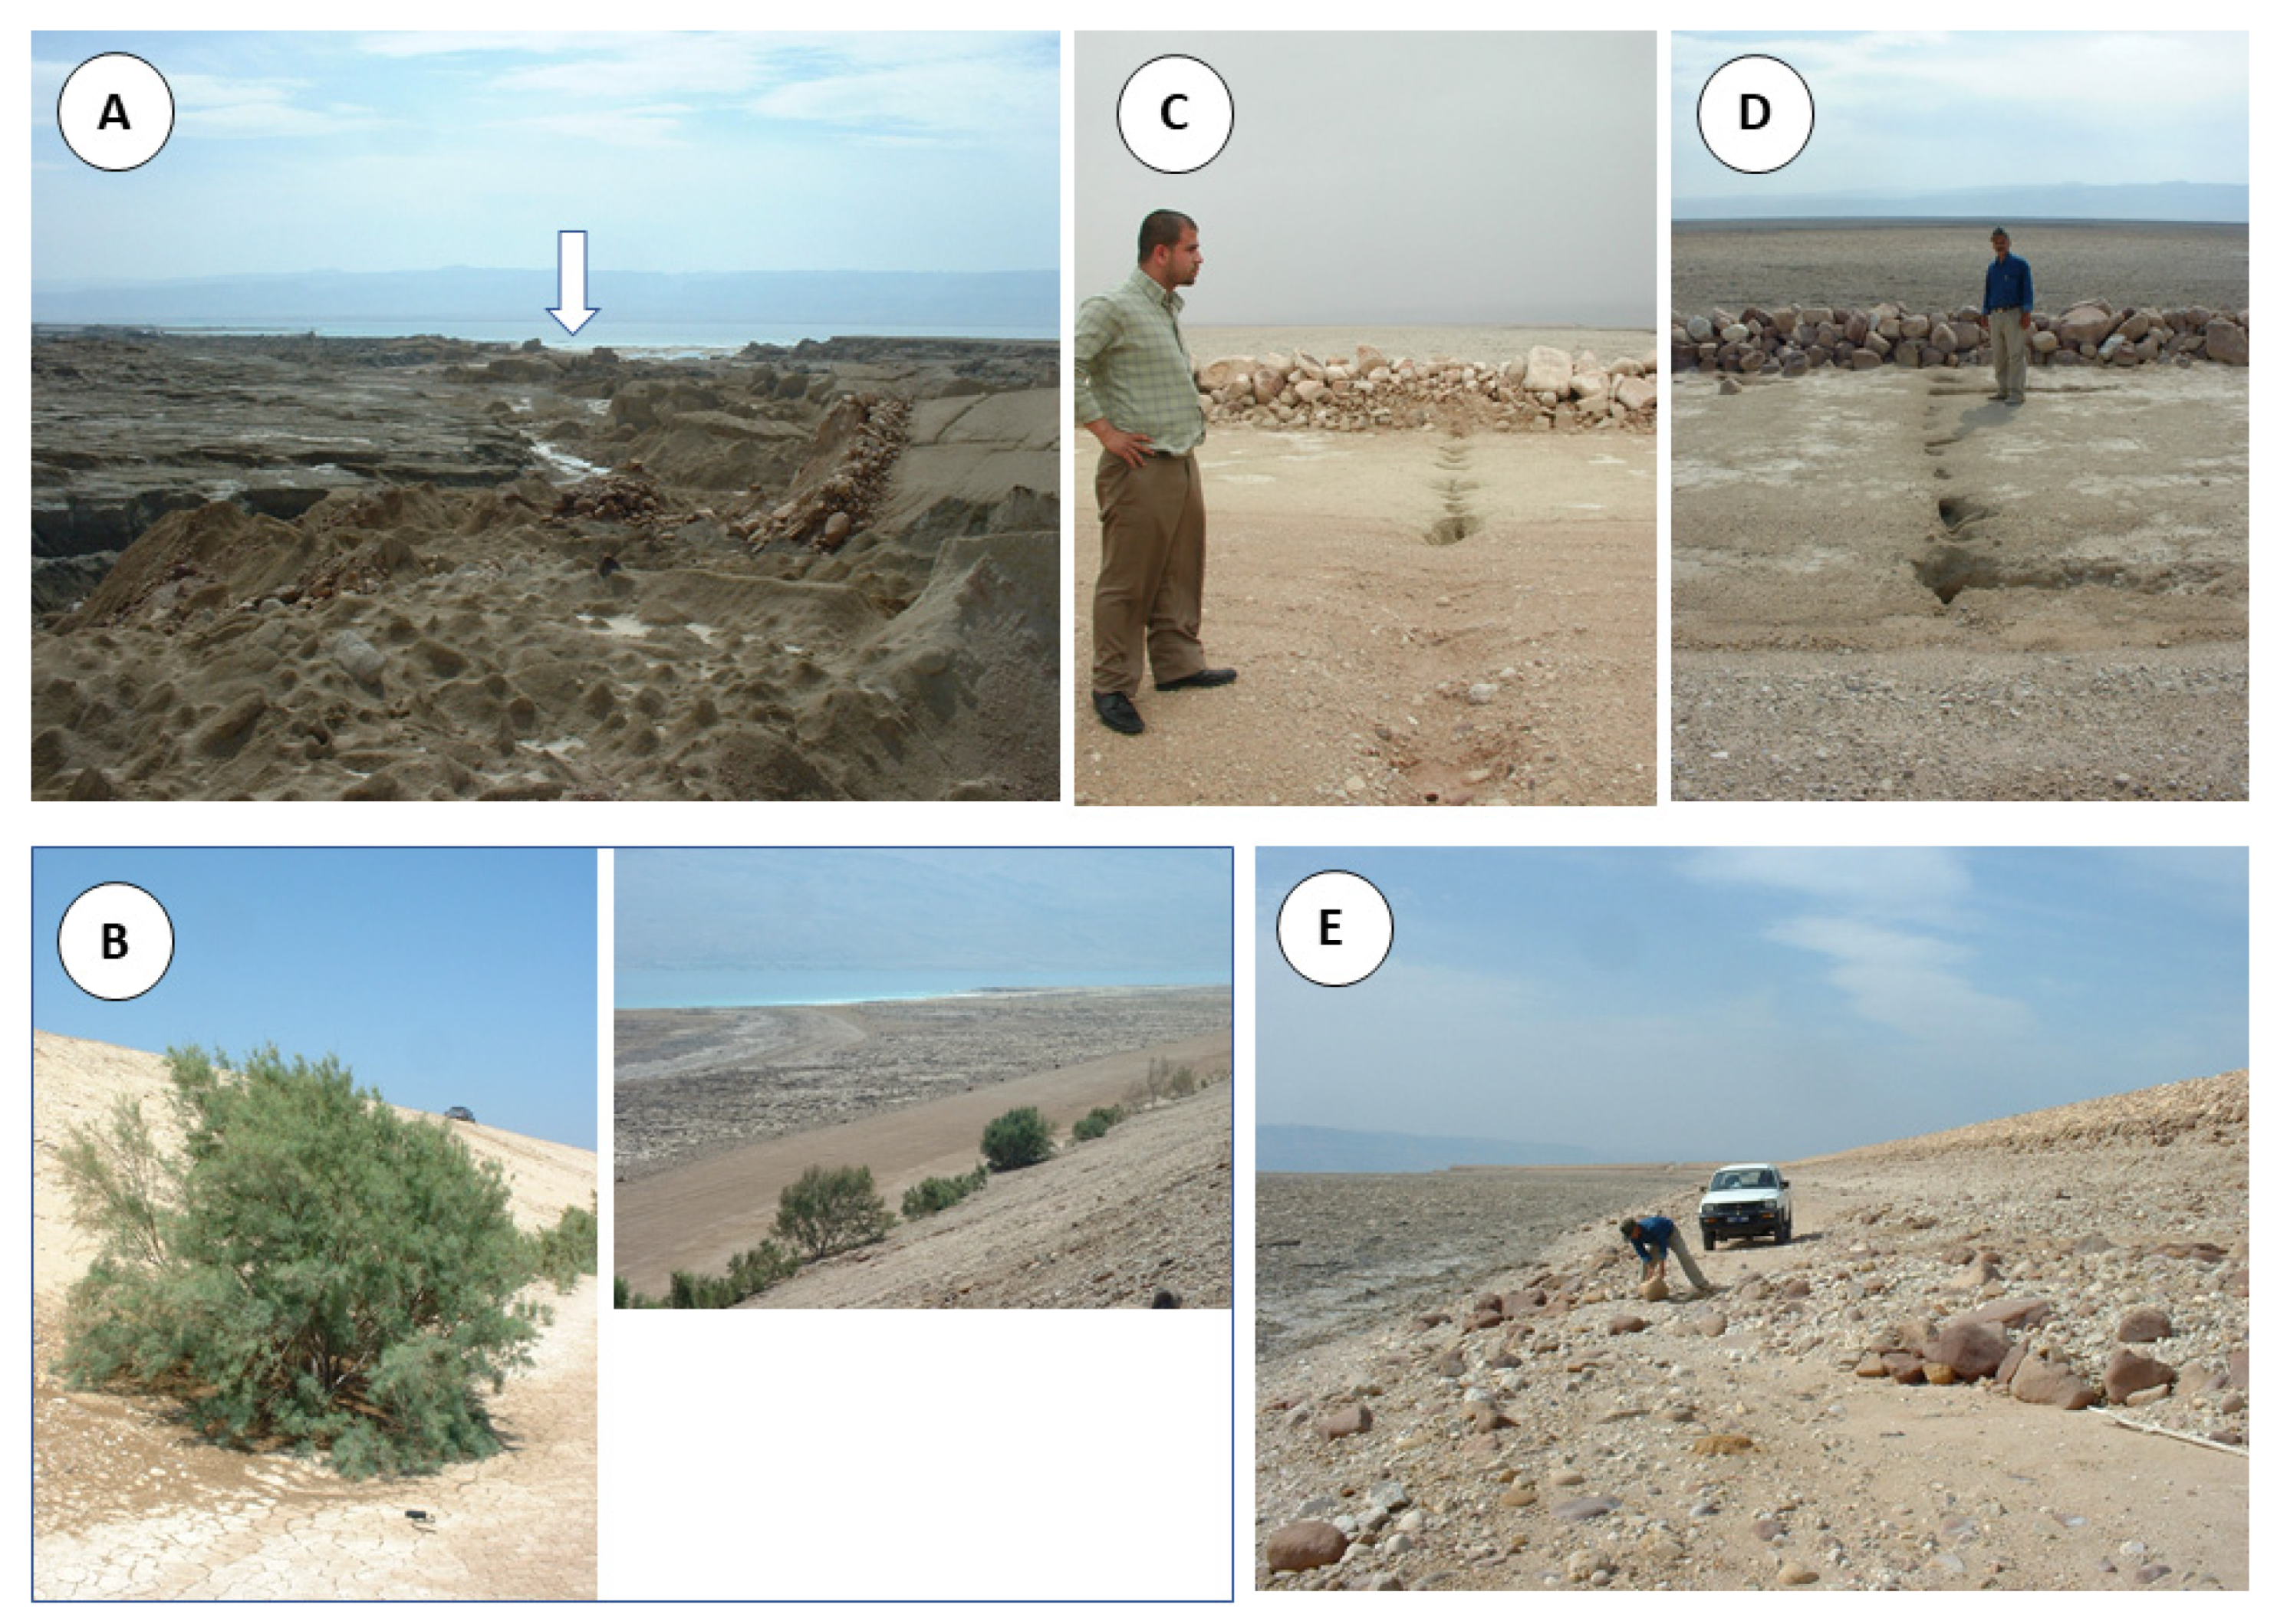
In Figure 4, dike 19 and 20 segments appear distinctly on the DSM as a yellow line (−394 m) surrounded by green colors (−409 m, −412 m). Field surveys carried out in 2004, 2005, 2007, and 2012 revealed dozens of fractures crossing perpendicularly to the dikes’ axis (Figure 7C,D). Many landslides were also identified as well as metric sinkholes. Two other remarkable elements were (a) the presence of perennial water flows at the time of a survey in April 2005 in the collapsed dike area (also visible on satellite imagery), and (b) some Tamarix bushes in the foreshore of the remaining dike 19 (Figure 7A,B).
Figure 4 also reproduces the outcrops of soft clay along the shore based on the interpretation of dark gray colors over satellite imagery. From GLO-30, elevation ranges between −414 m and −419 m. These clay layers are fundamental for the understanding of the rehabilitation works’ stability challenge [4].
In 1977, when the Dead Sea level was ~400 m bMSL (Figure 4—cross section), APC undertook a £3 million study for its development over the Lisan area [24]. At that time, engineers pointed out at the brine intake station (UTM 36, x = 734.5 km; y = 3468.5 km): “The very soft foundation conditions required (…) tubular steel piles to a depth of up to 35 m to achieve sufficient bearing capacity to support the structures (i.e., −435 m MSL). In some locations the piles dropped 10 m into the soft mud under their dead weight (i.e., the thickness of the soft clay layers reaches 10 m in places)” (…) “At the main brine intake (−400 m MSL) a stratum of rock salt was located at between 22 m (−422 m MSL, Dead Sea level achieved in 2009) and 32 m (−432 m MSL achieved in 2018) depth which provided a good foundation for the piles”.
Much later, these soft clay layers emerged progressively from around 2000 (−414 m MSL) to 2009 (−422 m MSL). Concomitantly, SP-0A was partially emptied for two years to avoid dike collapse [3], and ground failures were observed in the surroundings of a new brine intake station. The previous ones were stranded due to the Dead Sea level lowering. APC undertook geotechnical studies to understand and fix the soft clay layers issue. In-situ vane shear tests were carried out in boreholes. The results show that the shear strength of the soft clay increased with depth. See [25] for a quantitative assessment. The resulting values agreed well with the shear strength of normally consolidated soft clay.
In the field, the very low strength of the 5 to 10 m thick clay layers (Figure 4) was evidenced by the occurrence of mud waves [25], e.g., field engineers observed a bearing capacity failure upon placement of about 1.5 m of fill required for the construction of an earth fill causeway. In 2005, during a field survey, mud waves were photographed in the northern part of the wave-cut platform [UTM36, x = 736.7 km y = 3473.9 km] close to CH 6 + 000 (Figure 1). Unexpectedly, APC boreholes around CH 6 + 000 (the collapsed area) have shown that the foundation materials consist of more than 60 m thick, soft to very soft sensitive, highly compressible, and relatively impervious laminated silty clays [4].
The soft clay layers undergo seawards lateral movements following the continuous decrease in the Dead Sea level. The displacement is a time dependent phenomenon. It can be accelerated with the injection of water into the sediments or by increasing the load above the layers. Otherwise, it takes a relatively long period of time. It is also continuously progressing. There are three main causes behind the continuous displacements:
  • The plastic nature of the emerged soft clay layers.
  • The amount of gravitational potential energy of the recently emerged sediments depends on the height and mass above the base level (Dead Sea). Thus, the lower the base level, the greater the movement of deformable sediments such as soft clays.
  • The groundwater injection owing to geological discontinuities is activated both by the rise of the Lisan diapir, the strike-slip tectonics, and by the isostatic readjustment linked to the lowering of the Dead Sea level. Blocked downwards by the hard salt layer, the soft clay can essentially creep laterally. However, locally, downward movements by infiltrating the weakness zones could occur and could explain the lateral variation of the soft clay thickness across the entire salt pan SP-0B, from 5 m up to 60 m.
During the 2000s, several inclinometers were installed near the contemporary brine intake station to quantify the lateral movements [25]. It was shown that the seaward motion vectors were almost perpendicular to the contour lines. The measured displacements were about 150 mm in four years i.e., a sliding rate of about 30 to 40 mm per year [25].
These records are compatible with the ground displacements detected along the coastal zone with spaceborne radar interferometry techniques in C Band (see the penultimate figure B–D). This range of values appeared first at the end of the 1990s contemporary with the emergence of the soft clay layer, and then it spread out during the 2000s and the 2010s.
APC engineers have deduced that the lateral movements, in conjunction with the thrust stresses due to the tectonic movements, were responsible for the observed cracks near the brine intake station.
In 1992, the 10-m salt layer (Figure 4, cross section) was considered as the source of sinkholes that had destroyed an access road that would have turned into a dike segment of the future SP-0A [3]. In 2022, the Dead Sea has an elevation of −437 m MSL. Therefore, the salt layer topped by the Lisan marls is apparent along the coast because they are sub horizontal deposits. The colors make it possible to clearly distinguish the two sets but even more, so their elevations coincide with the drillings carried out in 1977 [24].

3.2. Rehabilitation Works of SP-0B

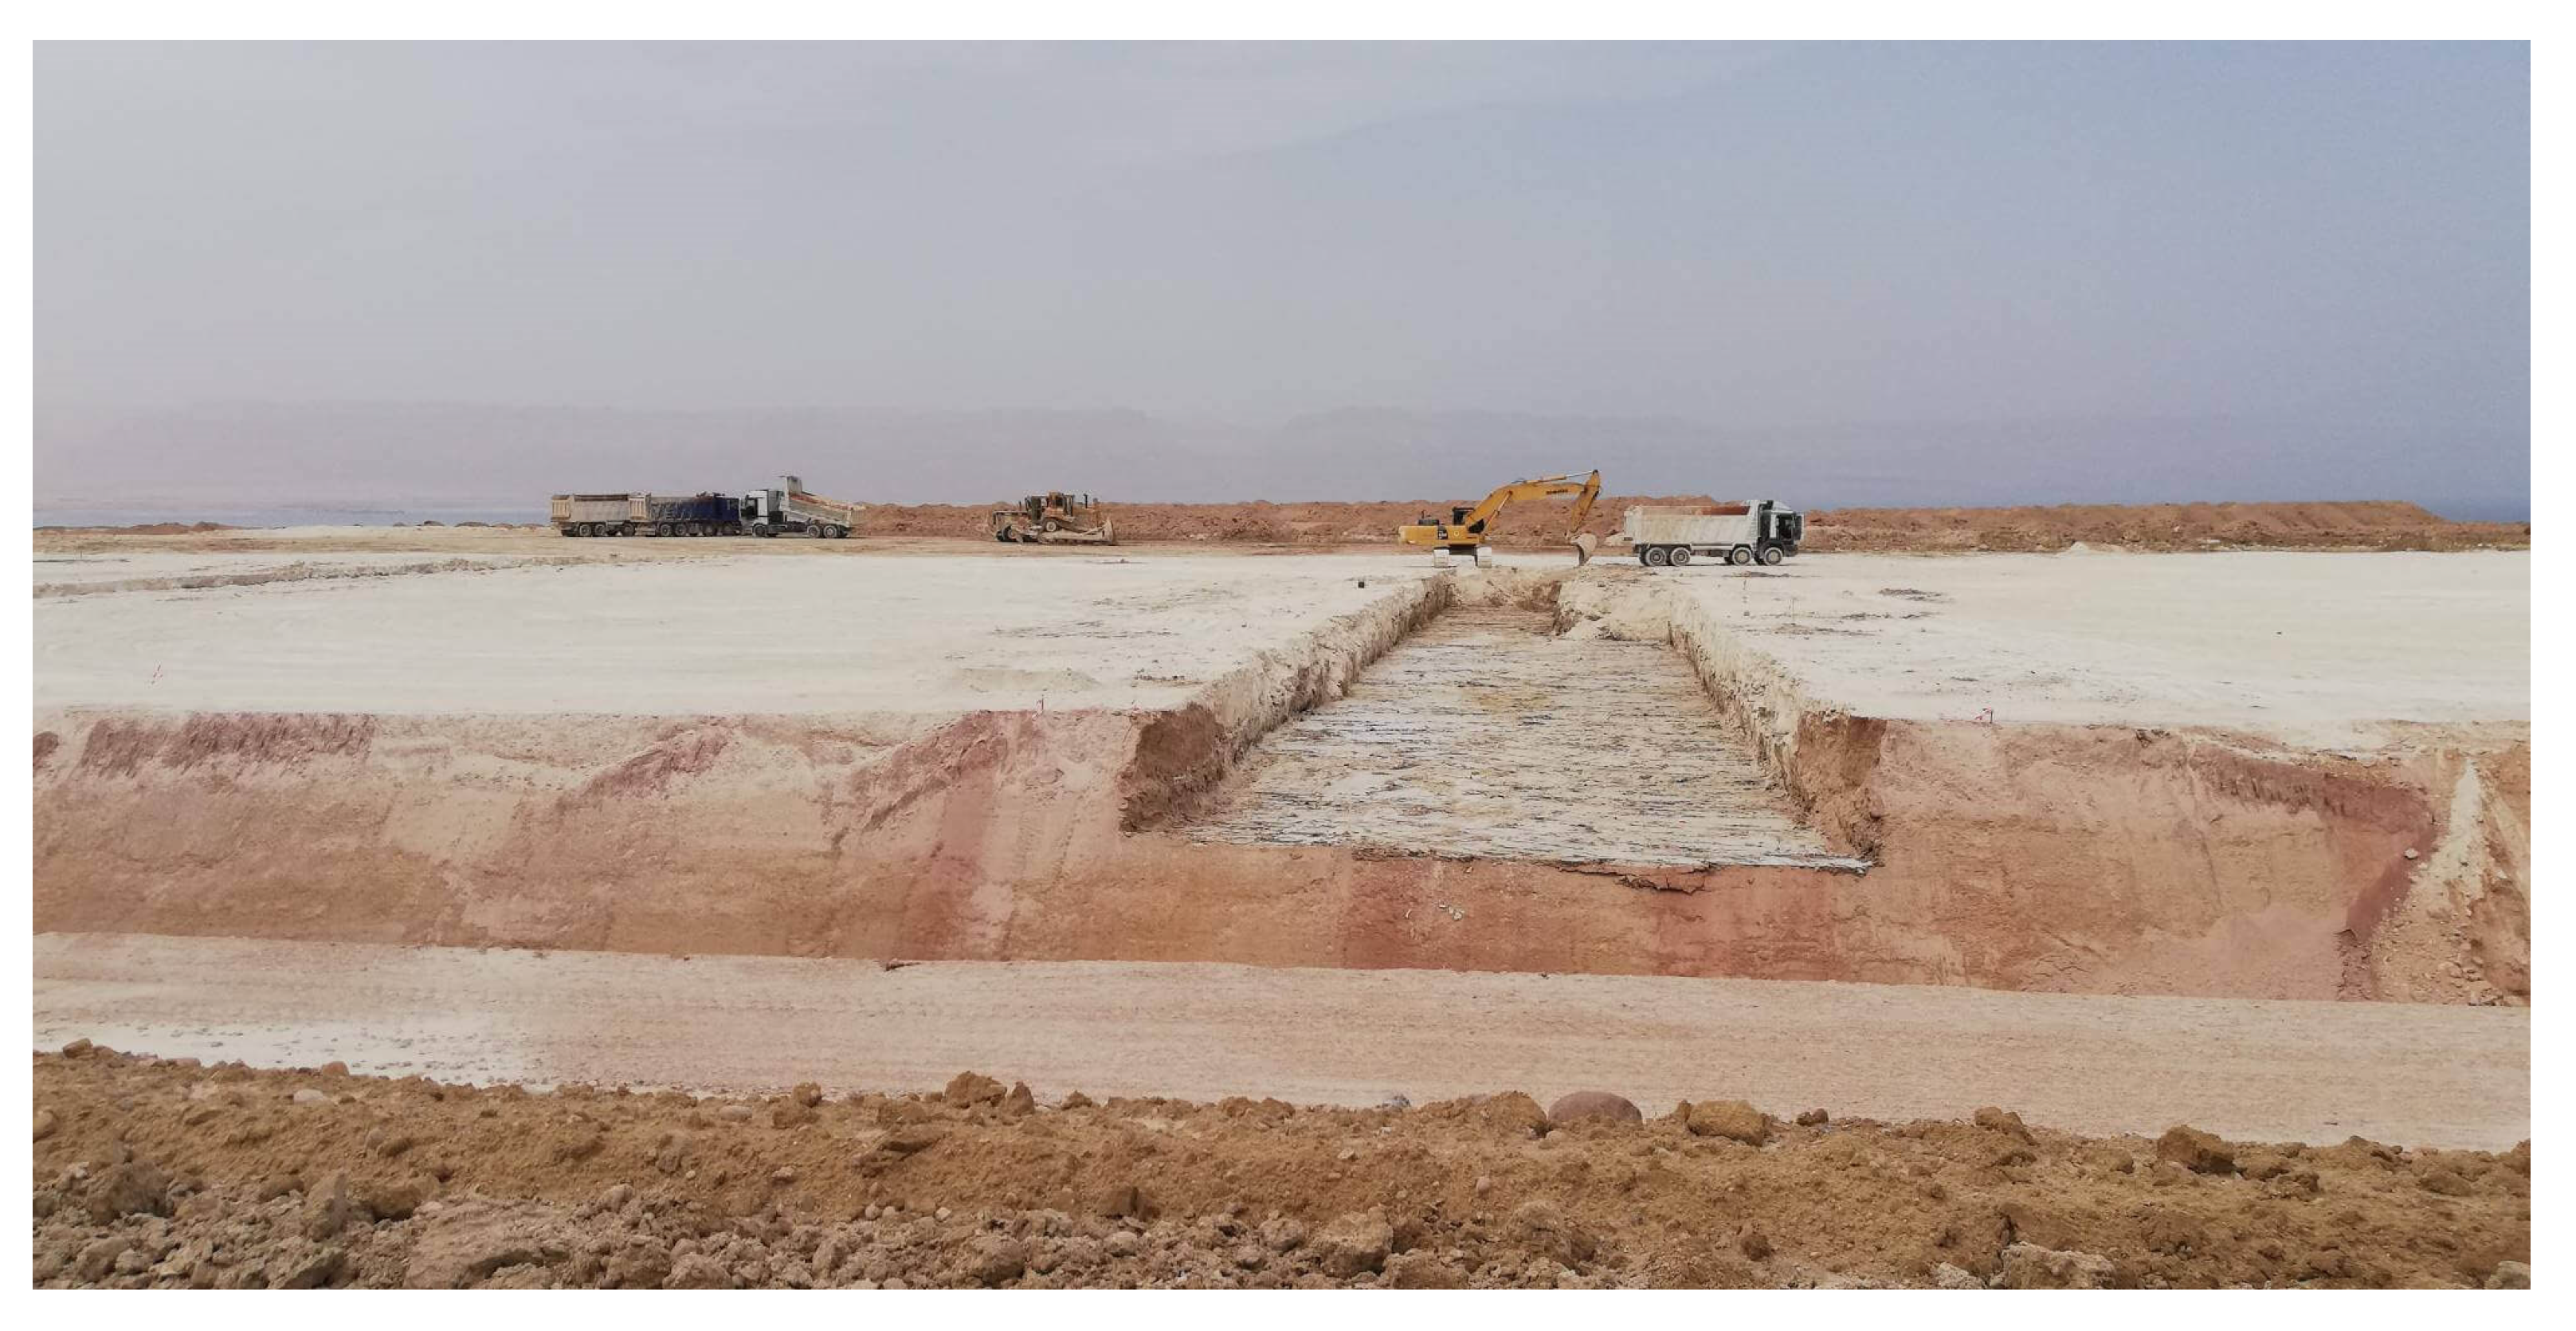
The rehabilitation and reinstatement project was carried out from May 2018 to December 2021. APC spent 28 M USD for the construction of a 10 km long fill-embankment. The works consisted in the repair of dike 19 segment over a total length of 7.5 km. A protection berm has been set up outside the dike. It consisted of various materials with a width of 300 m and a height of about 14 m (Figure 8).
The major aspects of the work were (a) the excavation and removal of 0.5 M m3 materials from the existing Dike 19; (b) the setting up a volume of 2.3 M m3 fill materials extracted at the northern tip of the Lisan peninsula (see Figure 5); and (c) sinkholes remediation with around 20 km drilling and 20,000 m3 grouting. Additionally, geotechnical investigation, instrumentation, and monitoring of the rehabilitation were carried out.
The monitoring concerned over 700 different fully automatic geotechnical instruments: 610 vibrating wire piezometers; 33 inclinometers; 42 extensometers; 37 standpipe piezometers with pressure transducers; and Seven data loggers equipped with wireless routers connected to WMS data management software. At the end of the construction stage, the work also included drilling of geotechnical boreholes and carrying out seismic piezocone (SCPTu) tests. Currently (December 2022), 60% of the project has been completed. Figure 9A shows the full extent of the new dike 19.
The geotechnical records indicate that foundation material of dike 19 are more compressible, more sensitive, and less permeable than the ones a few kilometers south westward, near SP-0A [4]. The foundation material consists of very soft to medium stiff thick to very thick bluish gray thinly laminated silty clay with stronger inter-beds of gypsum and aragonite and occasionally with organic debris. At the place where the collapse occurred, the foundation materials consist of more than 60-m-thick, soft to very soft, sensitive, highly compressible, and relatively impervious laminated silty clays. These laminations are sometimes disturbed and convoluted (seismites), and thus impeding the drainage and the fast dissipation of pore pressures.
Engineers notice that due to the very low permeability of the foundation soils the dissipation of pore pressures is very slow.
Retrospectively, in 2000, the settlement reached about 4m beneath the central part dike 19 before failure near Ch 6 + 000 (Figure 1). Moreover, at that time, geotechnical engineers carried out stability analyses using vane shear tests (VST) to a depth of 10 m below the base of the dike, at the locations where cracks developed in the body of the dike (Figure 7). The intermittent presence of salt layers in between the laminated silty clay layers resulted in inconsistent VST measurements. Therefore, VST was indeed not a reliable source of data for stability analyses unless properly corrected based on correlation with other tests, such as a cone penetration test. VST tests were carried out to a shallow depth and missed the deeper soft layers of the laminated silty clay through and along which the shear failure surface most probably has passed.
From APC experts’ reports, based on data recorded in three boreholes near Ch 6 + 000 (Figure 1), the failure surface was most probably a rotational one that starts at the junction point of the upstream berm with the dike and exits at about 27 m from the downstream toe of the dike with a maximum depth of about 20 m beneath the dike. A longer rest period between the end of construction and commencement of impoundment and control of the rate of impoundment, based on pore pressure readings and stability analyses, could have saved the dike. However, multiple incidents [3,27] demonstrated that the foundation parameters were not the only ones responsible for the dike collapse.

3.3. Ground Deformation Fields

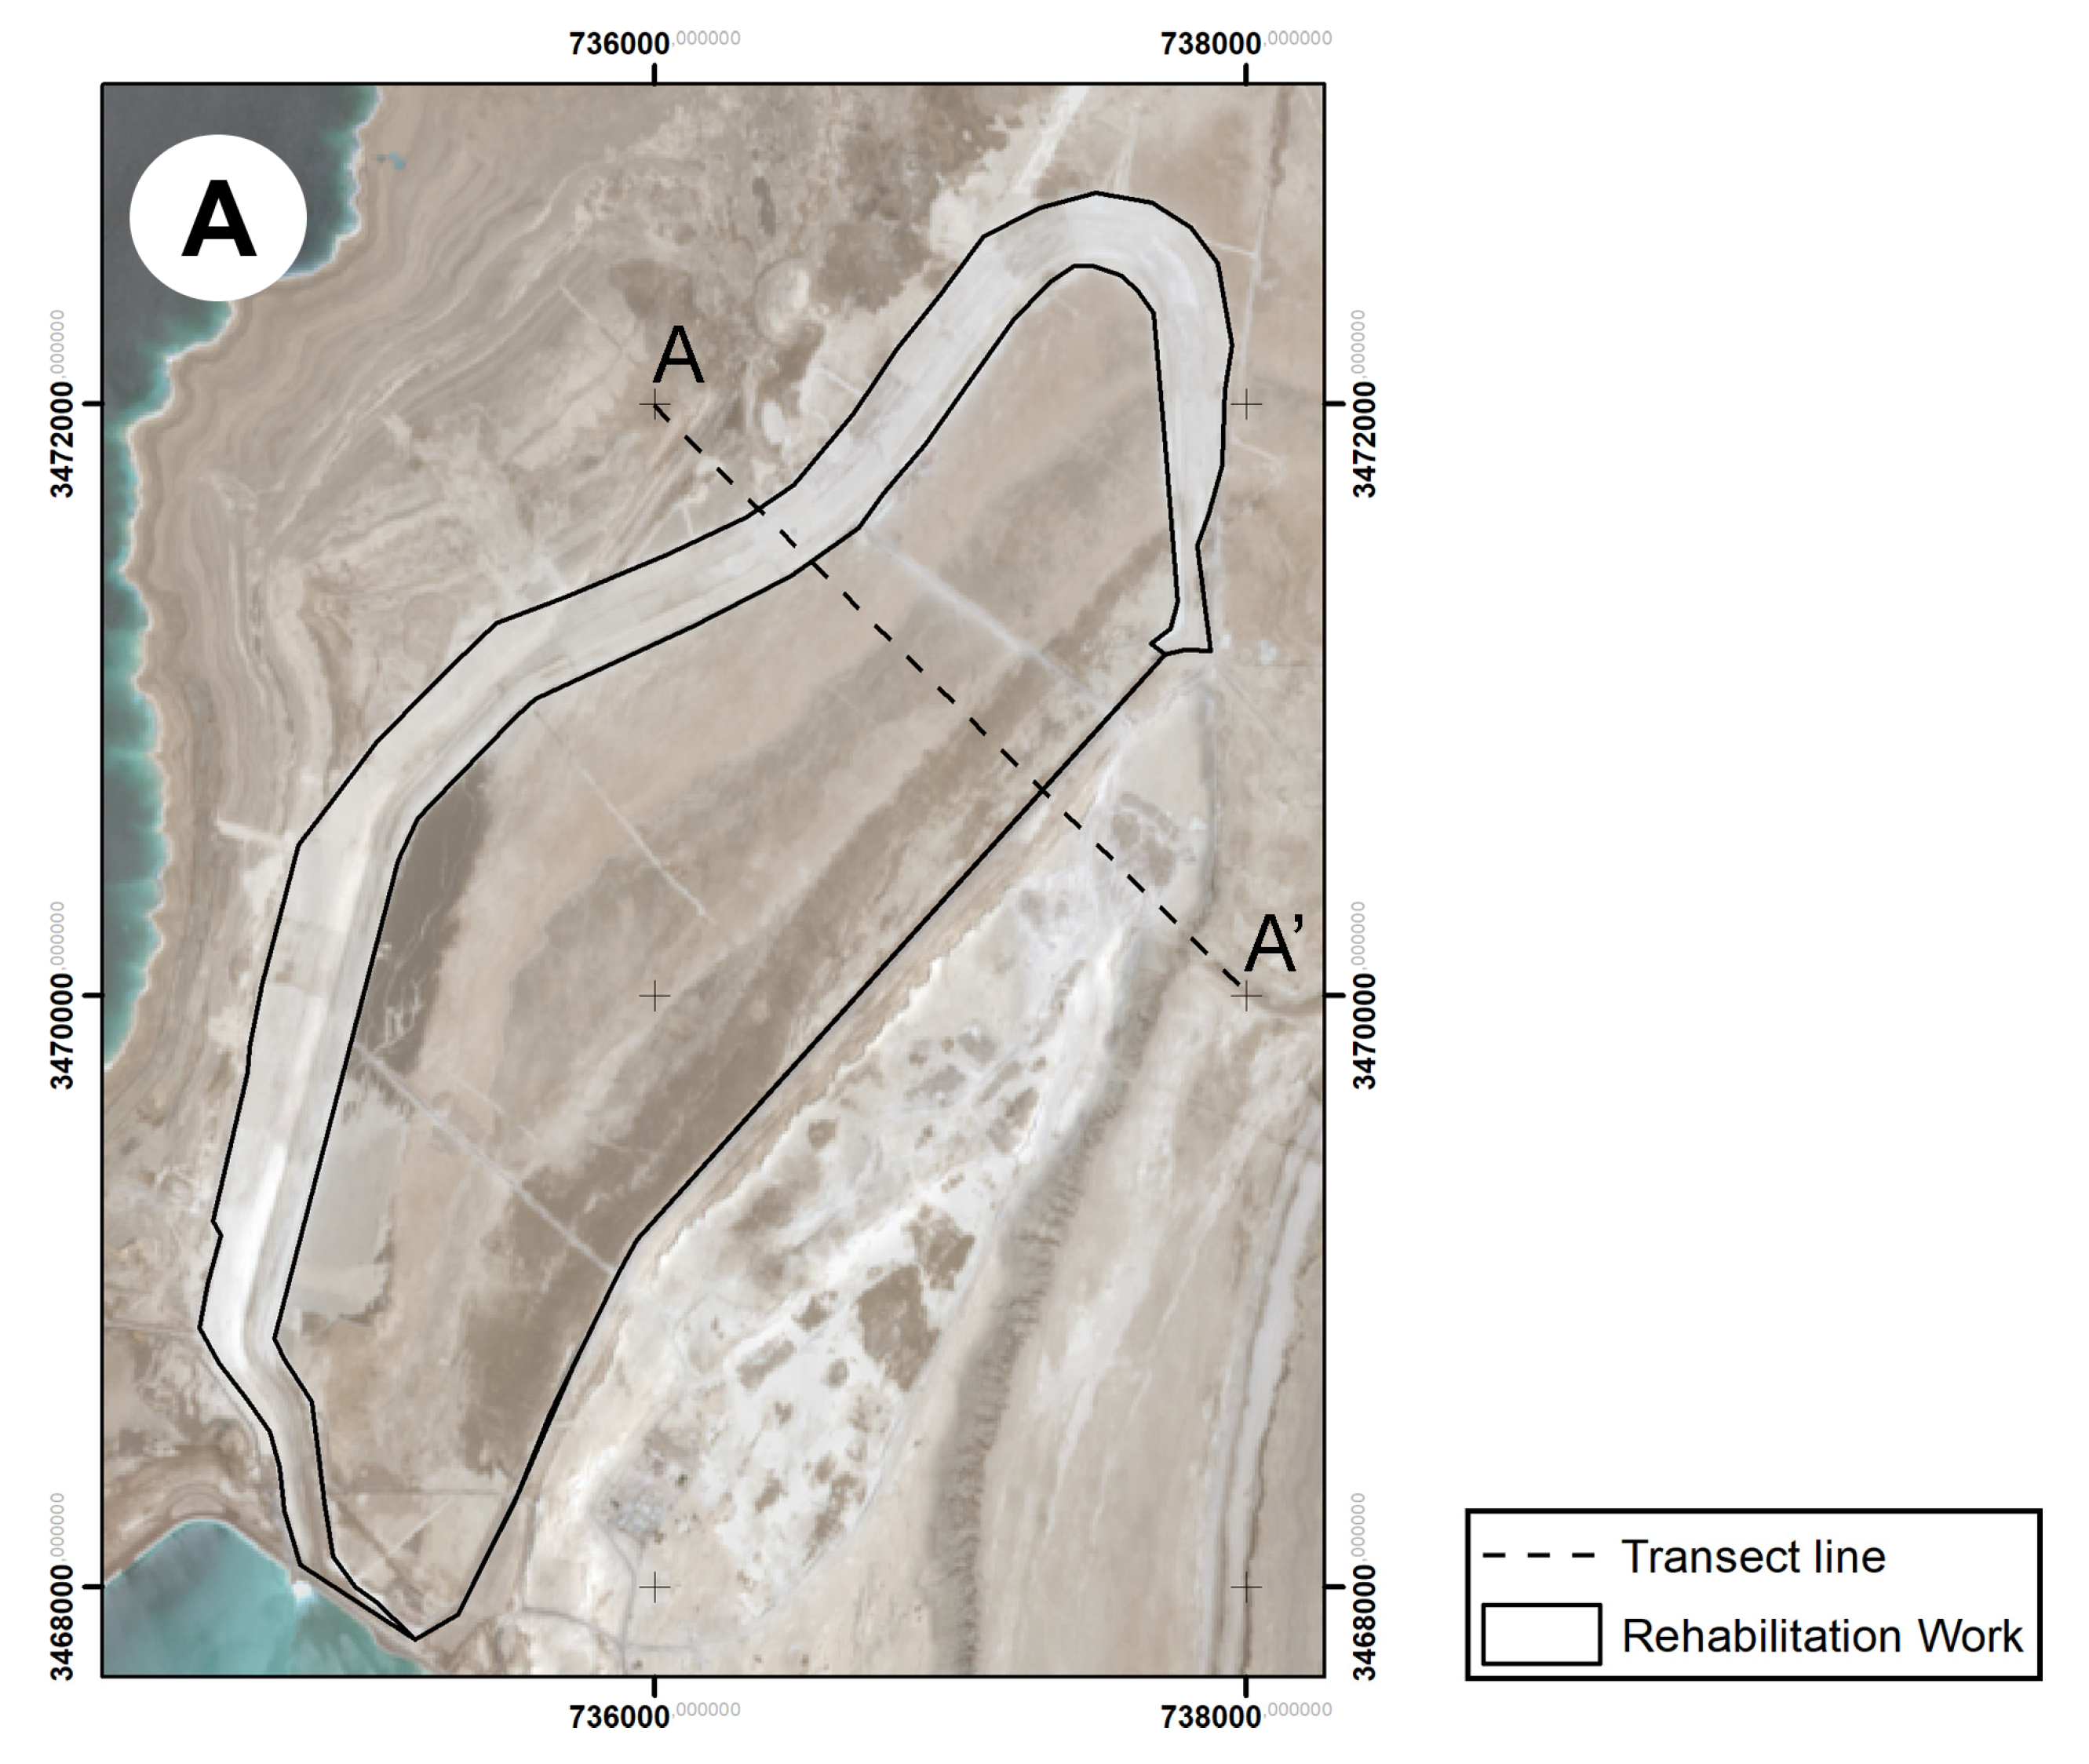
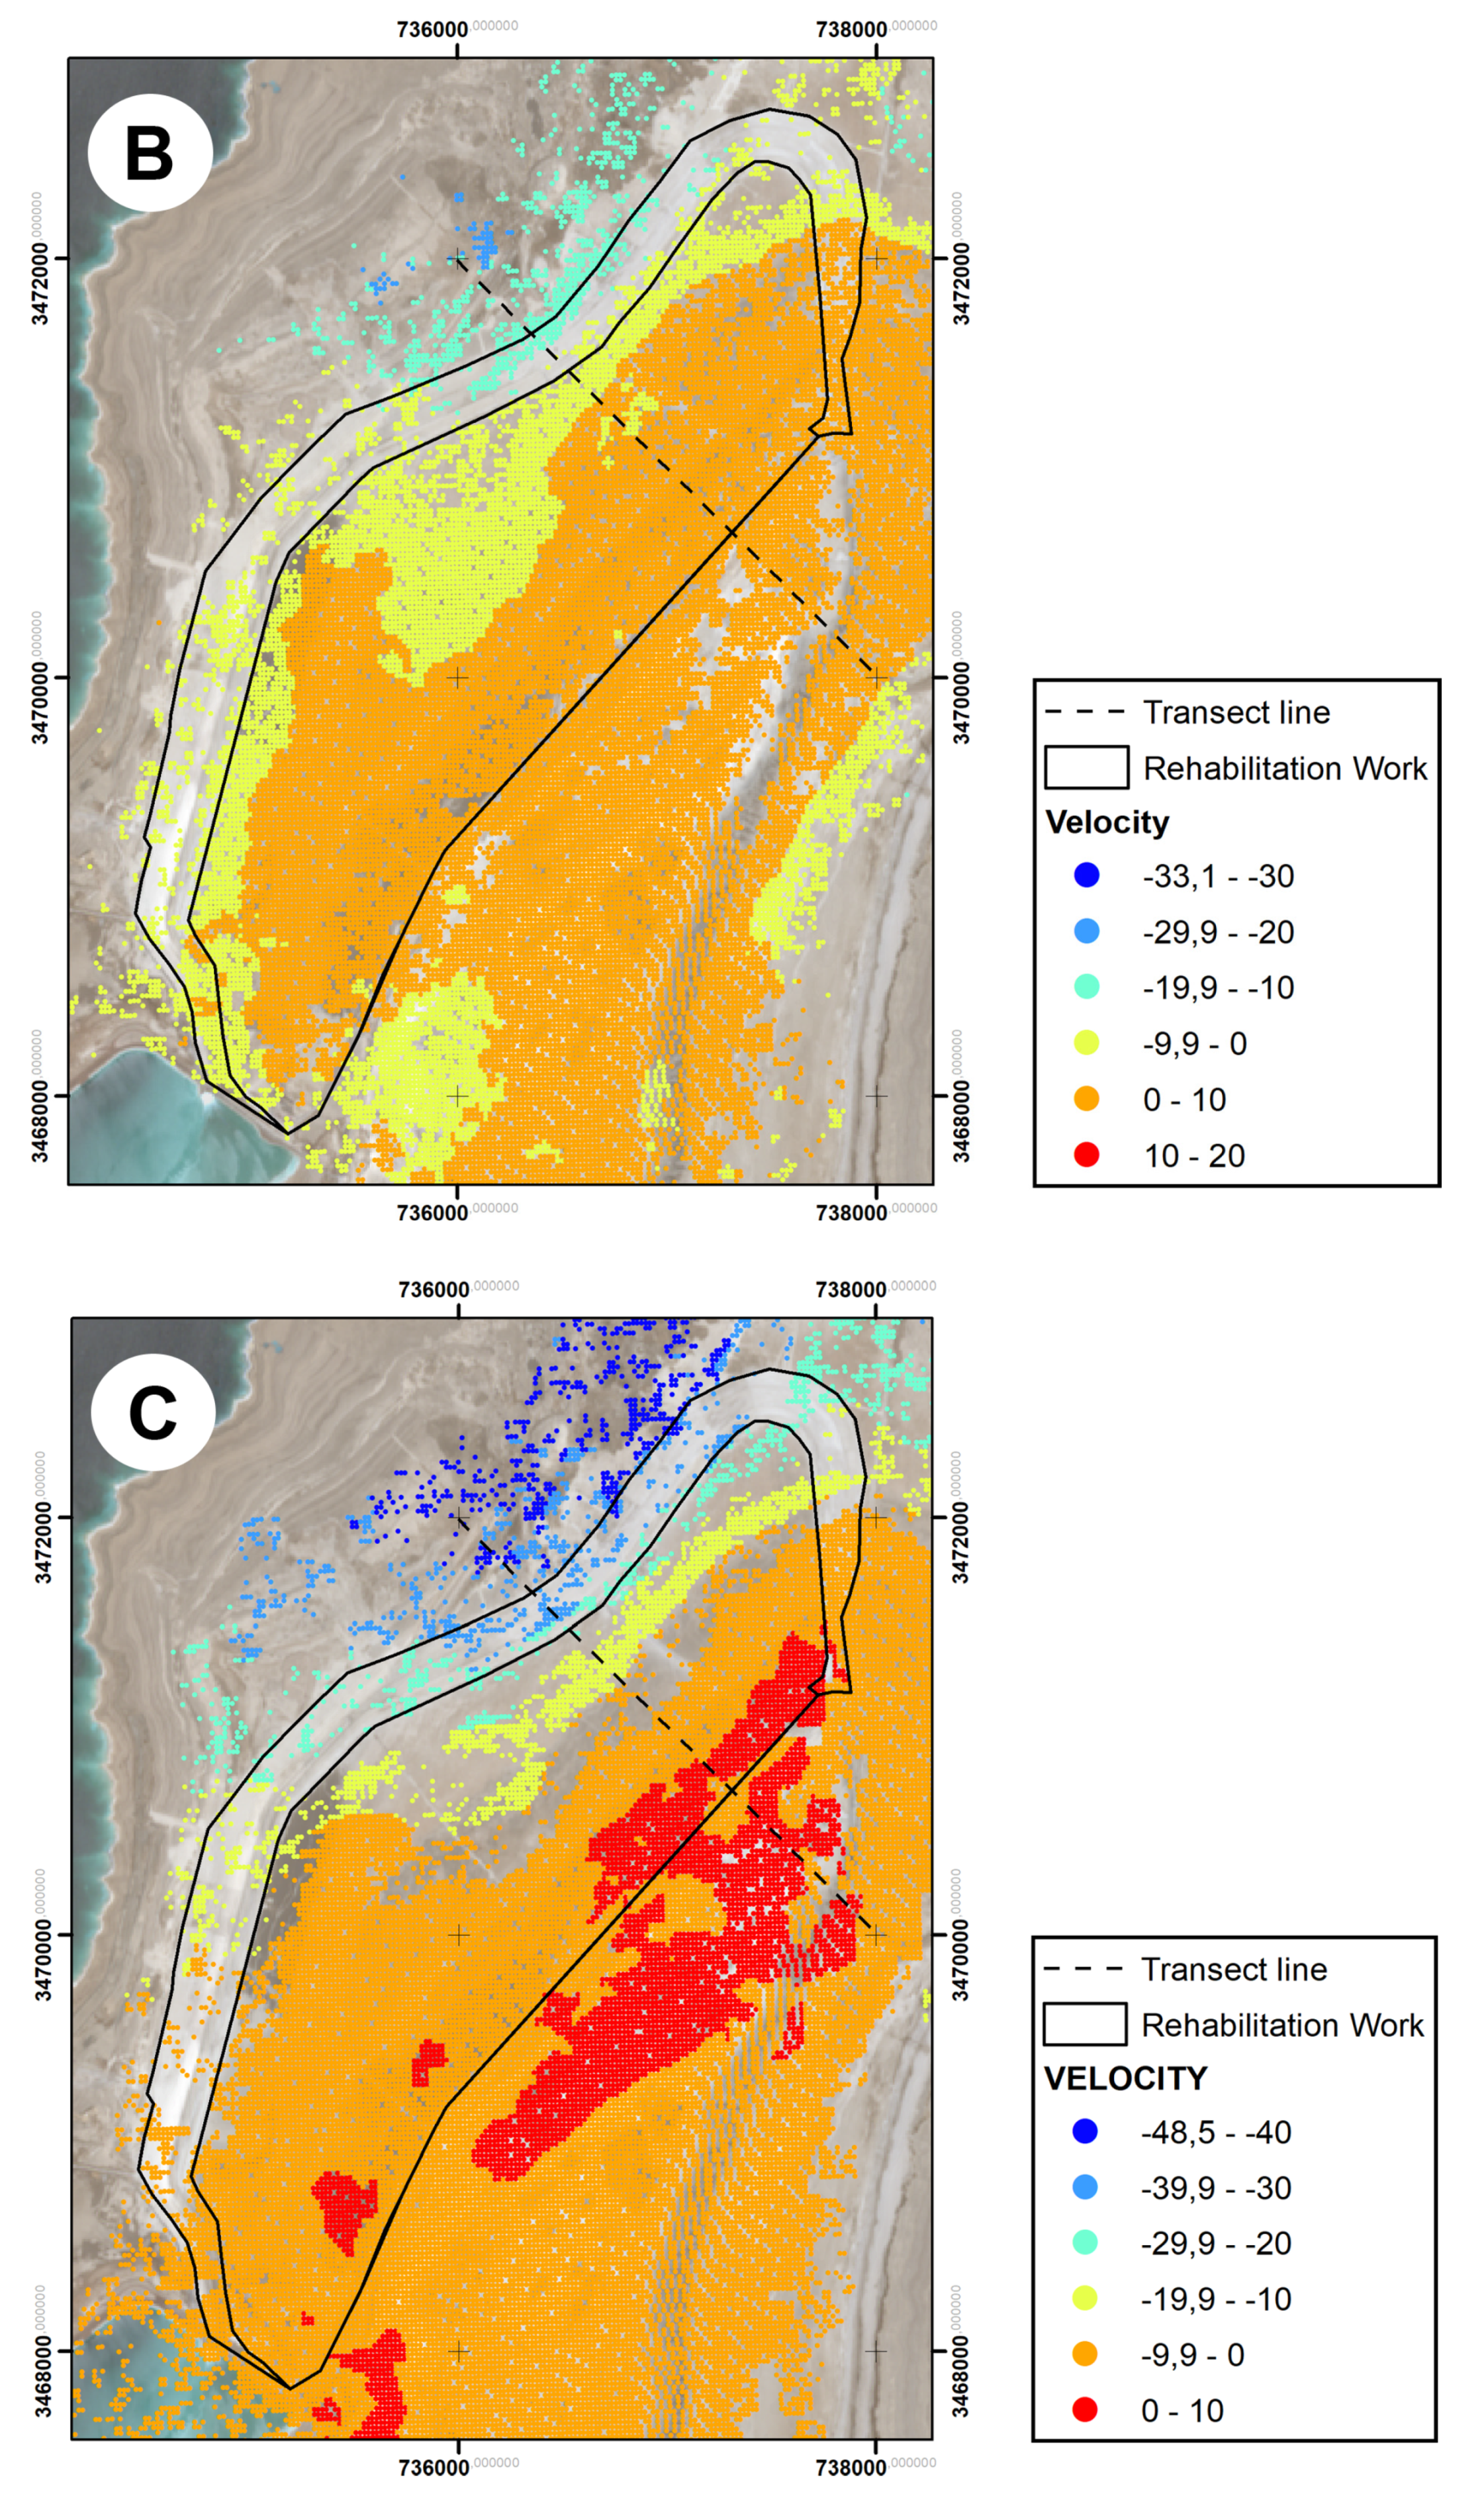
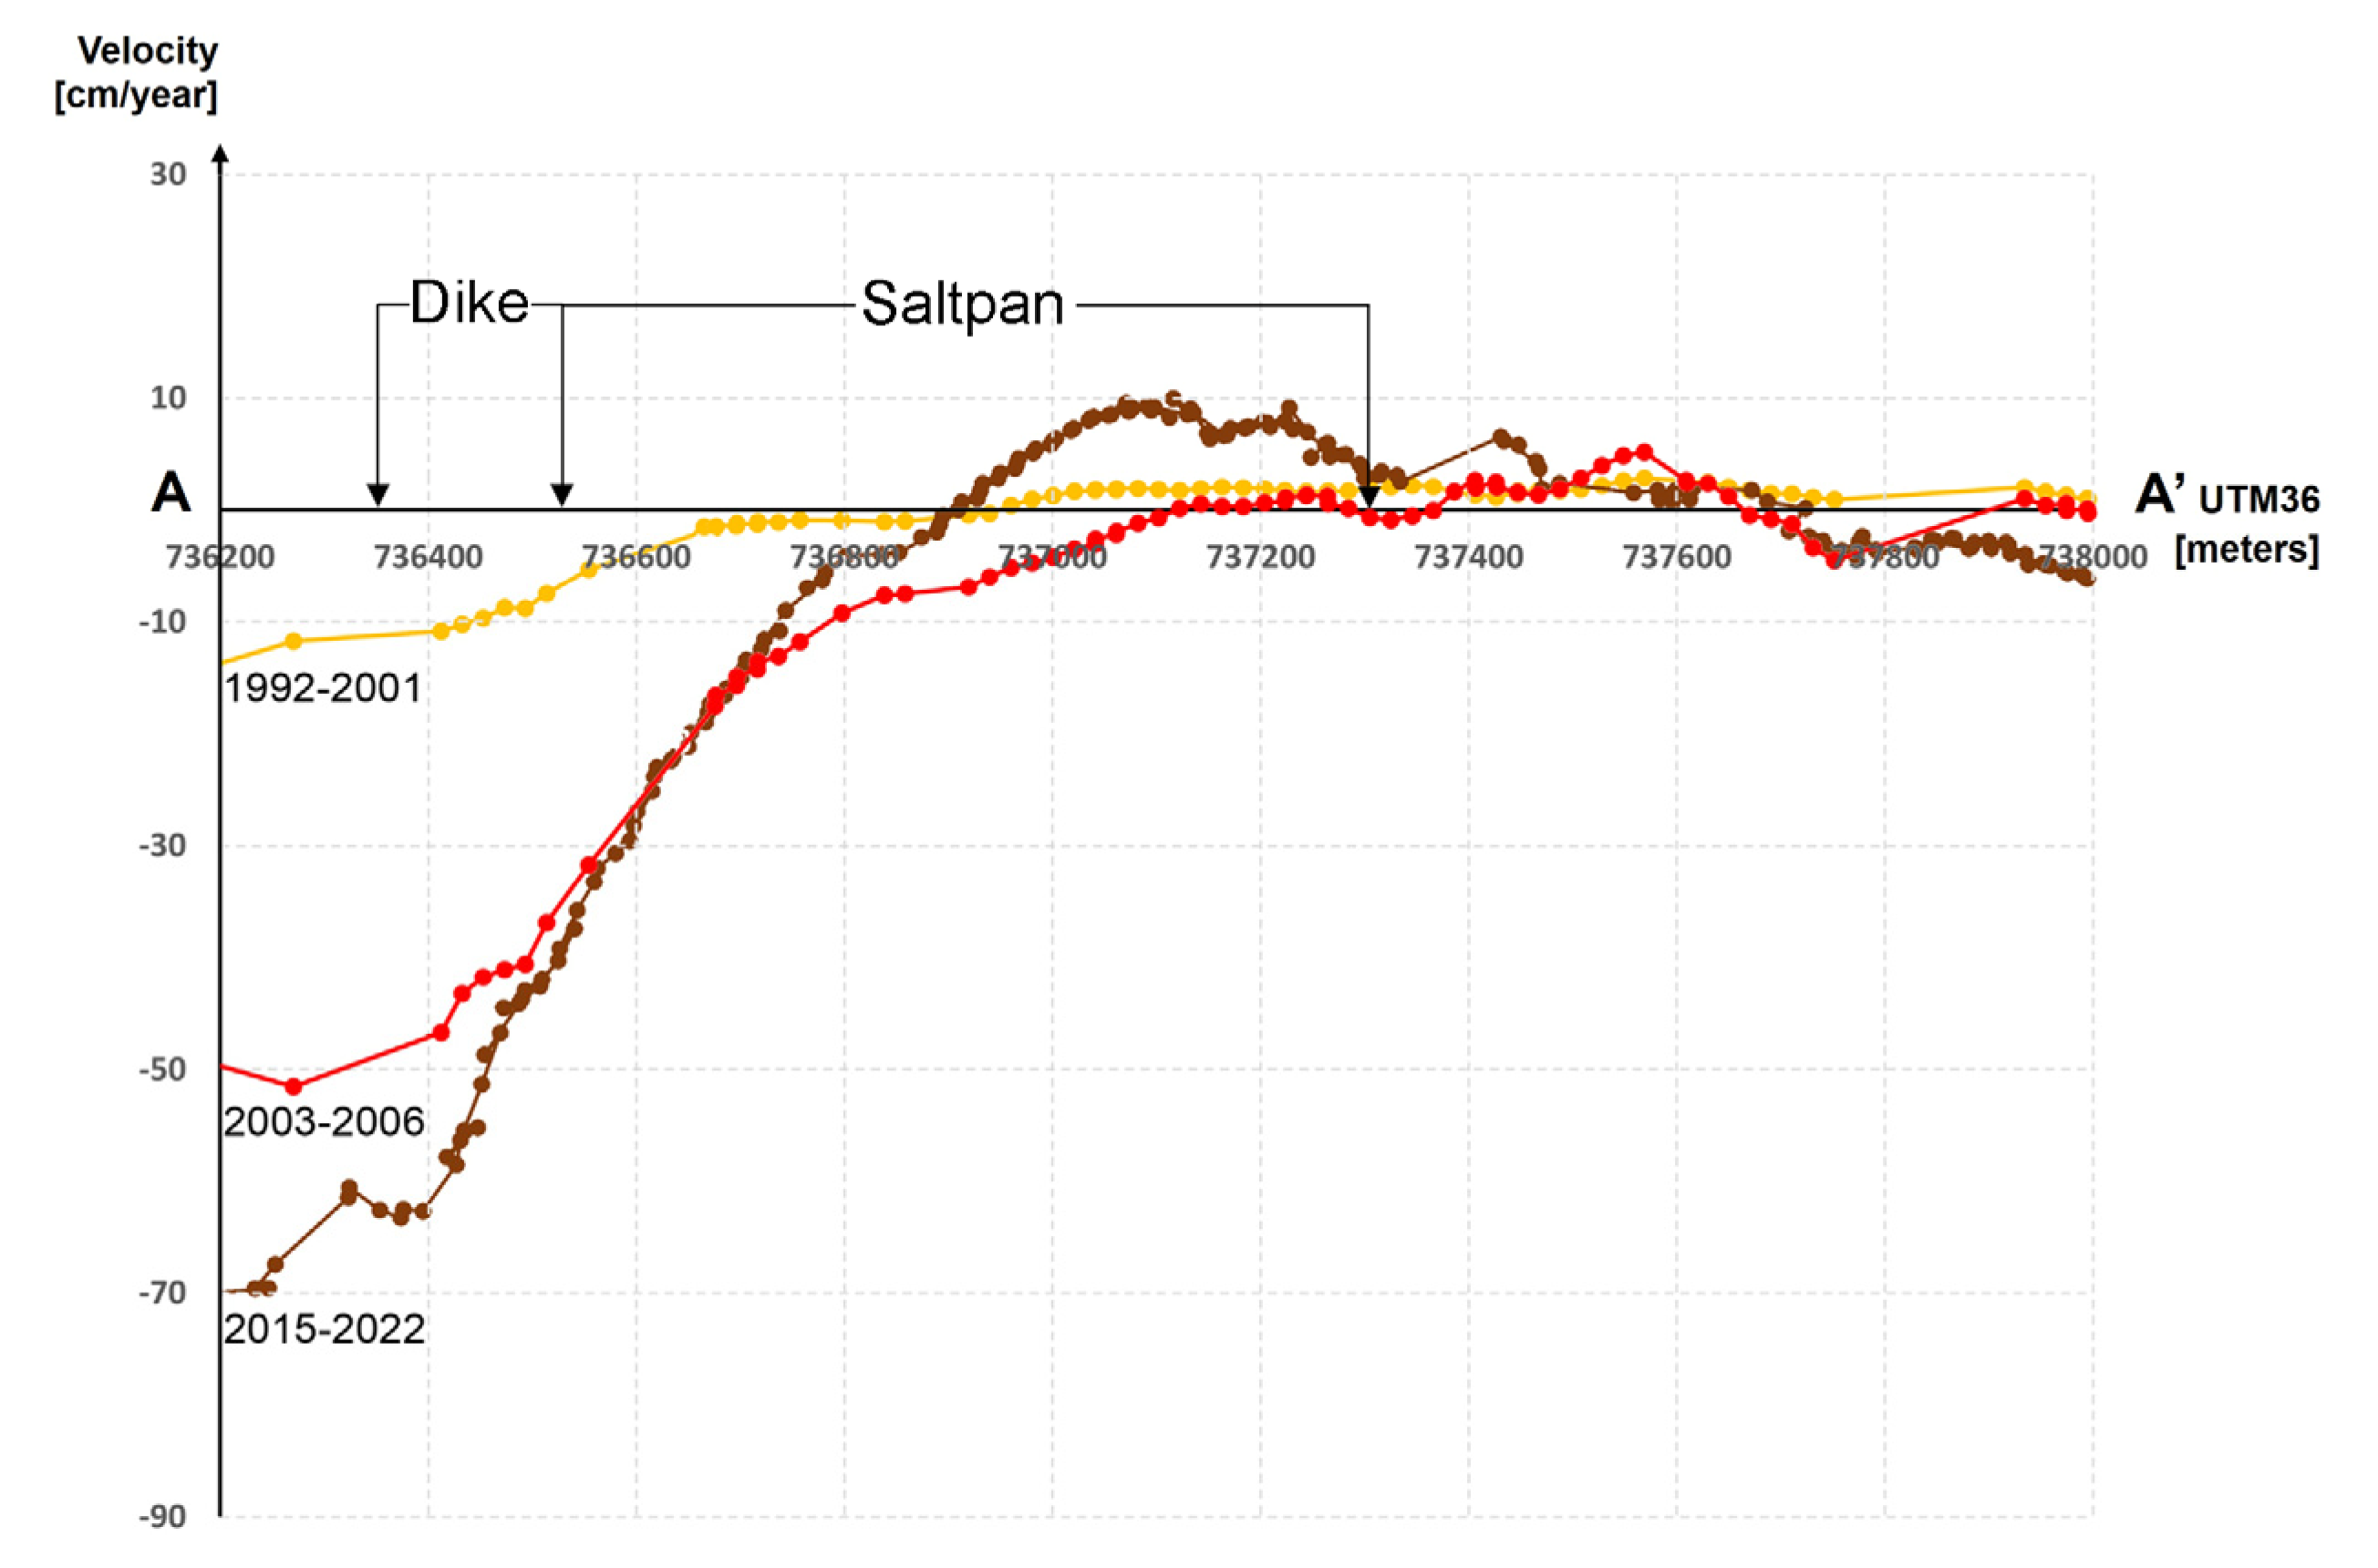
Figure 9A is a Sentinel-2 image acquired on 12 September 2022. The black lines define the new 300-m-wide dike 19 as well as the perimeter of the new SP-0B evaporation pond. A dotted transect line is also visible. Velocity transects are shown in Figure 10. Figure 9B–D gather velocity information along the line of sight expressed in cm/year.
The choice to present the results along the line of sight is because we are dealing with two movements’ oriented perpendicular to each other. The rise of the salt diapir is an upward directed movement. The creep of soft clays towards the Dead Sea shore is, in turn, a horizontal movement. Field measurements carried out in the area of the brine intake station attest this fact [25]. Consequently, we opted for an intermediate choice, which is that of the movements projected according to the direction of radar illumination.
All figures display the same solid black lines as in Figure 9A. To compare the three datasets, we used the same interval of values in the legend, i.e., 10 cm/year. It is based on the minimum—maximum observed in the three data series. However, there is such a difference between the observed rates, mainly for subsidence, in that this interval does not allow to distinguish the subtle changes in the 1990s deformation field.

3.3.1. Subsidence

We have seen previously that the platform bordering the Lisan peninsula and on which APC decided to build the evaporation ponds is characterized by sub-horizontal sedimentary layers of variable composition and thickness. Two layers stand out in particular: a layer of soft clay and a layer of hard salt. Each of these layers contributes in its own way to the destabilization of dike 19. The hard salt layer has been credited as the origin of the Dead Sea sinkholes by several research teams. The cavities appear preferentially where fractures allow water to circulate and carry away the sediments.
The soft clay layer, as we have seen, is constantly creeping due to its natural plasticity. Where it encounters water, it liquefies further and allows a faster movement preferentially towards the Dead Sea since the soft clay is topping the impermeable hard salt layer.
Borehole data indicate that the thickness of the soft clay layer is variable. In the northern part it is more important (up to 60 m). Considering the presence of groundwaters and fractures, such a thickness might not be a coincidence. However, there is no model available to date to relate soft clay thickness, tectonics, and groundwater fluxes.
Interferometric data indicate that large subsiding zones co-occur where soft clay is thicker and where groundwater is present.
The northern part of the platform is unique throughout the entire Dead Sea region. The subsidence velocities recorded are by far the highest. We believe that this fact is related to the thickness of the soft clay layer and of groundwaters circulating along fractures.
Furthermore, the geomorphological map shows that numerous fractures, collapses, and landslides have affected the abandoned dikes 19 and 20. Based on our field records, the intensity increased dramatically during the 2000s. We think that this fact could be the consequence of the progressive emergence of the soft clay layer (from −414 m to −422 m).
An element in support of this idea is given by the comparison between the deformation fields before—during—and after the 2000s. The subsidence rates increased from the 1990s to the 2000s, and then a stabilization of the subsidence speed is observed during the 2010s.

3.3.2. Uplift

Salt domes form because the salt is less dense than the overlying rock. Salt moves upward due to its buoyancy. As the salt diapir begins to rise in the parent salt layer, it distorts the overlying beds into a dome shape. In the case of the Lisan, research has suggested that the initiation process was due to tectonic activity in the Dead Sea basin. The dome appears clearly thanks to a network of radial canyons. The central point (Figure 2, see annotation “Lisan”) gives the maximum uplift.
The dynamics of diapir uplift has never been the subject of field studies based on the establishment of a geodetic network. For this reason, satellite radar interferometry can provide relevant data based on images archived over the past 30 years.
Velocity data reveal that, during the 1990s (Figure 9B), the northern part of the Lisan Peninsula was characterized by uplift which also affected a significant part of the platform that emerged during the previous two decades. The detailed analysis of the data made it possible to locate a few places with uplift speeds a little higher than the average. The gradient decreased towards the coast and then reversed (subsidence) where soft clays predominated.
During the 2000s (Figure 9C), the uprising continued at equivalent rates. The maximum values observed in small groups give rise to larger ranges. This reflects a diffusion in the uplift phenomenon.
During the 2010s (Figure 9D), the observation is the same as before. Previously extreme values became the norm. The uplift/subsidence transition zone becomes narrower, which reflects a diffusion of the uplift phenomenon to the entire northern part of the peninsula.

3.3.3. Deformation Maps

It is important to point out that the area towards the Dead Sea is generally under sampled with C-band sensors (ERS, Envisat, Sentinel-1). This fact can be explained in two ways. First, surface soil moisture increases with proximity to the coastline. At the same time, the intense heat evaporates the superficial water and crystallizes the salt that soaks the sediments. Therefore, the interferometric coherence is decreasing due to both the change in roughness from time to time and the variations of moisture.
The second phenomenon is related to the fact that ground movements detection can only be done within a range of changes (or velocity) detectable by a C-band system. It is known that movements too fast to be detected in C-band can be visualized in L-band because the wavelength is longer [9]. Hence, C-band observations only exist in regions where the velocity field is compatible with the sensitivity of that sensor type. In other words, higher subsidence rates could exist but are not detected (coherence loss). To fully map areas with very strong subsidence, it is necessary to work with L-band antennas.
Figure 9B represents the ground deformations computed from ERS images between 1992–2000, i.e., just before the first filling of SP-0B basin and dike 19 destruction. The velocity classes show two distinct juxtaposed entities: a vast uplifting zone (orange) corresponding to the rise of the Lisan salt dome; and a zone in subsidence (cyan–blue) interpreted, here as elsewhere around of the Dead Sea, as the result of recently emerged sediments settling. A transition zone appears in yellow color.
Figure 9C shows the velocity fields computed from Envisat images from 3 to 6 years after the event of 22 March 2000. During that period, the soft clay layer was partially emerged and was creeping at various paces depending on the water content. The destroyed area co-occurred with the zone of maximum subsidence. With respect to the 1990s, the subsidence rates increased. The uplifted zone is also wider, spreading toward the Dead Sea.
During the 2000s, the region that will be occupied by the rehabilitated salt pan was essentially rising. However, the area of the future 300 m width dike 19 displayed a strong subsidence. At that time, SP-0B basin had been abandoned and the remaining dike segments were fractured without the breaches being repaired. The high number of cracks and landslides along dikes 19 and 20 attest to the intensity of the deformations recorded by Envisat (Figure 4 and Figure 7). It is interesting to note that the subsidence acceleration is also contemporary to the drastic increase of sinkholes observed in many places all around the Dead Sea coast (see e.g., [19]).
Figure 9D indicates that velocity rates still increased from 2015 to 2022. Both subsidence and uplift movements are stronger than during the previous decade. Salt pan SP-0B is essentially affected by the uplift movements. At its seawards periphery, a strong gradient of velocity occurs, leading to subsidence. Stronger values are observed outside the salt pan.
Figure 10 is an illustration that makes visible the average yearly change (up and down) across the Northern Lisan peninsula illustrating the acting forces. Figure 10 is compatible and in line with the geodetic measurements made by [9] from 1992 to 2016. It shows the accelerations in subsidence and rise processes.

4. Discussion

In the last 20 years, various remote sensing techniques have been applied in Dead Sea geohazards research (from sensors onboard kites to satellites, and from optical-Infrared to radar wavelengths). Spatial resolution has been recognized as a key element in the field of subsidence (cracks detection) and sinkhole identification. Commercial very high-resolution satellite imagery has shown a high potential in mapping smaller features affecting salt pans and dikes. In contrast, medium resolution images, such as Landsat, Sentinel-1, and Sentinel-2, but also not anymore operational vectors, e.g., ERS and Envisat, are more dedicated either for rapid mappings or applications concerning large areas, such as subsidence and uplift.
Practically, the dimension of the smallest detectable feature in a raster image is twice the size of the sensor resolution that was used to identify the feature. ESA’s Copernicus program provides free optical medium-resolution imagery. The resolution is too coarse to resolve plurimetric collapse features. Consequently, an integrated study gathering repeated field observations (surface and subsurface as well) is mandatory to interpret the medium-resolution satellite images while it is less necessary for VHR imagery.
We have seen from the geomorphological map and field surveys the following elements to be taken into consideration when discussing the stability of the rehabilitated dike 19:
  • A large (but precisely unknown) volume of water that is undersaturated with salt is drained towards the Lisan peninsula. The adduction network is also unknown. The water probably arrives from the adjacent Mazra’a–Ghor Al Haditha region through a network of major faults oriented globally N-S and related to the strike-slip tectonics of the Dead Sea basin. From investigations in Ghor Al Haditha [16,17], another possibility would be a water transfer from a 3D karst system developed along groundwater flows. The latest being not necessarily related to the tectonic setting.
  • The presence of relatively fresh water is attested by the permanence of Tamarix vegetation on the Lisan plateau. With the abandonment of SP-0B after March 2000, Tamarix bushes developed in a specific place next to CH 7 + 200. They were photographed for the very first time in 2005 (Figure 7B). From that observation, we can deduce that the water stored in the peninsula is moving along a North-South axis below the wave-cut platform to pour out into the Dead Sea.
  • During a field visit in April–May 2005, a perennial stream was observed in the destroyed area of dike 19. From 2007 onwards, it dried up.
  • Along the eastern side of the peninsula, sinkholes and underwater springs were observed in the shallow waters from open source (Google Earth historical imagery) very high-resolution satellite imagery.
  • In the extraction zone (used to build new dike 19) located in the north of the peninsula, the deepest depressions reached the water table and semi-permanent ponds appeared on satellite images (Bing map and Google Earth historical imagery).
  • The unsaturated water is at the origin of the development of cave networks. The size of this network is unknown but five major entrances were inspected during fieldworks. All studied caves developed along N-S oriented fractures.
  • Among the sub horizontal Lisan deposit layers covering the salt diapir, the APC engineers recognized two overlaid layers with particular properties: on top, a layer of soft clay; below, a layer of consolidated salt. The mechanical properties of the soft clay (marls) layer are responsible for many stability problems for SP-0A and SP-0B. The hard salt layer has a thickness of about 10 m. It has been found in many places around the Dead Sea [19]. Therefore, this salt layer is believed to be responsible for thousands of sinkholes. It can be fragmented by faults through which unsaturated water with respect to salt circulates under pressure. This characteristic also appeared in the tender documents.
  • Ground deformation data come from radar satellite images. Three independent data sets were used: ERS, Envisat, and Sentinel-1. Data refer to the 1990s; 2000s; and 2010s.
  • The strain fields are relatively similar in terms of spatial extent. Two very contrasting zones appear juxtaposed: a vast zone in uplift concerns the old part of the peninsula and a significant part of the wave-cut platform. The second zone is, on the contrary, a zone in strong subsidence. The highest values co-occur with a 60 m thick, soft to very soft, highly compressible, and relatively impervious laminated silty clays.
  • There is an intermediate transition zone. The size of this zone is, however, reduced compared to the other two zones. In other words, we observe a high gradient of ground displacements.
  • The fractures and landslides that developed after March 2000 on the remaining dike segments of SP-0B result from the tensions between the two aforementioned zones.
  • The permanence of the subsidence/uplift pattern over three decades suggests that the Lisan diapir is an active structure. The increase in the velocity values is obvious. However, it is not clear whether the movements are caused by the rise of the diapir only. Given the observations performed along the coasts of the Dead Sea, it is likely that what is observed north of the Lisan Peninsula is a combination of movements related to the uplift of the salt diapir and of the lowering of the Dead Sea level. The proximity of the two phenomena applied to the 60 m thick very soft silty clays would explain why this part of the Dead Sea coast displays the highest subsidence rates.
The viability of salt pan SP-0B rehabilitation works is a delicate issue. It is obvious that the new dike 19 will be exposed to even greater stresses than was the first dike 19. Three elements act in favor of viability:
  • For more than 20 years, the safety engineers have experienced dike stability challenges over the Lisan peninsula. Arab Potash invested a lot to preserve SP-0A from the fate of SP-0B. The “strategy” of widening the dike to increase the safety coefficient is debatable. Indeed, the experience with SP-0A has shown the limits of this approach. Since early 2015, SP-0A salt pan has been amputated from its southern part due to the development of a major karstic network during the last 30 years [28].
  • The greatest subsidence values are located along the shore of the Dead Sea. However, as the coastline moves further and further away from the new dike 19, it is likely that the tensions created by the subsidence will be more and more reduced.
  • The link between the uplift of the salt diapir and the adjacent subsidence is not obvious. Mechanically, the uplift in one place implies a lowering by compensation at the periphery of the uplifted zone. In short, the subsidence rates observed along the northern coast of the Lisan results both from the compaction of the sediment and from the movement compensating for the uplift of the salt diapir.
  • On the other hand, it is not easy to demonstrate that the lowering of the level of the Dead Sea would have an impact on the dynamics of the diapir uplift. Again, mechanically speaking, we can understand that the fact of removing a water layer of ~40 m during the last fifty years leads to a decompression movement that could favor locally uplift movements.
  • The instrumentation of the new dike 19 with a considerable number of sensors should allow the engineers to detect in time the subsidence linked to the unavoidable development of karstic networks. The sustainability of APC investments also depends on the responsiveness of the surveillance teams and the means at their disposal to backfill the collapsed areas.
There are also elements raising questions regarding dike 19 safety. A major unknown in the halo karst system is that the 10-m-thick layer of salt topped by soft clays is now above the Dead Sea level. How will these problematic deposits for ground stability behave in the years to come? Are there similar layers in the underground that will cause the same problems? These important questions currently have no answer.
Another major unknown linked to the previous one concerns the consequences of SP-0B filling. Indeed, SP-0B bottom is permeable. Many cracks exist. Geophysicists have studied some of them in the past [29]. These fractures will drain a part of the pumped water to the depths. However, as we have seen, the 10-m layer of salt topped by Lisan marls is above the Dead Sea level (−437 m MSL). Consequently, these layers will be exposed both to the pressure of the water mass in SP-0B and to the water flux coming from the percolation. Logically, the marls should partially liquefy and thus expose the salt layer to mechanical erosion. Additionally, any strong (although rare) rain event or flash flood will lead to the dissolution of this now superficial halite layer, causing more problems for the dike foundations.
Finally, this salt layer is fractured in many places, especially where the gradient between subsidence and uplift is the greatest. Such exposure should lead to the appearance of a karstic network similar to that which caused the destruction of the southern part of the SP-0A basin [27,28].

5. Conclusions

The rehabilitation project was designed immediately after the disaster of 22 March 2000. This expansion need is based on the ever-increasing market demand for fertilizers.
Since its establishment in 1982, APC has always operated according to the logic of an expansion scheme. It was only in 2013 that environmental constraints were clearly mentioned as a possible brake on its economic growth policy. Therefore, we can clearly see that the designers of the new dike 19 are well aware that the survival of salt pan SP-0B will not be easy. The width of the dike is the materialization of this fear.
By comparison with the configuration of salt pan SP-0A, we understand that the engineers gave themselves the means to resist the karstic constraints. That is why we think the project is likely to last for several years (a minimum of two years is necessary to generate benefits from the pumped Dead Sea brine evaporating in salt pans). It is also clear that when major cracks appear in the 300m-width dike, security officials will not hesitate to increase this width even further.
With regard to the subsidence and uplift, it seems likely that both will increase following the rate of the Dead Sea level lowering. The dynamics of the salt diapir are less clear because it relies on a data set regarding the salt dome that does not exist.
In this work, we confirm that the advanced techniques of radar interferometry applied to the radar images of the Copernicus program cover most of the APC needs related to environmental monitoring.
APC’s industrial site is 35-km-long and 10-km-wide. The entire area is a salt karst with a lowering base level. Therefore, this young and dynamic karst is rapidly changing. The hundreds of sinkholes appearing each year and threatening the stability of earthen dikes are proof of this. The Copernicus satellites constellation can adequately address the monitoring of karstic phenomena discernible at a spatial resolution of about 10 m, the precise location of affected areas, as well as the assessment of the threat by the mean of subsidence/uplift rates. The swath of the radar images as well as the resolution are compatible with the fundamental safety needs. Copernicus optical and SAR images are able to support the work of the analysts to provide credible warnings to engineers in charge of safety.
As an illustration, prior to the Copernicus era, such an alert was provided in December 2012. This concerned the development of a sinkhole with a diameter of 300 m [27]. After numerous investigations and technical discussions, it appeared that two kilometers of dike in SP-0A basin were exposed to collapse. Two years later, this part of the salt pan was amputated. Nowadays, the dry part shows flow channels as well as sinkholes. This part of the dike was reinforced over time to reach approximately 300 m in width. However, it was nevertheless abandoned. It is probably this extreme case on which the 300 m width of the new dike 19 is based.
Given the observations made over the past thirty years in the northern part of the Lisan, it seems that this area is even more dangerous and more difficult for Arab Potash’s infrastructure. We believe that the challenge will really begin when filling the pond. Bottom impermeability defects will probably be the key to the fate of SP-0B. If groundwater flows enlarge pre-existing discontinuities (and we believe there are many) because of mechanical erosion, then engineers will face a problem equivalent to that of the southern part of SP-0A.

Author Contributions

Conceptualization, D.C. and A.P.; methodology, D.C. and A.P.; software, N.D. and A.P.; validation, D.C.; formal analysis, D.C. and A.P.; investigation, D.C.; resources, D.C.; data curation, D.C.; writing—original draft preparation, D.C.; writing—review and editing, A.P., M.M. and M.G.; visualization, D.C. and A.P.; supervision, A.P. and N.D.; project administration, D.C.; funding acquisition, D.C. All authors have read and agreed to the published version of the manuscript.

Funding

This research received no external funding.

Data Availability Statement

ERS and Envisat archives are available at the European Space Agency. Sentinel-1 are downloadable at the official Copernicus website. Landsat, Sentinel and Corona images are available, among others, at the United States Geological Survey (EarthExplorer platform).

Acknowledgments

We warmly thank the Geosciences team for their professionalism. We send a big thank you to the reviewers. Their relevant questions and advice have significantly improved this article. We also thank AIDASH for allowing us to write this article in the best conditions. We hope to have the opportunity in the future to collaborate again. L3Harris provided a demo-licence of Envi-Sarscape to perform the SBAS processing of the three stacks of radar images at Aidash R&D office.

Conflicts of Interest

The authors declare no conflict of interest.

References

  1. Closson, D.; Abou Karaki, N.; Hansen, H.; Derauw, D.; Barbier, C.; Ozer, A. Space-borne radar interferometric mapping of precursory deformations of a dyke collapse, Dead Sea area, Jordan. Int. J. Remote Sens. 2003, 24, 843–849. [Google Scholar] [CrossRef]
  2. Rogers, J.D. Innovative Solutions for Water Wars in Israel, Jordan and the Palestinian Authority. In Proceedings of the International Conference on Military Geology and Geography, United States Military Academy at West Point, New York, NY, USA, 15–18 June 2003; Available online: https://web.mst.edu/rogersda/umrcourses/ge342/Article-Innovative%20Solutions%20Water%20Wars%20with%20header.pdf (accessed on 25 January 2023).
  3. Closson, D.; Karaki, N.A. Dikes Stability Monitoring Versus Sinkholes and Subsidence, Dead Sea Region, Jordan. In Land Applications of Radar Remote Sensing; Holecz, F., Pasquali, P., Milisavljevic, N., Closson, D., Eds.; IntechOpen: London, UK, 2014; pp. 281–307. [Google Scholar]
  4. Masannat, Y.M. Stability of Natural Slopes and Embankments Underlain by Weak Clays. In Proceedings of the Sixth Jordanian International Civil Engineering Conference (JICEC06), Session 1B Geotechnical, Amman, Jordan, 10 March 2015. [Google Scholar]
  5. Arab Potash Company. Annual Report 2013. Available online: www.arabpotash.com/ebv4.0/root_storage/en/eb_list_page/annual_report_2013.pdf (accessed on 20 September 2022).
  6. Jordan to Prequalify Firms for Dykes Project. Available online: www.meed.com/jordan-to-prequalify-firms-for-dykes-project/ (accessed on 20 September 2022).
  7. Interim Condensed Consolidated Financial Statement. Available online: www.arabpotash.com/ebv4.0/root_storage/en/eb_list_page/first_quarter_2022.pdf (accessed on 20 September 2022).
  8. Fiaschi, S. Differential radar Interferometry Applied to the Detection and monitoring of Geological Hazards. Corso Di Dottorato Di Ricerca. In Scienze Della Terra; Universita Degli Studi: Di Padova, Italy, 2017. [Google Scholar]
  9. Fiaschi, S.; Closson, D.; Abou Karaki, N.; Pasquali, P.; Riccardi, P.; Floris, M. The complex karst dynamics of the Lisan Peninsula revealed by 25 years of DInSAR observations. Dead Sea, Jordan. ISPRS J. Photogramm. Remote Sens. 2017, 130, 358–369. [Google Scholar] [CrossRef]
  10. The Level of the Dead Sea from 1976. Available online: data.gov.il/dataset/https-www-data-gov-il-dataset-683/resource/823479b4-4771-43d8-9189-6a2a1dcaaf10 (accessed on 7 July 2022).
  11. Abu Ghazleh, S. Lake Lisan and the Dead Sea: Their Level Changes and the Geomorphology of their Terraces. In Dissertation zur Erlangungen des Gerades eines Doktors der Naturwissenschaften; Technische Universität Darmstadt: Darmstadt, Germany, 2011. [Google Scholar]
  12. Western Atlas. Seismic Interpretation and Seismic Modelling of the El-Lisan Peninsula, Dead Sea; Report Prepared for Natural Resources Authority of Jordan; Western Atlas: Houston, TX, USA, 1994; p. 133. [Google Scholar]
  13. Matmon, A.; Fink, D.; Davis, M.; Niedermann, S.; Rood, D.; Frumkin, A. Unraveling rift margin evolution and escarpment development ages along the Dead Sea fault using cosmogenic burial ages. Quat. Res. 2014, 82, 281–295. [Google Scholar] [CrossRef] [Green Version]
  14. Sunna, B.F. The geology of salt deposits in the Lisan peninsula—Dead Sea. In Proceedings of the Seminar on Salt in the Arab World, Ministry of Energy and Mineral Resources, Natural Resources Authorities, Amman, Jordan, 4–6 May 1986. [Google Scholar]
  15. Abou Karaki, N. Synthèse et carte sismotectonique des pays de la bordure orientale de la Méditerranée: Sismicité du système de failles du Jourdain-Mer Morte. PhD Thesis—Sciences Géophysique, Université Louis Pasteur de Strasbourg, Institut de Physique du Globe, Laboratoire de Sismologie, Strasbourg, France, 12 June 1987. [Google Scholar]
  16. Al-halbouni, D.; Watson, R.A.; Holohan, E.P.; Meyer, R.; Polom, U.; Dos Santos, F.M.; Comas, X.; Alrshdan, H.; Krawczyk, C.M.; Dahm, T. Dynamics of hydrological and geomorphological processes in evaporite karst at the eastern Dead Sea—A multidisciplinary study. Hydrol. Earth Syst. Sci. 2021, 25–26, 3351–3395. [Google Scholar] [CrossRef]
  17. Vey, S.; Al-Halbouni, D.; Haghighi, M.H.; Alshawaf, F.; Vüllers, J.; Güntner, A.; Dick, G.; Ramatschi, M.; Teatini, P.; Wickert, J.; et al. Delayed subsidence of the Dead Sea shore due to hydro-meteorological changes. Sci. Rep. 2021, 11, 13518. [Google Scholar] [CrossRef]
  18. Ezersky, M.; Eppelbaum, L.; Legchenko, A.; Al-Zoubi, A.; Abueladas, A. Salt layer characteristics in the Ghor Al-Haditha area, Jordan: Comprehensive combined reprocessing of geophysical data. Environ. Earth Sci. 2021, 80–84, 124. [Google Scholar] [CrossRef]
  19. Abelson, M.; Yechieli, Y.; Baer, G.; Lapid, G.; Behar, N.; Calvo, R.; Rosensaft, M. Natural versus human control on subsurface salt dissolution and development of thousands of sinkholes along the Dead Sea coast. J. Geophys. Res. Earth Surf. 2017, 122, 1262–1277. [Google Scholar] [CrossRef]
  20. Arkin, Y.; Gilat, A. Dead Sea sinkholes—An ever-developing hazard. Environ. Geol. 2000, 39, 711–722. [Google Scholar] [CrossRef]
  21. Yizhaq, H.; Ish-Shalom, C.; Raz, E.; Ashkenazy, Y. Scale-free distribution of Dead Sea sinkholes: Observations and modeling. Geophys. Res. Lett. 2017, 44, 4944–4952. [Google Scholar] [CrossRef] [Green Version]
  22. Lanari, R.; Casu, F.; Manzo, M.; Zeni, G.; Berardino, P.; Manunta, M.; Pepe, A. An Overview of the Small BAseline Subset Algorithm: A DInSAR Technique for Surface Deformation Analysis. Pure Appl. Geophys. 2007, 164, 637–661. [Google Scholar] [CrossRef]
  23. Galve, J.; Pérez-Peña, J.; Azañón, J.; Closson, D.; Caló, F.; Reyes-Carmona, C.; Jabaloy, A.; Notti, D. Evaluation of the SBAS InSAR service of the European space agency’s geohazard exploitation platform (GEP). Remote Sens. 2017, 9, 1291. [Google Scholar] [CrossRef] [Green Version]
  24. Woods Ballard, T.J.; Brice, G.J. Arab Potash Solar Evaporation system: Design. Proc. Inst. Civ. Eng. 1984, 76, 145–163. [Google Scholar] [CrossRef]
  25. El-Mossallamy, Y.; Ghalayini, I.; Demerdash, M.; Hammad, W. Design Considerations for Offshore Structures in the Dead Sea. In Proceedings of the 17th International Conference on Soil Mechanics and Geotechnical Engineering, Bibliotheca Alexandrina, Alexandria, Egypt, 5–9 October 2009. [Google Scholar]
  26. The Rehabilitation and Reinstatement Works of Dike 19. Available online: www.gecomjo.com (accessed on 25 January 2023).
  27. Closson, D.; Abou Karaki, N.; Pasquali, P.; Riccardi, P. A 300m-width sinkhole threatens the stability of the embankment of a saltpan in Jordan, Dead Sea Region. In Proceedings of the A 300m-Width Sinkhole Threatens the Stability of the Embankment of a Saltpan in Jordan, Dead Sea Region, EGU General Assembly 2013, Vienna, Austria, 7–12 April 2013. [Google Scholar]
  28. Closson, D.; Abou Karaki, N. Earthen Dike Leakage at the Dead Sea. In Engineering Geology for Society and Territory; Lollino, G., Manconi, A., Guzzetti, F., Culshaw, M., Bobrowsky, P., Luino, F., Eds.; Springer: Berlin, Germany, 2015; Volume 5, pp. 461–464. [Google Scholar]
  29. Al-Taraza, E. Detecting Earth Cracks Utilizing Seismic Refraction Technique in the Lisan Peninsula, Dead Sea, Jordan. Abhath Al-Yarmouk Basic Sci. Eng. 2004, 13, 147–160. [Google Scholar]
Figure 1. Landsat-5 images Path 187 Raw 38. Location: Lisan peninsula, Jordan. (Left) 10 March 2000. Salt pan SP-0B of the Arab Potash Company. On 22 March 2000, during the filling process, a 2.6 km section of the dike collapsed. In 30 min, 56 M m3 of brine eroded 15 M m3 of dike and foundation material. (Right) 26 March 2000. SP-0B 4 days after the collapse of dike 19. Projection UTM 36N, WGS84.
Geosciences 13 00042 g001
Figure 2. Jordanian Dead Sea landscape in August 2022. The terminal lake (blue; 437 m bMSL) is the discharge zone of the halo-karst system (brown) developed due to the recession of the Dead Sea. The brown muddy area (Sentinel-2 image) corresponds to the halo-karst in development. It is bounded by 437 m bMSL and 390 m bMSL (lake level in the 1930s) contour lines. Most emerged terrains are located in the southern Dead Sea, around the Lisan peninsula. Sinkholes, subsidence, and landslides are found in the widest parts, from North to south. SP-0A and SP-0B are two salt evaporation ponds built in the 1990s west and north of the Lisan peninsula. The yellow area with streams networks corresponds to the recharge zone. The Dead Sea is divided from North to South by the border with Israel and Palestine. Projection UTM 36N, WGS84.
Geosciences 13 00042 g002
Figure 3. Time-position plot for the dataset of 41 Sentinel-1 SLC images collected from 2015 to 2022. The Super master image is the yellow dot and is located in the middle of the time series.
Geosciences 13 00042 g003
Figure 4. Geomorphological sketch map of the northern Lisan peninsula and schematic cross section based on borehole data (1977, lower left corner). In 2013, the soft clay layer (part of the Lisan marls) was already apparent in the landscape while the salt layer was still emerging. Background image is the Copernicus DEM—GLO-30.
Geosciences 13 00042 g004
Figure 5. Plurimetric solution cavities developed in the Lisan formation, Northern Lisan peninsula [UTM 36, x = 737.8 km y = 3470.8 km]. (A) northernmost couple of metric caves entrance (2 by 2 m); (B) two parallel metric solution cavities; (C) inside the main entrance (4 by 5 m); (D) [x = 737.6 km y = 3470.0 km] metric cavity developed along a fracture (about 3 m height).
Geosciences 13 00042 g005
Figure 6. Relationship between structural direction N10W given by a cave (A) [UTM 36, x = 737.8 km y = 3470.8 km] and (B) the probable initiation point (see CH 6 + 000—Figure 1) of the dike break that took place on 22 March 2000. For the experts chosen by APC to investigate the cause of the dike collapse [4]: (…) “The post construction investigation didn’t disclose any geological features or imperfections that could have caused the failure of the dike” (…) “failure couldn’t also be attributed to piping erosion in the foundation materials due to their cohesiveness and low permeability and the low hydraulic gradient, or due to piping through the body of the dike which was well compacted and provided with affective drainage control measures”. They concluded that “the partial collapse of the dike was found to be due to the inadequate bearing capacity of the foundation material which gained little strength during construction and due to the destabilizing effect of the impounded water behind the dike and within the upstream longitudinal cracks” [4]. However, during the last 20 years, basic geomorphological mapping such as karstic features interpretation (e.g., dozens of sinkholes developed in the dike) indicated that the structural setting had been imperfectly considered in the dike design project. The lack of consideration by designers for all geomorphological and karstic aspects in particular is the source of most of the geotechnical problems of the last 30 years. This mindset has evolved, especially since 2013 [5].
Geosciences 13 00042 g006
Figure 7. (A) Perennial stream (arrow) observed during a survey in April–May 2005 from the top of dike 19 at CH 6 + 900 [2]. (B) vegetation development along dike 19, next to CH 6 + 900; (C,D) dike failures perpendicular to the dike axis. During construction and impoundment, many longitudinal and transverse cracks had developed in the dike body. Cracking was expected due to the high strain incompatibility between the stiff embankment fill and the soft clay foundation. The development of these cracks was due to the excessive total and differential settlements along and across the body of the dike associated with substantial horizontal displacements at the base of the dike; (E) one of the dozen landslides affecting dike 20.
Geosciences 13 00042 g007
Figure 8. Rehabilitation and reinstatement of dike 19 [26].
Geosciences 13 00042 g008
Figure 9. (A) Rehabilitation and reinstatement works of dike 19 (March 2018–December 2021). Background image Sentinel-2 acquired 12 September 2022. Dotted line is a transect from the destroyed area to the former Lisan Peninsula corresponding to the uplifted zone of the Lisan salt diapir. (B) Velocity (cm/year) computed respectively from ERS dataset (1992–2001). Orange corresponds to uplift; blue—cyan colors are subsidence records; yellow is the transition zone between uplift and subsidence. (C) Velocity (cm/year) computed respectively from Envisat dataset (2003–2006). Red-orange corresponds to uplift; Blue-green is subsidence; yellow is the transition zone between uplift and subsidence. (D) Velocity (cm/year) computed respectively from Sentinel-1 datasets (2015–2022). Red-orange corresponds to uplift; Blue-green is subsidence; yellow is the transition zone between uplift and subsidence.
Geosciences 13 00042 g009aGeosciences 13 00042 g009bGeosciences 13 00042 g009c
Figure 10. Subsidence and uplift along a profile across Lisan (cm/y vs. position along the line A–A’) for the three time periods (1992–2001), (2003–2006), (2015–2022). The profile is oriented NW–SE (736000/3472000 to 738000/347000). It makes visible the average yearly change (down/up) across the Lisan illustrating the acting forces.
Geosciences 13 00042 g010
Disclaimer/Publisher’s Note: The statements, opinions and data contained in all publications are solely those of the individual author(s) and contributor(s) and not of MDPI and/or the editor(s). MDPI and/or the editor(s) disclaim responsibility for any injury to people or property resulting from any ideas, methods, instructions or products referred to in the content.