1. Introduction
The Thermaikos Basin in Northern Greece represents one of the Peri-Alpine basins in the area of the North Aegean Sea, which was created during the post-Alpine period [
1,
2]. During the Middle Eocene, extensional tectonics took place in the area of the Aegean Sea [
1,
2], resulting in the development of several sedimentary basins across the northern parts, such as Thermaikos and Kassandra. The Sigitikos, Orphanos, and East Thasos Basins in the offshore area (
Figure 1a,b), as well as the Langadas, Strymon, and Drama Basins in the onshore area [
1,
2], developed during the Middle Miocene stage. The complex tectonic movements, because of the main active North Anatolia Fault [
1,
2], are reflected in the sedimentary fill of these basins. The stratigraphy of the Thermaikos and Kassandra areas comprises Middle Eocene deposits in the lower parts, transitioning to thick Oligocene–Miocene sediments and Pliocene–Pleistocene at the top.
The Thermaikos Basin is the largest basin of the aforementioned; 120 km × 60 km in size (
Figure 2). The Thermaikos Basin is part of the wider Axios molassic basin, which extends from North Macedonia territory down to the North Sporades Islands to the southeast. Other available studies [
1,
2] suggest the continuation of the Axios molassic basin further to the east, merging with the offshore continuation of the Evros molassic basin. Despite the Epanomi Gas Field commercial discovery with 19 MCF/D of gas and small quantities of light oil [
1,
2] and the knowledge gained from drilling and seismic reflection data of the 1980s–1990s, a detailed interpretation of the sedimentary fill of the Thermaikos Basin, in terms of depositional environments and facies associations (FAs), is missing. Moreover, the Public Petroleum Corporation studies [
3] have shown that Eocene–Oligocene deposits reveal gas-prone organic matter with good thermal maturity, and thus, the Miocene interval has sparked interest in terms of a reservoir property evaluation.
This study identifies the present FAs after a detailed core description, cuttings, and well log analysis. Specifically, eight (8) wells from the onshore area of Epanomi (EP-B1), the Kassandra Peninsula (KAS-1, KAS-3, and PO-1), and the offshore area of Thermaikos (OL-1, A1, C1, and NR-1), reaching depths >4000 m and penetrating the whole sedimentary sequence, were studied. By examining their reservoir properties and their lateral continuation, we have documented the most interesting FAs from a reservoir potential perspective, as well as those with good sealing properties. The proximity of the area to existing infrastructure, such as pipelines and refinery, and the metropolitan area of Thessaloniki, adds extra value to the results of this study.
2. Materials and Methods
For the sedimentological analysis of the Thermaikos Basin, a hierarchical approach to sedimentological description and interpretation was applied, with the core dataset initially being coded into purely descriptive reproducible bed-scale building blocks, termed lithotypes (LTs). Bed-set scale units, termed depositional packages (DPs), are purely descriptive. According to their vertical/lateral and genetic organization, these DPs can be grouped into interpretative bed-set to bed-set stack-scale FAs, with specific geometries and dimensions. Whereas LTs are only recognizable from the core, DPs and FAs can be recognized from both the core and wireline logs.
For the LT interpretation of cored wells, a series of twenty-two (22) sub-bed to bed-scale LTs were defined by a discrete set of geological features. LTs are mainly geological descriptors, and they are not diagnostic of specific depositional environments, but their characteristics and association with other LTs bear information on the depositional processes.
The LTs were grouped into larger, non-genetic, stacked, bed-set-scale DPs in order to enable wireline-based identification in the uncored interval. The scheme represented here consists of fifteen (15) major DPs, which provide descriptive information about their intervals. The application of the DP scheme to the uncored intervals is relatively simplified compared to the cored intervals, as it is not possible to recognize any specific geological features, such as sedimentary structures or the degree of bioturbation from wireline logs alone. Since DPs are non-genetic and can occur in a variety of different depositional environments, they do not give us any architectural information. The geometries can only be inferred through a genetically based classification of the DPs into FAs.
FAs consist of groups of LTs and DPs, which have geometrical implications and are directly linked to their depositional setting. As a result, the twenty (20) identified FAs are considered the key interpretative level for understanding the depositional architecture of the Thermaikos Basin analyzed in this study (
Figure 2).
The dataset included four (4) offshore wells: Olympia-1 (OL-1), Thermaikos C1 (C1), Thermaikos A1 (A1), and Nireas-1 (NR-1); four (4) onshore wells: Epanomi-B1, (EP-B1), Kassandra-1 (KAS-1), Kassandra-3 (KAS-3), and Possidi-1 (PO-1); and 3074.7 km of offshore and 1047.4 km of onshore seismic data [
4]. From the well data, 22 cores in total were described in detail (EP-1: 2 cores, KAS-1: 2 cores, KAS-3: 3 cores, KAS-4: 5 cores, PO-1: 6 cores, and NIR-1: 4 cores). In total, forty-six (46) samples were analyzed for their reservoir properties.
In addition to the log data, several seismic lines from the Thermaikos dataset (1980s) were carefully selected, and the log data were calibrated to the seismic data in order to obtain an accurate seismic interpretation [
4].
During the reservoir property assessment of the deposits from Thermaikos Basin, the porosity and grain density values of 233 samples were measured. These sandstone samples were collected from thick intervals in the available core dataset described above, and outcrop samples were from the Kassandra Peninsula (
Figure 2). For the core preparation, in order to eliminate the possible presence of contaminants (hydrocarbons, mud, water, etc.) all the samples were initially cleaned following the Soxhlet extraction procedure, using the apparatus. Cores were placed inside a thimble, located in the main chamber of the Soxhlet extractor. A solvent mixture (150 mL chloroform and 150 mL methanol) was used for sample washing. The cores were dried initially on a hot plate with a fume hood for 4 h and subsequently in a vacuum oven at 110 °C for 24 h.
The external (bulk) volumes of the core samples were obtained by calipering the samples with a precise cylindrical shape. The grain volume of the cores was calculated using a Boyle’s Law porosimeter. This method involves compressing a precisely determined quantity of helium gas (He) into the pores of the core sample, which have been previously evacuated. The working pressure of the He was 6 bar. The porosity (%) was calculated as the ratio of the void to the bulk volume of the core samples. The grain density was calculated as the ratio of the core weight (g) to the grain volume (cm3).
3. Lithotypes, Depositional Packages, and Facies Associations
In the examined cores, twenty-two (22) LTs were observed through detailed core descriptions (
Table 1). In case it was necessary, these LTs were grouped into nineteen (19) DPs (
Table 2), which, according to their vertical/lateral and genetic organization, were further grouped into twenty (20) FAs. A summary of the diagnostic features that were observed in the FAs is illustrated in
Table 3, while the FAs’ lateral distribution and their stratigraphic attribution are illustrated in
Table 4. The described cores, which support this interpretation, are illustrated in
Figures S3–S11.
3.1. Delta Facies Associations
3.1.1. Description of Delta Facies Associations
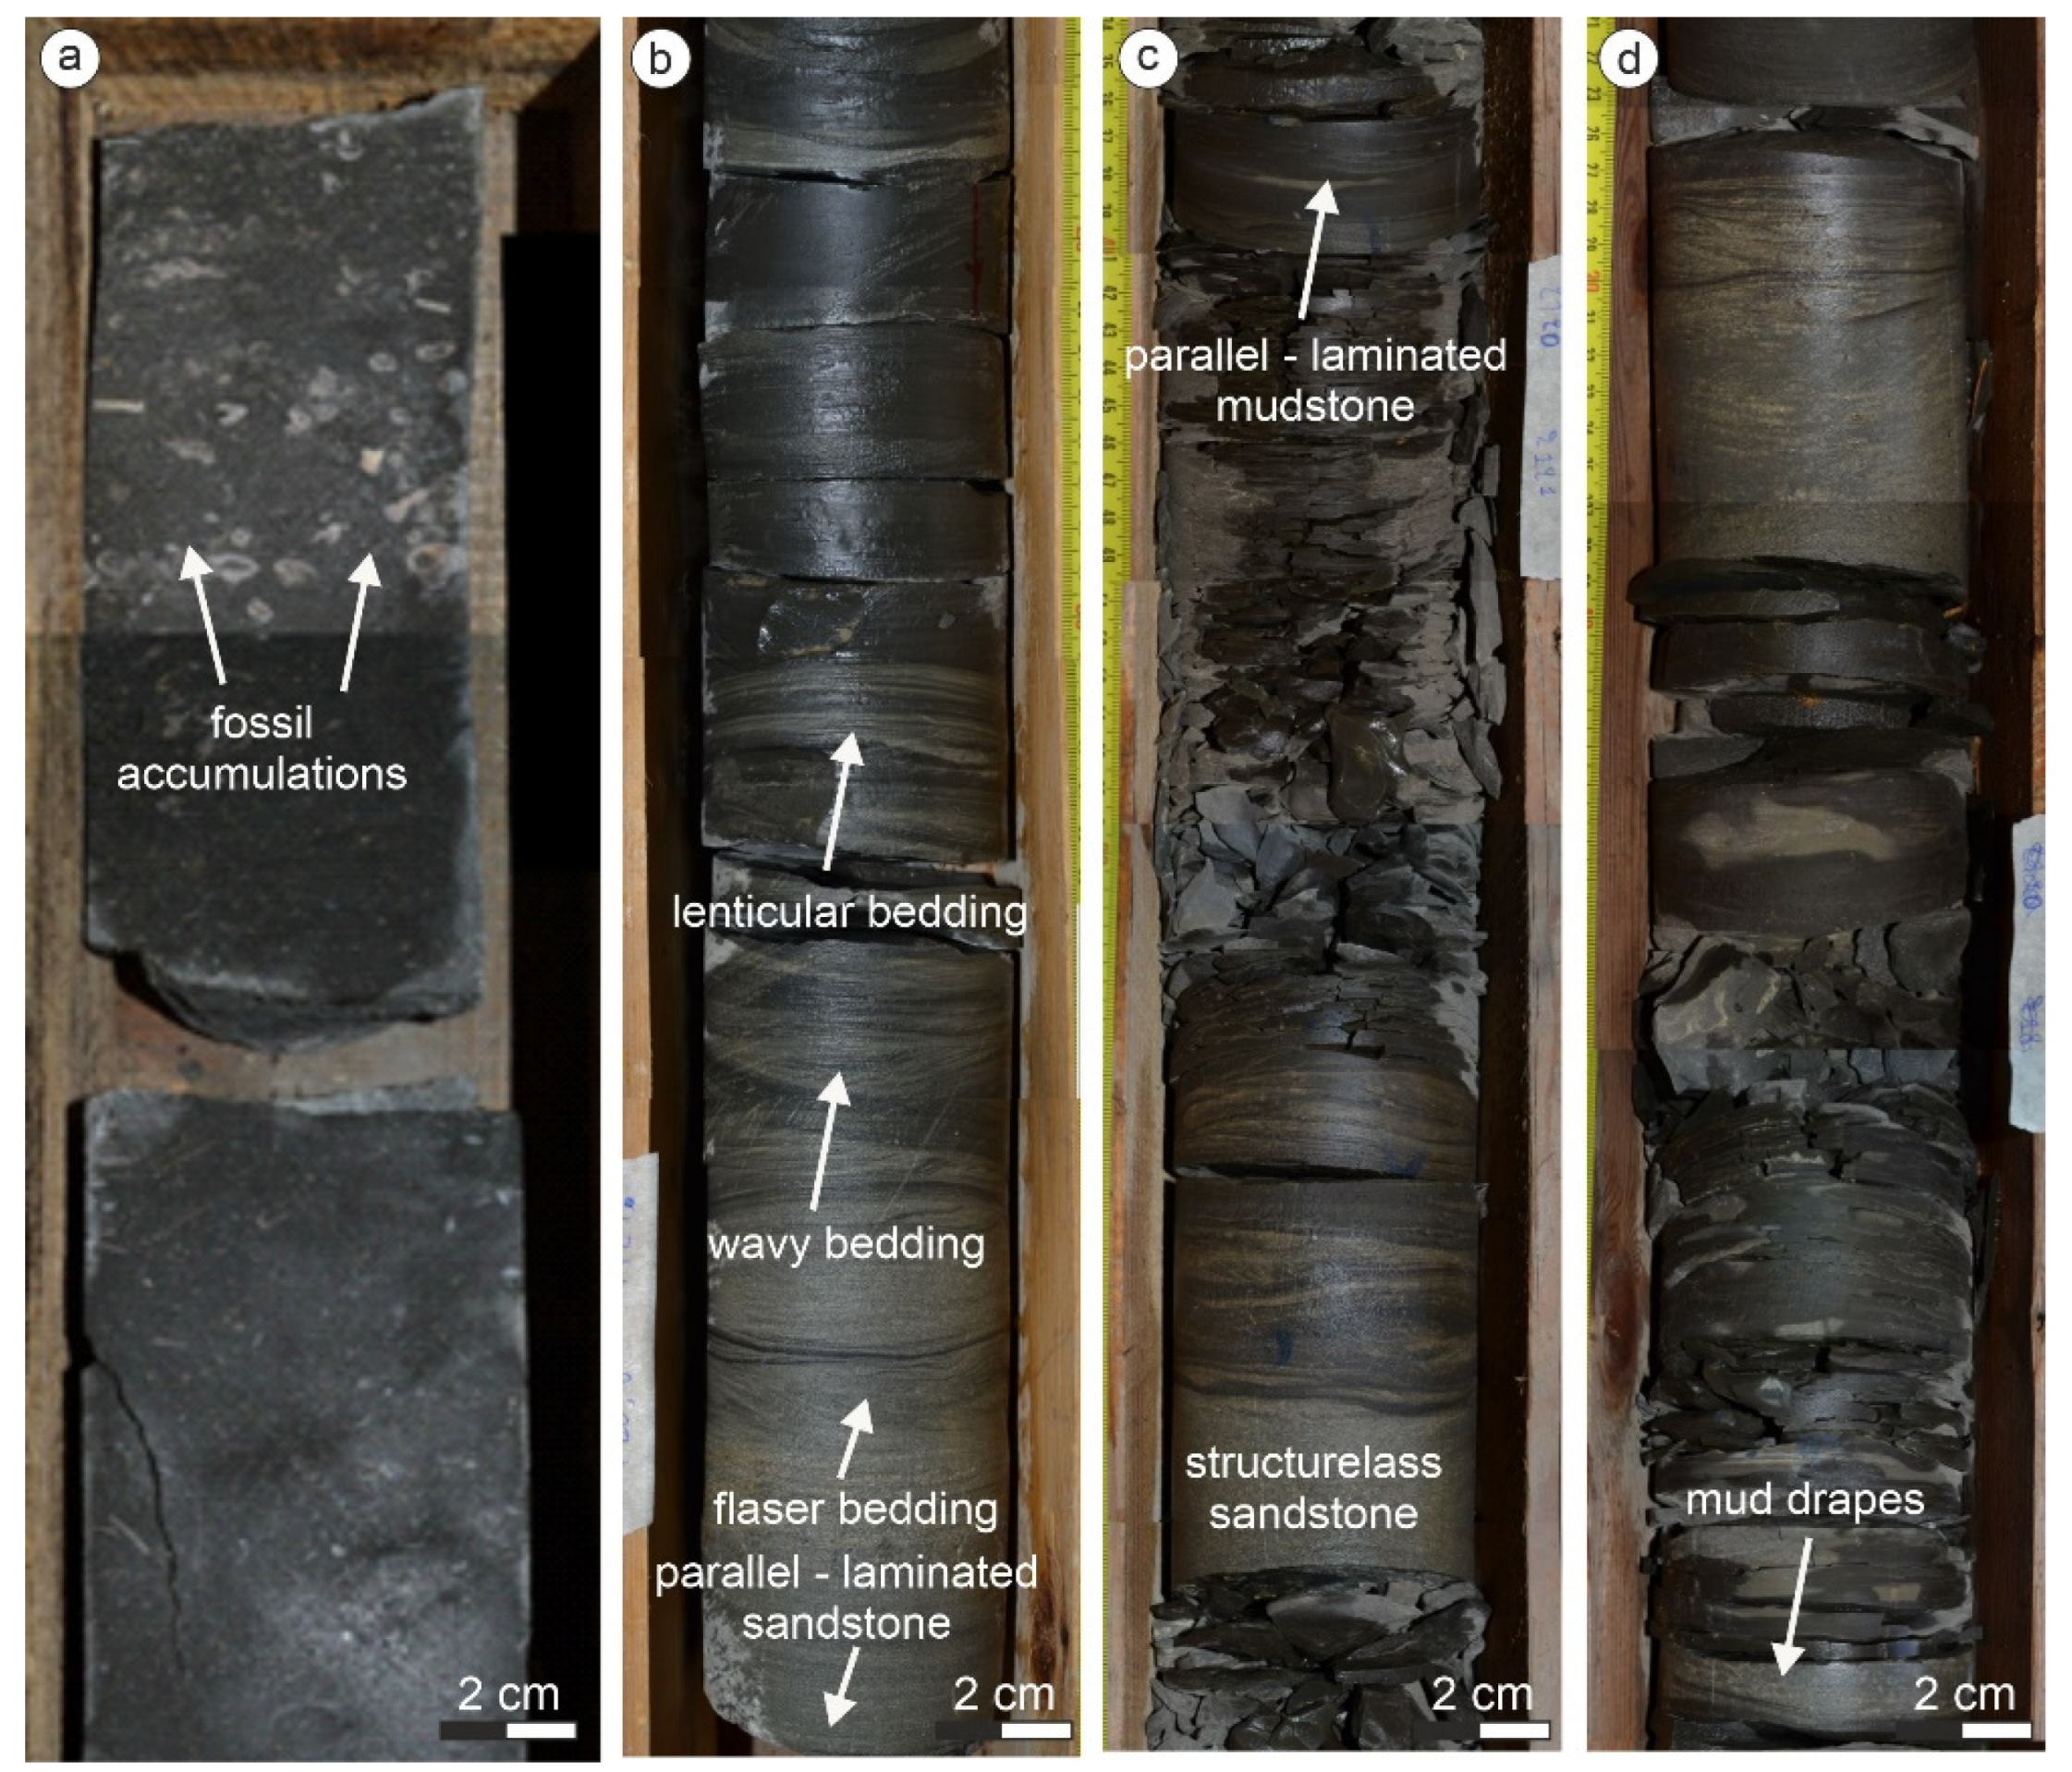
The delta facies association is approximately 0.6 to 30 m thick and consists of variable lithologies, including sand-dominated deposits and finer-grained deposits. The observed deposits are Eocene (KAS-1) and Miocene in age (OL-1 and C-1) and consist of thick-bedded, amalgamated sandstone. The beds are structureless or parallel-laminated. Internally, the beds occasionally display normal grading and occasional soft-sediment deformation and extrabasinal clasts. In many cases, the deposits develop exceptionally thick-bedded units because of the amalgamation of the sandstone beds. The bed thickness ranges approximately from 10 cm to 9 m, and internally, the beds display normal grading. These sandstones contain mud and fossil accumulations (
Figure 3a). Although the amalgamated sandstone units commonly underlie mud-dominated deposits, in some instances, they occur above these mud-prone sedimentary rocks. In many cases, the shift from the sandy to muddy units occurs through a transitional zone that consists of sandy or muddy heterolithics, which exhibit signs of bioturbation or disruption (
Figure 3b). These deposits are characteristically muddier in composition than the overlying and underlying deposits and are made of planar-laminated, ripple cross-laminated, and structureless sandstone, along with structureless and parallel-laminated mudstone (
Figure 3c,d). The bed thickness ranges from 0.5 m to 3.5 m. These deposits include mudstone, with dispersed sand grains and mud-prone sandstone.
3.1.2. Interpretation of Delta Facies Associations
Fine-grained structureless sandstone with parallel lamination, and occasionally, soft-sediment deformation and extrabasinal clasts, is interpreted as mouthbar (MB) deposits. The delta-front (DF) is indicated by the presence of clean, structureless sandstones; any characteristics of tidal influence are missing [
3]. These thick, uniformly-sorted sandstones are formed because of the continuous deposition of medium to coarse-grained material in a turbulent environment [
4,
5]. Prodelta transition (PDT) deposits comprise repetitions of thin sandstone and mud-prone heterolithics with intense bioturbation [
5,
6]. Prodelta deposits (PD) are interpreted based on the mud-dominated nature of this FA and the presence of dispersed sand grains, which are storm-related characteristic structures. The combination of such features suggests deposition in a prodelta environment [
5]. The suspension of sediment deposition during fair-weather periods can be inferred by the occurrence of mudstone [
6].
3.2. Fluvial Facies Associations
3.2.1. Description of Fluvial Facies Associations
The fluvial facies association are between 0.4 and 47 m thick and consist of variable lithologies, including conglomerate and sand-dominated deposits, along with finer-grained deposits and coal (
Figure 4).
This facies association commonly develops sedimentary packages that internally display a general thinning and fining upward trend, from basal conglomerate through thick-bedded amalgamated sandstone and alternations of sandstone and mudstone beds into mud-dominated deposits that sometimes include coal. The basal conglomeratic part is thick-bedded and exhibits erosional contact with the underlying sedimentary rocks. It includes clasts of igneous and sedimentary origin that range from 3 mm to 15 mm in diameter and are sub-angular to sub-rounded. The amalgamated sandstone units contain occasionally thinner-bedded gravelly deposits and display erosional contacts with the underlying deposits. Even though the sandstone beds often display normal grading, reverse-to-normal-graded sandstone beds also occur. Common sedimentary structures include planar-lamination and cross-lamination. Very often, the sandstone beds are structureless or display soft-sediment deformation structures. The alternations of sandstone and mudstone beds are thinner-bedded and include structureless, parallel, and ripple cross-laminated sandstone. Mudstone beds usually lack sedimentary structures, but sometimes develop parallel or ripple cross-lamination. Cm-scale coal and coal-prone deposits are also present in the studied wells (
Figure 4), which present a range in thickness from 3 cm to 19 cm. Coal appears shiny black in color and forms thin beds that horizontally split into slices. Coal beds do not form sharp boundaries with the underlying sediments. These deposits are usually detected in between structureless mudstone and mud-prone sandstone. Similar to coal-bearing deposits, but significantly thicker and with less coal, are the thin repetitions of sandstone, siltstone, mudstone, coal, and rarely, limestone deposits. In many cases, across the wells, thick matrix and/or clast-supported conglomerates are observed and are non-graded to normal-graded.
3.2.2. Interpretation of Fluvial Facies Associations
The basal conglomeratic units, along with the overlying amalgamated sandstone beds, are interpreted as a braided floodplain channel (Fl.ch), with supporting evidence stemming from the occurrence of conglomeratic beds, which usually exhibit erosional contacts with the underlying sediments and a general fining upward trend [
7]. The channelized deposits, along with the minor mud-dominated deposits, indicate high-energy conditions that agree with a braided river depositional environment [
8]. The clast-supported conglomerate can be explained as a bedload deposition from river flows [
9]. The increases and decreases in the river flow energy are responsible for the variance between matrix- and clast-supported conglomerates [
10]. Further, the heavily amalgamated nature of these deposits further supports this interpretation [
9,
11]. The general upward fining trend might be owing to the falling flood stage or the radical abandonment of fluvial channels [
9,
12]. The presence of contorted sandstone in the Kassandra 4 cored drilling is the result of intense liquefaction and/or fluidization, which causes irregular winding and/or deformed structures, most likely due to overloading or slumping [
13]. The thin deposits that consist of repetitions of thin-bedded sandstone and mudstone are interpreted as floodplain valley (Fl.v) deposits, based on their stratigraphic position at the top or between braided fluvial channel deposits [
14]. The coal-bearing deposits are considered peat mires that developed under specific climatic conditions and the provision of organic material. A swampy environment can be developed under humid climatic conditions, where rainfall overcomes the evaporation procedure, creating appropriate conditions that speed up organic growth [
15,
16]. Coal deposits can be created under the continuous rising of the swamp water level (base level) compared to the sediment surface, which is responsible for the necessary conditions for peat formation [
17,
18,
19]. Their association with delta-plain channelized deposits reflects the lateral migration of the distributary channels that rest on the former, coal-bearing floodplain area [
20]. Meanwhile, the bay/lagoon (B/L) facies are dark-colored organic-rich mudstones, rarely interlayered with fine-grained sandstone or microbial carbonates. In the case of poorly sorted pebbles, gravels, boulders, and conglomerates with a massive size, these are interpreted as debritic sheets (DS) deposits. In the Thermaikos Basin’s subaerial deposits, these can be very similar to alluvial fan sheets or subaerial sheets.
3.3. Shallow Marine Facies Associations
3.3.1. Description of Shallow Marine Facies Associations
Although dominated by fluvial deposits, some intervals with marine characteristics are observed in most wells (OL-1, C-1, A-1, NIR-1, EP-B1, and POS-1). In these intervals, claystone deposits are dominant, while sand-rich intervals are subordinate. Shale-dominated intervals can be further subdivided based on their sand proportions and sedimentary structures. Some of these intervals exhibit low-angle cross-stratification. Others exhibit a variety of sedimentary structures, including parallel, ripple cross-lamination, and hummocky cross-stratification (
Figure 5a). Conglomerates and coarse-grained sandstone are observed in thin- to medium-bedded units, commonly separated by mudstone beds displaying sharp or erosional bases with the underlying mudstone (
Figure 5b). Bioturbation is common in these intervals, as are soft sedimentary deformation structures (slump).
This shallow marine facies association also develops sedimentary bodies that show heterolithic bedding (lenticular-bedded mudstone, wavy-bedded very fine to fine-grained sandstone, and often, flaser bedding,
Figure 5c). Finally, some mud-dominated successions include structureless, parallel, and/or ripple cross-laminated mudstone (
Figure 5d).
3.3.2. Interpretation of Shallow Marine Facies Associations
Foreshore (FS) deposits are interpreted where fine to medium sand with common sedimentary structures, including seaward dipping laminae, are observed. Upper shoreface (USF) deposits are mainly fine- to medium-grained sandstones, with symmetric to asymmetric ripples in the bedding plane, ripple laminations, and cross-beds. Fair-weather waves and wave-generated currents are interpreted to have produced symmetric ripples. Minor bioturbation may also be present. Very commonly observed lower shoreface (LSF) deposits are differentiated as proximal and distal due to their mud/sand ratio and degree of bioturbation, which is higher than the distal parts [
21,
22]. In general, both consist of fine-grained, laminated, minor cross-bedded sand. Moving further to the offshore transition zone (OTZ), the deposits consist of fine sandstones with some siltstone and extensive bioturbation and a few inorganic primary sedimentary structures. Extensively bioturbated, laminated, and weakly graded silt and mud, with storm-silt intercalated layers, are dominating the most distal basinal parts (B/OS) of a shallow marine environment [
23,
24,
25]. In cases where heterogeneous deposits of mudstones are observed in matrix-supported conglomerates with chaotic and slumped fabrics, these deposits are interpreted as SL.
3.4. Deepwater Turbidite Facies Associations—CH: Channel; LS: Lobe Sandsheet; LSf: Lobe Sansdsheet Fringe; and IS: Inter-Lobe Deposits
3.4.1. Description of Deepwater Turbidite Facies Associations
This facies association occurs in the deeper part (Eocene–Oligocene) of the POS-1, A-1, and NIR-1 wells. There are sandstone- and claystone-dominated deposits that are divided into four different groups. The sandstone-dominated units are composed of conglomerates and amalgamated sandstones (
Figure 6). The conglomeratic bodies evolve upwards into thinner-bedded conglomerate and coarse- to very coarse-grained, thick- to medium-bedded sandstone. Occasionally, sandstones are overlain by finer-grained mudstone and suggest a general fining upward trend (
Figure 6). However, sedimentary packages that lack conglomerate and possess a thickening upward trend also exist. The sandstone beds are often structureless but also have parallel and/or ripple cross-laminations and display sharp and often erosional bases with the underlying deposits (
Figure 6). They exhibit in places with normal grading and an upward transition in sedimentary structures, from structureless to parallel laminations to ripple cross-laminations. The interbedded mudstone is structureless and/or parallel-laminated. The mudstone also develops sedimentary successions that are interrupted by fine-grained, thin-bedded sandstone with parallel and/or ripple cross-laminations. Structureless mudstone is also common in these mud-prone successions.
3.4.2. Interpretation of Deepwater Turbidite Facies Associations
In a deepwater turbidite environment, coarse sediment is usually associated with the infilling of aggrading and laterally migrating channel (CH) floor deposits [
26]. Lobe sandsheet (LS) facies are the areas within a turbidite system where sandy levels may reach their thickest and largest lateral extensions [
21]. Mud-dominated systems are composed of massive sands with mud clasts in the upper-middle parts of the channel axis and fine sediments in the rest of the lobe sandsheets. In contrast to the sand-dominated systems, massive sandstones with mud clasts are present in the upper part of the channel axis, and massive sand beds alternate with clayey levels in the rest of the lobe sandsheets [
27,
28]. The fringes of the lobe system, characterized by thin-bedded sandstone (fine-grained and rippled) with hybrid event beds, were created due to the transformation of flow [
29]. Very commonly observed thin-bedded siltstone and thick to massive shale units are interpreted as interlobe (IS) deposits [
29].
3.5. Miocene Deposits in Thermaikos Basin Wells
The thickness of the Miocene interval in the offshore seismic data and the offshore wells (
Table 4) is significantly greater compared to that of the Oligocene and Eocene. The different depositional environments that have been distinguished by the well data, along with the tectonism across the basin, created a complex architecture for the Miocene deposits. For this reason, the Miocene deposits were further subdivided into “Miocene packages” based on the interpreted depositional environments and their chronological order of deposition across the basin (
Table 5).
Most of these packages seem to be local, while the fluvial systems (MIV) and shallow marine deposits (MVA) are regional in the Thermaikos Basin. The paleogeography of the area and the normal faults between the wells are the most probable control factors for the lateral extension of these packages and their FAs (
Figure 7). The source of sedimentation for the delta (MII) and fluvial lagoonal systems (MVB) is west of the Thermaikos Basin. In contrast, the debritic sheets (MI) and the fluvial systems (MIII and MIV) are sourced from the eastern areas of the basin. Considering the seismic data observations from the area, the shallow marine (MVA) package is fed from both the west and southwest. The MVC package, which includes a variety of paralic and marine depositional environments, probably reflects local tectonic (?) events in this area (e.g., local subsidence).
4. Reservoir Properties
By plotting the data in a porosity/depth diagram and coding them by well and geological period (
Figure 8a,b), it is clear that the samples from the offshore wells and Miocene exhibited higher porosity values (mean porosity: 19.42%) compared to the data from the onshore areas and from different geological periods (
Table 6). The Miocene samples can be further coded by Miocene packages. In this way, it became obvious that the samples from the fluvial deposits of the Miocene dominated with good to excellent porosity values (MIII, MIV, and MVB;
Table 6) compared to the deltaic deposits, which had good porosity values.
The further coding of these samples can identify the most interesting FAs in terms of their reservoir properties. The SW (mean porosity: 21.23%), Fl.ch (mean porosity: 20.24%), B/L (mean porosity: 20.90%), Fl.v (mean porosity: 17.88%), and DS (mean porosity: 16.00%) exhibited great porosity values (
Table 7).
Although the clay content in these deposits has not significantly reduced the reservoir properties in these samples, further analysis on their permeability needed to be undertaken, as the flow might be tortuous due to clay minerals. It seems that the burial depth of the Miocene deposits is a key factor for their reservoir properties compared to the deeper Oligocene and Eocene facies associations, which exhibited lower porosity values. In light of the above, compaction is suggested as the main diagenetic process in deeper deposits.
5. Seismic Interpretation
The integration of the well, stratigraphic, and porosity data suggests that the Miocene sandstone deposits are the most interesting ones for the purpose of this study. The sedimentological analysis showed seven (7) distinct “Miocene packages” stacked across the basin, representing different depositional environments or different sources of sedimentation. Subsequently, these packages have an internal architecture, attributed to twenty (20) different FAs exhibiting very good reservoir properties and good estimated permeability, resulting from the low degree of compaction in the basin. The current 2D seismic grid suggests a lateral continuity of these “Miocene packages” (
Figure 9a,d). The intra-Miocene tops, interpreted in seismic lines, are attributed to the tops of the “Miocene packages” (
Figure 9c,e) and show a very good lateral continuity across the basin. However, a 3D dataset would clarify the lateral extension of the different FAs. More specifically, in the middle parts of the basin, where the “Miocene packages” from different sources are merging/correlated, the exact stacking pattern is ambiguous (?),(
Figure 9e).
6. Conclusions
This detailed sedimentological study of the deposits in the Thermaikos Basin in Northern Greece revealed useful information regarding the differentiation of the most interesting deposits in terms of the reservoir properties for hydrocarbon exploration and potential CO2 storage in the future.
(1) The studied sediments from the well data in the Thermaikos Basin consist of twenty-two (22) distinct lithotypes, grouped into fifteen (15) larger depositional packages. These depositional packages were classified into twenty (20) facies associations, from four (4) main depositional environments; delta, fluvial system, shallow marine, and deepwater turbidites.
(2) The geographic and stratigraphic distribution of these sediments revealed that the Miocene age deposits are thicker compared to the Eocene–Oligocene and Pliocene–Pleistocene deposits, while they can be traced laterally across the whole basin. These sediments were divided into “Miocene packages” based on their depositional environments and chronological order of deposition. The first fluvial facies (MI) deposited at the bottom of the central basin were sourced from the eastern margins of the basin, followed by local deltaic facies (MII) at the western margin. A thick fluvial system with lignites (MIII) dominates the central part of the basin and is buried partially by a second fluvial system (MIV); both are sourced from the eastern margins. The gradual deepening of the basin during the Miocene reflects the shallow marine (MVA) facies to the east. At the last stages of the Miocene, the basin appears to have shallowed, and thus, fluvial facies with lignites (MVB) were deposited across the west and central parts of the basin. Local mixed facies (MVC) at the central parts of the basin might reflect the point where depositional systems meet from both margins of the basin, or are related to very local depositional conditions.
(3) The tectonism and fault activity during the Oligocene and Miocene are also key factors controlling the distribution of local depocenters, as well as the accumulation of generated hydrocarbons across the basin. The bounding faults to the margins of the basin control the graben and define the rate of sedimentation due to deepening and shallowing processes. Towards the northern parts of the basin, a more acute uplift has been observed. The tectonic configuration has also affected the middle parts of the basin, and more particularly, the Pleistocene sedimentary unit, creating pathways for the accumulation of hydrocarbons in observed traps across the basin and the marginal parts (e.g., Epanomi Gas Field). Moreover, the seismic data revealed the existence of erosional surfaces (namely the Top Miocene and the Mid-Miocene) of the Messinian reflectors that lie above the Miocene and Middle Miocene sequences. The Pliocene–Quaternary sedimentary deposits appear to have probably been affected by the local tectonism. In the SE part of the basin, the faults only exist in the Pliocene–Quaternary deposits, while towards the NW, other normal faults have affected older sediments as well (
Figure 9a), cross-cutting both the Miocene and Pliocene series. This indicates that the latter faults were active during the Miocene and Pliocene times towards the NW of the Thermaikos Basin. An indication of progradation packages can also be observed in
Figure 9a. The Oligocene sequence seems to prograde northwards, thus feeding the depocenter in the middle part of the basin. Synthetic faults cross-cutting the Basement and Eocene formations could act as a good seal, also considering the case where the cap rocks of the Top Eocene and Top Oligocene are impermeable. Analogous to the Thermaikos Basin, with respect to local paleogeographic conditions, can be the East and West Thrace basins in Turkey and Greece, respectively [
30,
31,
32].
(4) The sandstones buried down to 1500 ms TWT display the best reservoir quality, with excellent porosity values of up to 29%, mainly in the central and eastern parts of the basin. The fluvial and deltaic facies associations exhibit excellent to good porosity values, with the floodplain channel, swamp, floodplain sheets, and debritic sheets characterized as the most interesting in terms of reservoir properties.
The source rock in the Middle to the Upper Miocene is oil-prone, containing organic matter of type II/III kerogen and good thermal maturity levels in the deeper parts of the basin. In NR-1, deeper Eocene–Oligocene samples revealed gas-prone organic matter with good thermal maturity. The Pliocene–Pleistocene argillaceous/mudstone deposits act as a seal in the stratigraphic traps (maximum thickness of 2000 m), while buried faults across the basin create structural traps that can prove essential. However, an assessment of the sealing capacity of faults in the Thermaikos Basin is needed to determine potential areas for hydrocarbon exploration and future CO
2 storage. The gas shows in the Miocene series are a positive indicator for the possibility of further exploration in the area. This has been confirmed by the discoveries and the gas shows of equivalent Miocene series in the post-Alpine basins of the North Aegean (Prinos, Orfanos, and East Thassos Basins) [
33].
Supplementary Materials
The following supporting information can be downloaded at:
https://www.mdpi.com/article/10.3390/geosciences13060159/s1, Figure S1. Core photographs from KAS-1 well (#C-1 and #C-2); Figure S2. Core photographs from KAS-3 well (#C-1 and #C-2). The red colours in #B1,2 and 3 of #C-2, highlight the uncertainty for the order of the core rubbles in these boxes; Figure S3. Core photographs from NIR-1 well (#C-1, #C-2, #C-3 and #C-4); Figure S4. Core photographs from PO-1 well (#C-1 and #C-2); Figure S5. Core photographs from PO-1 well (#C-3 and #C-4); Figure S6. Core photographs from PO-1 well (#C-5, #C-6 and #C7); Figure S7. Core photographs from KAS-1 well (#C-8); Figure S8. Core descriptions from NIR-1 well; Figure S9. Core descriptions from PO-1 well (#C1-#C4); Figure S10. Core descriptions from PO-1 well (#C5-#C8).; Figure S11. Core descriptions from KAS-1 well; Figure S12. Core descriptions from KAS-3 well; Figure S13. Core description legend.
Author Contributions
This paper is a wide-ranging review compilation. The original draft was written by G.M. and then modified after discussion with the rest of the authors. Introduction, G.M., E.T. and A.S.; Materials and Methods, G.M. and D.K.; Lithotypes, Depositional Packages, and Facies Associations, G.M., A.N., N.M.R. and A.G.M.; Reservoir Properties, G.M. and N.P.; Seismic Interpretation: G.M. and D.K.; Conclusions and Discussion: G.M., A.N., D.K., A.G.M., E.T. and A.S. All authors have read and agreed to the published version of the manuscript.
Funding
The compilation of this review paper received funding from Hellenic Hydrocarbons and Energy Resources Management Company S.A (HEREMA S.A.).
Data Availability Statement
The data used in this study are state-owned and remain confidential. They were used with permission from the Ministry of Environment and Energy of Greece.
Acknowledgments
Huge thanks are due, in particular, to the Ministry of Environment and Energy of Greece for providing the seismic and well data, the undergraduate students from the Aristotle University of Thessaloniki, Angelos Tagalidis and Zenia Chatzi, for their contributions, and the HEREMA technical colleagues for their comments.
Conflicts of Interest
The authors declare no conflict of interest.
References
- Koukouvelas, I.K.; Aydin, A. Fault structure and related basins of the North Aegean Sea and its surroundings. Tectonics 2002, 21, 10–11. [Google Scholar] [CrossRef]
- Koukouvelas, I.; Doutsos, T. Tectonic stages along a traverse cross cutting the Rhodopian zone (Greece). Geol. Rundsch. 1990, 79, 753–776. [Google Scholar] [CrossRef]
- Hellenic Hydrocarbons and Energy Resources Management Company S.A. (HEREMA S.A.). National data repository. 2022; unpublished data. [Google Scholar]
- Public Petroleum Corporation (PPC). National data repository. 1989; unpublished data. [Google Scholar]
- Olariu, C.; Bhattacharya, J. Terminal Distributary Channels and Delta Front Architecture of River-Dominated Delta Systems. J. Sediment. Res. 2006, 76, 212–233. [Google Scholar] [CrossRef]
- Myrow, P.M.; Southard, J.B. Combined-flow model for vertical stratification sequences in shallow marine storm-deposited beds. J. Sediment. Petrol. 1991, 61, 202–210. [Google Scholar]
- Ghani, M.; Bhattacharya, J.P. Basic Building Blocks and Process Variability of a Cretaceous Delta: Internal Facies Architecture Reveals a More Dynamic Interaction of River, Wave, and Tidal Processes Than Is Indicated by External Shape. J. Sediment. Res. 2007, 77, 284–302. [Google Scholar] [CrossRef]
- Nemec, W.; Steel, R.J. Alluvial and coastal conglomerates: Their significant features and some comments on gravelly mass-flow deposits. Sedimentology of Gravels and Conglomerates. Memoir 1984, 10, 1–31. [Google Scholar]
- Buatois, L.A.; Santiago, N.; Herrera, M.; Plink-Björklund, P.; Steel, S.; Espin, M.; Parra, K. Sedimentological and ichnological signatures of changes in wave, river and tidal influence along a Neogene tropical deltaic shoreline. Sedimentology 2012, 59, 1568–1612. [Google Scholar] [CrossRef]
- Miall, A.D. The Geology of Fluvial Deposits: Sedimentary Facies, Basin Analysis, and Petroleum Geology; Springer: Berlin, Germany, 1996. [Google Scholar]
- Nemec, W.; Postma, G. Quaternary alluvial fans in southwestern Crete: Sedimentation processes and geomorphic evolution. Alluvial Sedimentation—Special Publications. Int. J. Sedimentol. 1993, 17, 235–276. [Google Scholar]
- Collinson, J.D. Alluvial Sediments. In Sedimentary Environments: Processes, Facies and Stratigraphy, 3rd ed.; Reading, H.G., Ed.; Blackwell Science: Oxford, UK, 1996; pp. 37–81. [Google Scholar]
- Collinson, J.D.; Mountney, N.P.; Thompson, D. Sedimentary Structures, 3rd ed.; Terra Publishing: Harpenden, UK, 2006. [Google Scholar]
- Bridge, J.S. Fluvial Facies Models: Recent Developments; Facies Models Revisited; SEPM, Special Publication: Broken Arrow, OK, USA, 2006; Volume 84, pp. 85–170. [Google Scholar]
- Berra, F.; Felletti, F. Syndepositional tectonics recorded by soft-sediment deformation and liquefaction structures (continental Lower Permian sediments, Southern Alps, Northern Italy): Stratigraphic significance. Sediment. Geol. 2011, 235, 249–263. [Google Scholar] [CrossRef]
- Dalrymple, R.W.; Zaitlin, B.A.; Boyd, R. Estuarine Facies Models: Conceptual Basis and Stratigraphic Implications: Perspective. J. Sediment. Petrol. 1992, 62, 1130–1146. [Google Scholar] [CrossRef]
- Mellere, D.; Steel, R.J. Tidal Sedimentation in Inner Hebrides Half Grabens, Scotland: The Mid-Jurassic Bearreraig Sandstone Formation. Geol. Soc. Lond. Spec. Publ. 1996, 117, 49–79. [Google Scholar] [CrossRef]
- Melehan, S.; Botziolis, C.; Maravelis, A.G.; Catuneanu, O.; Ruming, K.; Holmes, E.; Collins, W.J. Sedimentology and Stratigraphy of an Upper Permian Sedimentary Succession: Northern Sydney Basin, Southeastern Australia. Geosciences 2021, 11, 273. [Google Scholar] [CrossRef]
- Maravelis, A.G.; Breckenridge, J.; Ruming, K.; Holmes, E.; Amelin, Y.; Collins, W.J. Re-assessing the Upper Permian Stratigraphic Succession of the Northern Sydney Basin, Australia, by CA-IDTIMS. Geosciences 2020, 10, 474. [Google Scholar] [CrossRef]
- Legler, B.; Johnson, H.D.; Hampson, G.J.; Massart, B.; Jackson, C.; El-Barkooky, A.; Ravnas, R. Facies model of a fine-grained, tide-dominated delta: Lower Dir Abu Lifa Member (Eocene), Western Desert, Egypt. Sedimentology 2013, 60, 1313–1356. [Google Scholar] [CrossRef]
- Reynauld, J.Y.; Ferrandini, M.; Ferrandini, J.; Sandiago, M.; Thinon, I.; Andre, J.P.; Barthet, Y.; Guennoc, P.; Tessier, B. From non-tidal shelf to tide-dominated strait: The Miocene Bonifacio Basin, Southern Corsica. Sedimentology 2013, 60, 599–623. [Google Scholar] [CrossRef]
- Dumas, S.; Arnott RW, C. Origin of hummocky and swaley cross-stratification—The controlling influence of unidirectional current strength and aggradation. Geology 2006, 34, 1073–1076. [Google Scholar] [CrossRef]
- Visser, M.J. Neap-Spring cycles reflected in Holocene subtidal large-scale bedform deposits: A preliminary note. Geology 1980, 8, 543–546. [Google Scholar] [CrossRef]
- Nio, S.; Yang, S. Diagnostic Attributes of Clastic Tidal Deposits: A Review. Clastic Tidal Sedimentology. Memoir 1991, 16, 3–27. [Google Scholar]
- Peters, S.E.; Loss, D.P. Storm and fair-weather wave base: A relevant distinction? Geology 2012, 40, 511–514. [Google Scholar] [CrossRef]
- Botziolis, C.; Maravelis, A.G.; Pantopoulos, G.; Kostopoulou, S.; Catuneanu, O.; Zelilidis, A. Stratigraphic and paleogeographic development of a deep-marine foredeep: Central Pindos foreland basin, western Greece. Mar. Pet. Geol. 2021, 128, 105012. [Google Scholar] [CrossRef]
- Spychala, Y.T.; Hodgson, D.M.; Prèlat, A.; Kane, I.A.; Flint, S.S.; Mountney, N.P. Frontal and lateral submarine lobe fringes: Comparing sedimentary facies, architecture and flow processes. J. Sediment. Res. 2017, 87, 75–96. [Google Scholar] [CrossRef]
- Lowe, D.R. Suspended-load fallout rate as an independent variable in the analysis of current structures. Sedimentology 1988, 35, 765–776. [Google Scholar] [CrossRef]
- Spychala, Y.T.; Hodgson, D.M.; Stevenson, C.J.; Flint, S.S. Aggradational lobe fringes: The influence of subtle intrabasinal seabed topography on sediment gravity flow processes and lobe stacking patterns. Sedimentology 2017, 64, 582–608. [Google Scholar] [CrossRef]
- Siyako, M. “Lignitic sandstones” of Trakya basin. Bull. Min. Res. Exp. 2006, 132, 63–72. [Google Scholar]
- Perincek, D.; Atas, N.; Karatut, S.; Erensoy, E. Geological factors controlling potential of lignite beds within the Danismen Formation in the Thrace basin. Bull. Min. Res. Exp. 2015, 150, 77–108. [Google Scholar] [CrossRef]
- Erbil, U.; Okay, A.I.; Hakyemez, A. Late Oligocene—Early Miocene shortening in the Thrace Basin, northern Aegean. Int. J. Earth Sci. 2021, 110, 1921–1936. [Google Scholar] [CrossRef]
- Kiomourtzi, P.; Pasadakis, N.; Zelilidis, A. Source Rock and Depositional Environment Study of Three Hydrocarbon Fields in Prinos—Kavala Basin (North Aegean). Open Pet. Eng. J. 2008, 1, 16–29. [Google Scholar] [CrossRef]
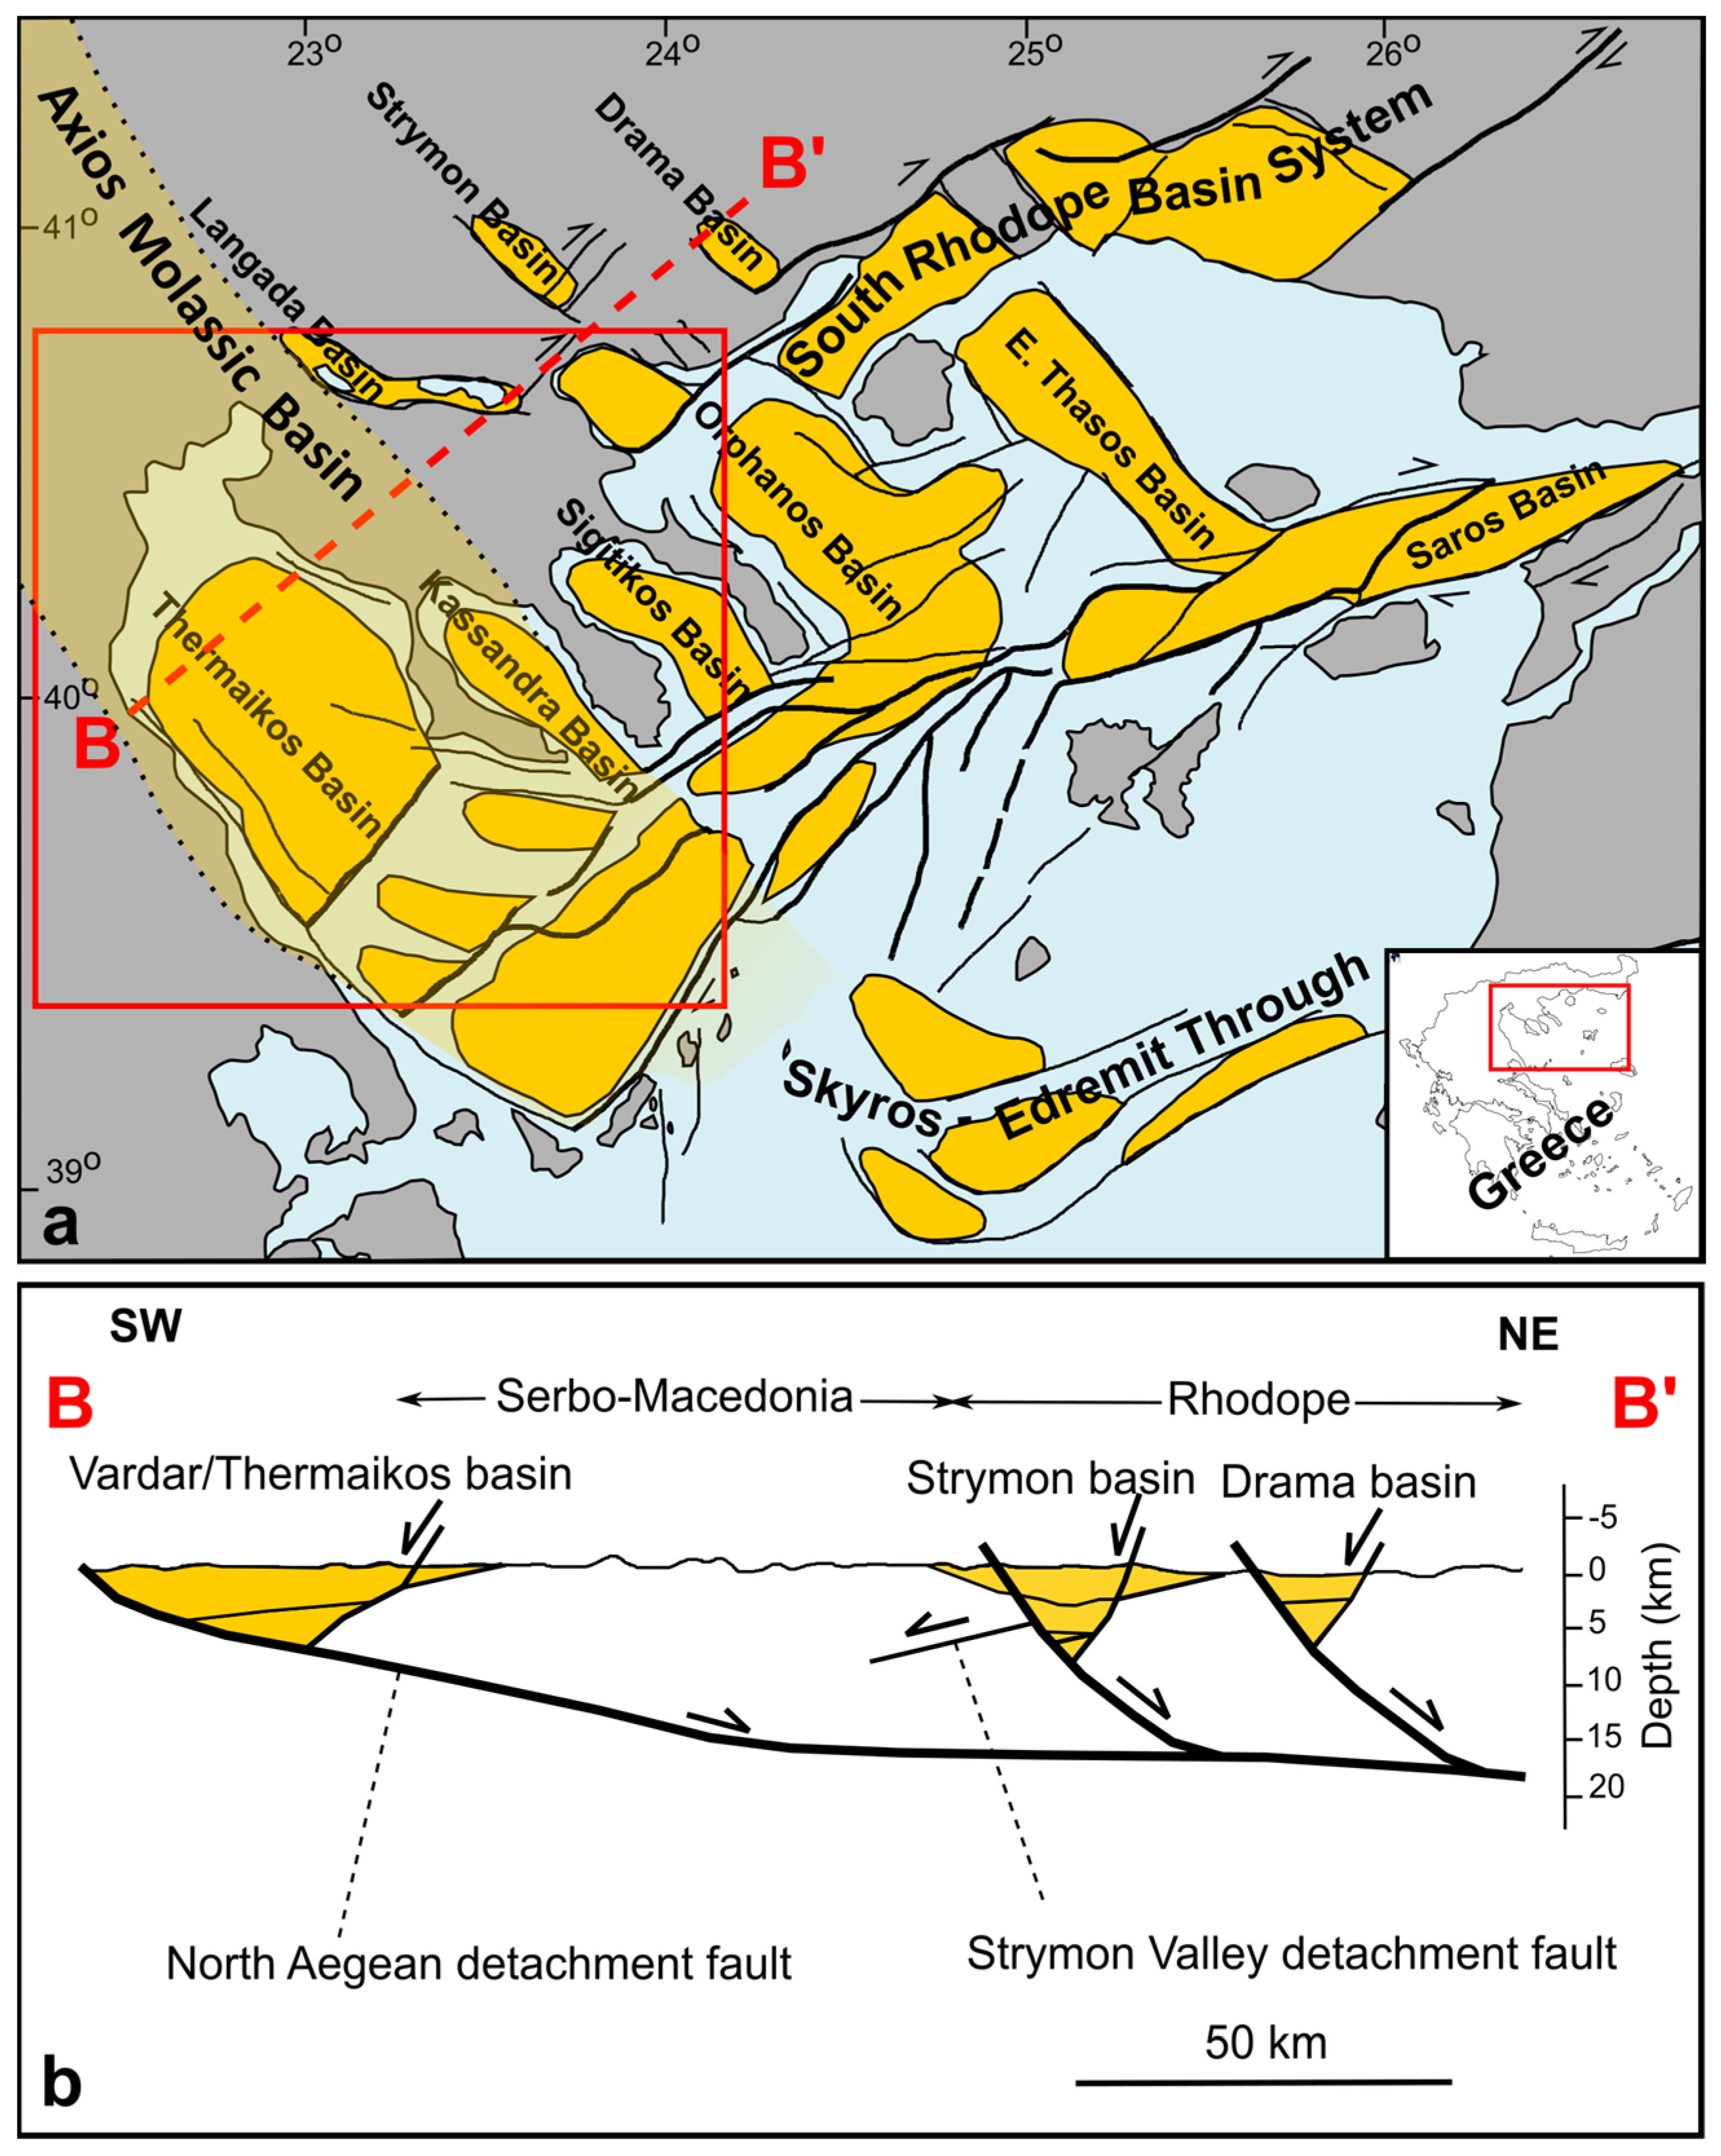
Figure 1.
(
a) Map illustrating the post-Alpine basins (yellow) in the Northern Aegean area (modified from [
1]). (
b) Tectonic model for the post-Alpine basins of the area (modified from [
2]).
Figure 1.
(
a) Map illustrating the post-Alpine basins (yellow) in the Northern Aegean area (modified from [
1]). (
b) Tectonic model for the post-Alpine basins of the area (modified from [
2]).
Figure 2.
Location map showing the offshore study area, Thermaikos Basin, including all the available seismic (grey lines) and well data (yellow dots) [
4].
Figure 2.
Location map showing the offshore study area, Thermaikos Basin, including all the available seismic (grey lines) and well data (yellow dots) [
4].
Figure 3.
Core photographs of KAS-1, KAS-3, and NIR-1 illustrating sedimentological characteristics of the deltaic facies association. (a) Fossiliferous sandstone. (b) Alternations of structureless, parallel, and ripple cross-laminated sandstone. (c,d) Heterolithic bedding with repetitions of flaser, wavy, and lenticular bedding.
Figure 4.
Core photographs of PO-1 illustrating sedimentological characteristics of the fluvial facies association. Coarser-grained sedimentary rocks that belong to fluvial channels (Fl.ch) overlay finer-grained deposits of the overbank facies (Fl.v).
Figure 4.
Core photographs of PO-1 illustrating sedimentological characteristics of the fluvial facies association. Coarser-grained sedimentary rocks that belong to fluvial channels (Fl.ch) overlay finer-grained deposits of the overbank facies (Fl.v).
Figure 5.
Core photographs from PO-1 illustrating sedimentological characteristics of the shallow marine facies association. (a) Alternations of parallel, ripple cross-laminated, and HCS sandstone. (b) Storm-associated coarse-grained sandstone interbedded with mudstone. (c) Heterolithic bedding with repetitions of flaser, wavy, and lenticular bedding. (d) Mud-dominated successions with structureless, parallel, and/or ripple cross-laminated mudstone. Note the soft sediment deformation structures and the evidence of bioturbation.
Figure 6.
Core photographs of PO–1 illustrating sedimentological characteristics of the deepwater facies association. The sandstone beds are often structureless and display sharp and often erosional bases with the underlying deposits. Occasionally, sandstones are overlain by finer-grained mudstone and suggest a general fining upward trend.
Figure 7.
W-E correlation across Thermaikos Basin, illustrating the sequence evolution of the different depositional environment of Miocene (“Miocene packages”) and their lateral continuity. The source of sedimentation for the MI, MIII, MIV, and MVC located in the eastern areas of the basin, while for the MII, MVA, and MVB deposits, the source is located in the west.
Figure 8.
Sample porosity vs. depth for selected samples from Thermaikos Basin, coded by (a) well, (b) geological period (highlighted Miocene samples with yellow); note that Miocene samples were the ones that exhibited higher porosity values, (c) Miocene packages (only the Miocene samples are colored) and (d) FASs (only the Miocene samples are colored).
Figure 9.
(a) Interpreted horizons from the seismic line A−A’ from the Thermaikos dataset, portraying the formations above the basement, in a NW−SE direction. The line illustrates the OL−1 well, drilled to the NW part of the basin. (b) A well−to−seismic tie of OL−1 with line A−A’, illustrating the presence of intra−Miocene tops. These intra−Miocene tops match with the different “Miocene packages” interpreted from the well dataset. (c) Location map of the basin, illustrating the location of selected seismic lines and wells. (d) Interpreted horizons from the seismic line B−B’ from the Thermaikos dataset, portraying the formations above the basement in a SW−NE direction. Notice that the maximum thickness of the Miocene interval, located in the middle part of the basin. (e) A cross−section of A−A’ and B−B’ lines, revealing a lateral continuation of “Miocene packages” across the basin. The exact stacking pattern in the middle parts of the basin, where “Miocene packages” from different sources are merging, is difficult to be distinguished through the available 2D dataset.
![Geosciences 13 00159 g009]()
Table 1.
Summary of observed LTs in cores from Thermaikos Basin.
Table 1.
Summary of observed LTs in cores from Thermaikos Basin.
| Lithotypes (LTs) | Sedimentary Structures |
|---|
| (Cgm/Cgc): Matrix/clast-supported conglomerate | Structureless conglomerate or breccia. Rarely with reverse or normal grading. |
| (Sm): Massive sandstone | Unstratified. |
| (Sl): Laminated sandstone | Parallel laminations. |
| (Slm): Mud-laminated sandstone | Parallel argillaceous laminations. |
| (Sx): Cross-stratified sandstone | Parallel high angle >10° laminations. |
| (Sr): Rippled sandstone | Asymmetrical ripples and mud drapes. |
| (Sds): Soft-sediment deformed sandstone | Folded/disrupted massive or laminated sandstone. Dewatering features may be present. |
(Smb): Massive bioturbated
sandstone | Unstratified laminated fabric disrupted by cryptically/low to high degree of bioturbation. |
(SA): Argillaceous sandstones
(SAm, SAl, SAlm, SAx, SAr, SAds, SAmb) | Applicable for all the above sandstones in case of high proportion of argillaceous material (e.g., SAl: Argillaceous laminated sandstone). |
| (Hs): Sand-prone heterolithics | Wavy, flaser, and lenticular laminations, where sandstone is the dominant lithology. Mud drapes may also be present. |
| (Hm): Mud-prone heterolithics | Wavy, flaser, and lenticular laminations, where mudstone is the dominant lithology. Mud drapes may also be present. |
| (Mm): Massive mudrock | Unstratified. |
| (Ml): Laminated mudrock | Parallel laminations. |
| (Mb): Bioturbated mudrock | Unstratified of laminated fabric disrupted by low to high degree of bioturbation. |
| (C): Coal | Including lignite as well. |
Table 2.
Summary of DPs from core and well data from Thermaikos Basin.
Table 2.
Summary of DPs from core and well data from Thermaikos Basin.
| Depositional Packages (DPs) | Grouped LTs and Interpretation |
|---|
(P1): Conglomerates
(P1.1: Clean,
P1.2: Mud-prone,
P1.3: Mud-rich) | Cgm/Cgc: The result of high-energy current. Component’s roundness infers the transport mechanism and the distance (pebbles vs breccia), while the lithology indicates the source rock. |
(P2): Amalgamated sandstones
(P2.1: Clean,
P2.2: Mud-prone,
P2.3: Mud-rich) | Sm, Sl, Slm, Sx, Sr, Sds, Smb, and all the argillaceous equivalents (SA): Sandstones on sandstones, which exhibit a degree of amalgamation—several distinct flows within a sequence. High-energy environment |
(P3): Sandstones with bedcaps
(P3.1: Clean,
P3.2: Mud-prone,
P3.3: Mud-rich) | Sm, Sl, Slm, Sx, Sr, Sds, Smb, all the argillaceous equivalents (SA), Ml, Mm and Mb: Stacked sandstones with bedcaps at the top. High-energy environment. Different P3 packages show different cycles of sedimentation within a sequence. |
| (P4): Sand-prone heterolithics | Hs: High- to mid-energy (tidal) currents or channel in low-energy environment. |
| P5: Mud-prone heterolithics | Hm: Mid- to low-energy (tidal) currents. |
(P6): Mudrocks
(Pc6.1: Carbonate-prone,
Pc6.2: Carbonate-rich) | Ml, Mm, and Mb: Mid- to very low-energy environment with unidirectional to directional traction and suspension sedimentation.
P6: <10% carbonates, Pc6.1: 10–50% carbonates, Pc6.2: >50% carbonates (deepwater). |
| (P7): Coal | C: Traces or laminations of coal and/or lignite infer rapid burial and/or anoxic conditions. |
Table 3.
Summary of FAs, including DP and LT combinations, for the clastic deposits of Thermaikos Basin.
Table 3.
Summary of FAs, including DP and LT combinations, for the clastic deposits of Thermaikos Basin.
| Depositional Environment | Facies Associations (FAs) | Grouped DPs * | Depositional Process |
|---|
| Delta | (MB): Mouthbar | P1.2, P2.1, P2.2, P3.1, P3.2, Pc6.1 | Rapid suspension fallout up to mid- to high-energy sedimentation. |
| (DF): Delta-front | P1.2, P2.1, P2.2, P3.1, P3.2, Pc6.1 | Rapid suspension fallout up to mid- to high-energy sedimentation. |
(PDT): Prodelta
transition zone | P3.1, P3.2, Pc6.1 | Usually, low-energy unidirectional traction and suspension sedimentation. |
| (PD): Prodelta | P2.1, P2.2, P2.3, P3.1, P3.2, P3.3,
P4, P5, P6, Pc6.1 | Unidirectional traction and suspension sedimentation. |
| Fluvial | (Fl.ch): Floodplain
channel | P1.1, P2.1, P2.3, P3.1, P3.2, P3.3, P6 | Mid- to high-energy sedimentation. |
(Fl.v): Floodplain
valley | P2.1, P3.1, P3.2,
P6, Pc6.1, P7 | Low- to high-energy unidirectional traction sedimentation. |
| (SW): Swamp | P2.2, P2.3, P3.2,
P6, P7 | Mid- to high-energy sedimentation, which causing the rapid burial of organic matter in the area. |
| (B/L): Bay/lagoon | P3.1, P3.2, Pc6.1? | High- to low-energy, tidally influenced environment. |
| (DS): Debritic sheets | P1.1, P1.2, P1.3, P2.1, P3.2, P3.3, P6 | High-energy unidirectional traction currents, weathering of source rock. |
Shallow
Marine | (FS): Foreshore | P2.1, P2.2, P2.3 | High-energy sedimentation. |
| (USF): Upper shoreface | P2.1, P3.1 | Mid- to high-energy sedimentation. |
(LSF.p): Lower
shoreface proximal | P2.1, P3.1, P3.2, P3.3, P6, Pc6.1 | Mid- to high-energy unidirectional traction and suspension sedimentation. |
(LSF.d): Lower
shoreface distal | P3.2, P3.3,
P6, Pc6.1 | Usually, low- to mid-energy unidirectional traction and suspension sedimentation. |
(OTZ): Offshore
transition zone | P3.2, P3.3,
P6, Pc6.1 | Usually, low-energy unidirectional traction and suspension sedimentation. |
(B/OS): Basin/
offshore | Pc6.1, Pc6.2 | Suspension sedimentation. |
| (SL): Slump | P1.1, P1.2, P1.3 | High-energy unidirectional traction currents |
Deepwater
Turbidites | (CH): Turbidite
channel | P1.1, P2.1,
P3.1, Pc6.1 | Mid- to high-energy sedimentation. |
(LS): Lobe
sandsheet | P2.1, P3.1, Pc6.1 | Mid- to high-energy unidirectional traction sedimentation. |
(LSf): Lobe
sandsheet fringe | P3.1, Pc6.1 | Low-energy unidirectional traction and suspension sedimentation. |
(IS): Inter-lobe
claystone sheets | Pc6.1, Pc6.2 | Unidirectional traction and suspension sedimentation. |
Table 4.
A summary of FAs per studied well in the Thermaikos Basin.
Table 4.
A summary of FAs per studied well in the Thermaikos Basin.
| Well | Position in
Basin ** | System—Period |
|---|
| Eocene | Oligocene | Miocene | Pliocene–Pleistocene |
|---|
| OL-1 | NWM/C | Fluvial FAs:
AF, Fl.ch, Fl.v
Thickness: 202.0 m | N/A | Fluvial FAs:
FL.ch. Fl.v, B/L, SW, AF
Shallow marine FAs: USF, LSF.p LSF.d, OTZ
Delta FAs:
DF, PDT, PD
Thickness: 1513.0 m | Fluvial FAs:
FL.ch. Fl.v, B/L
Shallow marine FAs: FS, LSF.p, LSF.d, SL
Thickness: 472.5 m |
| C-1 | NWM/C | Fluvial FAs:
FL.ch. Fl.v, SW, AF
Delta FAs:
MB, DF, PDT, PD
Thickness: 810.0 m | N/A | Fluvial FAs:
FL.ch. Fl.v, B/L, SW
Shallow marine FAs: FS, USF, LSF.p, LSF.d, OTZ
Delta FAs: DF
Thickness: 1630.0 m | Fluvial FAs:
Fl.ch, Fl.v, B/L
Shallow marine FAs: FS, USF, LSF.p, LSF.d, OTZ, SL
Thickness: 911.0 m |
| A-1 | C | N/A | Deepwater FAs:
CH, LS, LSf, IS
Thickness: 460.8 m | Shallow marine FAs:
FS, USF, LSF.p, LSF.d, B/OS, SL
Fluvial FAs:
Fl.ch, Fl.v, SW, DS
Thickness: 2636.2 m | Shallow marine FAs:
USF, B/OS
Thickness: 469.5 m |
| NR-1 * | C | N/A | Deepwater FAs:
CH, LS, LSf, IS
(#C4)
Thickness: 650.8 m | Fluvial FAs:
Fl.ch, Fl.v, SW, B/L, DS
Delta FAs:
MB, DF, PDT
Shallow marine FAs:
FS, LSF.p, LSF.d
(#C1, #C2, and #C3)
Thickness: 1738.8 m | Fluvial FAs:
Fl.ch, Fl.v, SW, DS
Thickness: 661.1 m |
| PO-1 * | SEM/C | Deepwater FAs:
CH, LS, LSf.
Fluvial FAs:
Fl.ch, Fl.v, DS.
(#C4, #C5, and #C6)
Thickness: 409.5 m | Shallow marine FAs: LSF.p, LSF.d, OTZ, B/OS
Deepwater FAs:
CH, LS, LSf.
(#C2 and #C3)
Thickness: 2191 m | Fluvial FAs:
Fl.ch, Fl.v, DS.
(#C1)
Thickness: 710.5 m | N/A |
| KAS-3 * | SEM | Fluvial FAs:
Fl.ch, Fl.v, SW, DS/AF.
(#C1, #C2, and #C3)
Thickness: 562.0 m | N/A | Fluvial FAs:
Fl.ch, Fl.v, DS/AF.
Thickness: 809.0 m | N/A |
| KAS-1 * | SEM | Fluvial FAs:
Fl.v, DS.
Delta FAs:
DF, PDT, PD.
(#C1 and #C2)
Thickness: 514.4 m | N/A | Fluvial FAs:
Fl.ch, Fl.v, DS.
Thickness: 1009.9 m | N/A |
| EP-B1 | NEM | Shallow marine FAs:
OS, OTZ.
Thickness: 1025.0 m | Fluvial FAs: Fl.ch.
Shallow marine FAs: USF, LSF.p, LSF.d, SL.
Thickness: 852.0 m | Fluvial FAs:
Fl.ch, DS/SF.
Thickness: 598.0 m |
Table 5.
A summary of “Miocene packages” of Thermaikos Basin.
Table 5.
A summary of “Miocene packages” of Thermaikos Basin.
| Depositional Environment | “Miocene Package” | Wells | Thickness (m) |
|---|
| Debritic sheets | MI | N-1 | 46.9 m |
| A-1 | 498.9 m |
Delta
(Western basin margin) | MII | OL-1 | 550.2 m |
| C-1 | 22.0 m |
Fluvial systems
“1st lignite package” | MIII | N-1 | 1264.9 m |
| A-1 | 1329.5 m |
| Fluvial systems | MIV | KAS-1 | 1009.9 m |
| KAS-3 | 809.0 m |
| EP-B1 | 47.0 m |
| PO-1 | 710.5 m |
| N-1 | 190.2 m |
| Shallow marine | MVA | OL-1 | 302.3 m |
| C-1 | 805.2 m |
| A-1 | 807.8 m |
| EP-B1 | 805.0 m |
Fluvial-lagoonal systems
“2nd lignite package” | MVB | OL-1 | 660.5 m |
| C-1 | 802.8 m |
| Mixed systems | MVC | N-1 | 236.8 m |
Table 6.
Mean porosity of samples per geological series and “Miocene packages”.
Table 6.
Mean porosity of samples per geological series and “Miocene packages”.
| Age | Miocene Packages | Number
of Samples | Mean
Porosity (%) | Standard Deviation |
|---|
| Pliocene | | | 12 | | 11.75 | | 2 |
| Miocene | (MI) | 77 | 1 | 19.42 | 2.5 | 5 | N/A |
| (MII) | 3 | 15.83 | 0.8 |
| (MIII) | 12 | 21.11 | 7.4 |
| (MIV) | 10 | 17.4 | 6.2 |
| (MVB) | 50 | 19.86 | 3.2 |
| (MVC) | 1 | 25 | N/A |
| Oligocene | | | 32 | | 6.72 | | 5.2 |
| Eocene | | | 104 | | 6.19 | | 3.9 |
| Cretaceous | | | 4 | | 9.25 | | 3.6 |
| | | Total: 229 | Mean: 11.06 | Standard deviation (all samples): 7.5 |
Table 7.
Mean porosity of samples per FAs from Miocene deposits.
Table 7.
Mean porosity of samples per FAs from Miocene deposits.
| FAs | Number of Samples | Mean Porosity (%) |
|---|
| Fl.ch | 21 | 20.24 |
| FL.v | 21 | 17.88 |
| B/L | 10 | 20.90 |
| SW | 13 | 21.23 |
| LSF.d | 1 | 25.37 |
| MB | 1 | 25.00 |
| DF | 2 | 15.50 |
| PDT | 1 | 16.50 |
| DS | 7 | 16.00 |
| | Total: 77 | Mean: 19.42 |
| Disclaimer/Publisher’s Note: The statements, opinions and data contained in all publications are solely those of the individual author(s) and contributor(s) and not of MDPI and/or the editor(s). MDPI and/or the editor(s) disclaim responsibility for any injury to people or property resulting from any ideas, methods, instructions or products referred to in the content. |
© 2023 by the authors. Licensee MDPI, Basel, Switzerland. This article is an open access article distributed under the terms and conditions of the Creative Commons Attribution (CC BY) license (https://creativecommons.org/licenses/by/4.0/).


 ,
, 


