Article

Reappraisal and Analysis of Macroseismic Data for Seismotectonic Purposes: The Strong Earthquakes of Southern Calabria, Italy

by
Carlo Andrenacci
1,2,
Simone Bello
1,2,*,
Maria Serafina Barbano
2,3,4,
Rita de Nardis
1,2,
Claudia Pirrotta
2,3,
Federico Pietrolungo
1,2 and
Giusy Lavecchia
1,2
1
DiSPuTer, University G. d’Annunzio, Via dei Vestini 31, 66100 Chieti, Italy
2
CRUST–Interuniversity Center for 3D Seismotectonics with Territorial Applications, 66100 Chieti, Italy
3
Department of Biological, Geological and Environmental Sciences, University of Catania, 95129 Catania, Italy
4
Istituto Nazionale di Geofisica e Vulcanologia, Osservatorio Etneo, 95125 Catania, Italy
*
Author to whom correspondence should be addressed.
Geosciences 2023, 13(7), 212; https://doi.org/10.3390/geosciences13070212
Submission received: 18 April 2023 / Revised: 29 June 2023 / Accepted: 10 July 2023 / Published: 14 July 2023
(This article belongs to the Special Issue Geodynamics and Seismotectonics in the Mediterranean Region)

Abstract

:
In tectonically active areas, such as the Italian peninsula, studying the faults responsible for strong earthquakes is often challenging, especially when the earthquakes occurred in historical times. In such cases, geoscientists need to integrate all the available information from historical reports, surface geology, and geophysics to constrain the faults responsible for the earthquakes from a seismotectonic point of view. In this paper, we update and review, according to the EMS-98 scale, the macroseismic fields of the five main events of the 1783 Calabria sequence (5, 6, and 7 February, 1 and 28 March, Mw 5.9 to 7.1), two other destructive events within the same epicentral area of the 1783 sequence (1791, Mw 6.1 and 1894, Mw 6.1), plus the Messina Strait 1908 earthquake (Mw 7.1). For the 1783 seismic sequence, we also elaborate an updated and new catalog of coseismic effects. The new macroseismic fields were analyzed using a series of MATLAB algorithms to identify (1) the unitarity of the field or its partitioning in sub-sources and (2) the field and sub-fields’ main elongation. A collection of earthquake scale laws from literature was used to compute the average source parameters (length, width, and area) with their range of variability, and an elliptical map-view representation of the source geometry was calculated and made available. The analyses of such data allow us to speculate on the earthquakes/faults association, as well as propose new interpretations and reconstruct the space–time evolution of the significant southern Calabria seismic sequences in the last five centuries.

1. Introduction

Since historical times, the Italian peninsula has been the scene of destructive (Mw up to 7.1) extensional earthquakes [1]. In the instrumental age, these major events and other minor-magnitude seismic sequences are recorded with extreme precision, allowing the seismogenic sources to be delineated in detail (e.g., [2,3,4,5,6,7,8,9,10,11,12]). However, when it comes to pre-instrumental seismicity, the challenge is quite different. Historical earthquakes in areas with a long history of destructive events are essential for seismotectonic and seismic hazard purposes, especially when instrumental seismicity is moderate or almost missing. This is the case of the Southern Calabrian Arc, in the area between the Catanzaro Basin and the Messina Strait, which, after a paroxysmal activity, with six Mw 6.5–7 events in 125 years from 1783 to 1908 and other two Mw 6 events in 1791 and 1894 [1,13,14,15], has only experienced small events with a few minor isolated sequences (Mw < 4.5) [16]. Therefore, in such cases, the burden of identifying the potential seismogenic faults must prevailingly rest on field and paleoseismic data on active faults (e.g., [17,18,19,20,21,22,23,24,25,26,27,28,29]), geodetic information (e.g., [30,31,32,33]), and indirect information from the intensity fields distribution and historical reports (e.g., [34,35,36,37,38,39,40,41]).
In this paper, we propose a systematic revision of the macroseismic fields of the events with Mw > 6.0 from 1783 to 1908, located onshore along the axis of the Southern Calabria ridge. In particular, we reinterpret, according to the European Macroseismic Scale (EMS-98) criteria ([42]), the intensity points of the five main events of the 1783 sequence (5, 6, and 7 February and 1 and 28 March, Mw 5.9 to 7.1, according to CPTI15 [1]) and the 1791 and 1894 events (Mw 6.1 and Mw 6.1, respectively, according to CPTI15 [1]), which fell within the same epicentral area of the 1783 sequence, plus the Messina Strait 1908 earthquake (Mw 7.1, according to CPTI15 [1]). Furthermore, in the case of the 1783 seismic sequence (hereinafter 1783-SS), we also elaborate an updated and new catalog of coseismic effects.
We analyze the distribution of the EMS-98 intensity data points to derive the macroseismic epicentral coordinates and equivalent magnitude according to classic approaches [42]. We also investigate, with a novel approach, a possible partitioning of the macroseismic field in sub-sources, calculate the macroseismic field elongation, and compute the average earthquake source parameters with their ranges of variability from scale laws [21,43,44,45,46,47,48,49,50,51,52,53,54]. We compare the source parameters with the outcropping active faults’ geometry and advance alternative hypotheses on the earthquake/fault associations. Finally, we reconstruct the time–space evolution of the seismicity and identify an ideal transect across the axis of southern Calabria during the last five centuries.

2. Seismotectonic Setting

2.1. Tectonic Framework

The Southern Calabrian Arc, located between the Catanzaro Basin and the Messina Strait, is the area of Italy with the highest seismic potential. In a time-lapse of 125 years, from 1783 to 1908, it experienced five events (e.g., 5 and 7 February and 28 March 1783, 8 September 1905, and 28 December 1908) with a magnitude greater than 6.5 ([1]), causing up to 100,000 casualties over an area extending ~130 km in the NE–SW direction along the mountain chain axis and, on average, 50 km perpendicular to it, from the Tyrrhenian coast to the Ionian coast (Figure 1).
The seismogenic faults of southern Calabria represent the southern continuation of the NW–SE-trending late Pliocene-Quaternary Intra-Apennines extensional belt (sensu [55]). Along the Apennines, this belt dislocates the Meso-Cenozoic terrains of carbonate platform terrains and/or a pelagic multilayer (e.g., [7,17,18,24,56,57,58,59,60,61,62,63,64,65,66,67,68,69,70,71]); in Calabria, it dissects uplifted crystalline basement rocks (Serre and Aspromonte mountain ranges) and bounds major Plio-Pleistocene basins on the eastern side (Mesima, Gioia Tauro, and Reggio Calabria) [72,73]. The extensional fault system of southern Calabria continues southward across the Peloritani mountains of NE Sicily [74]. Northward, it is transversally bound by the SSW-dipping Lamezia-Catanzaro Fault System (LCFS).
Geological fault/slip data along southern Calabria faults indicate a prevailing near-pure dip-slip extensional deformation with minor local strike-slip components associated with a WNW–ESE-trending T-axis [75]. Earthquake focal mechanisms at the upper crustal depths (<15 km) provide a prevailing WSW–ENE tensional field across all of southern Calabria [76,77]. Morphological and stratigraphic data indicate that the different fault segments are characterized by long-term (since Middle Pleistocene) vertical slip rates ranging between 0.5 and 1.2 mm/y [22,73]. The tectonic environment here hosts the historical seismic events shown in Figure 1b.
In Figure 1a, we show a schematic geological structural map of the area obtained by integrating data from the literature [20,22,72,73,77,78,79,80,81,82,83]. Across the southern Calabrian ridge, three WNW-dipping major faults (MF) dissect Late Pleistocene-Holocene sediments (Figure 1a). From north to south, they are known as follows:
(1) The Serre MF, extending for ~50 km along-strike, dipping at a high-angle WNW-ward, and bounding on the east side of the Mesima basin. On the west side, the basin is dissected by the ESE-dipping Mileto fault, with an extent of ~30 km. Northward, the Serre MF possibly continues with the recently detected WNW-dipping Caraffa fault system [81].
(2) The Cittanova-Delianuova MF (composed of the two homonymous fault segments, i.e., Cittanova and Delianuova) developing southward of the Serre fault, extending for a length of ~45 km, and dipping at a high-angle WNW-ward on the east side of the Gioia Tauro Basin [22]. The SSW-dipping transfer Rosarno fault separates the Gioia Tauro from the Mesima basin [84]. The extensional fault continues southward of the Delianuova segment for a further 20 km, with the WNW-dipping Armo fault.
(3) The Sant’Eufemia d’Aspromonte-Reggio Calabria fault alignment, developing in a right-stepping position with respect to the Cittanova-Delianuova MF. It consists of two distinct segments: the NNW-dipping Sant’Eufemia d’Aspromonte fault and the WNW-dipping Reggio Calabria fault, the latter bounding the Reggio-Calabria basin.
The S-dipping LCFS bounds the Catanzaro Basin northward, which develops in an average E–W direction, transversally to the N–S Crati Basin to the north and the NNE–SSW Mesima Basin to the south [20,60,79,83,85].
The LCFS is ~40 km-long, consists of WSW–ENE to WNW–ESE striking segments, and offsets Late Pleistocene–Holocene terraces. The fault system is well exposed in the western sector [86], whereas it shows subtle evidence in the eastern sector. The NE-dipping Vallefiorita fault is a relevant structure close to the Ionian coast, juxtaposing crystalline rocks with Pliocene–Middle Pleistocene deposits [79] (Figure 1a).
Figure 1. Seismotectonic framework of the study area. (a) Major late Quaternary-Pliocene extensional fault system (see main text for references). Rose diagram plots refer to: (1) Lamezia-Catanzaro Fault System; (2) Serre fault system; (3) Cittanova fault; (4) Delianuova and Santo Stefano faults; (5) Armo and Reggio Calabria faults; (6) Scilla and Sant’Eufemia dell’Aspromonte faults; (7) Messina and WF faults; (8) Rosarno faults; (9) Vallefiorita faults (described in the next section). Each minor circle within the rose diagram represents a step count of 5 items. (b) Major historical earthquakes from the Italian Parametric Catalogue (CPTI15 v4.0, [1,15]) from 1000 to 2020 are noted in the yellow squares and indicate the historical earthquakes studied in this paper. (c) Location map; red, blue, and green lines represent the crustal (≤40 km) deformation field from the P and T axes of focal mechanisms present in the TDMT (Time Domain Moment Tensor) catalog [86] (1985–2023).
Geosciences 13 00212 g001

2.2. Seismic Sources in the Literature

The attribution to the respective seismogenic sources of the earthquakes studied herein has long been debated, mainly due to the often absent or scarce coseismic effects of primary faulting. Most historical sources describe the 5 February 1783 earthquake (Mw 7.1) as long with multiple events, possibly rupturing several fault segments [72]. In 1784, Dolomieu [87] described a ~18 km long and 1-m wide surface fracture that occurred during the 5 February 1783 event along the Cittanova fault. Jacques et al. [72] and Galli and Bosi [26] considered it as clear evidence of surface faulting, attributing the earthquake to the W-dipping Cittanova fault [22,26] or the Cittanova and Sant’Eufemia faults [72,78,88] (Figure 2a). Some authors identify the source of this earthquake in a blind E-dipping low-angle normal fault on the west side of the Gioia Tauro basin [83,89,90] (Figure 2a). Similarly, the 7 February event (Mw ~6.7) was associated with either an E-dipping large normal fault (Mileto Fault in Figure 1) bounding the Mesima graben [91,92] (Figure 2b) or the W-dipping Serre fault [93,94].
The 6 February and 1 March events are not localized in the Italian parametric catalogs [95] because earthquakes with less than ten intensity data points or incomplete intensity distributions were discarded from the dataset [34]. An S-dipping transversal strike-slip fault located, between the uplands of the Serre Mts. and the Gioia Tauro Plain and the Cittanova and Serre fault has been proposed for the 6 February 1783 earthquake [83] (Figure 2c).
The source of the 28 March event is questioned even more. This event is the second most energetic of the overall 1783-SS (Mw ~7.0), although it may have been overestimated because it was the last shock of a long-lasting destructive sequence. The event generated destruction at the hanging wall of the Serre fault, but also largely expanded toward the Ionian coast. Some authors [85,96] propose the activation of the S-dipping LCFS along the northern border of the Catanzaro basin. This fault would represent the surface expression of an E–W deep transform [97], allowing the SE-ward advancement of the Calabrian arc in the overriding plate. Other authors hypothesize NS-striking [98] or NNW–SSE- striking [99] sources on the Ionian slope of the Catanzaro basin (Figure 2b). Pirrotta et al. [81] proposed the NNW-dipping Caraffa fault system as the source responsible for the event.
The 1791 (Mw 6.1) and 1894 (Mw 6.1) earthquakes are less represented in the literature of pre-instrumental earthquakes. The former struck the Serre chain in the same epicentral area as the event of 7 February 1783; in fact, it is associated with a possible triggering phenomenon related to the 1783-SS. The epicenter of the 1894 earthquake was located on the northern slope of Aspromonte, in an area just south of the 5 February 1783 mesoseismic zone. Two N-dipping transverse strike-slip faults between the uplands of the Serre Mts. and the Gioia Tauro plain and the Cittanova and Serre faults, one onshore and one offshore of Scilla in the Tyrrhenian Sea, have been suggested for this earthquake [83] (Figure 2c).
Regarding the seismogenic fault of the 1908 earthquake (Mw 7.1), the scientific community is divided into two groups: one supporting a high-angle NW-dipping onshore Calabrian fault [84,100,101], the other an offshore low-angle SE-dipping major fault in northern Sicily [30,90,91,92,102,103,104]. A large amount of the literature discusses this problem and an updated overview may be found in Barreca et al. [74]. Mulargia et al. [105] considered the possibility of simultaneous activation of both faults, particularly of the southern portion of the W-dipping Reggio Calabria fault and the northern portion of the Messina E-dipping fault [84] (Figure 2d). In this paper, we consider it useful to provide a shapefile containing all the seismic sources of the various earthquakes in the literature previously discussed (Supplementary Data S1).
Figure 2. Overview of major seismic sources of southern Calabria in literature. Keys: (a) 1 = [84]; 2 = [90]; 3 = [20]; 4 = [22]; 5 = [72]; 6 = [78]; 7 = [88]; 8 = [87]. (b) 1 = [84]; 2 = [92]; 3 = [95]; 4 = [99]; (c) 1 = [84]; (d) 1 = [84]; 2 = [74]; 3 = [103]; 4 = [100]; 5 = [90]; 6 = [104]; 7 = [105]; 8 = [91]; 9 = [101]; 10 = [92].
Geosciences 13 00212 g002

3. Data and Methods

In this study, we present an innovative methodology that utilizes EMS-98 macroseismic field intensity points as the basis. By incorporating a statistical analysis of the intensity data points, examining relevant scale-laws from existing literature, and utilizing information on the coseismic and Quaternary fault pattern, our approach enables the identification of potential associations between earthquakes and faults. We have compiled a workflow diagram in the Supplementary Materials (Figure S1) to summarize the methodological steps described below.

3.1. Tectonic Trends Determination

The determination of tectonic trends of the potentially seismogenic faults of the study area is the first step of the procedure, as it serves to validate the trends obtained from the analysis of macroseismic fields. This step entails compiling fault traces from the literature (i.e., the faults described in the “Tectonic setting” section above) on a GIS platform and establishing the average trends, taking into account variations along the strike of any given structure. To generate directional rose diagrams, depicted in Figure 1, we first used ArcGIS functions to resample the fault traces with a sampling step of 1 km. Then, we selected the fault traces, taking into account the segmentation of the structures. Finally, we plotted the trends in rose diagrams to highlight the mean directions and, by distinguishing the plots from each other, the bends in the main fault alignments (Figure 1a). Table 1 shows the average trends and dip directions of the fault groups represented in the rose diagram plots.

3.2. EMS-98 Intensity Fields

We reanalyzed the historical sources reported in the CFTI5Med catalog [106] by using the original historical accounts reported in the Supplementary Data S2. We reassessed the intensity of the selected strong earthquakes using EMS-98 [38], which estimates the intensities by considering the buildings’ vulnerability class and damage level. This scale has recently been used by many geoscientists (e.g., [37,107,108]) because the Mercalli–Cancani–Sieberg (MCS) scale usually used in the historical catalogs [1,106] does not take into account the building typology. We considered that almost all the buildings were of vulnerability class A and few were of Class B, as described in most of the contemporaneous sources. The use of poor-quality construction materials, often rubble stones, and the widely adopted construction technique known as “a sacco”, which used bare stones, poor-quality mortar, and slight stone facades (buildings of vulnerability class A) (e.g., [109]), were usually the cause of the widespread collapse of many buildings. Only a few masonry buildings (simple or massive stone, i.e. buildings of vulnerability class B) were constructed in the towns, especially as noble palaces and religious buildings, such as monasteries and churches (e.g., [109,110]). When it was not possible to estimate the percentage of the damaged buildings and/or the level of damage, the intensity was assigned using uncertain values (i.e., 5–6 to 10–11 EMS-98).
Regarding the 1783-SS, many coeval reports are available. However, the overlap of numerous shocks in a very limited time and space makes interpreting the historical data difficult, since historical accounts describing damage in several localities do not distinguish between the shocks.
To separate the effects of the different shocks, we analyzed the descriptions of the event from single localities and compared the corresponding times that the shocks were felt with the times the shocks were felt at the other sites. After having unraveled a tangle of multiple dates, hours, and spurious connections between several earthquakes, we identified collections of historical data dealing with single seismic events and assessed the intensities considering the cumulated effects of different shocks. In particular, we reanalyzed the events with Mw > ~6 recorded along the southern Calabria ridge, between the Catanzaro and Messina straits, i.e., the five main shocks of the 1783-SS, the 1791 event located close to the third 1783 event, the 1894 event located close to the first 1783 event, and the 1908 earthquake (see Figures S2–S9 in the Supplementary Materials).

3.3. Coseismic Features

In this paper, for the 1783-SS, we compiled an updated database of the coseismic effects (e.g., CEDID [111] and the EEE catalog (http://eeecatalogue.isprambiente.it/viewer.php, accessed on 26 May 2023)), starting from the references reported in the CFTIMed catalog [106] and integrating it with Cucci [112]. We reanalyzed the primary contemporaneous sources and relocated the coseismic effects distinguishing ground fracturing and openings, landslides, liquefaction phenomena, and hydrogeological anomalies (map reported in the Results section). For completeness, we provide the dataset as a shapefile for further use (Supplementary Data S3). The coseismic dataset provides information on the maximum ground shaking and possible coseismic faulting. Most of the coseismic effects, such as ruptures or openings, align along the main faults of the area or at their hanging wall. In the Supplementary Data S2 (see Tables S1–S4), we compiled detailed tables for each seismic event, reporting a description of the earthquake, the coseismic effects reported by historical sources in the original language and translated, all historical sources, and the revisited macroseismic field. There are also other papers that assemble and describe the coseismic effects of the Calabria earthquakes (e.g., [13,20,113,114,115,116,117]) that used the same historical sources for different purposes, such as paleoseismological research and application of the ESI intensity scale based on earthquake environmental effects (i.e., EEE) [118,119].

3.4. Macroseismic Field Statistical Analysis

3.4.1. Macroseismic Field Partitioning

Based on the area of the maximum macroseismic intensity of an earthquake, it is possible to assume that the hypocenter of the earthquake and the seismic source are located near the most affected locations [36,38]. However, this approximation must consider uncertainties arising from the analysis of the data and historical sources used to reconstruct the macroseismic field associated with the earthquake (lack or uncertainty of historical sources, absence of inhabited locations, local amplification effects, cumulative damage, vulnerability of buildings, etc.) and geological structural complexities, such as the involvement of multiple seismogenic sources.
The recent central Italy 2016 extensional seismic sequence has taught us that individual earthquakes may have a complex source, with synchronous activation of distinct fault segments or different faults. This is the case of the 24 August event (Mw 6.2), consisting of two neighboring twin sources [120,121,122], and the 30 October (Mw 6.5) event, characterized by a major off-fault deformation that also affected a different structure from the main seismogenic one [6].
To identify potential macroseismic sub-fields representing individual sub-sources during major historical events, a comprehensive analysis of the spatial distribution of the intensity field is essential. Therefore, we have developed a MATLAB code structured as follows:
  • Intermediate macroseismic intensities within the given macroseismic field (i.e., uncertain classes) are reassigned to the lower class (e.g., intensity points IX–X are assigned to class IX).
  • Points corresponding to the highest intensity class (Imax) are selected, as indicated by the points within the dashed line in Figure 3a. If there are only a few points, additional classes can be selected.
  • Using the selected intensity points, the KMEANS function is applied to identify two sub-clusters and their centroids (yellow dots in Figure 3a).
  • If the number of selected points is ≥10 and the two centroids are more than 10 km apart, the intensity points within the overall macroseismic field are partitioned into sub-fields according to their proximity to one of the centroids (Figure 3b).
  • If the conditions specified in step 4 are not met, no partitioning of the macroseismic field occurs, and it remains unmodified.
The pursuit of these steps clearly cannot disregard the importance of conducting a first-order geological assessment to validate the meaningfulness of any sub-clusters that may be statistically obtained. This is an additional and preliminary step that serves as a crucial test to ensure the reliability and significance of the identified sub-clusters. As in other cases in the literature [36,123], our methodological workflow cannot take into account such very detailed complexities (i.e., at the scale of the seismic microzonation [107,124]); it follows a statistical path that does not consider the local effects (well highlighted, for example, by Teves-Costa and Batlló [125]) or other problems arising from the intensity assessment for historical earthquakes; for these reasons, the control exerted by the geoscientist is vital. Specifically, as regards our study area, in which we obtained a partition of the macroseismic field, we verified that there was no correspondence with clear variations of the geological substrate typologies (rock types) on the most up-to-date existing geological maps.

3.4.2. Macroseismic Epicenter and Equivalent Magnitude

We obtained new EMS-98 macroseismic intensity data for the largest earthquakes of southern Calabria and, following the Boxer software (Version 4.2.1, 2022) approach [36,123], we estimated the centroid of the largest intensities, assumed to correspond to the earthquake epicenter position (yellow star in Figure 3c). With the same code, we evaluated the equivalent magnitudes of the overall macroseismic field and of the macroseismic subfields where we partitioned it.

3.4.3. Macroseismic Field Elongation Axis

The elongation of a macroseismic field may be calculated by applying different functions (see e.g., [123]). In this study, the macroseismic field’s elongation trend was identified by calculating the best-fitting longitudinal and transverse axes delineating an ellipse. To compute the ellipse, we used a MATLAB function (modified from “Statistical Methods in the Atmospheric Sciences”; https://waterprogramming.wordpress.com/2016/11/07/plotting-probability-ellipses-for-bivariate-normal-distributions/ accessed on 1 February 2023). This function calculates and plots the probability ellipses for bivariate normal distributions. Given a set of points, the code plots the constant probability elliptical contour (i.e., 50%, 80%, 90%, and 99%) within which a given percentage of the distribution lies. The ellipses are constructed with respect to a central point representing the distribution’s centroid relative to the averages of the macroseismic point locations used in the probability calculation.
In particular, to compute the direction of the macroseismic elongation axes, we developed a MATLAB code that (1) selects the macroseismic field points that have intensity ≥ Imax − 1 (intensity points from 9.5 to 10.5 in Figure 3c); (2) calculates the probability ellipses for bivariate normal distributions, i.e., the constant probability contour (50%, 80%, 90%, and 99%) within which a given percentage of the distribution lies and its centroid; (3) represents the probability contour of 80% (red dashed ellipses in Figure 3c) and selects the points that lie within the ellipse; (4) recalculates the probability ellipses for bivariate normal distributions, as described in step (2), using only reselected points (black crosses in Figure 3c indicate the outlier points excluded from the calculation); and (5) selects the 80% probability contour ellipse and calculates the direction and length of the minimum and maximum axes of the ellipse (red ellipses in Figure 3c).
The orientation of the maximum axes of the ellipses provides valuable constraints into the orientation of the seismic sources responsible for the earthquakes. Such information and the possibility of subdividing a total macroseismic field into statistically constrained sub-clusters must be evaluated in light of the geological and instrumental constraints on the orientation of the potentially seismogenic sources of the area. To test the reliability and validity of the method, we ran it using macroseismic data from the 2009 L’Aquila earthquake of central Italy (Mw 6.2), obtaining results comparable to what was observed with instrumental data. As shown in Figure S10 in the Supplementary Materials, the macroseismic axes of the ellipse obtained with our method deviate less than 10° compared to the trend of the seismogenic structure constrained with instrumental seismology and source models from various authors [84,126,127,128,129].

3.5. Scale Law for Earthquakes Source Sizing

3.5.1. Scale Law in the Literature

In the case of historical earthquakes, at best, the available parameters to define the geometry of the fault rupture are the earthquake equivalent magnitude together with possible information on (i) the fault surface rupture length (SRL) from historical reports, (ii) the long-term outcropping extent of possibly seismogenic faults and their average dip-angle, and (iii) the thickness of the seismogenic layer and the fault kinematics from local instrumental data. Since the pioneering research by Wells and Coppersmith [53], many authors have tackled the scaling of earthquake faults in different tectonic contexts, relating magnitude (Mw) and seismic moment (Mo) to different parameters, such as SRL, sub-surface rupture length and width (L and W), rupture area (A), and coseismic displacement (D). As a result, many empirical laws and corresponding regressions are available in the literature, developed for specific tectonic contexts and with different types of data input. For example, most authors use seismological data, such as the spatial pattern of early aftershocks of seismic sequences and the thickness of the seismogenic layer, or geological data, such as the extension of the outcropping fault and the coseismic rupture at the surface (e.g., [21,44,45,46,53]). Others use seismic and geodetic data to reconstruct the seismogenic source parameters using finite-fault earthquake source inversion methods ([43,47,50,51]).
In this paper, we consider a selection of scale laws computed for extensional settings around the world [43,44,47,48,49,50,51,52,53,54], specifically in Italy [21,50] (Table 2). In Figure 4, we separately represent, in logarithmic scale, the regression curves computed in the literature for scaling the relationships of Mw with SRL, L, W, and A.
We have made available a “user-friendly” Excel spreadsheet that allows for the calculation and comparison of all the different parameters (See Supplementary Data S4).
We observed systematic variations in the scaling law values due to the typology and quality of the data input used to perform the linear regression, e.g., geological or seismological data. Generally speaking, scaling laws computed with earthquake data, from both a hypocentral database and source models [45,46,47,51], correspond to the predicted size of the geometric parameters (A, L, W, SRL) for any given M, with respect to the geological data input. Additionally, the extent of the earthquake catalog significantly influences the results.
Most of the M-SRL regression lines compiled in this paper (Figure 4a) have a similar slope and close positions, except for Pavlides and Caputo [49] and Wesnousky [54], which are significantly different and more conservative because they assign smaller SRL than others for the same M.
The M-L regression lines (Figure 4b) show consistent trends, except for the Martin Mai and Beroza [47] law, which tends to underestimate L. Greater differences are observed at M < 6.0, where the corresponding L shows greater variability for the same magnitude.
The M-W regression lines (Figure 4c) are less common in the literature, and the variability of the results is large for both high and low M.
The M-A regression lines (Figure 4d) all have similar slopes, but a wide range of variability between the lowest and highest values for all the magnitude ranges (i.e., more than a half point in M).

3.5.2. Determination of Seismic Source Size

The analyzed scaling laws show the high range of variability of the source size that may be calculated for the same earthquake with a given magnitude. To qualitatively associate a reference value with its range of variability to any magnitude, we prepared a function in MATLAB that returns the average values (SRL, L, W, and A) with their standard deviation between the highest and lowest values. As an example, in Figure 4, we represent an Mw 6.5 earthquake (yellow star) projected on the regression lines within the space delimited by the vertical dotted lines representing the computed standard deviation.
Our specific aim in this paper is to determine the size of the herein investigated Calabria historical earthquakes starting from the newly computed equivalent magnitudes, considering both the total and the partitioned sources.
Once the extensional kinematics from independent long-term geology and instrumental seismology were determined, we derived the average A, L, and W parameters and their variability (represented by the standard deviation) from the regression laws previously discussed.

3.5.3. Map-View Earthquake Source Representation

Most commonly, individual earthquake sources are represented in map-view as rectangular boxes (e.g., [81]), dimensioned by L and width surface projection (Ws). In order to calculate the Ws, we assume a dip-angle of 60° is suitable with extensional settings and fault/slip data available for the southern Calabria region [20,26,73,75,93,94,130,131].
An alternative graphical representation we propose in this paper is that of elliptical-shaped sources, which better approximate the physical model of the seismic rupture propagation on the fault plane [132], also highlighted by earthquake interferometry (e.g., [133,134,135]). The ellipse must have the same areal extent as the rectangular source and an ellipticity controlled by a long-to-short axes ratio equal to the L/W ratio, directly derived from the scale laws. The following equations summarize the steps described above:
Ratio = R = Length/Width,
Semi - minor   axis = b = Area R   ×   π
Semi - major   axis = a = Area b   ×   π
Surface   semi - minor   axis = b cos 60 °
Based on these formulas, we developed a MATLAB code that calculates the average elliptical seismic sources oriented and centered with respect to the ellipse representing the elongation of the macroseismic field (Figure 4d).

4. Results

4.1. The Revised EMS-98 Intensity Fields

4.1.1. 1783 Central-Southern Calabria Seismic Sequence

The devastating 1783-SS, which started on 5 February 1783 with a Mw 6.8 event, was followed by a long series of shocks that migrated NNE-ward from the Messina Strait, along the axis of the Calabrian Arc. More than 180 localities were nearly destroyed and there were more than 30,000 victims. The aftershocks lasted for about ten years. There were five earthquakes in 2 months with Imax X-XIEMS and Mw between 6.0 and 6.8. The sequence caused a geomorphological crisis that changed the Aspromonte and Serre Mts. landscape (Figure 5), triggering ground-fracturing, landslides, and liquefactions, and inducing a significant change in the fluvial network, with deviation and damming of the fluvial channels, as well as the formation of numerous lakes [13] (see Table S1 in Supplementary Data S2 and Supplementary Data S3).
The area with the strongest effects of the 5 February shock is located on the Tyrrhenian side of the Calabrian Apennines (Figure 6a and Figure S2). The effects of this earthquake brought a few changes. The maximum intensity assigned is X-XI IEMS for two reasons: (i) to take into account the buildings’ vulnerability and (ii) to account for the cumulated effects of more shocks in a short time. Most of the buildings were of vulnerability class A and a few were class B, and some buildings were left standing, indicating that the intensity was certainly X (most buildings of vulnerability class A sustained damage of grade 5 (collapse), but it could have been intensity XI (destruction: very heavy structural damage of most buildings of vulnerability class B) [42]. Without knowledge of the precise number of buildings, we decided to use this uncertainty. Mainly for historical earthquakes, the macroseismic scales, including EMS-98 from degrees X to XII, demonstrated saturated levels of damage, losing their diagnostic value (see [118]). Furthermore, most of the accounts report that the data were gathered after that all the sequences had occurred, making it possible that the destruction was the result of the cumulated effect of more shocks. Moreover, in the area of the Strait of Messina on both the Sicilian and Calabrian sides, the intensities of some localities with higher values than the neighboring ones were decreased (Table S5 in Supplementary Data S2). These localities have been added to the earthquake of 6 February (Figure 6b and Figure S3). In fact, this earthquake is known above all for the tsunami that struck Scilla and Torre Faro [136]. Nevertheless, several historical sources (see Table S1 in Supplementary Data S2) describe this shock as being as violent as the previous one, but of shorter duration than the first. This earthquake mainly caused damage in Messina and some nearby towns and villages, as well as in Reggio (IEMS = VIII-IX). Since this shock occurred about twelve hours after the initial shock, information was reported for only a few localities. By using the new intensity values (Table S6 in Supplementary Data S2), the epicenter is moved southernmost with respect to the previous one [103].
The next day, on 7 February, the earthquake moved NE, towards the Mesima valley (Figure 6c and Figure S4) on the Tyrrhenian side of the Serre chain (IEMS = X-XI). Most of the localities (Table S7 in Supplementary Data S2) were already damaged by the previous shocks.
On 1 March, at 08.30 Italian time (01.40 GMT), an earthquake was felt across a wide region between Messina and the northern border of the Calabria region, with the area of the maximum effects (IEMS = VIII-IX), which moved further north (Figure 6d and Figure S5) along the Apennines. The most affected villages were Polia (now known as Trecroci), Poliolo, Castelmonardo, and Francavilla Angitola (Table S8 in Supplementary Data S2). The 28 March earthquake (X-XI IEMS) was felt throughout southern Italy. The most affected area was in the Catanzaro basin, with damage both on the Ionian and the Tyrrhenian sides (Figure 6e and Figure S6). This is the northernmost greatly damaged area of the entire seismic sequence (Table S9 in Supplementary Data S2). The extended area of damage was likely due to the cumulated effects of more shocks; indeed, on the Tyrrhenian side, some localities were already badly damaged by another minor shock that occurred on 28 February, as well as the 1 March earthquake.

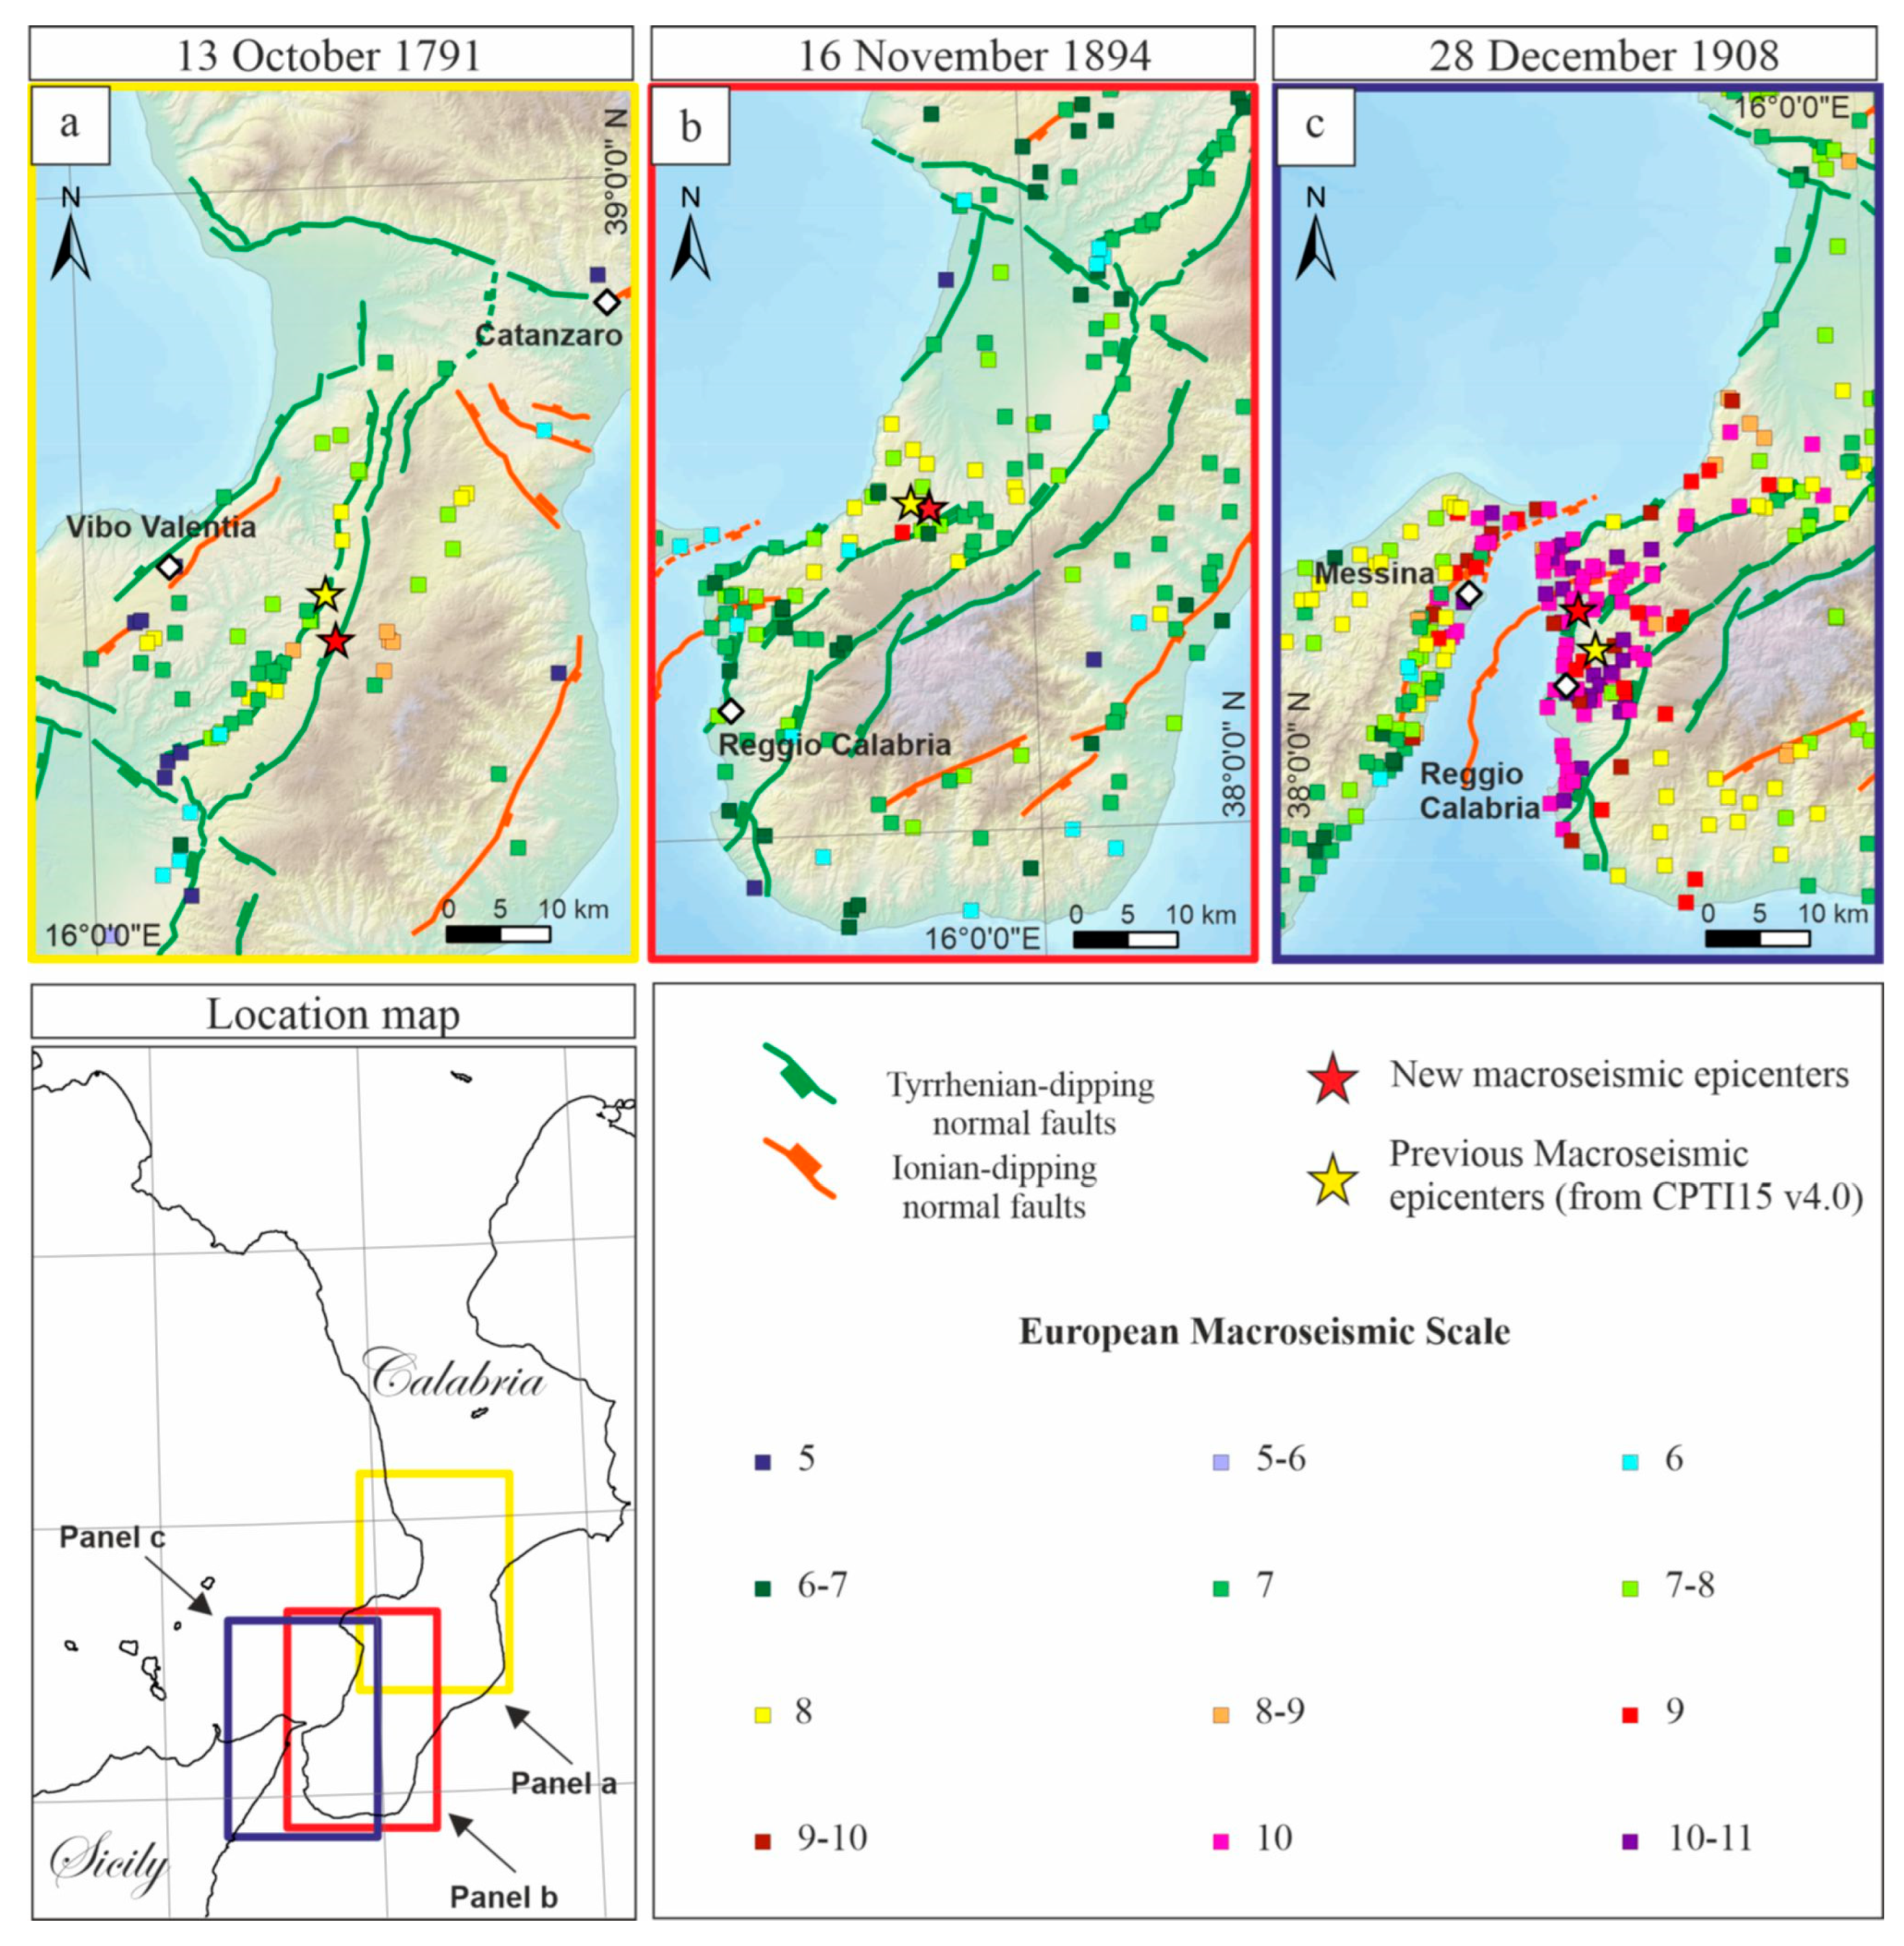
4.1.2. 1791 Central Calabria, 1894 Southern Calabria

The 13 October 1791 (Mw 5.9) earthquake damaged the area hit by the 7 February 1783 earthquake (Figure 7a and Figure S7). The seismic sequence lasted until 20 October. The Imax was VIII-IX IEMS and the estimated magnitude was equal to 5.89. There were 15 victims. The most damaged towns were Spadola, Simbario, Serra San Bruno, and Soriano (Table S10 in Supplementary Data S2). The buildings that were impacted in the last village were strongly conditioned by the previous earthquakes.
The 16 November 1894 (Mw 6.1) earthquake affected southern Calabria and eastern Sicily and had destructive effects in an area of 80 km2 between the Aspromonte plains and the Tyrrhenian coast (Figure 7b and Figure S8). San Procopio and Sant’Eufemia d’Aspromonte were the most damaged villages (IEMS = IX, Table S11 in Supplementary Data S2), with many buildings collapsed totally or in large parts. In 17 other localities in the province of Reggio Calabria (including Bagnara Calabra, Palmi, and Seminara), the earthquake caused a few collapses (see Table S3 in Supplementary Data S2), but most of the buildings suffered serious damage, structural failures, and partial collapses. In Messina and Reggio Calabria, many buildings were damaged, some heavily. There were two foreshocks before the mainshock and several aftershocks until 16 June 1895. The Imax was IX IEMS and the Mw was 6.1. There were 96 victims.

4.1.3. 1908 Messina Straits Earthquakes

The 28 December 1908 earthquake (Mw 6.8) (Figure 7c and Figure S9) and subsequent tsunami devastated southern Calabria and northeastern Sicily. The double catastrophe destroyed Messina, Reggio di Calabria, and dozens of nearby coastal towns (Table S12 in Supplementary Data S2). About 90% of the buildings in Messina were destroyed [131], with the worst damage in the central and northern parts of the city, which were built on soft soil and, therefore, were possibly susceptible to liquefaction. Damage was also reported as less severe in the western part of the city, particularly for structures built on more compact terrain, such as around the Gonzago Castle (Table S4 in Supplementary Data S2). The large number of damaged buildings highlighted the vulnerable nature of the building stock in Messina at that time [109]. Poor-quality construction materials were blamed for the widespread collapse of many buildings. Buildings constructed with better quality materials or practices were less prone to collapse [137]. The main event lasted 30–40 s with Imax = X-XI IEMS and an Mw = 6.83 calculated with the Boxer code. The aftershocks lasted until 1913, and several shocks probably reached an intensity of VIII IEMS, but it is not easy to estimate the intensity when most of the buildings were nearly destroyed. Considering the historical reports, Baratta [109] identified two areas defined as “centers of shaking”, primary and secondary, respectively, obtained through observations on the direction of the shock. Observing the seismogram, Oddone [138] distinguished a second shock, which occurred five minutes after the first one. Rizzo [139] observed that the earthquake was characterized by a first pulse NNE–SSW orientation, followed by a stronger shock, ESE–WNW directed, and a third, even stronger series of vibrations along the NNE–SSW direction. This description would suggest the occurrence of multiple events related to the activation of different faults or fault segments. The number of casualties due to the Messina earthquake remains uncertain (between 60,000 and 80,000) [109].

4.2. Earthquake Source Parameters

Starting from the EMS-98 revised macroseismic fields and following the previously described methodological steps, for each earthquake, we analyzed and/or computed the following:
  • Tectonic trends of neighboring Quaternary tectonic structures;
  • Macroseismic field partitioning;
  • Equivalent magnitude and macroseismic epicenter;
  • Direction and length of the elongation axes of the macroseismic area;
  • Scale law-derived source size according to regression laws;
  • Elliptical seismic sources parameters.
Using the Boxer program (version 4.2.1, 2022), we first computed the equivalent magnitude and location of the macroseismic epicenters for all the newly estimated EMS-98 macroseismic fields [123]. Subsequently, we used the KMEANS algorithm in MATLAB to identify the presence or lack thereof of intensity point clusters (see Section 3.4.1), and in the case of a partitioned field, we recomputed the equivalent magnitude from Boxer. We specify that the equivalent magnitudes of the partitioned fields are not to be intended as sub-seismic events, but are necessary for calculating the respective seismic source’s size.
For all the identified fields, following the previously explained procedural steps, we calculated the directions and sizes (length and area) of the seismogenic sources and represented them in a GIS platform with both an elliptical and a rectangular map-view shape (Supplementary Data S5). In Table 3, the earthquake source parameters are also compared with the corresponding values in the CPTI15 v4.0 parametric catalog.
Subsequently, we proceeded to validate the seismic source parameters inferred from the macroseismic data by comparing them with the tectonic trends of the potentially as-sociated faults. This comparison enabled us to assess the consistency and compatibility between the observed macroseismic patterns and the known tectonic characteristics of the fault systems in the region.
A single elliptical source was evident for most events, except the first event of the 1783 sequence and the 1908 earthquake. We refer the reader to Table 3 for details on the earthquakes with the single sources computed.
For the 5 February earthquake (Mw 6.8), the code identified two clusters with centers ~17 km apart within the Gioia Tauro plain, both consisting of intensity points X and X-XI. This allowed us to divide the entire macroseismic field into two sub-fields: a northern one with 215 points and a southern one with 152 points (Figure S11). For the northern macroseismic field, the algorithm selected 22 points with intensities between X-XI and IX-X; for these points, a maximum elongation axis of ~23 km in the direction of N25° was determined (Table 3 and Figure S13a). On the other hand, the southern macroseismic field has an axis of maximum elongation 13 km long and oriented N59°, which was also calculated with 22 points selected (Table 3 and Figure S13a). Based on these data, we calculated, for the northern macroseismic field, a magnitude of 6.56 and an elliptical source with an average size of 392 km2 and an average length along the major axis of 27 km, oriented NNE–SSW. For the southern macroseismic field, the equivalent magnitude is ~6.6, and the resulting seismic source has an average size of 400 km2 and an average length of 27 km, rotating along the Aspromonte chain to NE–SW (Figure 8a).
For the 28 December 1908 earthquake (Mw 6.8), the code identified two clusters located north and south of the macroseismic epicenter with centers 14 km apart, both consisting of intensity points X and X-XI. This allowed us to divide the macroseismic field into northern and southern subfields of 497 and 317 points, respectively (Figure S12). The total equivalent magnitude associated with this earthquake is ~6.8, while, considering the separate partial macroseismic fields, we obtained magnitudes of 6.6 and 6.5 for the northernmost and southernmost fields, respectively. The estimated northern elliptical seismic source is ~ENE–WSW oriented, while the southern one is ~NNE–SSW, with an average area of 427 km2 and 345 km2 and a length of 28 km and 25 km, respectively (Figure 9c). For the northern source, the algorithm selected 51 points from the macroseismic subfield with intensities between X-XI and IX-X, resulting in a maximum elongation length of 23 km and a N80° trend. For the southern source, the macroseismic subfield can be described as having a length of 17 km, oriented N20°, using 35 selected points (Table 3 and Figure S14c). The obtained values can be underestimated because the areas are separated by the sea; therefore, the macroseismic field is not complete.
Among the analyzed fields, especially interesting is the 28 March 1783 earthquake, with a recalculated magnitude of ~6.8 and located in the middle of the Catanzaro basin (Figure 6e). Based on 23 macroseismic field points with intensities between X-XI and IX-X, the algorithm calculated an axis of maximum elongation of 25 km, N26°-oriented (Table 3 and Figure S13e). We obtained an elliptical seismic source with an average area of 715 km2 and an average length of 37 km, which crosses the Catanzaro basin and aligns approximately NNE–SSW with the Serre chain (Figure 8e). For a comparison of the seismic sources described here and trends of the tectonic structures shown in Figure 1, see Section 4.3.

4.3. Earthquake Sources Quality Parameters

For quality control, we assigned the quality parameters to the seismic sources obtained herein. The first quality parameter (defined as Qm in Table 4) indicates the degree of variability of the possible direction of the seismic source. This is calculated as the difference between the directions of the preliminary and final elongation axes (Figure 3c). Quality A corresponds to an angular difference ≤20°, B if between 20° and 40°, C if between 40° and 60°, and D if >60°. The second quality parameter (Qε in Table 4) considers the degree of ellipticity (ε) in terms of the shape ratio (the higher the ellipticity, the higher the quality); Quality A corresponds to ε ≥ 2, B if between 1.5 ≤ ε ≤ 2, and C if ε < 1.5. The third parameter describes the comparability with the seismogenic structures present in the area (see Figure 1 and Table 1). This parameter, defined as Qf in Table 4, corresponds to the difference between the direction of the seismic sources obtained in this paper and the faults’ trends of Table 1. In addition, in this case, quality A corresponds to an angular difference ≤20°, B is between 20° and 40°, C is between 40° and 60°, and D is >60°. As shown in Table 4, in most cases, we obtained high qualities (A and B), while we obtained medium–low qualities for the parameter Qm related to the 6 February 1783 event and Qf related to the northern sub-event of 28 December 1908. In the first case, this can be attributed to the presence of the Messina strait. In the second case, the low quality is due to the strike variability of the Messina fault and West fault (from NNE–SSW to ENE–WSW).

5. Discussion

5.1. Comparison of EMS-98 Intensities and MCS with Implications for Source Size

When studying historical earthquakes, the use of different seismic intensity scales can result in substantially different assessments of the damage that structures sustained as a result of shaking. Unlike the MCS scale, the EMS-98 scale classifies residential buildings into six vulnerability classes and assesses their damage distribution in five classes. This leads to a more specific attribution of earthquake damage among different buildings in a single location, and also takes into account the possible differences in construction techniques among different residential centers in a given earthquake-affected area [107]. The MCS intensity assignments are generally higher than EMS for the same initial data [140].
In this study, we observed an apparent reduction in the value of macroseismic intensities between evaluations with the EMS-98 scale and the macroseismic fields present in CPTI15, where the MCS scale is used. For the earthquakes analyzed, the epicentral intensity (I0) shows a reduction of half a degree, except for the events of 7 February 1783 and 16 November 1894 (Table 3). Such a difference, which is due to the use of an uncertain intensity value (e.g., X–XI), together with the review of historical reports and the re-attribution of the recorded damage to the respective earthquake events and sub-events, leads to the calculation of equivalent magnitudes lower than those generally attributed in the literature. In all eight earthquakes analyzed, we obtained a reduction in the equivalent magnitudes of even a few tenths, especially for the higher energy events (5 February 1783 and 28 December 1908), as shown in Table 3. Although this reduction may seem insignificant, an increase of 0.2 additional magnitude points corresponds to a doubling of the energy released by the earthquake [141]. This then affects the size of the seismic sources calculated by the scaling laws from the relative magnitude values (as shown in Section 3.5.2). In fact, a 0.2 increase in the equivalent magnitude results in a seismic source with larger length and width values of about 1.3 and 1.2, respectively, as well as an increase in the source area by a factor of about 1.5. We are aware that, especially for pre-instrumental earthquakes, representing the magnitudes with two decimal places is excessive, but in this way, we maintained the correct relationship with the sizes of the sources. Similar results were obtained by Blumetti et al. [113] for the 5 February 1783 earthquake and by Comerci et al. [115] for the 1908 earthquake using the ESI scale [118]. For the 5 February 1783 earthquake, from the extent of normal surface faulting (rupture length about 35 km; maximum displacements at least in the order of 0.8 m) and the total area affected by secondary effects (about 3500 km2), Blumetti et al. [113] estimated an ESI epicentral intensity equal to X. Possibly due to local characteristics of the territory and to dense secondary effects, such as landslides and liquefactions, in four localities (Santa Cristina di Aspromonte, San Giorgio Morgeto, Molochio, and Oppido Mamertina), the ESI local intensity values reached an intensity degree = XI, higher than the epicentral intensity [113]. For the 1908 earthquake, the MCS local intensities were often larger than the corresponding ESI values obtained by Comerci et al. [115], especially in the near-field area, at the intensity interval IX–XI. Indeed, the earthquake severity estimated by the MCS intensities in the highest degrees might be influenced by both the poor quality of the buildings and the weakness of the buildings already damaged by the earthquakes of 1894, 1905, and 1907 that occurred in the same area [137,142,143,144,145], as suggested by the authors.

5.2. Seismotectonic Implications and Earthquake/Fault Association

Although most of the southern Calabria outcropping active faults dip westward, for all the destructive Calabrian earthquakes, a discussion is open in the literature about the E-dip or W-dip direction of the extensional seismogenic major fault or, rather, the activation of a strike-slip transfer fault. The E-dip model for the 1783 earthquakes fits well with the geochemical evidence from local springs and well observations [82], but it contrasts with the long-term and coseismic features. In fact, the 5 February earthquake caused coseismic surface ruptures along at least 23 km of the Cittanova fault at the base of the mountain slope, between the localities of Santa Cristina and Cinquefrondi [22,87,110]. The same fault shows evidence of Holocene faulting in paleoseismic analyses [22,26].
In this paper, we have provided more detailed and complete information on the coseismic deformation that, according to our reconstruction, involves both the west-dipping Cittanova and the Serre faults.
The sources that we reconstructed for the 5 February event fit with the attribution of the Cittanova fault for the northern portion, as previously proposed by [22,26], and of the Cittanova and Sant’Eufemia d’Aspromonte faults for the southern portion [72,78,88] (Figure 8a). Our results fit with the models that associated the source of this quake with W-dipping faults. Similarly, for the 7 February event, we propose the attribution to the W-dipping Serre fault [93,94] or, alternatively, to an easternmost alignment, which also fits with our seismogenic source (see Figure 8c).
For the 6 February event, our results highlight the possibility of the involvement of a W-dipping source located on-land in Calabria, possibly the Reggio Calabria or the Armo sources (Figure 8b), while for the 1 March event, we advance the hypothesis of the activation of the central segment of the Serre fault system (Figure 8d).
The source of the 1791 event would fit with the central-easternmost portion of the Serre fault (Figure 9a). Based on our results, the 1894 earthquake could be related to the NNW-dipping portion of the Sant’Eufemia fault (Figure 9b).
In the case of the 28 March 1783 earthquake, we also highlight the difficulty in identifying a well-constrained source. Nevertheless, considering the best-fitted NNE–SSW direction of the revisited macroseismic field and the macroseismic ellipse’s position at the Serre fault’s footwall (Figure 8e), we advance two alternative hypotheses. One sees the possible involvement of the NW-dipping Caraffa fault system as a NNE-ward continuation of the Serre fault [81]. The second is a new suggestion that speculates on the possibility of its association with a basal portion of an ESE-dipping extensional detachment fault, developed along with the down-dip prosecution of the Gulf of Sant’Eufemia SE-dipping major fault responsible for the 8 September 1905 earthquake (M~7) [143] (Figure 8e and Figure 10). This source recalls, although with a different magnitude range, the L’Aquila 2009 earthquake of central Italy, which, two days after the release of the main event (Mw 6.2) at upper crustal depths on the SW-dipping Paganica fault, released a third major event (M 5) along the east-dipping basal detachment at the footwall of the main fault and about 5 km deeper [127].
Our analysis of the macroseismic field of the 1908 earthquake shows that the seismogenic source derived from the complete macroseismic field has an overall N–S direction and a vast extended area that does not fit with the outcropping extensional fault pattern in the area (Figure 1 and Figure 7c). The difficulty in identifying a likely source is evident when looking at the wide range of proposed solutions that largely variates in trend, size, and position (see Figure 2d and Supplementary Data S1). This could be also related to the fact that the epicenter area falls offshore in the Strait of Messina, leading to the absence of macroseismic data inside the most affected area.
The possibility of interpreting the event as a double rupture arises when considering the herein analyzed configuration of the macroseismic field that may be statistically partitioned into two confining clusters, one on the Sicilian side and the other on the Calabrian side (Figure 7c and Figure S12). In the light of this observation, and in consideration of the events that occurred two five minutes apart, as recognized by Oddone [138] in the seismogram and by Baratta [109] in the two “centers of shaking” (see areas a and b in Figure S15), we advance the hypothesis that the 1908 earthquake either activated in sequence two fault segments or nucleated from a central hypocenter and simultaneously propagated in different directions, activating two distinct faults. Taking into consideration both the macroseismic field geometry reconstructed in this paper and the on-shore and off-shore fault pattern recognized in the literature (Figure 1 with references), two new alternative scenarios may be added to the previously proposed ones:
(1)
he earthquake activated a SSE-dipping fault segment offshore of Messina and an antithetic WNW-dipping segment possibly corresponding to the Armo fault and its northward continuation;
(2)
It activated the SSE-dipping fault segment offshore and a synthetic ESE–SSE-dipping offshore fault corresponding to the West fault of Barreca et al. [74] (Figure 9c). These two faults may be activated by the normal slip on the foreland-dipping discontinuity (the West fault [74]), inducing additional stress and promoting failure in the overlying brittle faults.
We recall that the possible activation of two opposite dipping faults has already been hypothesized by Mulargia et al. [105] and by Barreca et al. [74], even if the sources in these papers partially differ in direction, position, and size. Furthermore, the involvement of two synthetic west-dipping faults (Armo and Sant’Eufemia di Aspromonte) has been suggested by Aloisi et al. [146]. Earthquakes generated on off-faults, which branch from the main fault or form in the surrounding medium due to stress concentrations around the rupture tip, have been recognized in instrumental recording times, as in the case of the Norcia 2016 earthquake [6,121]. Off-faults may play a key role in accommodating the large slip and enhancing the seismic radiation of this event, nearly simultaneously activating neighboring structures. Evidently, the new earthquake source associations proposed herein for the 1908 earthquake are preliminary hypotheses that need to be tested and validated, especially with respect to the available geodetic data.

5.3. Time–Space Evolution of Southern Calabria Earthquakes

In historical times, but not in instrumental times, Calabria has been affected by numerous seismic events (Figure 1b), in particular, by at least 40 earthquakes (Figure S16) with M > 5.5, according to the information available from the CPTI15 catalog since 1172 (Table S13). For these events, we studied the time-completeness using a magnitude-frequency method [147] and compared the cumulative frequency with time (in years). With the scatter diagram obtained, we estimated the time-completeness for events with M > 5.5 for data fitted by a straight line [148], i.e., starting from 1609 (Figure S17). To analyze the time–space distribution of seismicity in southern Calabria, we projected the elliptical-shaped source of all the events with Mw > 5.5 released since 1609 along the trace of a vertical ENE–WSW transect (Figure 10).
The size of the earthquake sources, which are not analyzed in this paper, was calculated considering the magnitude values in the CPTI15 catalog (Figure S18; Table S14) and scaling them according to the dataset of regression laws for seismic source parameters, as shown in Paragraph 3.5, while for the eight earthquakes studied in this work, we used our results (Table 3). As a simplification, we assume that the considered earthquakes are associated with a single seismic source whose preferred direction is ~N30 along the section profile (Figure 10 and Figure S18).
From the space–time diagram, at least three earthquake cycles that inter-correlate every ~125 years are observed (Figure 10). These are characterized by large seismic sequences that have released considerable energy across the overall region, involving most of the main fault systems (i.e., the Serre-Mileto fault system, the Armo-S. Stefano-Delianuova-Cittanova fault system, and the S. Eufemia dell’Aspromonte-Reggio Calabria-Messina fault system from NE to SW). The diagram also shows a seismic gap in the southernmost part of Calabria and the Strait of Messina from 1600 to 1749, with a lack of earthquakes of significant magnitude (Mw ≥ 5.5).
Considering the earthquakes studied herein, they all fall into the two most recent cycles (cycles 2 and 3 in Figure 10). Cycle 2 consists almost entirely of the events of the 1783-SS, on which the area activated by the 1791 earthquake is superimposed. These earthquakes activated a total of ~125 km of faults along the strike, not considering the overlapping portions. The events mentioned took place about 1.5 centuries after cycle 1, which activated the northern ~75 km of the study area in ~50 years, leaving the southern ~100 km substantially inactive. Finally, cycle 3 developed between the end of the 1800s and the beginning of the 1900s, activating ~85 km of faults in a period of ~50 years, both in the central-northern portion of the study area and in the southern one, divided by a gap of ~25 km and with the 1894 and 1908 earthquakes both in the southern portion.
A similar consideration can be made for the cumulative slip rate distribution, derived from the value of the seismic moment using Hanks and Kanamori’s [141] formulas (see lower panel of Figure 10). The displacement values obtained are shown in Supplementary Table S14. These values have been used to plot the cumulative displacement for each cycle (in red) and the total cumulative displacement (in blue) in the lower panel of Figure 10. In the latter, Cycle 1 shows a maximum cumulative displacement of ~2.3 m, which affected the northern area, while Cycles 2 and 3 have a more homogeneous distribution of slip along the transect with a maximum displacement of ~1.7 m. The total cumulative displacement curve shows two different patterns of vertical movement related to the northern and southern areas, where the former has a maximum cumulative slip of 5.5 m, and the latter has a slip of 2.5 m with a slip deficit area (~1.5 m) corresponding to the Gioia Tauro basin. The variability between the two sectors can be attributed to several factors: when working with historical information, we oftentimes have incomplete data and uncertainty of the available data; therefore, the estimates of magnitude can be affected by errors. It must also be taken into account that during cycle 1 (1600–1720), in the area between the Strait of Messina and the Gioia Tauro basin, there were at least 12 earthquakes with magnitudes between 4.1 and 5.1, which we excluded from the analysis because the completeness magnitude we used is 5.5.

6. Conclusions

Southern Calabria has experienced two of Italy’s most powerful and destructive earthquakes: the 1783 sequence and the 1908 single event. However, the seismotectonic interpretation of these events remains a subject of extensive debate in the scientific community due to the limited availability of energetic earthquakes in instrumental times.
Our paper aims to provide valuable insight and perspectives from a modern seismotectonic approach to the analysis of macroseismic data. It comprises the following key contributions:
(1)
We have revised and documented the macroseismic fields of the previous events along with those of neighboring earthquakes (Supplementary Data S2) using the EMS-98 scale. This revised information is made accessible and accompanied by an updated catalog of the 1783-related coseismic effects (Supplementary Data S3).
(2)
We have developed a methodological approach to extract geometric information on seismogenic sources from the macroseismic field. This approach combines the conventional Boxer method with new statistical tools and with scale-law algorithms. Our findings indicate that the average trends of the main seismogenic faults in the area (see Table 1) are consistent with the orientations of the elliptical sources obtained in our study (Table 3).
(3)
To facilitate further research, we provide valuable resources with this paper: (i) a shapefile containing all the seismogenic boxes of the earthquakes studied in the literature (Supplementary Data S1); (ii) detailed tables for each seismic event, including a description of the earthquake, historical reports of the coseismic effects (both in the original language and translated), references to historical sources, and the macroseismic field revisited (Supplementary Data S2); (iii) a shapefile specifically dedicated to the coseismic effects of the 1783-SS (Supplementary Data S3); (iv) an easy-to-use spreadsheet that enables the calculation of seismogenic source parameters using different empirical laws (Supplementary Data S4); and (v) a shapefile illustrating the inferred seismogenic sources identified in this study (Supplementary Data S5).
(4)
We proposed new seismotectonic hypotheses for the 1908 earthquake and the 28 March event of the 1783-SS. These hypotheses are based on the reconstructed configuration of their macroseismic fields and tectonic setting and rest on insights gained from the seismogenic release observed in recent instrumental sequences in central Italy. The 1908 earthquake appears to be a single event with the simultaneous activation of a major WSW-dipping fault on the Calabrian side and a SSE-dipping fault on the Sicilian side. Alternatively, the SSE-dipping source may have acted in conjunction with the synthetic ESE–SSE-dipping West fault described by Barreca et al. [74]. As for the 28 March final event of the 1783 sequence, we propose its nucleation on a SE-dipping detachment located at the footwall of the NW-dipping complex multi-segmented network along the Serre–Cittanova–Delianuova west-dipping normal fault alignment responsible for the previous events of the 1783-SS.
In conclusions, it is important to note that these hypotheses are preliminary and require further investigation and validation, particularly in light of the available geodetic data and earthquake fault modeling. This ongoing scientific investigation is crucial for a better understanding of seismic hazard assessment and developing effective strategies for mitigating earthquake risks in southern Calabria and similar tectonic regions.

Supplementary Materials

The following supporting information can be downloaded at: https://www.mdpi.com/article/10.3390/geosciences13070212/s1, Supplementary data in shapefile format (Supplementary Data S1) of the seismogenic boxes from literature. A supplementary data document (Supplementary Data S2), which contains tables (from Table S1 to Table S12) with information on historical sources of coseismic effects and macroseismic fields. Supplementary data in shapefile format (Supplementary Data S3) of the 1783-SS coseismic effects. A supplementary spreadsheet (Supplementary Data S4) to calculate the seismogenic source parameters from different empirical laws. A supplementary figures and tables document, which contains supplementary figures (from Figures S1–S18) and Tables (Tables S13 and S14).

Author Contributions

Conceptualization, C.A., M.S.B. and G.L.; methodology, C.A. and M.S.B.; software, C.A.; validation, C.A., S.B., M.S.B., R.d.N. and G.L.; formal analysis, C.A., M.S.B., C.P. and S.B.; investigation, C.A., S.B., M.S.B., C.P., F.P. and G.L.; resources, M.S.B., C.P., G.L., S.B. and R.d.N.; data curation, C.A., S.B., M.S.B. and C.P.; writing—original draft preparation, M.S.B., C.A., G.L., S.B. and C.P.; writing—review and editing, S.B., G.L., C.A., M.S.B. and R.d.N.; visualization, C.A., S.B. and G.L.; supervision, G.L., M.S.B. and R.d.N. All authors have read and agreed to the published version of the manuscript.

Funding

This research was funded by PRIN 2017 (2017KT2MKE) funds from the Italian Ministry of University and Research awarded to Giusy Lavecchia for the project “Overtime tectonic, dynamic and rheologic control on destructive multiple seismic events—Special Italian Faults and Earthquakes: from real 4D cases to models”.

Data Availability Statement

Not applicable.

Acknowledgments

We would like to express our sincere gratitude to editor Sybil Zhao and to the three anonymous reviewers who diligently reviewed our paper. Their valuable feedback and insightful suggestions have significantly contributed to its substantial improvement.

Conflicts of Interest

The authors declare no conflict of interest.

References

  1. Rovida, A.; Locati, M.; Camassi, R.; Lolli, B.; Gasperini, P. The Italian earthquake catalogue CPTI15. Bull. Earthq. Eng. 2020, 18, 2953–2984. [Google Scholar] [CrossRef]
  2. Barreca, G.; Branca, S.; Corsaro, R.A.; Scarfì, L.; Cannavò, F.; Aloisi, M.; Monaco, C.; Faccenna, C. Slab Detachment, Mantle Flow, and Crustal Collision in Eastern Sicily (Southern Italy): Implications on Mount Etna Volcanism. Tectonics 2020, 39, e2020TC006188. [Google Scholar] [CrossRef]
  3. Barreca, G.; Scarfì, L.; Gross, F.; Monaco, C.; De Guidi, G. Fault pattern and seismotectonic potential at the south-western edge of the Ionian Subduction system (Southern Italy): New field and geophysical constraints. Tectonophysics 2019, 761, 31–45. [Google Scholar] [CrossRef]
  4. Brozzetti, F.; Boncio, P.; Lavecchia, G.; Pace, B. Present activity and seismogenic potential of a low-angle normal fault system (Città di Castello, Italy): Constraints from surface geology, seismic reflection data and seismicity. Tectonophysics 2009, 463, 31–46. [Google Scholar] [CrossRef]
  5. Castaldo, R.; de Nardis, R.; DeNovellis, V.; Ferrarini, F.; Lanari, R.; Lavecchia, G.; Pepe, S.; Solaro, G.; Tizzani, P. Coseismic Stress and Strain Field Changes Investigation through 3-D Finite Element Modeling of DInSAR and GPS Measurements and Geological/Seismological Data: The L’Aquila (Italy) 2009 Earthquake Case Study. J. Geophys. Res. Solid Earth 2018, 123, 4193–4222. [Google Scholar] [CrossRef]
  6. Chiaraluce, L.; Di Stefano, R.; Tinti, E.; Scognamiglio, L.; Michele, M.; Casarotti, E.; Cattaneo, M.; De Gori, P.; Chiarabba, C.; Monachesi, G.; et al. The 2016 central Italy seismic sequence: A first look at the mainshocks, aftershocks, and source models. Seismol. Res. Lett. 2017, 88, 757–771. [Google Scholar] [CrossRef]
  7. Cirillo, D.; Totaro, C.; Lavecchia, G.; Orecchio, B.; de Nardis, R.; Presti, D.; Ferrarini, F.; Bello, S.; Brozzetti, F. Structural complexities and tectonic barriers controlling recent seismic activity in the Pollino area (Calabria–Lucania, southern Italy)—constraints from stress inversion and 3D fault model building. Solid Earth 2022, 13, 205–228. [Google Scholar] [CrossRef]
  8. De Landro, G.; Amoroso, O.; Alfredo Stabile, T.; Matrullo, E.; Lomax, A.; Zollo, A. High-precision differential earthquake location in 3-D models: Evidence for a rheological barrier controlling the microseismicity at the Irpinia fault zone in southern Apennines. Geophys. J. Int. 2015, 203, 1821–1831. [Google Scholar] [CrossRef] [Green Version]
  9. de Nardis, R.; Pandolfi, C.; Cattaneo, M.; Monachesi, G.; Cirillo, D.; Ferrarini, F.; Bello, S.; Brozzetti, F.; Lavecchia, G. Lithospheric double shear zone unveiled by microseismicity in a region of slow deformation. Sci. Rep. 2022, 12, 229237. [Google Scholar] [CrossRef]
  10. Ferrarini, F.; de Nardis, R.; Brozzetti, F.; Cirillo, D.; Arrowsmith, J.R.; Lavecchia, G. Multiple Lines of Evidence for a Potentially Seismogenic Fault Along the Central-Apennine (Italy) Active Extensional Belt–An Unexpected Outcome of the MW6.5 Norcia 2016 Earthquake. Front. Earth Sci. 2021, 9, 642243. [Google Scholar] [CrossRef]
  11. Sippl, C.; Schurr, B.; Asch, G.; Kummerow, J. Seismicity Structure of the Northern Chile Forearc from >100,000 Double-Difference Relocated Hypocenters. J. Geophys. Res. Solid Earth 2018, 123, 4063–4087. [Google Scholar] [CrossRef] [Green Version]
  12. Valoroso, L.; Chiaraluce, L.; Piccinini, D.; Di Stefano, R.; Schaff, D.; Waldhauser, F. Radiography of a normal fault system by 64,000 high-precision earthquake locations: The 2009 L’Aquila (central Italy) case study. J. Geophys. Res. Solid Earth 2013, 118, 1156–1176. [Google Scholar] [CrossRef] [Green Version]
  13. Cotecchia, V.; Guerricchio, A.; Melidoro, G. The geomorphogenetic crisis triggered by the 1783 earthquake in Calabria (southern Italy). In Proceedings of the Proc. International Symposium on “Engineering Geology Problems in Seismic Areas”, Bari, Italy, 13–19 April 1986; pp. 245–304. [Google Scholar]
  14. Polonia, A.; Melis, R.; Galli, P.; Colizza, D.; Insinga, D.; Gasperini, L. Large earthquakes along slow converging plate margins: Calabrian Arc paleoseismicity based on the submarine turbidite record. Geosci. Front. 2023, 14, 101612. [Google Scholar] [CrossRef]
  15. Rovida, A.; Locati, M.; Camassi, R.; Lolli, B.; Gasperini, P.; Antonucci, A. Catalogo Parametrico dei Terremoti Italiani (CPTI15), Versione 4.0; Istituto Nazionale di Geofisica e Vulcanologia (INGV): Rome, Italy, 2022. [CrossRef]
  16. ISIDE Working Group. Italian Seismological Instrumental and Parametric Database (ISIDe); Istituto Nazionale di Geofisica e Vulcanologia (INGV): Rome, Italy, 2007. [CrossRef]
  17. Bello, S.; de Nardis, R.; Scarpa, R.; Brozzetti, F.; Cirillo, D.; Ferrarini, F.; di Lieto, B.; Arrowsmith, J.R.; Lavecchia, G. Fault Pattern and Seismotectonic Style of the Campania—Lucania 1980 Earthquake (Mw 6.9, Southern Italy): New Multidisciplinary Constraints. Front. Earth Sci. 2021, 8, 608063. [Google Scholar] [CrossRef]
  18. Bello, S.; Lavecchia, G.; Andrenacci, C.; Ercoli, M.; Cirillo, D.; Carboni, F.; Barchi, M.R.; Brozzetti, F. Complex trans-ridge normal faults controlling large earthquakes. Sci. Rep. 2022, 12, 10676. [Google Scholar] [CrossRef] [PubMed]
  19. Bello, S.; Perna, M.G.; Consalvo, A.; Brozzetti, F.; Galli, P.; Cirillo, D.; Andrenacci, C.; Tangari, A.C.; Carducci, A.; Menichetti, M.; et al. Coupling rare earth element analyses and high-resolution topography along fault scarps to investigate past earthquakes: A case study from the Southern Apennines (Italy). Geosphere 2023, 20, 1–24. [Google Scholar]
  20. Galli, P.; Bosi, V. Catastrophic 1638 earthquakes in Calabria (southern Italy): New insights from paleoseismological investigation. J. Geophys. Res. Solid Earth 2003, 108, 1–20. [Google Scholar] [CrossRef] [Green Version]
  21. Galli, P.; Galadini, F.; Pantosti, D. Twenty years of paleoseismology in Italy. Earth Sci. Rev. 2008, 88, 89–117. [Google Scholar] [CrossRef]
  22. Galli, P.; Peronace, E. Low slip rates and multimillennial return times for Mw 7 earthquake faults in southern Calabria (Italy). Geophys. Res. Lett. 2015, 42, 5258–5265. [Google Scholar] [CrossRef] [Green Version]
  23. Kondo, H.; Owen, L.A.; Figueiredo, P.M. Paleoseismological Studies, 2nd ed.; Elsevier Inc.: Amsterdam, The Netherlands, 2021; pp. 1–66. [Google Scholar]
  24. Lavecchia, G.; Bello, S.; Andrenacci, C.; Cirillo, D.; Ferrarini, F.; Vicentini, N.; de Nardis, R.; Roberts, G.; Brozzetti, F. QUaternary fault strain INdicators database—QUIN 1.0—first release from the Apennines of central Italy. Sci Data 2022, 9, 204. [Google Scholar] [CrossRef]
  25. Villani, F.; Civico, R.; Pucci, S.; Pizzimenti, L.; Nappi, R.; De Martini, P.M.; Agosta, F.; Alessio, G.; Alfonsi, L.; Amanti, M.; et al. A database of the coseismic effects following the 30 October 2016 Norcia earthquake in Central Italy. Sci. Data 2018, 5, 180049. [Google Scholar] [CrossRef] [PubMed] [Green Version]
  26. Galli, P. Paleoseismology along the Cittanova fault: Implications for seismotectonics and earthquake recurrence in Calabria (southern Italy). J. Geophys. Res. 2002, 107, 1029–1048. [Google Scholar] [CrossRef] [Green Version]
  27. Bello, S.; Andrenacci, C.; Cirillo, D.; Scott, C.P.; Brozzetti, F.; Arrowsmith, J.R.; Lavecchia, G. High-Detail Fault Segmentation: Deep Insight into the Anatomy of the 1983 Borah Peak Earthquake Rupture Zone (Mw 6.9, Idaho, USA). Lithosphere 2022, 2022, 8100224. [Google Scholar] [CrossRef]
  28. Bello, S.; Scott, C.P.; Ferrarini, F.; Brozzetti, F.; Scott, T.; Cirillo, D.; de Nardis, R.; Arrowsmith, J.R.; Lavecchia, G. High-resolution surface faulting from the 1983 Idaho Lost River Fault Mw 6.9 earthquake and previous events. Sci. Data 2021, 8, 68. [Google Scholar] [CrossRef]
  29. Civico, R.; Pucci, S.; Villani, F.; Pizzimenti, L.; De Martini, P.M.; Nappi, R.; Agosta, F.; Alessio, G.; Alfonsi, L.; Amanti, M.; et al. Surface ruptures following the 30 October 2016 Mw 6.5 Norcia earthquake, central Italy. J. Maps 2018, 14, 151–160. [Google Scholar] [CrossRef] [Green Version]
  30. Amoruso, A.; Crescentini, L.; Scarpa, R. Source parameters of the 1908 Messina Straits, Italy, earthquake from geodetic and seismic data. J. Geophys. Res. Solid Earth 2002, 107, ESE 4-1–ESE 4-11. [Google Scholar] [CrossRef]
  31. Carafa, M.M.C.; Galvani, A.; Di Naccio, D.; Kastelic, V.; Di Lorenzo, C.; Miccolis, S.; Sepe, V.; Pietrantonio, G.; Gizzi, C.; Massucci, A.; et al. Partitioning the Ongoing Extension of the Central Apennines (Italy): Fault Slip Rates and Bulk Deformation Rates from Geodetic and Stress Data. J. Geophys. Res. Solid Earth 2020, 125, e2019JB018956. [Google Scholar] [CrossRef]
  32. Ferranti, L.; Palano, M.; Cannavò, F.; Mazzella, M.E.; Oldow, J.S.; Gueguen, E.; Mattia, M.; Monaco, C. Rates of geodetic deformation across active faults in southern Italy. Tectonophysics 2014, 621, 101–122. [Google Scholar] [CrossRef]
  33. Palano, M.; Cannavò, F.; Ferranti, L.; Mattia, M.; Mazzella, M.E. Strain and stress fields in the Southern Apennines (Italy) constrained by geodetic, seismological and borehole data. Geophys. J. Int. 2011, 187, 1270–1282. [Google Scholar] [CrossRef] [Green Version]
  34. Antonucci, A.; Rovida, A.; D’Amico, V.; Albarello, D. Integrating macroseismic intensity distributions with a probabilistic approach: An application in Italy. Nat. Hazards Earth Syst. Sci. 2021, 21, 2299–2311. [Google Scholar] [CrossRef]
  35. Falcone, F.; Valerio, E.D.; Salvia, V.L.; Rosatelli, G.; Perna, M.G.; Bello, S.; Francis, R.E.; Stoppa, F. Geo-archaeology, archaeometry, and history of a seismic-endangered historical site in central Apennines (Italy). Herit. Sci. 2023, 11, 68. [Google Scholar] [CrossRef]
  36. Gasperini, P.; Vannucci, G.; Tripone, D.; Boschi, E. The Location and Sizing of Historical Earthquakes Using the Attenuation of Macroseismic Intensity with Distance. Bull. Seismol. Soc. Am. 2010, 100, 2035–2066. [Google Scholar] [CrossRef]
  37. Pirrotta, C.; Barbano, M.S. New Macroseismic and Morphotectonic Constraints to Infer a Fault Model for the 9 (Mw6.1) and 11 January (Mw7.3) 1693 Earthquakes (Southeastern Sicily). Front. Earth Sci. 2020, 8, 550851. [Google Scholar] [CrossRef]
  38. Sbarra, P.; Burrato, P.; Tosi, P.; Vannoli, P.; De Rubeis, V.; Valensise, G. Inferring the depth of pre-instrumental earthquakes from macroseismic intensity data: A case-history from Northern Italy. Sci. Rep. 2019, 9, 15583. [Google Scholar] [CrossRef] [PubMed] [Green Version]
  39. Valensise, G.; Vannoli, P.; Burrato, P.; Fracassi, U. From Historical Seismology to seismogenic source models, 20 years on: Excerpts from the Italian experience. Tectonophysics 2020, 774, 228189. [Google Scholar] [CrossRef]
  40. Galli, P.; Castenetto, S.; Peronace, E. The Macroseismic Intensity Distribution of the 30 October 2016 Earthquake in Central Italy (Mw 6.6): Seismotectonic Implications. Tectonics 2017, 36, 2179–2191. [Google Scholar] [CrossRef]
  41. Sbarra, P.; Burrato, P.; De Rubeis, V.; Tosi, P.; Valensise, G.; Vallone, R.; Vannoli, P. Inferring the depth and magnitude of pre-instrumental earthquakes from intensity attenuation curves. Nat. Hazards Earth Syst. Sci. 2023, 23, 1007–1028. [Google Scholar] [CrossRef]
  42. Grüntal, G. European Macroseismic Scale 1998 (EMS-98); Centre Européen de Géodynamique et de Séismologie: Luxembourg, 1998; Volume 15. [Google Scholar]
  43. Allen, T.I.; Hayes, G.P. Alternative Rupture-Scaling Relationships for Subduction Interface and Other Offshore Environments. Bull. Seismol. Soc. Am. 2017, 107, 1240–1253. [Google Scholar] [CrossRef]
  44. Hanks, T.C.; Bakun, W.H. M-logA Observations for Recent Large Earthquakes. Bull. Seismol. Soc. Am. 2008, 98, 490–494. [Google Scholar] [CrossRef]
  45. Leonard, M. Earthquake Fault Scaling: Self-Consistent Relating of Rupture Length, Width, Average Displacement, and Moment Release. Bull. Seismol. Soc. Am. 2010, 100, 1971–1988. [Google Scholar] [CrossRef]
  46. Leonard, M. Self-Consistent Earthquake Fault-Scaling Relations: Update and Extension to Stable Continental Strike-Slip Faults. Bull. Seismol. Soc. Am. 2014, 104, 2953–2965. [Google Scholar] [CrossRef]
  47. Martin Mai, P.; Beroza, G.C. Source Scaling Properties from Finite-Fault-Rupture Models. Bull. Seismol. Soc. Am. 2000, 90, 604–615. [Google Scholar]
  48. Mason, D.B. Earthquake magnitude potential of the intermountain seismic belt, USA, from surface-parameter scaling of late Quaternary faults. Bull. Seismol. Soc. Am. 1996, 86, 1487–1506. [Google Scholar]
  49. Pavlides, S.; Caputo, R. Magnitude versus faults’ surface parameters: Quantitative relationships from the Aegean Region. Tectonophysics 2004, 380, 159–188. [Google Scholar] [CrossRef]
  50. Schirripa Spagnolo, G.; Mercuri, M.; Billi, A.; Carminati, E.; Galli, P. The Segmented Campo Felice Normal Faults: Seismic Potential Appraisal by Application of Empirical Relationships Between Rupture Length and Earthquake Magnitude in the Central Apennines, Italy. Tectonics 2021, 40, e2020TC006465. [Google Scholar] [CrossRef]
  51. Thingbaijam, K.K.S.; Martin Mai, P.; Goda, K. New Empirical Earthquake Source-Scaling Laws. Bull. Seismol. Soc. Am. 2017, 107, 2225–2246. [Google Scholar] [CrossRef] [Green Version]
  52. Villamor, P.; Berryman, K.; Webb, T.; Stirling, M.; McGinty, P.; Downes, G.; Harris, J.; Litchfield, N. Waikato Seismic Loads Task 2.1. Revision of Seismic Source Characterisation; GNS Client Report 2001/59; Institute of Geological and Nuclear Sciences: Rome, Italy, 2001; p. 109. [Google Scholar]
  53. Wells, D.L.; Coppersmith, K.J. New Empirical Relationships among Magnitude, Rupture Length, Rupture Width, Rupture Area, and Surface Displacement. Bull. Seismol. Soc. Am. 1994, 84, 974–1002. [Google Scholar]
  54. Wesnousky, S.G. Displacement and geometrical characteristics of earthquake surface ruptures: Issues and implications for seismic-hazard analysis and the process of earthquake rupture. Bull. Seismol. Soc. Am. 2008, 98, 1609–1632. [Google Scholar] [CrossRef]
  55. Lavecchia, G.; de Nardis, R.; Ferrarini, F.; Cirillo, D.; Bello, S.; Brozzetti, F. Regional Seismotectonic Zonation of Hydrocarbon Fields in Active Thrust Belts: A Case Study from Italy. In Building Knowledge for Geohazard Assessment and Management in the Caucasus and other Orogenic Regions; Bonali, F.L., Pasquaré Mariotto, F., Tsereteli, N., Eds.; NATO Science for Peace and Security Series C: Environmental Security; Springer: Dordrecht, The Netherlands, 2021; pp. 89–128. [Google Scholar] [CrossRef]
  56. Amicucci, L.; Barchi, M.R.; Montone, P.; Rubiliani, N. The Vallo di Diano and Auletta extensional basins in the southern Apennines (Italy): A simple model for a complex setting. Terra Nova 2008, 20, 475–482. [Google Scholar] [CrossRef]
  57. Barchi, M.; Amato, A.; Cippitelli, G.; Merlini, S.; Montone, P. Extensional tectonics and seismicity in the axial zone of the Southern Apennines. Boll. Della Soc. Geol. Ital. Suppl. 2007, 7, 47–56. [Google Scholar]
  58. Brozzetti, F. The Campania-Lucania Extensional Fault System, southern Italy: A suggestion for a uniform model of active extension in the Italian Apennines. Tectonics 2011, 30, 1–26. [Google Scholar] [CrossRef]
  59. Brozzetti, F.; Cirillo, D.; de Nardis, R.; Cardinali, M.; Lavecchia, G.; Orecchio, B.; Presti, D.; Totaro, C. Newly identified active faults in the Pollino seismic gap, southern Italy, and their seismotectonic significance. J. Struct. Geol. 2017, 94, 13–31. [Google Scholar] [CrossRef] [Green Version]
  60. Brozzetti, F.; Cirillo, D.; Liberi, F.; Piluso, E.; Faraca, E.; De Nardis, R.; Lavecchia, G. Structural style of Quaternary extension in the Crati Valley (Calabrian Arc): Evidence in support of an east-dipping detachment fault. Ital. J. Geosci. 2017, 136, 434–453. [Google Scholar] [CrossRef]
  61. Brozzetti, F.; Salvatore, A. Quaternary extensional Fault-Systems from northern and southern Apennines: Similarities and differences. Rend. Soc. Geol. It. 2005, 1, 58–60. [Google Scholar]
  62. Galadini, F.; Galli, P. Active Tectonics in the Central Apennines (Italy)—Input Data for Seismic Hazard Assessment. Nat. Hazards 2000, 22, 225–270. [Google Scholar] [CrossRef]
  63. Galli, P. Recurrence times of central-southern Apennine faults (Italy): Hints from palaeoseismology. Terra Nova 2020, 32, 399–407. [Google Scholar] [CrossRef]
  64. Galli, P.; Galderisi, A.; Messina, P.; Peronace, E. The Gran Sasso fault system: Paleoseismological constraints on the catastrophic 1349 earthquake in Central Italy. Tectonophysics 2022, 822, 229156. [Google Scholar] [CrossRef]
  65. Galli, P.; Peronace, E. New paleoseismic data from the Irpinia Fault. A different seismogenic perspective for southern Apennines (Italy). Earth Sci. Rev. 2014, 136, 175–201. [Google Scholar] [CrossRef]
  66. Papanikolaou, I.D.; Roberts, G.P. Geometry, kinematics and deformation rates along the active normal fault system in the southern Apennines: Implications for fault growth. J. Struct. Geol. 2007, 29, 166–188. [Google Scholar] [CrossRef]
  67. Roberts, G.P.; Michetti, A.M. Spatial and temporal variations in growth rates along active normal fault systems: An example from The Lazio-Abruzzo Apennines, central Italy. J. Struct. Geol. 2004, 26, 339–376. [Google Scholar] [CrossRef]
  68. Sgambato, C.; Faure Walker, J.P.; Roberts, G.P. Uncertainty in strain-rate from field measurements of the geometry, rates and kinematics of active normal faults: Implications for seismic hazard assessment. J. Struct. Geol. 2020, 131, 103934. [Google Scholar] [CrossRef]
  69. Spina, V.; Tondi, E.; Galli, P.; Mazzoli, S.; Cello, G. Quaternary fault segmentation and interaction in the epicentral area of the 1561 earthquake (Mw = 6.4), Vallo di Diano, southern Apennines, Italy. Tectonophysics 2008, 453, 233–245. [Google Scholar] [CrossRef]
  70. Villani, F.; Pierdominici, S. Late Quaternary tectonics of the Vallo di Diano basin (southern Apennines, Italy). Quat. Sci. Rev. 2010, 29, 3167–3183. [Google Scholar] [CrossRef]
  71. Papanikolaou, I.D.; Roberts, G.P.; Michetti, A.M. Fault scarps and deformation rates in Lazio-Abruzzo, Central Italy: Comparison between geological fault slip-rate and GPS data. Tectonophysics 2005, 408, 147–176. [Google Scholar] [CrossRef]
  72. Jacques, E.; Monaco, C.; Tapponnier, P.; Tortorici, L.; Winter, T. Faulting and earthquake triggering during the 1783 Calabria seismic sequence. Geophys. J. Int. 2001, 147, 499–516. [Google Scholar] [CrossRef] [Green Version]
  73. Monaco, C.; Tortorici, L. Active faulting in the Calabrian arc and eastern Sicily. J. Geodyn. 2000, 29, 407–424. [Google Scholar] [CrossRef]
  74. Barreca, G.; Gross, F.; Scarfì, L.; Aloisi, M.; Monaco, C.; Krastel, S. The Strait of Messina: Seismotectonics and the source of the 1908 earthquake. Earth Sci. Rev. 2021, 218, 103685. [Google Scholar] [CrossRef]
  75. Scudero, S.; De Guidi, G.; Caputo, R.; Perdicaro, V. A semi-quantitative method to combine tectonic stress indicators: Example from the Southern Calabrian Arc (Italy). Bull. Geol. Soc. Greece 2020, 56, 280. [Google Scholar] [CrossRef]
  76. Mariucci, M.T.; Montone, P. Database of Italian present-day stress indicators, IPSI 1.4. Sci Data 2020, 7, 298. [Google Scholar] [CrossRef]
  77. Neri, G.; Orecchio, B.; Scolaro, S.; Totaro, C. Major Earthquakes of Southern Calabria, Italy, Into the Regional Geodynamic Context. Front. Earth Sci. 2020, 8, 579846. [Google Scholar] [CrossRef]
  78. Minelli, L.; Vecchio, A.; Speranza, F.; Nicolosi, I.; D’Ajello Caracciolo, F.; Chiappini, S.; Carluccio, R.; Chiappini, M. Aeromagnetic investigation of southern Calabria and the Messina Straits (Italy): Tracking seismogenic sources of 1783 and 1908 earthquakes. J. Geophys. Res. Solid Earth 2016, 121, 1297–1315. [Google Scholar] [CrossRef] [Green Version]
  79. Pirrotta, C.; Barberi, G.; Barreca, G.; Brighenti, F.; Carnemolla, F.; De Guidi, G.; Monaco, C.; Pepe, F.; Scarfì, L. Recent Activity and Kinematics of the Bounding Faults of the Catanzaro Trough (Central Calabria, Italy): New Morphotectonic, Geodetic and Seismological Data. Geosciences 2021, 11, 405. [Google Scholar] [CrossRef]
  80. Pirrotta, C.; Monaco, C.; Barbano, M.S. Evidence of active tectonics in Southern Calabria (Italy) by geomorphic analysis: The examples of the Catona and Petrace rivers. Ital. J. Geosci. 2016, 135, 1–45. [Google Scholar] [CrossRef]
  81. Pirrotta, C.; Parrino, N.; Pepe, F.; Tansi, C.; Monaco, C. Geomorphological and Morphometric Analyses of the Catanzaro Trough (Central Calabrian Arc, Southern Italy): Seismotectonic Implications. Geosciences 2022, 12, 324. [Google Scholar] [CrossRef]
  82. Pizzino, L.; Burrato, P.; Quattrocchi, F.; Valensise, G. Geochemical signatures of large active faults: The example of the 5 February 1783, Calabrian earthquake (southern Italy). J. Seismol. 2004, 8, 363–380. [Google Scholar] [CrossRef]
  83. Tiberti, M.M.; Vannoli, P.; Fracassi, U.; Burrato, P.; Kastelic, V.; Valensise, G. Understanding seismogenic processes in the Southern Calabrian Arc:a geodynamic perspective. Ital. J. Geosci. 2017, 136, 365–388. [Google Scholar] [CrossRef]
  84. DISS Working Group. Database of Individual Seismogenic Sources (DISS), Version 3.3.0: A Compilation of Potential Sources for Earthquakes Larger than M 5.5 in Italy and Surrounding Areas; Istituto Nazionale di Geofisica e Vulcanologia (INGV): Rome, Italy, 2021. [CrossRef]
  85. Moretti, A. Il database delle faglie capaci della Calabria. Stati attuale delle conoscenze. In Le Ricerche del GNDT nel Campo Della Pericolosità Sismica; Galadini, F., Meletti, C., Rebez, A., Eds.; CNR, GNDT: Rome, Italy, 2000; pp. 219–255. [Google Scholar]
  86. Scognamiglio, L.; Tinti, E.; Quintiliani, M. Time Domain Moment Tensor (TDMT) [Data Set]. 2006. Available online: http://terremoti.ingv.it/tdmt (accessed on 15 April 2023).
  87. De Dolomieu, D. Memoire Sur Les Tremblements de Terre de la Calabre Pendant L’année 1783; Fulgoni, A., Ed.; Antoine Fulgoni: Roma, Italy, 1784. [Google Scholar]
  88. Valentini, A.; Visini, F.; Pace, B. Integrating faults and past earthquakes into a probabilistic seismic hazard model for peninsular Italy. Nat. Hazards Earth Syst. Sci. 2017, 17, 2017–2039. [Google Scholar] [CrossRef] [Green Version]
  89. Basili, R.; Valensise, G.; Vannoli, P.; Burrato, P.; Fracassi, U.; Mariano, S.; Tiberti, M.M.; Boschi, E. The Database of Individual Seismogenic Sources (DISS), version 3: Summarizing 20 years of research on Italy’s earthquake geology. Tectonophysics 2008, 453, 20–43. [Google Scholar] [CrossRef]
  90. Cucci, L.; D’Addezio, G.; Valensise, G.; Burrato, P. Investigating seismogenic faults in Central and Southern Apennines (Italy): Modeling of fault-related landscape features. Ann. Geofis. 1996, 39, 603–618. [Google Scholar]
  91. Peruzza, L.; Pantosti, D.; Slejko, D.; Valensise, G. Testing a new hybrid approach to seismic hazard assessment: An application to the Calabrian Arc (Southern Italy). Nat. Hazards 1997, 14, 113–126. [Google Scholar] [CrossRef]
  92. Valensise, G.; Pantosti, D. The investigation of potential earthquake sources in peninsular Italy: A review. J. Seismol. 2001, 5, 287–306. [Google Scholar] [CrossRef]
  93. Monaco, C.; Tortorici, L.; Nicolich, R.; Cernobori, L.; Costa, M. From collisional to rifted basins: An example from the southern Calabrian arc (Italy). Tectonophysics 1996, 266, 233–249. [Google Scholar] [CrossRef]
  94. Tortorici, L.; Monaco, C.; Tansi, C.; Cocina, O. Recent and active tectonics in the Calabrian arc (Southern Italy). Tectonophysics 1995, 243, 37–55. [Google Scholar] [CrossRef]
  95. Locati, M.; Camassi, R.; Rovida, A.; Ercolani, E.; Bernardini, F.; Castelli, V.; Caracciolo, C.H.; Tertulliani, A.; Rossi, A.; Azzaro, R.; et al. Database Macrosismico Italiano (DBMI15), Versione 4.0; INGV: Rome, Italy, 2022. [Google Scholar] [CrossRef]
  96. Corradino, M.; Pepe, F.; Burrato, P.; Kanari, M.; Parrino, N.; Bertotti, G.; Bosman, A.; Casalbore, D.; Ferranti, L.; Martorelli, E.; et al. An Integrated Multiscale Method for the Characterisation of Active Faults in Offshore Areas. The Case of Sant’Eufemia Gulf (Offshore Calabria, Italy). Front. Earth Sci. 2021, 9, 670557. [Google Scholar] [CrossRef]
  97. Finetti, I.R.; Del Ben, A. Geophysical study of the Tyrrhenian opening. Boll. Di Geofis. Teor. Ed Appl. 1986, 28, 75–155. [Google Scholar]
  98. Locati, M.; Camassi, R.; Stucchi, E. DBMI11, La Versione 2011 del Database Macrosismico Italiano; Istituto Nazionale di Geofisica e Vulcanologia (INGV): Milano, Italy; Bologna, Italy, 2011. [CrossRef]
  99. Akinci, A.; Vannoli, P.; Falcone, G.; Taroni, M.; Tiberti, M.M.; Murru, M.; Burrato, P.; Mariucci, M.T. When time and faults matter: Towards a time-dependent probabilistic SHA in Calabria, Italy. Bull. Earthq. Eng. 2016, 15, 2497–2524. [Google Scholar] [CrossRef]
  100. Capuano, P.; De Natale, G.; Gasparini, P.; Pingue, F.; Scarpa, R. A model for the 1908 Messina Straits (Italy) earthquake by inversion of levelling data. Bull. Seismol. Soc. Am. 1988, 78, 1930–1947. [Google Scholar]
  101. Schick, R. Eine seismotektonische Bearbeitung des Erdbebens von Messina im Jahre 1908. Geol. Jahrb. 1977, 11, 3–74. [Google Scholar]
  102. Bottari, A.; Capuano, P.; De Natale, G.; Gasparini, P.; Neri, G.; Pingue, F.; Scarpa, R. Source parameters of earthquakes in the Strait of Messina, Italy, during this century. Tectonophysics 1989, 166, 221–234. [Google Scholar] [CrossRef]
  103. Bottari, A.; Carapezza, E.; Carapezza, M.; Carveni, P.; Cefali, F.; Lo Giudice, E.; Pandolfo, C. The 1908 Messina strait earthquake in the regional geostructural framework. J. Geodyn. 1986, 5, 275–302. [Google Scholar] [CrossRef]
  104. Meschis, M.; Roberts, G.P.; Mildon, Z.K.; Robertson, J.; Michetti, A.M.; Faure Walker, J.P. Slip on a mapped normal fault for the 28 th December 1908 Messina earthquake (Mw 7.1) in Italy. Sci. Rep. 2019, 9, 6481. [Google Scholar] [CrossRef] [PubMed] [Green Version]
  105. Mulargia, F.; Baldi, P.; Achilli, V.; Broccio, F. Recent crustal deformations and tectonics of the Messina Strait area. Geophys. J. R. Astr. Soc. 1984, 76, 369–381. [Google Scholar] [CrossRef] [Green Version]
  106. Guidoboni, E.; Ferrari, G.; Tarabusi, G.; Sgattoni, G.; Comastri, A.; Mariotti, D.; Ciuccarelli, C.; Bianchi, M.G.; Valensise, G. CFTI5Med, the new release of the catalogue of strong earthquakes in Italy and in the Mediterranean area. Sci Data 2019, 6, 80. [Google Scholar] [CrossRef] [PubMed] [Green Version]
  107. Rossi, A.; Tertulliani, A.; Azzaro, R.; Graziani, L.; Rovida, A.; Maramai, A.; Pessina, V.; Hailemikael, S.; Buffarini, G.; Bernardini, F.; et al. The 2016–2017 earthquake sequence in Central Italy: Macroseismic survey and damage scenario through the EMS-98 intensity assessment. Bull. Earthq. Eng. 2019, 17, 2407–2431. [Google Scholar] [CrossRef]
  108. Tertulliani, A.; Cecic, I.; Meurers, R.; Sovic, I.; Kaiser, D.; Grunthal, G.; Pazdirkova, J.; Sira, C.; Guterch, B.; Kysel, R.; et al. The 6 May 1976 Friuli earthquake: Re-evaluating and consolidating transnational macroseismic data. Boll. Di Geofis. Teor. Ed Appl. 2018, 59, 417–444. [Google Scholar] [CrossRef]
  109. Baratta, M. La Catastrofe Sismica Calabro-Messinese, 28 Dicembre 1908; Forni, Ed.; Società Geografica Italiana: Rome, Italy, 1910; p. 458. [Google Scholar]
  110. Sarconi, M. Istoria de’ Fenomeni del Tremoto Avvenuto Nelle Calabrie, e Nel Valdemone Nell’anno 1783 Posta in Luce Dalla Reale Accademia delle Scienze, e Delle Belle Lettere di Napoli; Presso Giuseppe Campo impressore della Reale Accademia: Naples, Italy, 1784. [Google Scholar]
  111. Martino, S.; Prestininzi, A.; Romeo, R.W. Earthquake-induced ground failures in Italy from a reviewed database. Nat. Hazards Earth Syst. Sci. 2014, 14, 799–814. [Google Scholar] [CrossRef] [Green Version]
  112. Cucci, L. NW-dipping versus SE-dipping causative faults of the 1783 M7.1 Southern Calabria (Italy) earthquake: The contribution from the analysis of the coseismic hydrological changes. Front. Earth Sci. 2022, 10, 987731. [Google Scholar] [CrossRef]
  113. Blumetti, A.M.; Guerrieri, L.; Porfido, S. Cataloguing the EEEs induceded by the 1783 5th February Calabrian earthquake: Implications for an improved seismic hazard. In Earthquake Environmental Effect for Seismic Hazard Assessment: The ESI Intensity Scale and the EEE Catalogue; Guerrieri, L., Ed.; A.T.I.—SYSTEMCART srl—S.EL.CA. srl: Rome, Italy, 2015; Volume XCVII. [Google Scholar]
  114. Comerci, V.; Blumetti, A.M.; Brustia, E.; Di Manna, P.; Guerrieri, L.; Lucarini, M.; Vittori, E. Landslides Induced by the 1908 Southern Calabria: Messina Earthquake (Southern Italy). In Landslide Science and Practice; Springer: Berlin, Germany, 2013; pp. 261–267. [Google Scholar]
  115. Comerci, V.; Vittori, E.; Blumetti, A.M.; Brustia, E.; Di Manna, P.; Guerrieri, L.; Lucarini, M.; Serva, L. Environmental effects of the December 28, 1908, Southern Calabria–Messina (Southern Italy) earthquake. Nat. Hazards 2015, 76, 1849–1891. [Google Scholar] [CrossRef]
  116. Mazzanti, P.; Bozzano, F. Revisiting the February 6th 1783 Scilla (Calabria, Italy) landslide and tsunami by numerical simulation. Mar. Geophys. Res. 2011, 32, 273–286. [Google Scholar] [CrossRef]
  117. Porfido, S.; Esposito, E.; Violante, C.; Molisso, F.; Sacchi, M.; Spiga, E. Earthquakes-Induced Environmental Effects in Coastal Area: Some Example in Calabria and Sicily (Southern Italy); CNR: Rome, Italy, 2011; pp. 1–12. [Google Scholar]
  118. Michetti, A.M.; Esposito, E.; Guerrieri, L.; Porfido, S.; Serva, L.; Tatevossian, R.; Vittori, E.; Audemard, F.; Azuma, T.; Clague, J.; et al. Intensity Scale ESI 2007 for Assessing Earthquake Intensities. In Mem. Descr. Carta Geologica d’Italia, Servizio Geologico d’Italia; Guerrieri, L., Vittori, E., Eds.; Dipartimento Difesa del Suolo, APAT: Rome, Italy, 2007; p. 74. [Google Scholar]
  119. Silva, P.G.; Michetti, A.M.; Guerrieri, L. Intensity Scale ESI 2007 for Assessing Earthquake Intensities. In Encyclopedia of Earthquake Engineering; Springer: Berlin, Germany, 2015; pp. 1–20. [Google Scholar]
  120. Brozzetti, F.; Boncio, P.; Cirillo, D.; Ferrarini, F.; de Nardis, R.; Testa, A.; Liberi, F.; Lavecchia, G. High-Resolution Field Mapping and Analysis of the August–October 2016 Coseismic Surface Faulting (Central Italy Earthquakes): Slip Distribution, Parameterization, and Comparison With Global Earthquakes. Tectonics 2019, 38, 417–439. [Google Scholar] [CrossRef] [Green Version]
  121. Lavecchia, G.; Castaldo, R.; de Nardis, R.; De Novellis, V.; Ferrarini, F.; Pepe, S.; Brozzetti, F.; Solaro, G.; Cirillo, D.; Bonano, M.; et al. Ground deformation and source geometry of the 24 August 2016 Amatrice earthquake (Central Italy) investigated through analytical and numerical modeling of DInSAR measurements and structural-geological data. Geophys. Res. Lett. 2016, 43, 12389–312398. [Google Scholar] [CrossRef]
  122. Tinti, E.; Scognamiglio, L.; Michelini, A.; Cocco, M. Slip heterogeneity and directivity of the ML 6.0, 2016, Amatrice earthquake estimated with rapid finite-fault inversion. Geophys. Res. Lett. 2016, 43, 10745–710752. [Google Scholar] [CrossRef]
  123. Gasperini, P.; Bernardini, F.; Valensise, G.; Boschi, E. Defining seismogenic sources from historical earthquake felt reports. Bull. Seismol. Soc. Am. 1999, 89, 94–110. [Google Scholar]
  124. Falcone, G.; Acunzo, G.; Mendicelli, A.; Mori, F.; Naso, G.; Peronace, E.; Porchia, A.; Romagnoli, G.; Tarquini, E.; Moscatelli, M. Seismic amplification maps of Italy based on site-specific microzonation dataset and one-dimensional numerical approach. Eng. Geol. 2021, 289, 106170. [Google Scholar] [CrossRef]
  125. Teves-Costa, P.; Batlló, J. The 23 April 1909 Benavente earthquake (Portugal): Macroseismic field revision. J. Seismol. 2010, 15, 59–70. [Google Scholar] [CrossRef] [Green Version]
  126. Atzori, S.; Hunstad, I.; Chini, M.; Salvi, S.; Tolomei, C.; Bignami, C.; Stramondo, S.; Trasatti, E.; Antonioli, A.; Boschi, E. Finite fault inversion of DInSAR coseismic displacement of the 2009 L’Aquila earthquake (central Italy). Geophys. Res. Lett. 2009, 36, L15305. [Google Scholar] [CrossRef]
  127. Lavecchia, G.; Adinolfi, G.M.; de Nardis, R.; Ferrarini, F.; Cirillo, D.; Brozzetti, F.; De Matteis, R.; Festa, G.; Zollo, A. Multidisciplinary inferences on a newly recognized active east-dipping extensional system in Central Italy. Terra Nova 2017, 29, 77–89. [Google Scholar] [CrossRef] [Green Version]
  128. Lavecchia, G.; Ferrarini, F.; Brozzetti, F.; Nardis, R.D.; Boncio, P.; Chiaraluce, L. From surface geology to aftershock analysis: Constraints on the geometry of the L’Aquila 2009 seismogenic fault system. Ital. J. Geosci. 2012, 131, 330–347. [Google Scholar] [CrossRef]
  129. Pino, N.A.; Di Luccio, F. Source complexity of the 6 April 2009 L’Aquila (central Italy) earthquake and its strongest aftershock revealed by elementary seismological analysis. Geophys. Res. Lett. 2009, 36, L23305. [Google Scholar] [CrossRef]
  130. De Guidi, G.; Caputo, R.; Scudero, S. Regional and local stress field orientation inferred from quantitative analyses of extension joints: Case study from southern Italy. Tectonics 2013, 32, 239–251. [Google Scholar] [CrossRef] [Green Version]
  131. Ferranti, L.; Monaco, C.; Morelli, D.; Antonioli, F.; Maschio, L. Holocene activity of the Scilla Fault, Southern Calabria: Insights from coastal morphological and structural investigations. Tectonophysics 2008, 453, 74–93. [Google Scholar] [CrossRef]
  132. Lay, T.; Wallace, T.C. Modern Global Seismology. International Geophysics Series; Academic Press: San Diego, CA, USA, 1995; pp. ii–iii. [Google Scholar]
  133. Brozzetti, F.; Mondini, A.C.; Pauselli, C.; Mancinelli, P.; Cirillo, D.; Guzzetti, F.; Lavecchia, G. Mainshock Anticipated by Intra-Sequence Ground Deformations: Insights from Multiscale Field and SAR Interferometric Measurements. Geosciences 2020, 10, 186. [Google Scholar] [CrossRef]
  134. Cheloni, D.; De Novellis, V.; Albano, M.; Antonioli, A.; Anzidei, M.; Atzori, S.; Avallone, A.; Bignami, C.; Bonano, M.; Calcaterra, S.; et al. Geodetic model of the 2016 Central Italy earthquake sequence inferred from InSAR and GPS data. Geophys. Res. Lett. 2017, 44, 6778–6787. [Google Scholar] [CrossRef]
  135. Ganas, A.; Kourkouli, P.; Briole, P.; Moshou, A.; Elias, P.; Parcharidis, I. Coseismic displacements from moderate-size earthquakes mapped by Sentinel-1 differential interferometry: The case of February 2017 Gulpinar Earthquake Sequence (Biga Peninsula, Turkey). Remote Sens. 2018, 10, 1089. [Google Scholar] [CrossRef] [Green Version]
  136. Graziani, L.; Maramai, A.; Tinti, S. A revision of the 1783–1784 Calabrian (southern Italy) tsunamis. Nat. Hazards Earth Syst. Sci. 2006, 6, 1053–1060. [Google Scholar] [CrossRef] [Green Version]
  137. Barbano, M.S.; Azzaro, R.; Grasso, D.E. Earthquake Damage Scenarios and Seismic Hazard of Messina, North-Eastern Sicily (Italy) as Inferred from Historical Data. J. Earthq. Eng. 2005, 9, 805–830. [Google Scholar] [CrossRef]
  138. Oddone, E. Relazione preliminare intorno al grande terremoto di Sicilia e Calabria del 28 dicembre 1908. Boll. Die Erdbebennacte 1909, VIII, 1–6. [Google Scholar]
  139. Rizzo, G.B. Propagazione dei movimenti prodotti dal terremoto di Messina del 28 dicembre 1908. Mem. R. Acc. Sc. Torino 1911, 2. [Google Scholar]
  140. Musson, R.M.W.; Grünthal, G.; Stucchi, M. The comparison of macroseismic intensity scales. J. Seismol. 2009, 14, 413–428. [Google Scholar] [CrossRef] [Green Version]
  141. Hanks, T.; Kanamori, H. A moment magnitude scale. J. Geophys. Res. 1979, 84, 2348–2350. [Google Scholar] [CrossRef]
  142. Galli, P.; Molin, D. Il terremoto del 1905 in Calabria: Revisione della distribuzione degli effetti e delle ipotesi sismogenetiche. Ital. J. Quat. Sci. 2009, 22, 207–234. [Google Scholar]
  143. Loreto, M.F.; Fracassi, U.; Franzo, A.; Del Negro, P.; Zgur, F.; Facchin, L. Approaching the seismogenic source of the Calabria 8 September 1905 earthquake: New geophysical, geological and biochemical data from the S. Eufemia Gulf (S Italy). Mar. Geol. 2013, 343, 62–75. [Google Scholar] [CrossRef] [Green Version]
  144. Loreto, M.F.; Zgur, F.; Facchin, L.; Fracassi, U.; Pettenati, F.; Tomini, I.; Burca, M.; Diviacco, P.; Sauli, C.; Cossarini, G.; et al. In search of new imaging for historical earthquakes: A new geophysical survey offshore western Calabria (southern Tyrrhenian Sea, Italy). Boll. Di Geofis. Teor. Ed Appl. 2012, 53, 385–401. [Google Scholar] [CrossRef]
  145. Presti, D.; Neri, G.; Orecchio, B.; Scolaro, S.; Totaro, C. The 1905 Calabria, Southern Italy, Earthquake: Hypocenter Location, Causative Process, and Stress Changes Induced in the Area of the 1908 Messina Straits Earthquake. Bull. Seismol. Soc. Am. 2017, 107, 2613–2623. [Google Scholar] [CrossRef]
  146. Aloisi, M.; Bruno, V.; Cannavò, F.; Ferranti, L.; Mattia, M.; Monaco, C.; Palano, M. Are the source models of the M 7.1 1908 Messina Straits earthquake reliable? Insights from a novel inversion and a sensitivity analysis of levelling data. Geophys. J. Int. 2013, 192, 1025–1041. [Google Scholar] [CrossRef] [Green Version]
  147. Mulargia, F.; Tinti, E. Seismic sample areas defined from incomplete catalogues: An application to the Italian territory. Phys. Earth Planet. Inter. 1985, 40, 273–300. [Google Scholar] [CrossRef]
  148. Pasari, S. Stochastic modelling of earthquake interoccurrence times in Northwest Himalaya and adjoining regions. Geomat. Nat. Hazards Risk 2018, 9, 568–588. [Google Scholar] [CrossRef] [Green Version]
Figure 3. Sketch describing the methodological steps for the elliptical seismic sources’ construction. (a) Clustering of Imax points of the whole macroseismic field: points with maximum intensity within the dashed line (intermediate classes are downgraded to the lower class) are divided into two clusters and the position of the corresponding centroid is calculated (yellow dots); (b) partitioning of the macroseismic field with respect to cluster centroids: points and squares represent the macroseismic subfields separated with respect to the proximity of the two centroids (indicated by the red arrows), respectively; (c) magnitude and epicenter calculation of the whole macroseismic field (yellow star) and representation of the axes of elongation. Red dashed ellipses are the 80% probability contour calculated using the selected points and squares of the macroseismic subfields; red solid ellipses are the 80% probability contours calculated excluding the outlier points (marked with black crosses); (d) representation of the elliptical seismic sources. Light yellow ellipses represent the elliptical seismic sources of the macroseismic subfield.
Geosciences 13 00212 g003
Figure 4. Linear regressions of (a) M vs. SRL; (b) M vs. L; (c) M vs. W; and (d) M vs. A. References’ acronyms as in Table 2. Yellow stars represent an earthquake with Mw 6.5; the vertical black line is the average value of seismic source geometrical parameters (SRL, L, W, A); vertical dashed black lines represent the variability of seismic source geometrical parameters (based on standard deviation values).
Geosciences 13 00212 g004
Figure 5. Updated map of the coseismic effects of the 1783-SS (data from the CFTIMed catalog [106] integrated with [112,113]). Openings and fractures, soil liquefaction, hydrological anomalies, and landslides are reported on the same structural map as in Figure 1a. The shapefile of coseismic effects is made available in Supplementary Data S3.
Geosciences 13 00212 g005
Figure 6. Detail of the epicentral areas of the 1783-SS macroseismic fields with previous and recalculated macroseismic epicenters and main active fault systems. (ae) are the location of the events reported above the panels themselves. Note that the 6 February and 1 March events have no epicenter in the CPTI15 catalog.
Geosciences 13 00212 g006
Figure 7. Detail of the epicentral areas of the 1791, 1894, and 1908 macroseismic fields. (ac) are the locations of the events reported above the panels themselves.
Geosciences 13 00212 g007
Figure 8. Inferred elliptical seismic sources of the 1783-SS. The light-yellow ellipses represent the medium sources. (a) Representation of elliptical seismic sources associated with the 5 February 1783 event (rhombuses and squares represent the northern and southern macroseismic sub-fields, respectively); (b) representation of elliptical seismic source associated with the 6 February 1783 event; (c) representation of elliptical seismic source associated with the 7 February 1783 event; (d) representation of elliptical seismic source associated with the 1 March 1783 event; (e) representation of elliptical seismic source associated with the 28 March 1783 event. Min. and max. elliptical seismic sources are available in Supplementary Data S5.
Geosciences 13 00212 g008
Figure 9. Elliptical seismic sources of 1791 Central Calabria, 1894 Southern Calabria, and 1908 Messina Straits earthquakes. The light-yellow ellipses represent the medium sources. (ac) represent the elliptical seismic sources associated with the earthquakes reported on the panel itself. In panel (c) the diamond and square points represent the northern and southern macroseismic sub-fields, respectively). Min and Max elliptical seismic sources are available in Supplementary Data S5.
Geosciences 13 00212 g009
Figure 10. Space–time diagram showing the distribution of seismic sources of major earthquakes from 1609 to the present and with Mw > 5.5 along the longitudinal ENE–WSW vertical section across southern Calabria. Yellow ellipses from data in CPTI-15; blue ellipses from data in this paper. Cumulate average displacement curves: red for the cumulate slip of each cycle, blue for the total cumulate slip of all cycles.
Geosciences 13 00212 g010
Table 1. Average direction and dip-direction of the most relevant fault systems in the study area. Id refers to rose diagram plots in Figure 1a.
IdFault NameMean DirectionMean Dip-Direction
1Lamezia–CatanzaroN101° E ± 3°101° ± 3°
2Serre main fault and internal splayN029° E ± 2°209° ± 2°
3Cittanova and outer splayN032° E ± 2°212° ± 2°
4DelianuovaN055° E ± 2°235° ± 2°
5Armo and Reggio CalabriaN024° E ± 2°204° ± 2°
6Scilla and Sant’Eufemia dell’AspromonteN070° E ± 3°250° ± 3°
7Messina and West faultN033° E ± 5°033° ± 5°
8RosarnoN117° E ± 2°117° ± 2°
9VallefioritaN128° E ± 3°128° ± 3°
Table 2. List of regression laws from the literature for extensional tectonic regimes. SRL: surface rupture length; L: sub-surface rupture length; W: rupture width; A: rupture area.
SRL (km)L (km)W (km)A (km2)
W&C94 [53]Log(SRL)= −2.01 + 0.5 × MLog (L) = −1.88 + 0.5 × MLog(W) = −1.14 + 0.35 × MLog(A) = (−2.84 + 0.82 × M)
Ma96 [48]M = 4.86 + 1.32 × Log(SRL)
MM&Be00 [47] Log(L) =
−6.39 + 0.4 × Log(M0)
Log(W)
=−5.51 + 0.35 × Log(M0)
Log(A) =
−11.9 + 0.75 × Log(M0)
Vi01 [52] M = 3.39 + 1.33 × Log(A)
P&C04 [49]M = 0.9 × Log(SRL) + 5.48
Ga08 [21]M = 4.7248 × SRL 0.1046
Ha&Ba08 [44] M = Log (A) +3.98 ± 0.03
We08 [54]M = 6.12 + 0.47 × Log(SRL)
Le10 [45]M = 4.4 + 1.52 × Log(SRL)M = 1.67 × Log(L) + 4.24 M = Log(A) + 4
Le14 [46] M = 1.667 × Log(L) + 4.24 M = 3.63 + 2.5 × Log (W)M = Log(A) + 4.19
Th17 [51] Log(L) = −1.722 − 0.485 × MLog(W) = −0.829 + 0.323 × MLog (A) = −2.551 + 0.808 × M
Al&Ha18 [43] Log(L) = −2.9 + 0.63 × MLog(W) = −1.91 + 0.48 × MLog (A) = −5.62+ 1.22 × M
SS21 [50] M = 4.53 + 1.44 × Log(L)
Table 3. Earthquake parameters. Key: I0: epicentral intensity (calculated as in [36]); Mw: equivalent magnitude with error; MDP: macroseismic data points; 1 MDP used on MDP selected; 2 axis parameters obtained using selected points and unselected points (in the brackets); 3 value ± the standard deviation; 4 surface width calculated considering a seismic source with a dip angle of 60°.
Historical
EQ
CPTI-15 CatalogThis Work
Earthquake
Parameters
Earthquake
Parameters
Elongation Parameters of Max Intensities’ Macroseismic FieldGeometric Parameters of
Elliptical Source 3
Seismic
Sequence
I0MWMDPSourceI0MWMDPIntensity RangeMDP
Selected 1
Max AxisArea
(km2)
Length
(km)
Width
(km)
Surface Width
(km) 4
Length 2Direction 2
Central–Southern Calabria 17835 Feb117.1356Single10–116.84 ± 0.0836710–11 to
9–10
44/5035.1
(35.8)
37.9
(38.4)
763 ± 31139 ± 625 ± 412 ± 4
North10–116.6 ± 0.1521510–11 to
9–10
22/2722.5
(22.5)
25.4
(28.8)
392 ± 15527 ± 519 ± 39 ± 3
South10–116.6 ± 0.1615210–11 to
9–10
22/2713.4
(15.2)
58.9
(80.0)
401 ± 15827 ± 519 ± 39 ± 3
6 Feb--8Single96.22 ± 0.18819 to 840/4720.9
(38.4)
17.2
(70.7)
180 ± 7218 ± 314 ± 27 ± 2
7 Feb10–116.74191Single10–116.67 ± 0.122710–11 to
9–10
20/2615.4
(24.7)
41.3
(74.0)
530 ± 20132 ± 521 ± 311 ± 3
1 Mar--18Single8–96 ± 0.53218–9 to 7–810/1520.1
(19.8)
9.4
(9.4)
119 ± 4613 ± 311 ± 26 ± 2
28 Mar117.03323Single10–116.81 ± 0.0933610–11 to
9–10
23/2825.2
(26.5)
26.4
(57)
715 ± 28838 ± 624 ± 412 ± 4
Central
Calabria
13/10/1791
96.1476Single8–95.89 ± 0.22768–9 to 7–823/2839.1
(40.4)
44.4
(45.4)
98 ± 3912 ± 311± 25 ± 2
Southern
Calabria 16/11/1894
96.12303Single96.08 ± 0.13029 to 811/1624.2
(331.8)
70.2
(76.1)
141 ± 5315 ± 312 ± 26 ± 2
Messina Strait 28/12/1908117.1772Single10–116.83 ± 0.0681410–11 to
9–10
77/9823.5
(32.1)
1
(2.9)
747 ± 30439 ± 624 ± 412 ± 4
North10–116.69 ± 0.1349710–11 to
9–10
51/6023.3
(31.7)
79.8
(72.0)
427 ± 17128 ± 519 ± 3 10 ± 3
South10–116.55 ± 0.1431710–11 to
9–10
35/4017.0
(19.8)
20.3
(25.9)
345 ± 13425 ± 418 ± 39 ± 3
Table 4. Earthquake seismic sources’ quality parameters. (1) Direction and (2) shape ratio of major and minor axes lengths of the preliminary macroseismic field elongation calculated in step 3 of Section 3.4.3 (see also Figure 3c); (3) direction and (4) shape ratio of major and minor axis lengths of the final (after outlier points exclusion) macroseismic field elongation calculated in step 5 of Section 3.4.3; ID as in Table 1; (5) mean direction of fault systems, as in Table 1; (Qm) quality of the macroseismic field elongation computed as the difference between (1) and (3); (Qe) quality of the ellipse computed as the ratio between the major and minor axes of the ellipse; (Qs) quality of the seismic source obtained comparing its direction (3) with the directions of the fault system on the area (5); see main text for description of qualities.
Historical
Earthquakes
Macroseismic Field ElongationNeighboring
Faults
Seismic Source Qualities
Preliminary Elongation AxesFinal Elongation Axes
DateMw1
Direction
2
Shape Ratio
3
Direction
4
Shape Ratio
ID5
Mean Dir
Qm
(1–3)

(4)
Qs
(3–5)
05/02/1783
Tot
6.838.42.237.93.1332AAA
05/02/1783
North
6.628.81.325.41.8332AAA
05/02/1783
South
6.680.01.258.91.5670BBA
06/02/17836.270.71.617.21.7524CAA
07/02/17836.774.01.941.32.3229BAA
01/03/17836.09.42.49.42.9229AAA
28/03/17836.857.01.026.41.3229BBA
13/10/17915.945.42.044.42.5229AAA
16/11/18946.176.11.870.22.1670AAA
28/12/1908
Tot
6.82.91.41.11.4733ABB
28/12/1908
North
6.672.02.379.82.2733AAC
28/12/1908
South
6.525.91.720.32.1524AAA
Disclaimer/Publisher’s Note: The statements, opinions and data contained in all publications are solely those of the individual author(s) and contributor(s) and not of MDPI and/or the editor(s). MDPI and/or the editor(s) disclaim responsibility for any injury to people or property resulting from any ideas, methods, instructions or products referred to in the content.

