

Influence of Localized Rainfall Patterns on Landslide Occurrence—A Case Study of Southern Hiroshima with eXtended Radar Information Network Data during the July 2018 Heavy Rain Disasters


Abstract
:1. Introduction
2. Materials and Methods
2.1. Study Area
2.2. XRAIN Radar-Acquired Rainfall Data
2.3. Data Analysis
2.3.1. Localization Patterns
2.3.2. Intensity–Duration Rainfall Threshold
2.3.3. Event Precipitation and Mean Annual Precipitation Comparison
3. Results and Discussion
3.1. Event Rainfall: 5 to 7 July 2018 Precipitation
3.2. Intensity–Duration Threshold for Southern Hiroshima
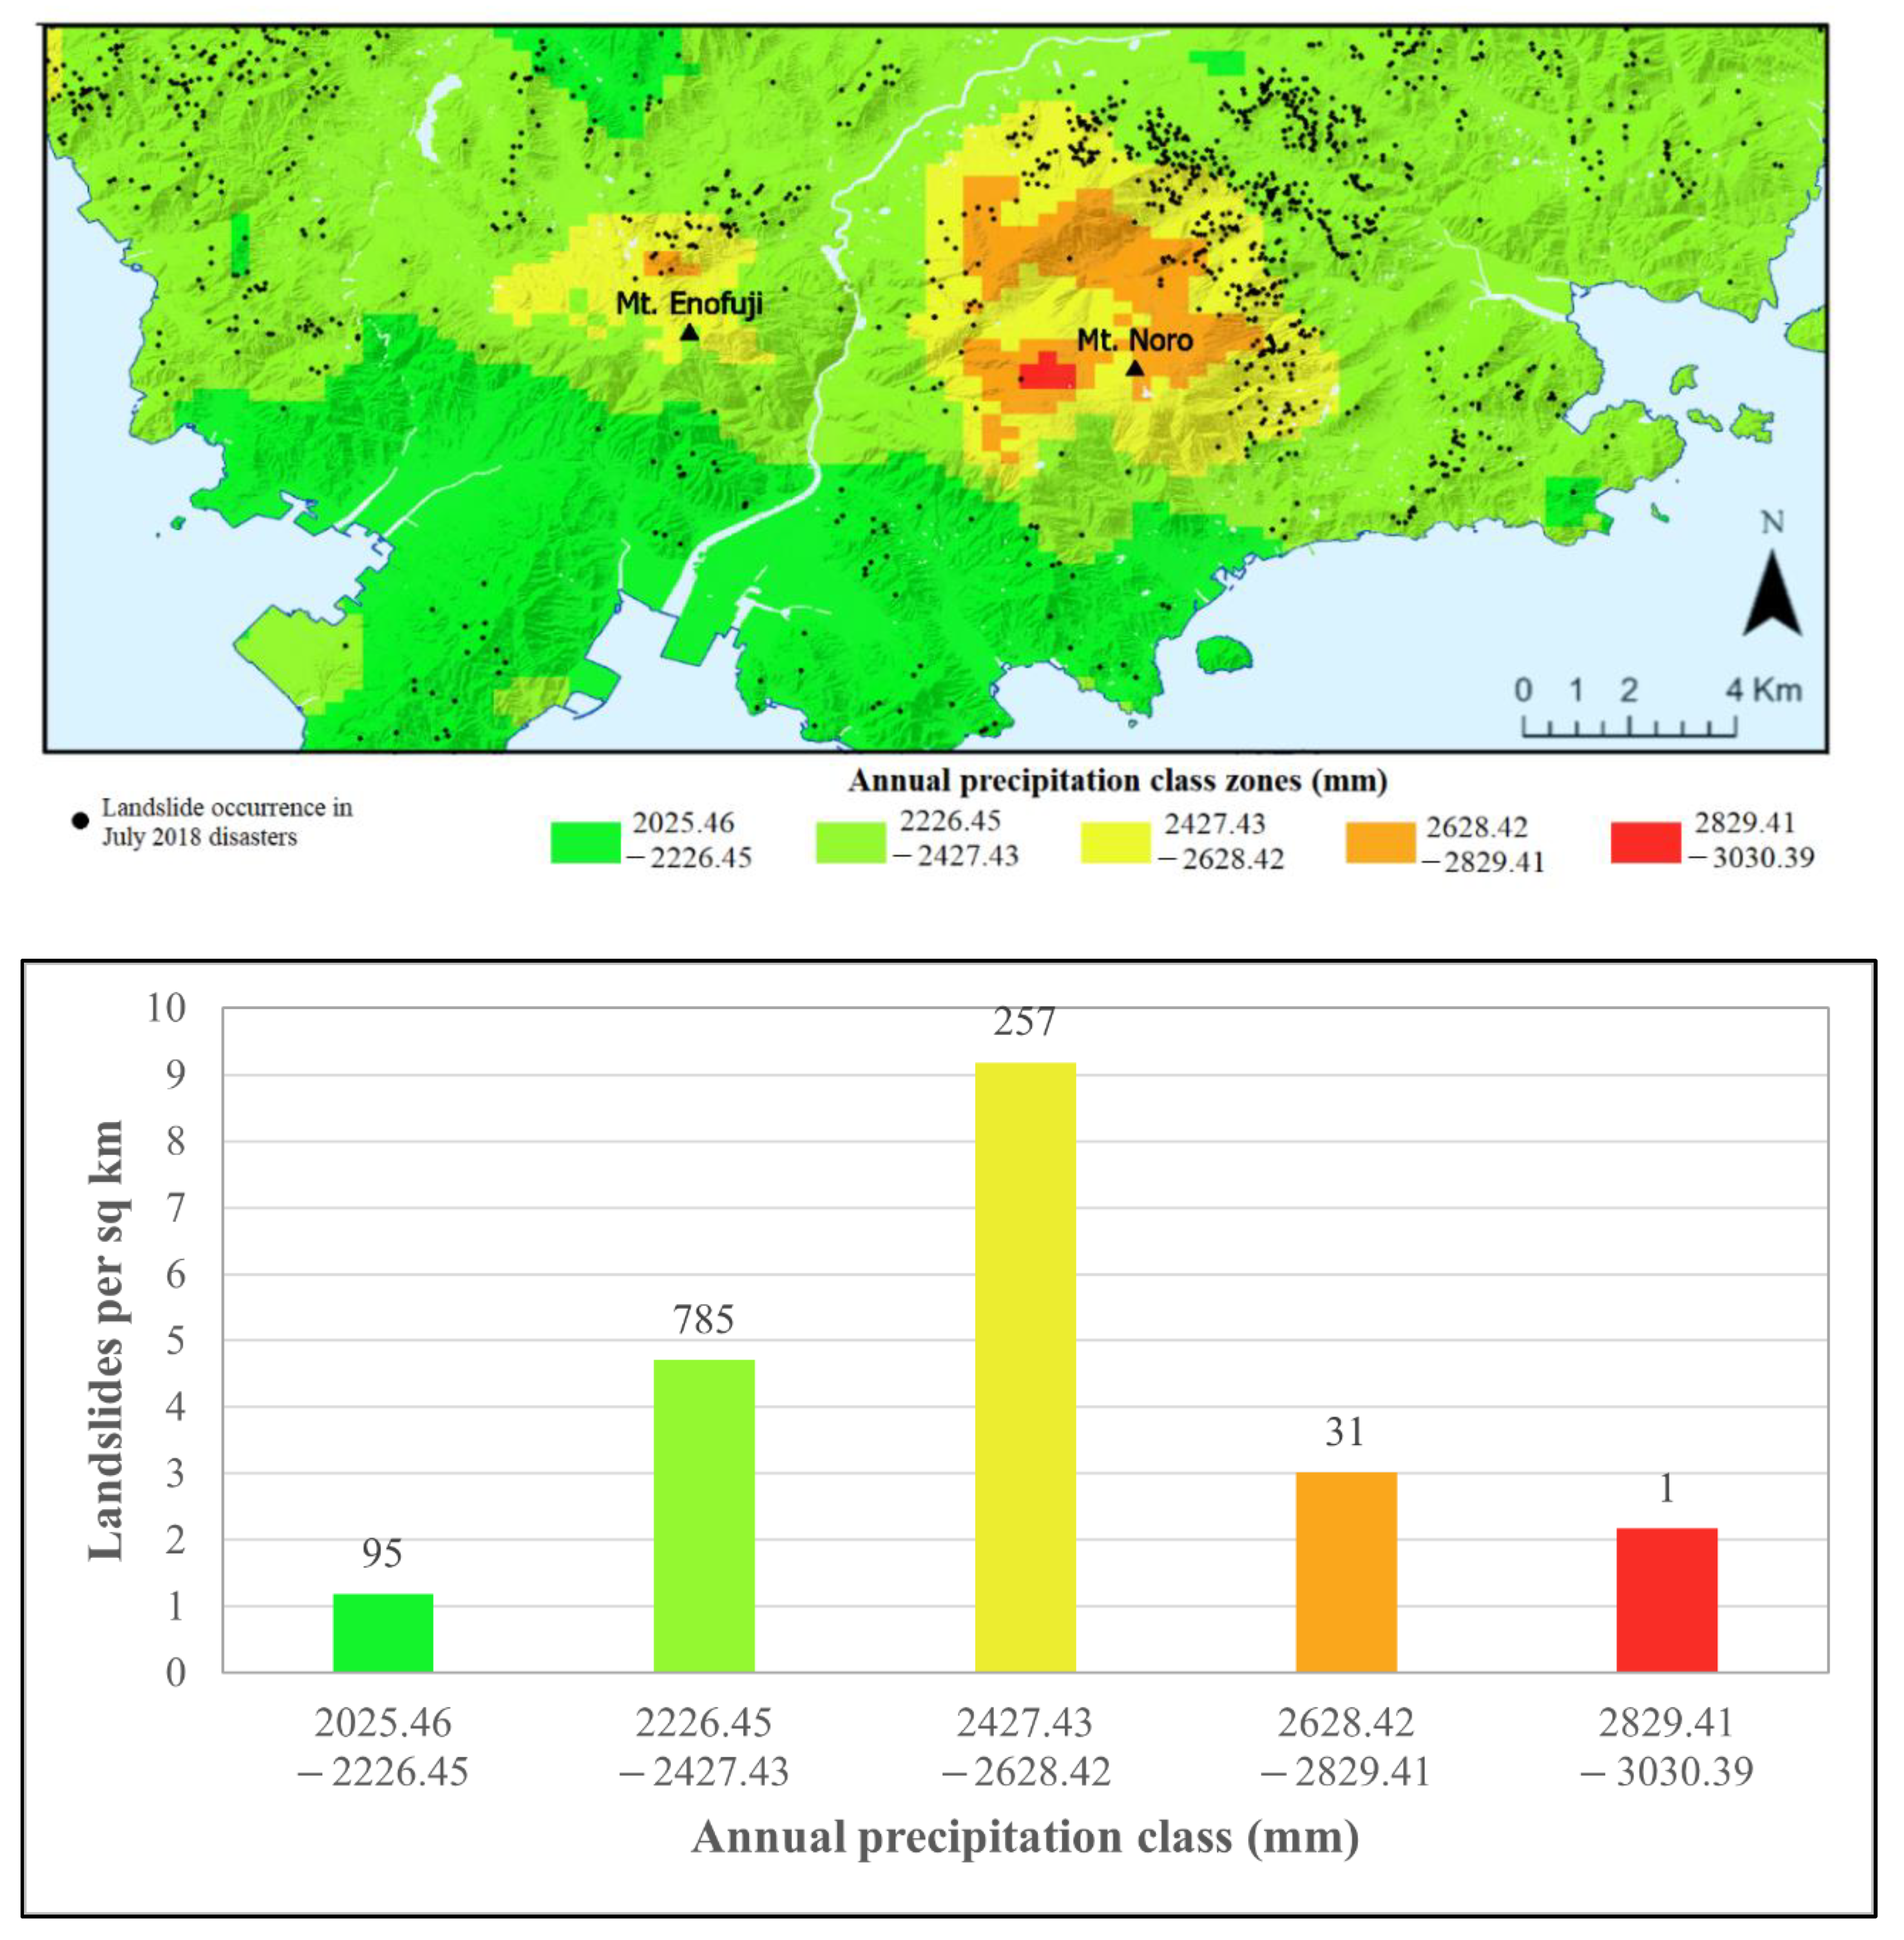
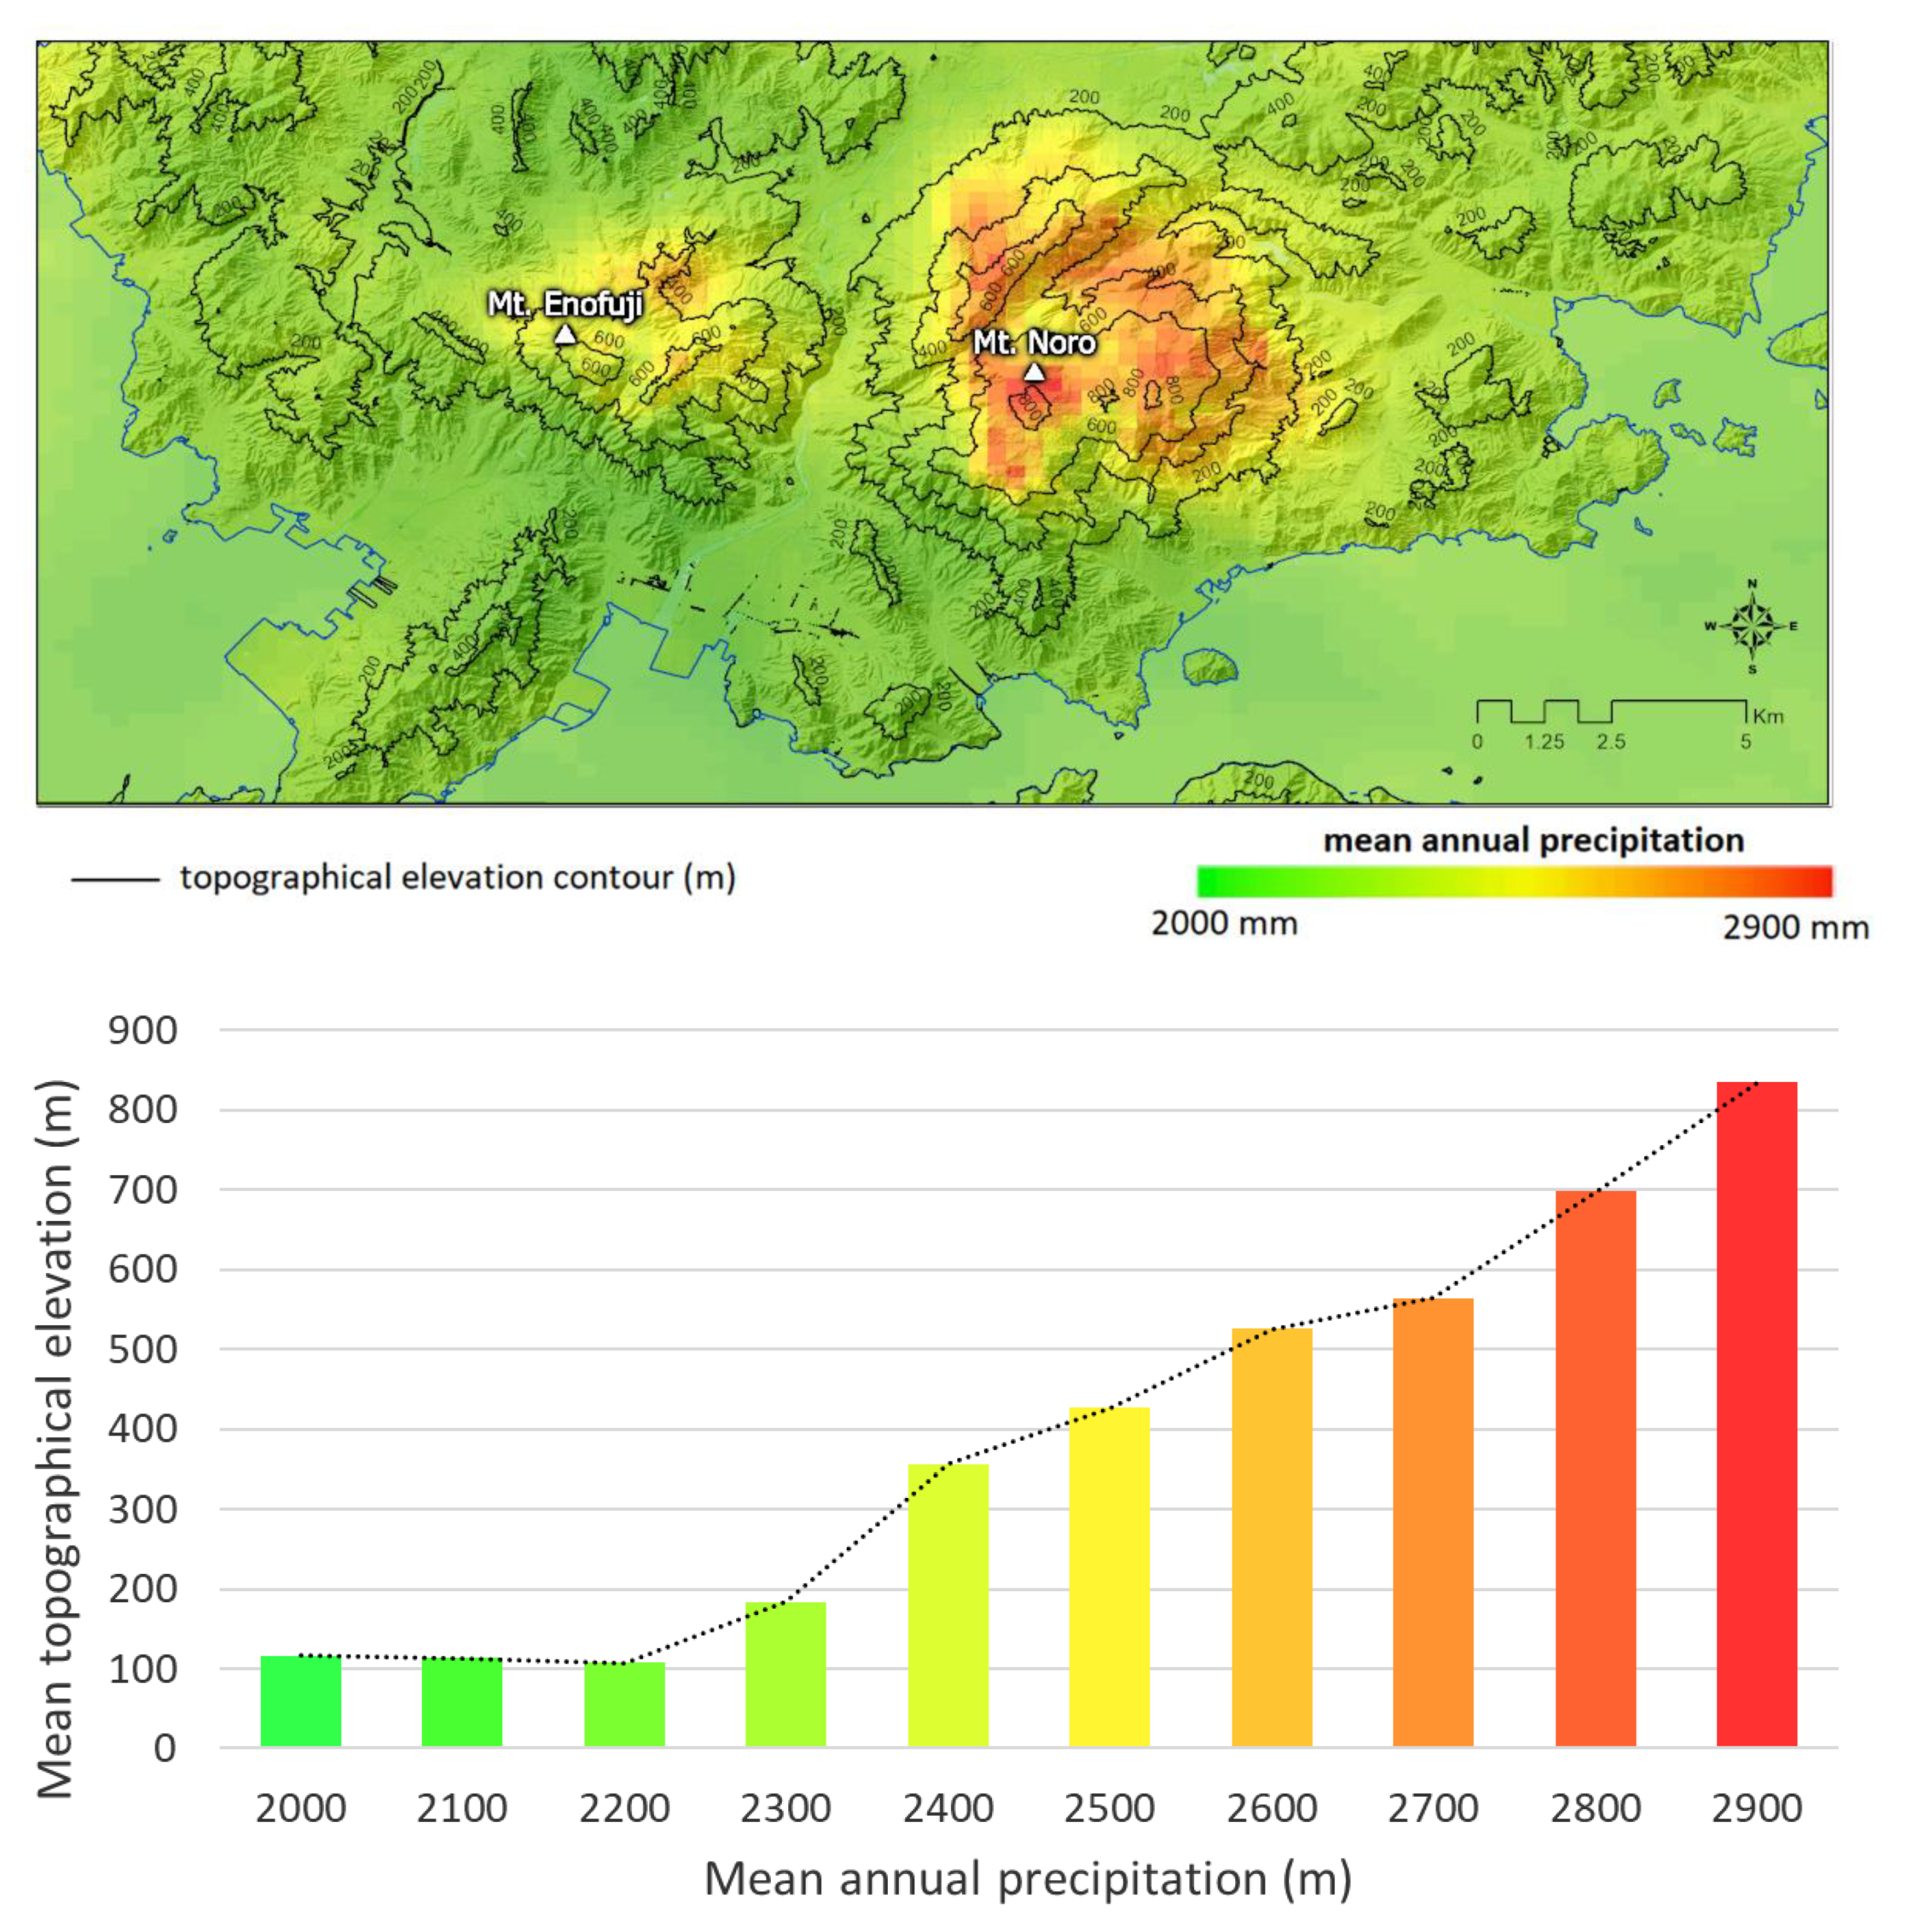
3.3. Long-Term Rainfall: Mean Annual Precipitation
3.4. Event and Long-Term Rainfall Localization Patterns Correlation
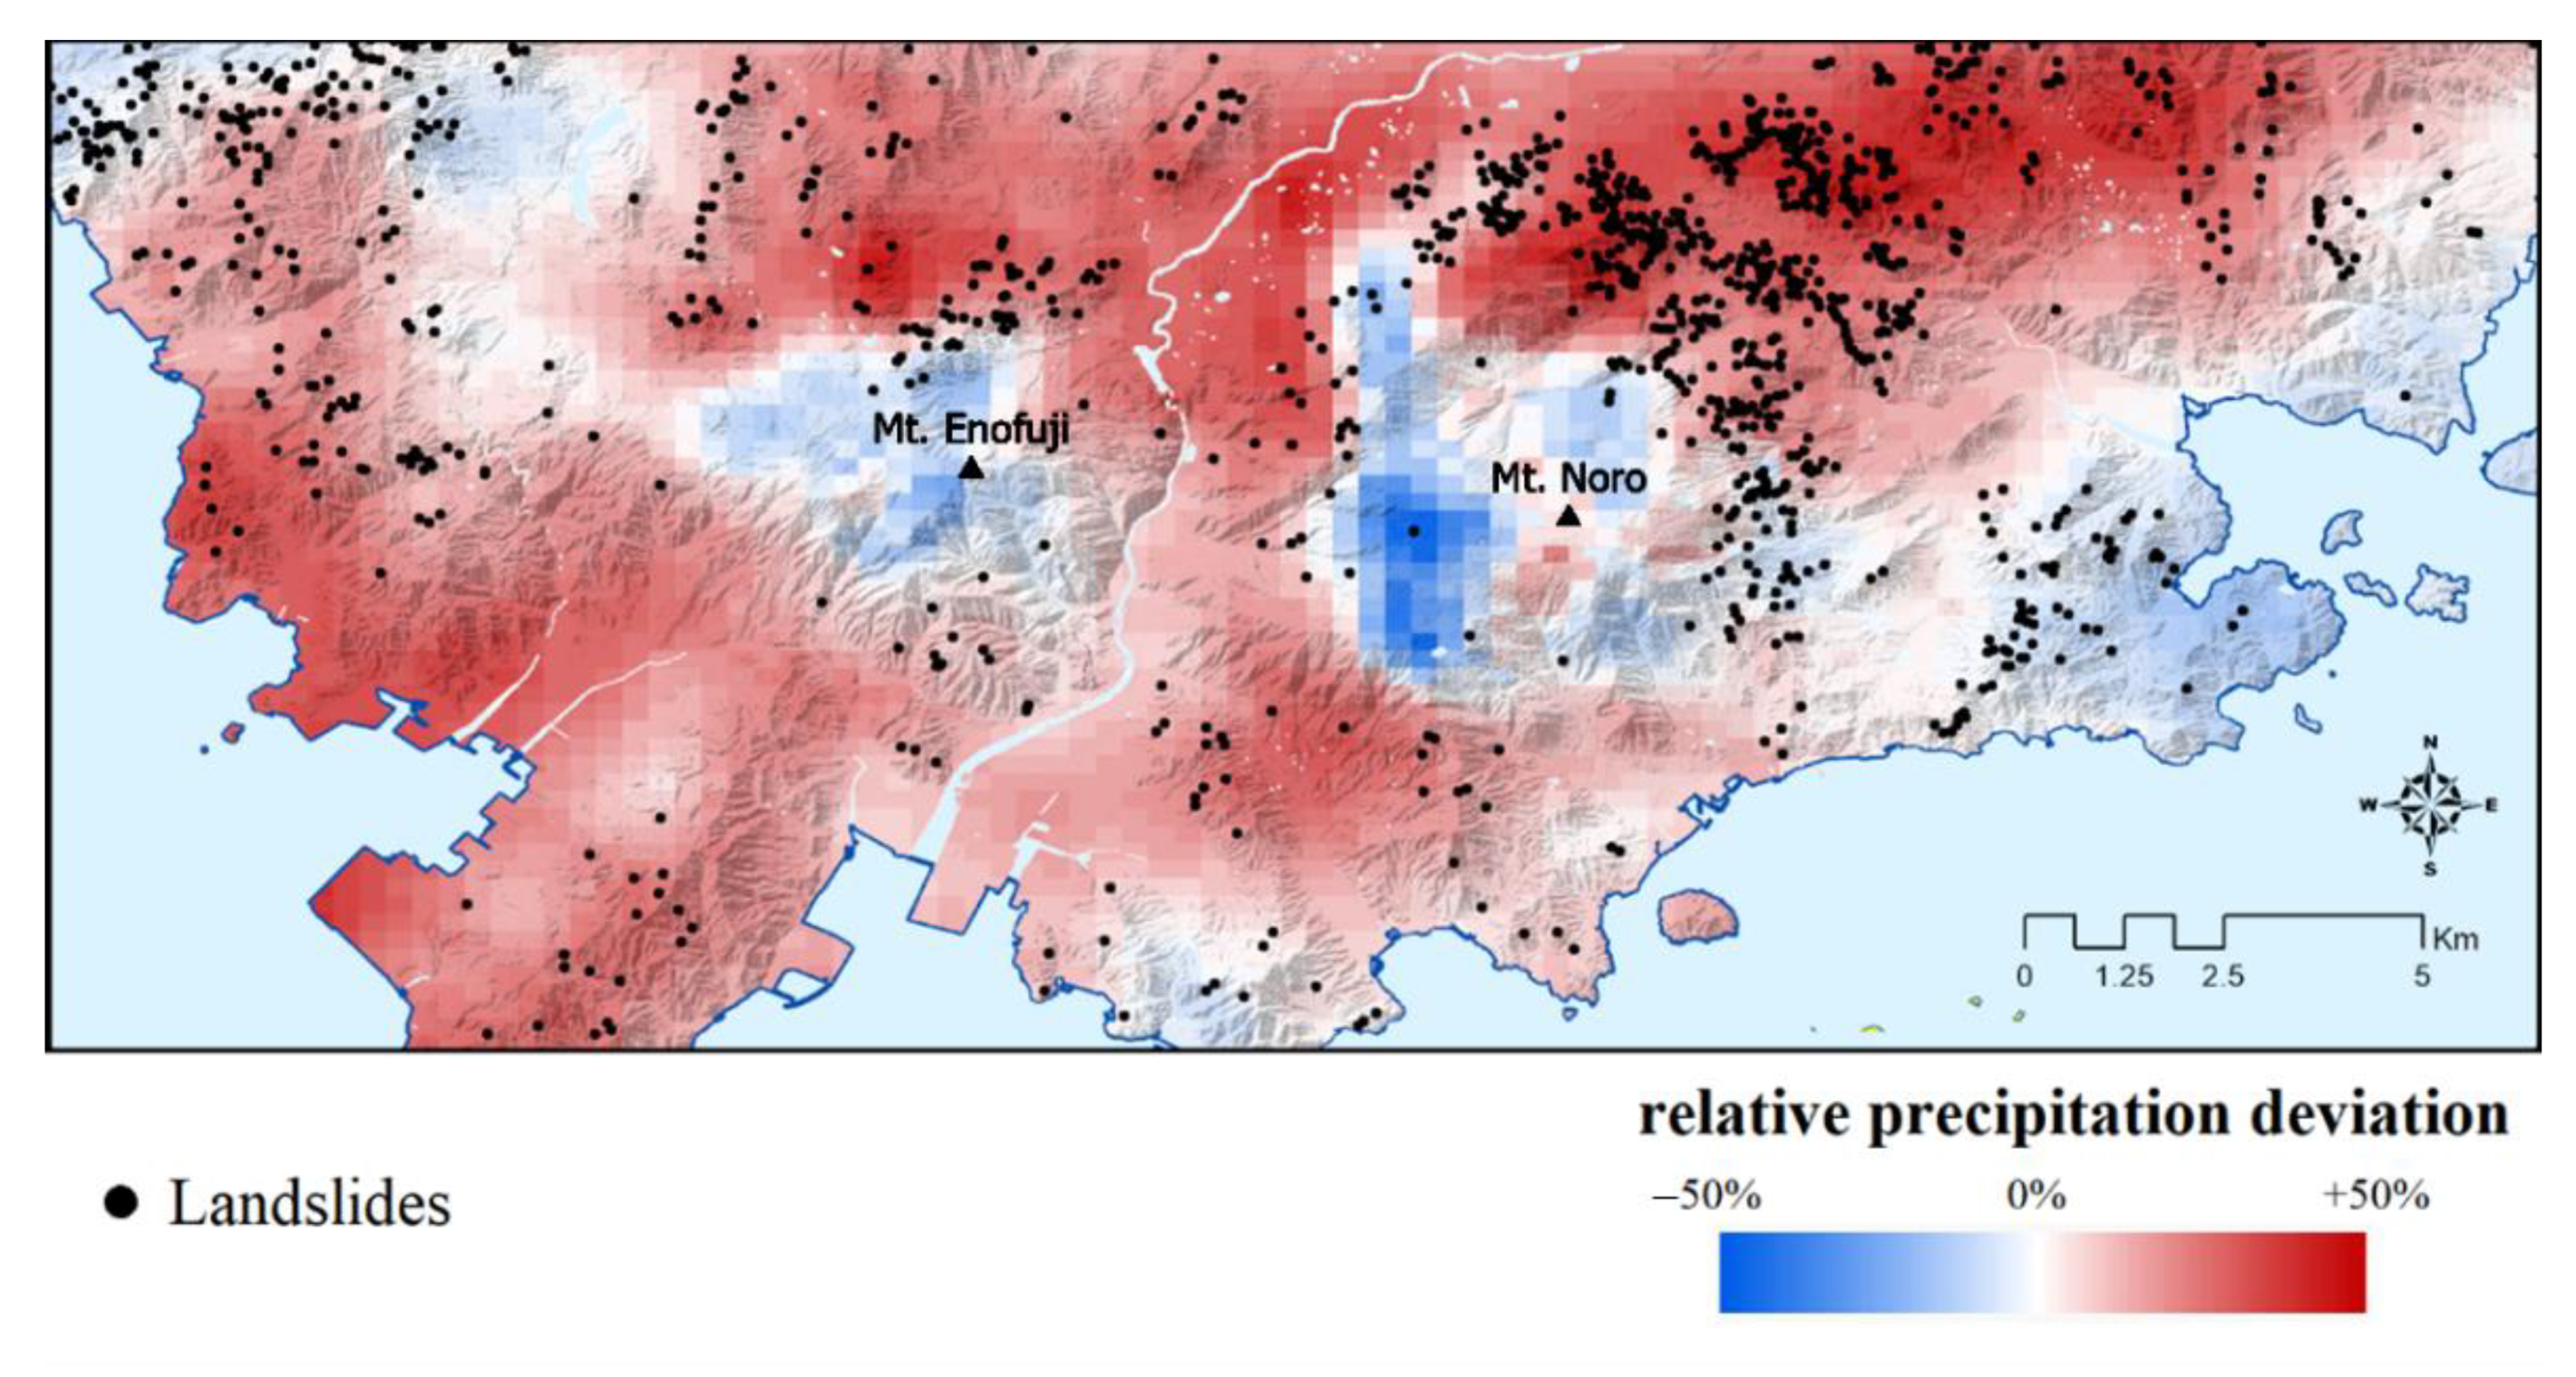
3.4.1. Relative Mean Annual Precipitation Differences
3.4.2. Pearson’s Product-Moment Correlation Coefficient
4. Conclusions
Author Contributions
Funding
Data Availability Statement
Acknowledgments
Conflicts of Interest
References
- Geertsema, M.; Highland, L.; Vaugeouis, L. Environmental impact of landslides. In Landslides–Disaster Risk Reduction; Springer: Berlin/Heidelberg, Germany, 2009; pp. 589–607. [Google Scholar]
- Yilmaz, I. Landslide susceptibility mapping using frequency ratio, logistic regression, artificial neural networks and their comparison: A case study from Kat landslides (Tokat—Turkey). Comput. Geosci. 2009, 35, 1125–1138. [Google Scholar] [CrossRef]
- Petley, D. Global patterns of loss of life from landslides. Geology 2012, 40, 927–930. [Google Scholar] [CrossRef]
- Centre for Research on the Epidemiology of Disasters. Economic Losses, Poverty & Disasters 1998–2017. United Nations Office for Disaster Risk Reduction. Available online: https://www.preventionweb.net/files/61119_credeconomiclosses.pdf (accessed on 27 July 2022).
- Guzzetti, F.; Cardinali, M.; Reichenbach, P. The Influence of Structural Setting and Lithology on Landslide Type and Pattern. Environ. Eng. Geosci. 1996, II, 531–555. [Google Scholar] [CrossRef]
- Dai, F.; Lee, C.; Ngai, Y. Landslide risk assessment and management: An overview. Eng. Geol. 2002, 64, 65–87. [Google Scholar] [CrossRef]
- Osanai, N.; Tomita, Y.; Akiyama, K.; Matsushita, T. Technical Note of National Institute for Land and Infrastructure Management No.530; National Institute for Land and Infrastructure Management, Ministry of Land, Infrastructure, Transport and Tourism: Tokyo, Japan, 2009. [Google Scholar]
- Canavesi, V.; Camarinha, P.I.M.; Algarve, V.R.; Carneiro, R.L.C.; Alvalá, R.C.S. Análise da susceptibilidade a deslizamentos de terra: Estudo de caso de Paraibuna, SP. In XVI Simpósio Brasileiro de Sensoriamento Remoto; SBSR: Foz do Iguaçu, Brazil, 2013. [Google Scholar]
- Matsushi, Y.; Matsuzaki, H.; Makino, H. Testing models of landform evolution by determining the denudation rates of mountainous watersheds using terrestrial cosmogenic nuclides. Trans. Jpn. Geomorphol. Union 2014, 35, 165–185. [Google Scholar]
- Geospatial Information Authority of Japan. Information on Heavy Rain in July 2018 (Translated Title). Ministry of Land, Infrastructure, Transport and Tourism. Available online: https://www.gsi.go.jp/BOUSAI/H30.taihuu7gou.html (accessed on 20 June 2020).
- Geospatial Information Authority of Japan. Database. Available online: https://www.gsi.go.jp/top.html (accessed on 13 June 2022).
- Japanese Meteorological Agency. Emergency Warning Issued to Kyoto and Hyogo Prefectures. Available online: http://www.jma.go.jp/jma/press/1807/06e/kaisetsu2018070623.pdf (accessed on 20 June 2020).
- Hiroshima Prefectural Government. July 2018 Heavy Rain Disasters (Translated Title). Available online: https://www.sabo.pref.hiroshima.lg.jp/portal/sonota/sabo/pdf/234_H30_7gouusaigai.pdf (accessed on 20 December 2021).
- Hirao, K.; Okubo, S. About the heavy rain disaster—Sediment flow out of Hamada River, Kure City—Some Aspects of the Dispersion Control for the Debris Arrestation. Jpn. Soc. Eros. Control Eng. 1970, 75. [Google Scholar]
- Chigira, M. Micro-sheeting of granite and its relationship with landsliding specifically after the heavy rainstorm in June 1999, Hiroshima Prefecture, Japan. Eng. Geol. 2001, 59, 219–231. [Google Scholar] [CrossRef]
- Ushiyama, M.; Ohido, S.; Takara, K. The critical line for sediment disaster warning based on precipitation data in Hiroshima Prefecture in June 1999. In Collection of River Technology Papers (Translated Title); Japan Society of Civil Engineers: Tokyo, Japan, 2001; Volume 7. [Google Scholar]
- Miura, K.; Anan, S.; Fujimoto, M.; Niimi, T.; Ueda, T.; Okamura, M. Hiroshima—Kure Soil and Sand Disaster Bulletin—Soil and sand damage in the granite area. J. Jpn. Soc. Eng. Geol. 1999, 40, 316–321. [Google Scholar] [CrossRef]
- Uchiyama, S.; Sugai, T. Damage characteristics of debris flow disasters caused by heavy rain in Hiroshima City in August 2014. Nat. Disaster Sci. J. 2019, 38. [Google Scholar]
- Highland, L.M.; Bobrowsky, P. The Landslide Handbook—A Guide to Understanding Landslides; Circular 1325; U.S. Geological Survey: Reston, VA, USA, 2008; 129p. [Google Scholar]
- Guidicini, G.; Iwasa, O.Y. Tentative correlation between rainfall and landslides in a humid tropical environment. Bull. Eng. Geol. Environ. 1977, 16, 13–20. [Google Scholar] [CrossRef]
- Caine, N. The Rainfall Intensity—Duration Control of Shallow Landslides and Debris Flows. Geogr. Ann. Ser. A Phys. Geogr. 1980, 62, 23–27. [Google Scholar]
- Guzzetti, F.; Peruccacci, S.; Rossi, M.; Stark, C.P. Rainfall thresholds for the initiation of landslides in central and southern Europe. Meteorol. Atmos. Phys. 2007, 98, 239–267. [Google Scholar] [CrossRef]
- Dahal, R.K.; Hasegawa, S. Representative rainfall thresholds for landslides in the Nepal Himalaya. Geomorphology 2008, 100, 429–443. [Google Scholar] [CrossRef]
- Dahal, R.K. Rainfall-induced Landslides in Nepal. Int. J. Eros. Control Eng. 2012, 5, 1–8. [Google Scholar] [CrossRef]
- Wang, F.; Wu, Y.-H.; Yang, H.; Tanida, Y.; Kamei, A. Preliminary investigation of the 20 August 2014 debris flows triggered by a severe rainstorm in Hiroshima City, Japan. Geoenviron. Disasters 2015, 2, 17. [Google Scholar] [CrossRef]
- Pennington, C.; Dijkstra, T.; Lark, M.; Dashwood, C.; Harrison, A.; Freeborough, K. Antecedent Precipitation as a Potential Proxy for Landslide Incidence in South West United Kingdom. In Landslide Science for Safer Geoenvironment; Springer: Cham, Switzerland, 2014; Volume 1, pp. 253–259. [Google Scholar]
- Wigley, T.M.L.; Lough, J.M.; Jones, P.D. Spatial patterns of precipitation in England and Wales and a revised, homogeneous England and Wales precipitation series. Int. J. Climatol. 1984, 4, 1–25. [Google Scholar] [CrossRef]
- Obled, C.; Wendling, J.; Beven, K. The sensitivity of hydrological models to spatial rainfall patterns: An evaluation using observed data. J. Hydrol. 1994, 159, 305–333. [Google Scholar] [CrossRef]
- Ito, M.; Mitchell, M.J.; Driscoll, C.T. Spatial patterns of precipitation quantity and chemistry and air temperature in the Adirondack region of New York. Atmos. Environ. 2002, 36, 1051–1062. [Google Scholar] [CrossRef]
- Kansakar, S.R.; Hannah, D.M.; Gerrard, J.; Rees, G. Spatial pattern in the precipitation regime of Nepal. Int. J. Clim. 2004, 24, 1645–1659. [Google Scholar] [CrossRef]
- Anders, A.; Roe, G.H.; Hallet, B.; Montgomery, D.R.; Finnegan, N.J.; Putkonen, J. Spatial patterns of precipitation and topography in the Himalaya. GSA Bull. Spec. Pap. 2006, 398, 39–53. [Google Scholar]
- Vélez, A.; Martin-Vide, J.; Royé, D. Spatial analysis of daily precipitation concentration in Puerto Rico. Theor. Appl. Climatol. 2019, 136, 1347–1355. [Google Scholar] [CrossRef]
- Yokoe, Y.; Kita, M.; Uchida, T.; Kawahara, Y. Characteristics of precipitation system in Hiroshima prefecture during the heavy rainfall event of July 2018 observed using XRAIN data. J. JSCE 2021, 9, 212–220. [Google Scholar] [CrossRef] [PubMed]
- Marc, O.; Gosset, M.; Saito, H.; Uchida, T.; Malet, J. Spatial Patterns of Storm-Induced Landslides and Their Relation to Rainfall Anomaly Maps. Geophys. Res. Lett. 2019, 46, 11167–11177. [Google Scholar] [CrossRef]
- Moriyama, T.; Hirano, M. Relationship between Maximum Three-Hour Cumulative Rainfall and Landslide Area. In Proceedings of the 21st IAHR-APD Congress, Yogyakarta, Indonesia, 2–5 September 2018. [Google Scholar]
- Cremonini, R.; Tiranti, D. The Weather Radar Observations Applied to Shallow Landslides Prediction: A Case Study From North-Western Italy. Front. Earth Sci. 2018, 6, 134. [Google Scholar] [CrossRef]
- Harjupa, W.; Nakakita, E.; Sumida, Y.; Yamaguchi, K. Fundamental investigation of generation of guerilla-heavy rainfall using himawari-8 and xrain information in kinki region. J. Jpn. Soc. Civil Eng. Ser. B1 Hydraul. Eng. 2018, 74, I_283–I_288. [Google Scholar] [CrossRef]
- Tsuchiya, S.; Kawasaki, M.; Godo, H. Improvement of the radar rainfall accuracy of xrain by modifying of rainfall attenuation correction and compositing radar rainfall. J. Jpn. Soc. Civil Eng. Ser. B1 Hydraul. Eng. 2015, 71, I_457–I_462. [Google Scholar]
- Masuda, Y.; Itado, M.; Taniguchi, K.; Sakai, K.; Ueda, H.; Yamashita, K.; Nakai, S. Improving of winter quantitative precipitation using XRAIN. J. Jpn. Soc. Civ. Eng. Ser. B1 Hydraul. Eng. 2018, 74, I_85–I_90. [Google Scholar] [CrossRef] [PubMed]
- Yamada, N.; Higashimoto, S.; Mizuno, K.; Hiroshima, T.; Suda, Y. Hiroshima 1:200,000 Geological Map; NI-53-33; Geological Survey of Japan: Tsukuba, Japan, 1986. [Google Scholar]
- Kamada, M.; Nakagoshi, N. Landscape structure and the disturbance regime at three rural regions in Hiroshima Prefecture, Japan. Lands. Ecol. 1996, 11, 15–25. [Google Scholar] [CrossRef]
- Japanese Meteorological Agency. Kure: Average Yearly and Monthly Values (Translated Title). Available online: http://www.data.jma.go.jp/ (accessed on 20 June 2020).
- Data Integration & Analysis System. XRAIN Realtime Precipitation Data. The University of Tokyo, Sponsored by the Ministry of Education, Culture, Sports, Science and Technology. Available online: https://diasjp.net/ (accessed on 20 June 2022).
- Jakob, M.; Hungr, O.; Wieczorek, G.F.; Glade, T. Climatic factors influencing occurrence of debris flows. In Debris-Flow Hazards and Related Phenomena; Springer: Berlin/Heidelberg, Germany, 2005; pp. 325–362. [Google Scholar]
- Pennsylvania State University. Pearson Correlation Coefficient R. Simple Linear Regression (SLR) Model. Applied Regression Analysis. 2018. Available online: https://online.stat.psu.edu/stat462/node/96/ (accessed on 20 June 2022).


| Location | Event Time | Duration Until Event (h) | Average Intensity (mm/h) |
|---|---|---|---|
| South Kuchida, Asakita Ward, Hiroshima City | 6 July 2018 18:40 | 34:10 | 7.66 |
| 7-chome, Yanohigashi, Aki Ward, Hiroshima City | 6 July 2018 19:10 | 34:40 | 7.22 |
| Tenno, Kure City | 6 July 2018 19:10 | 34:40 | 6.78 |
| Koyaura, Sakamachi, Aki District | 6 July 2018 19:15 | 34:45 | 7.73 |
| 5-chome, Kawakado, Kumano-cho, Aki-gun | 6 July 2018 19:50 | 35:20 | 7.52 |
| 5-chome, Minatomachi, Takehara City | 6 July 2018 21:30 | 37:00 | 6.43 |
| 6-chome, Kihara, Mihara City | 7 July 2018 0:40 | 40:10 | 6.43 |
| Sakuramachi, Onomichi | 7 July 2018 7:10 | 46:40 | 6.73 |
| Year/Period | Minimum (mm) | Maximum (mm) | Average (mm) |
|---|---|---|---|
| 2016 | 2336.9 | 3440.2 | 2620.3 |
| 2017 | 1861.0 | 3268.1 | 2125.4 |
| 2018 | 2166.7 | 3116.1 | 2467.9 |
| 2019 | 1503.3 | 2505.8 | 1852.7 |
| 2020 | 2067.8 | 3285.2 | 2383.3 |
| 2021 | 2039.3 | 3052.6 | 2352.5 |
| 2016–2021 | 2025.5 | 3030.4 | 2300.3 |
| Relative Precipitation | Number of Landslides | Number of XRAIN Cells | Landslides Per Square km |
|---|---|---|---|
| −50% | 1 | 8 | 1.88 |
| −40% | 0 | 13 | 0 |
| −30% | 0 | 19 | 0 |
| −20% | 9 | 105 | 1.39 |
| −10% | 110 | 483 | 3.95 |
| 0% | 175 | 803 | 3.47 |
| +10% | 186 | 1002 | 3.01 |
| +20% | 263 | 976 | 4.15 |
| +30% | 192 | 642 | 4.83 |
| +40% | 192 | 259 | 11.76 |
| +50% | 41 | 25 | 24.74 |
Disclaimer/Publisher’s Note: The statements, opinions and data contained in all publications are solely those of the individual author(s) and contributor(s) and not of MDPI and/or the editor(s). MDPI and/or the editor(s) disclaim responsibility for any injury to people or property resulting from any ideas, methods, instructions or products referred to in the content. |
© 2023 by the authors. Licensee MDPI, Basel, Switzerland. This article is an open access article distributed under the terms and conditions of the Creative Commons Attribution (CC BY) license (https://creativecommons.org/licenses/by/4.0/).
Share and Cite
Rodrigues Neto, J.M.d.S.; Bhandary, N.P. Influence of Localized Rainfall Patterns on Landslide Occurrence—A Case Study of Southern Hiroshima with eXtended Radar Information Network Data during the July 2018 Heavy Rain Disasters. Geosciences 2023, 13, 245. https://doi.org/10.3390/geosciences13080245
Rodrigues Neto JMdS, Bhandary NP. Influence of Localized Rainfall Patterns on Landslide Occurrence—A Case Study of Southern Hiroshima with eXtended Radar Information Network Data during the July 2018 Heavy Rain Disasters. Geosciences. 2023; 13(8):245. https://doi.org/10.3390/geosciences13080245
Chicago/Turabian StyleRodrigues Neto, José Maria dos Santos, and Netra Prakash Bhandary. 2023. "Influence of Localized Rainfall Patterns on Landslide Occurrence—A Case Study of Southern Hiroshima with eXtended Radar Information Network Data during the July 2018 Heavy Rain Disasters" Geosciences 13, no. 8: 245. https://doi.org/10.3390/geosciences13080245
APA StyleRodrigues Neto, J. M. d. S., & Bhandary, N. P. (2023). Influence of Localized Rainfall Patterns on Landslide Occurrence—A Case Study of Southern Hiroshima with eXtended Radar Information Network Data during the July 2018 Heavy Rain Disasters. Geosciences, 13(8), 245. https://doi.org/10.3390/geosciences13080245