1. Introduction
With ever-increasing energy consumption, the resulting CO
2 emissions are continuously growing [
1]. Using renewable energy sources in the building sector can contribute to decarbonizing the construction sector [
2], besides being aligned with the sustainable development goals set by the United Nations to achieve sustainability by reducing energy consumption and CO
2 emissions [
3]. Low-enthalpy geothermal energy is one of the several types of renewable energy sources that can be used in building thermal conditioning, e.g., [
4,
5,
6]. Shallow Geothermal Energy systems (SGE) take advantage of the nearly constant temperature of the ground, which acts as a heat source and a heat sink in winter and summer, respectively [
7,
8]. The nearly constant ground temperature, known as the Undisturbed Ground Temperature (UGT), is found at depths below 10 to 20 m where seasonal variations have no effect on ground temperature [
9,
10].
Ground temperature up to about a depth of 10–20 m is affected by the absorbed diurnal wave of radiation [
11,
12,
13]. At larger depths, climate effects decrease, and consequently, soil temperature tends to remain nearly constant. Studies such as [
11,
14,
15], have analysed ground temperature profiles in different contexts. Two types of oscillations were distinguished in ground temperature profiles: (i) daily basis variations (short-term signal) and (ii) annual basis variations (long-term signal). Those variations can divide the ground into the three zones: (i) the surface zone reaches 0.5 m to 1.0 m depth, where the soil temperature is highly affected by the daily weather changes; (ii) the shallow zone ranges from 1 m to 8 m in dry soils, while in wet soils it can reach up to 20 m maximum, where the soil is influenced by the seasonal wave variations at depth; and (iii) the deep zone can start at a depth such as 20 m, where the seasonal effects can be negligible. In this zone, the ground temperature is nearly constant throughout the year. However, at greater depths, ground temperature can rise owing to the geothermal gradient, which in turn depends on the location, the geological conditions, and the local heat flow.
The thermal exchanges induced by SGE operations vary seasonally and affect the ground temperature. During heating mode, the ground temperature decreases, while during cooling mode, it tends to increase [
16]. The thermal impact of SGE system operation can achieve a large radial distance depending on the heat exchange rate, duration, and soil type, among other factors [
16]. In the long-term, continuous, and unbalanced operation of a SGE system, the soil temperature might not recover its initial values. Consequently, thermal changes in the UGT can be formed in the soil, affecting the initial design values of the system and adversely affecting its performance. Various studies have simulated the impact of GSHP system operation on ground temperatures, such as [
17,
18,
19,
20,
21].
Evaluating spatial soil temperature distribution during the geothermal system operation is of major importance in analysing SGE performance as well as its sustainability, e.g., [
18,
22]. The authors in their study [
23] reported the thermal effect of the Borehole Heat Exchangers (BHE) on the ground temperature by monitoring a borehole located 1 m away from one BHE. This study highlighted the importance of long-term and multiyear monitoring to evaluate the effect of system operation on the entire ground impacted by the presence of BHEs. Another study [
24] has shown the results of a 3-year monitoring of SGE under intensive operation by recording the surrounding temperature in groundwater. A maximum difference of 1.2 °C was obtained between unaffected upstream groundwater temperatures and impacted downstream temperatures at the site. A long-term evaluation of the system operation effects on ground temperature was presented in [
25] by monitoring temperature for 10 years. In this study, the temperature measurements showed increasing rates of 0.135 °C/year at a depth of 10 m and 0.118 °C/year at a depth of 50 m. Discharging heat in the cooling season and extracting heat in the heating season resulted in a 0.109 °C/year increase in temperature over 10 years. Authors in another study found a higher extraction rate can be obtained in porous lithologies than clay or silt when applying a grout with high thermal conductivity [
26]. Others have analysed the seasonal regeneration of ground-source heat pumps by re-injection of space cooling to the ground [
27]. They concluded that the seasonal regeneration allows for annual maximum heat extraction densities above 300 kWh/m
2 at heat injection densities above 330 kWh/m
2. Despite the growing use of SGE worldwide, there are scarce examples in the literature regarding the long-term effects of their operation on ground temperature based on monitoring data. Furthermore, no studies have been found that specifically investigate systems operating under southern European climate conditions. This initial exploration, with many temperature sensors and the resulting data, are of paramount importance in quantifying the order of magnitude of temperature changes and understanding the role of different factors in the ground temperature field and their impact on the feasibility assessment of geothermal projects. Furthermore, it assumes particular significance in the context of evaluating the sustainability of such projects, especially when complementing the analysis with ground temperature monitoring over longer periods (5, 10, 20, and eventually more years), a topic that will receive further analysis in subsequent phases of this research. This paper presents ground temperature data recorded from investigation boreholes up to 140 m deep during the first year of geothermal system operation. The investigation boreholes were placed around the BHE geothermal system located on the campus of Aveiro University (UA), in the centre-north of Portugal. These boreholes were installed in different locations to investigate ground temperature changes caused by the geothermal system as well as by other possible factors or interferences. The monitoring system includes 92 temperature sensors installed at different depths of the 15 boreholes, recording data every 10 min. The monitored data are analysed both individually and in an integrated manner, and the temperature envelopes measured are compared to numerically obtained temperature profiles, calibrated from a thermophysical characterization of the different soil layers and from meteorological data from a nearby weather station. In addition to the analysis presented here, this study provides the scientific community with a comprehensive data base on ground temperature and thermal properties, which will be of great importance in future applications of geothermal energy systems.
2. Site Description
2.1. Geothermal System Description
The SGE system was installed at the Aveiro University (UA) campus, in the north of Portugal, approximately 1.6 km from the Aveiro Lagoon and 9 km from the Atlantic Ocean. The university campus boasts four buildings constructed based on sustainable construction principles, which serve as demonstrators for sustainable and green university buildings [
28]. The building of the Centre of Communication and Image Science (CCCI), with 1600 m
2 of implantation area and a total of 3300 m
2 of acclimatized area, is the focus of this study.
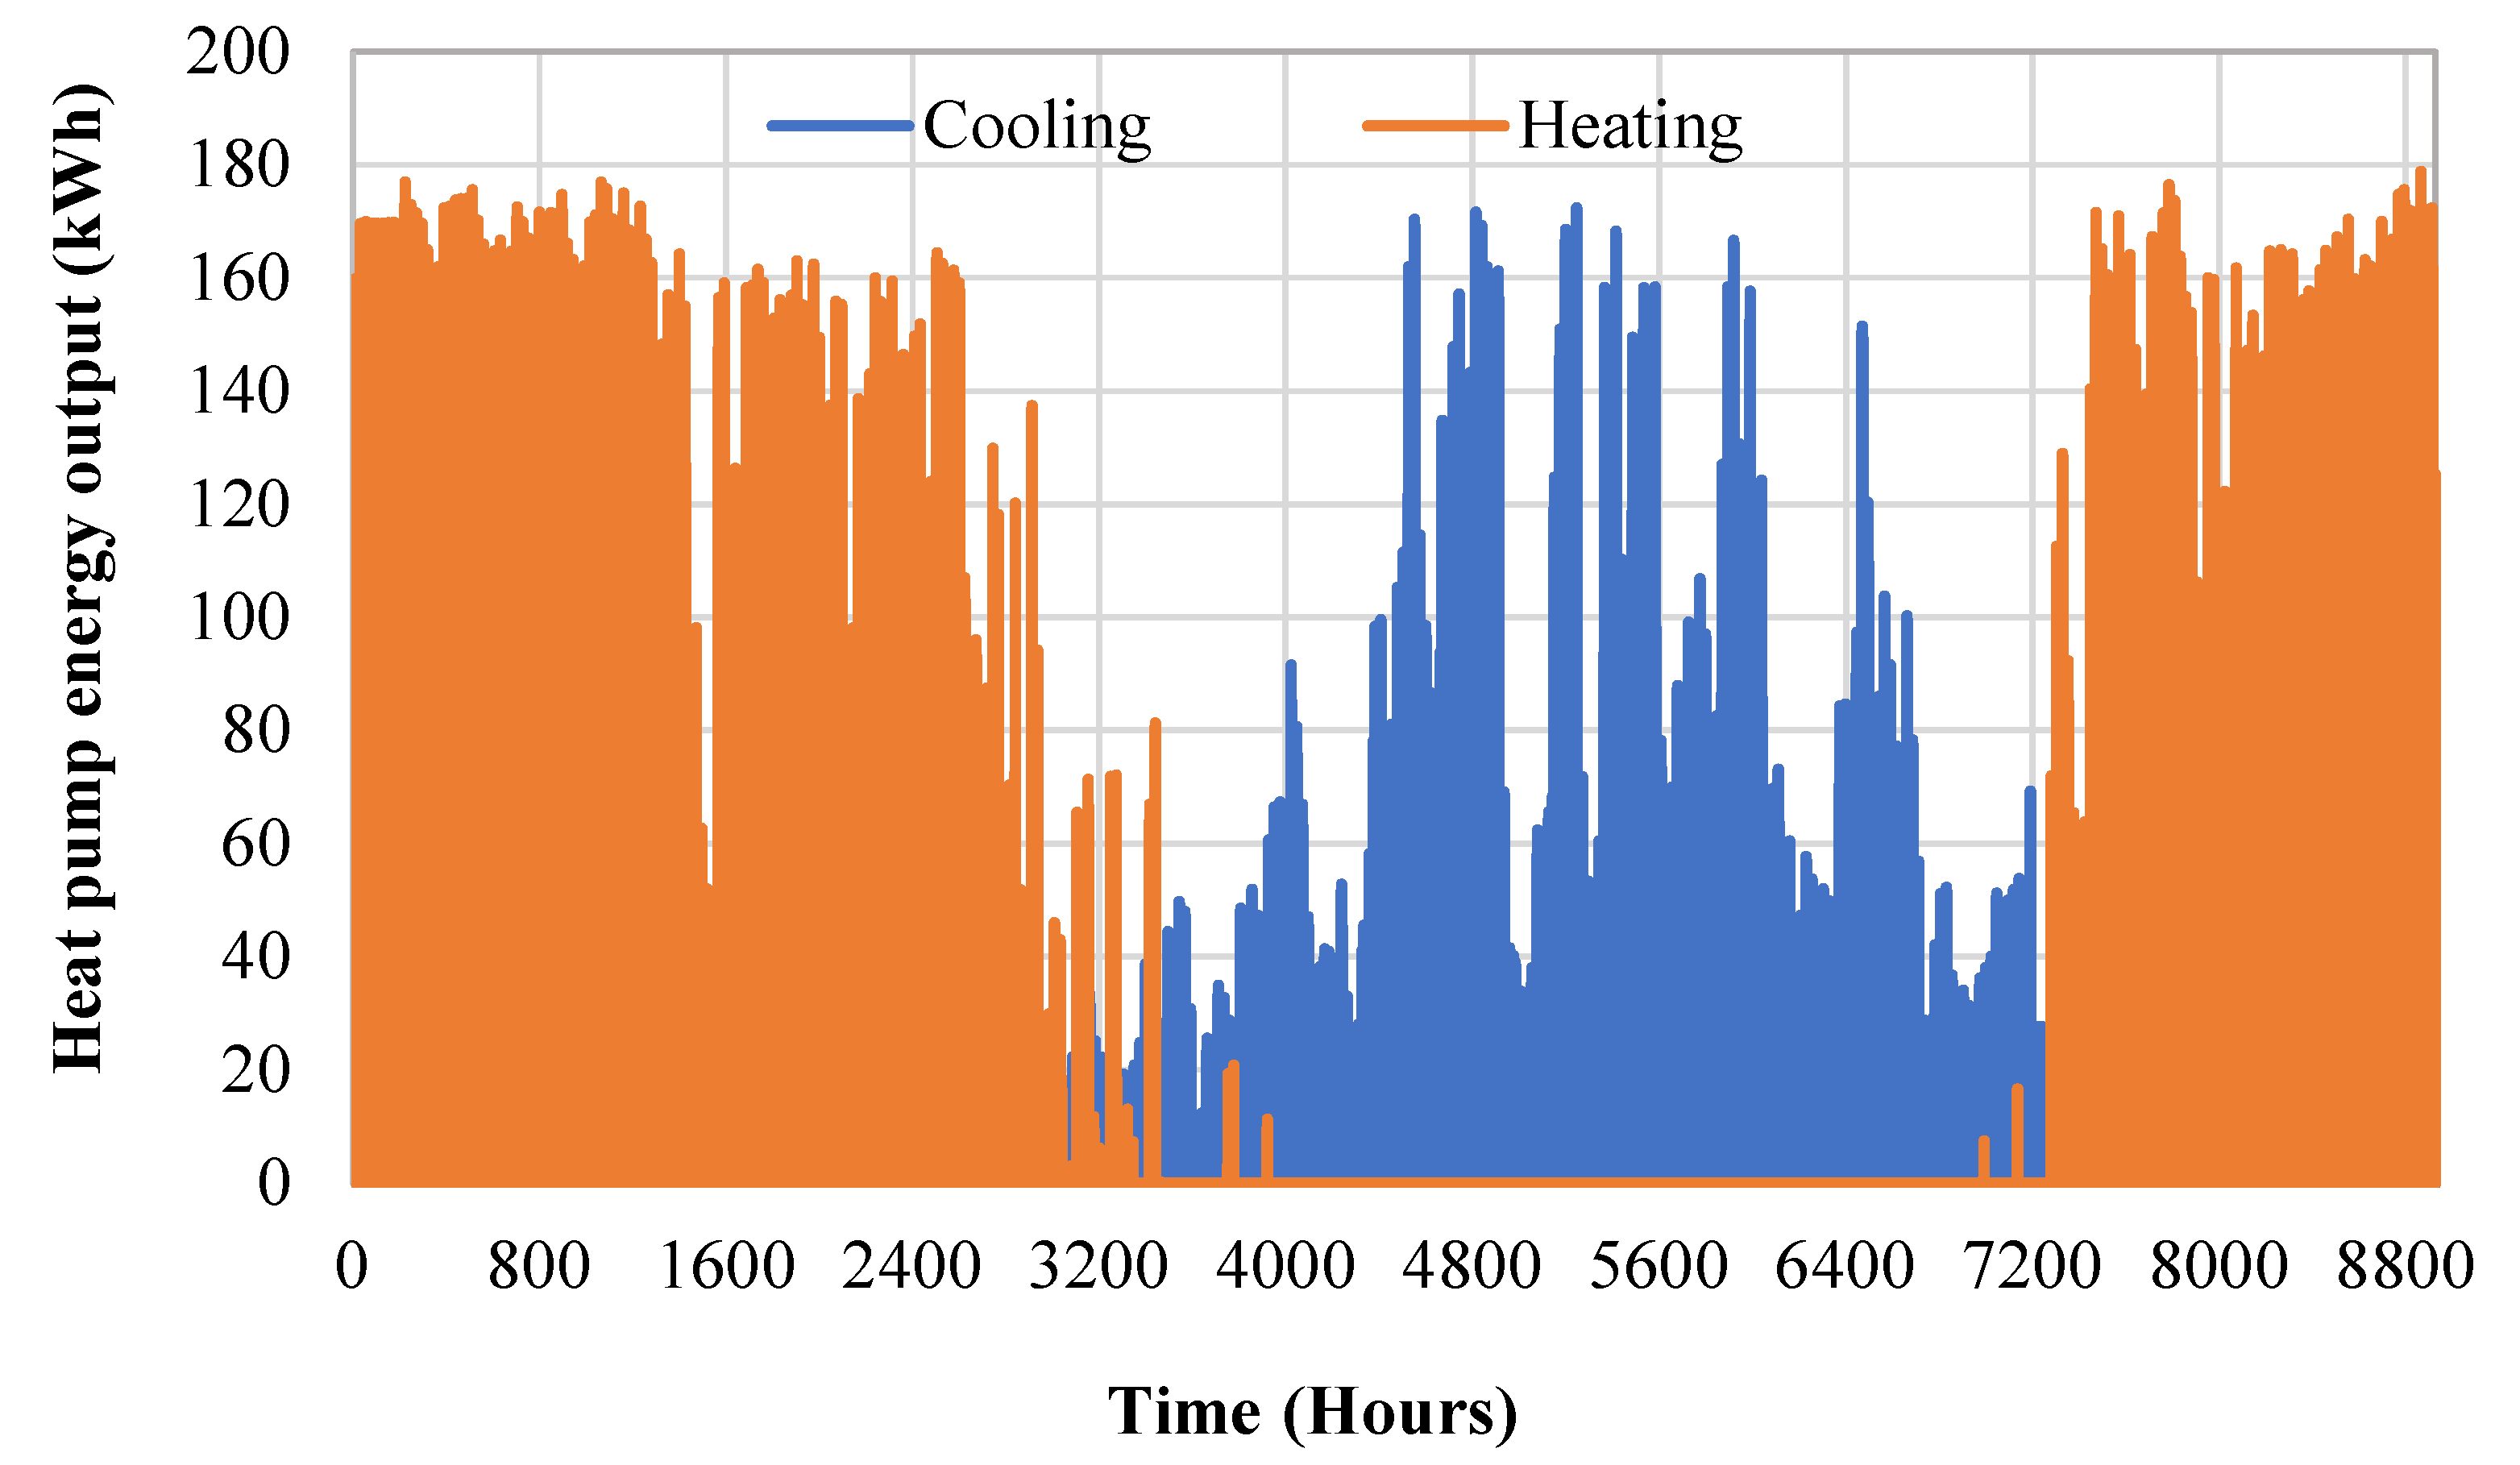
Figure 1 shows the building energy needs calculated using the whole building energy simulation software, EnergyPlus version 23.1 [
29].
The building’s thermal comfort is assured by a SGE system that includes a reversible water-heat pump with 219 kW of power for heating and cooling. Its Coefficient of Performance (COP) is 3.5, and its Energy Efficiency Ratio (EER) is 4.2. The heat pump unit is in an underground technical room within the CCCI building (shown in
Figure 2b). It is connected from one side to the primary circuit (
Figure 2a), which is composed of 40 BHE and three energy piles, and on the other side to the secondary circuit (
Figure 2c), which consists of the heat distribution pipework system embedded in the building slabs.
The BHEs, with a diameter of 160 mm, are spaced 5 m apart and drilled to a depth of up to 132 m, while the 600 mm-diameter energy piles have a length of 10 m (
Figure 3). The pipe inside the BHEs is a U-tube pipe with a smooth inner surface. The U-tube pipe diameter is 24 mm, with a 2.4 mm thickness and 25.39 mm shank space. The total length of the BHEs system is 5280 m. To characterise some of the soil properties, samples were collected from two of the 40 boreholes (F16 and F17 in
Figure 3) during the drilling phase, as further detailed. Due to the poor soil strength of the superficial layers, the building was founded on structural end-bearing piles, each 10 m deep.
The 40 boreholes are placed 5 m apart and along two sides of the building, while the three structural and energy piles (surrounded by orange rectangles) are placed at the edge of the building near the south-eastern and southwestern façades (
Figure 3). Soil samples were collected during the drilling phase from two of the 40 boreholes (F16 and F17 in
Figure 3) to characterise the soils, as will be discussed later.
2.2. Case Study Characteristics
The geological formation at the site includes the Aveiro sedimentary region of the Vouga river estuary, which is connected to the Atlantic Ocean. This region is characterized by a meso-tidal system, resulting in significant daily fluctuations ranging from 0.6 m for neap tides to 3.2 m for spring tides. These tidal fluctuations correspond to a maximum and a minimum phreatic level at the soil layers of 3.5 and 0.5 m, respectively [
30]. Two geotechnical survey campaigns were carried out to characterize the soil at the site:
Four boreholes were drilled to a depth of 7 m, and intact soil samples were collected. The soils in the first 6 m were classified as soft to medium sandy clay, with stiffer soils found below, including silty sand and sandstone.
Disturbed soil samples were collected from 2 boreholes, F16 and F17 (
Figure 3), which were drilled to a depth of 132 m. Index properties of the different soil layers (water content, dry unit weight of particles, grain-size distribution, and consistency limits) were obtained [
31].
Based on the analysis of the borehole information, a three-layer stratigraphic model was established:
A superficial layer of fine sandy clay soil up to 6 m depth.
A layer of silt and clay between 6 m and 78 m depth, including a 6 m-layer of coarse clayey sand between 18 m and 24 m depth.
A layer of stiff clayey sand (sandstone) up to 140 m depth, including another 6 m-layer of thin clay and sandy clay.
To evaluate the ground thermal properties, specifically thermal conductivity,
λ, two different methods were used. In the first method, thermal conductivity was measured in laboratory tests on intact samples collected from the superficial layer (up to 6 m depth). These measurements were conducted under transient conditions with a needle probe (Hukseflux TPSYS02 system). This equipment measures thermal conductivity within the range of 0.1–6 W·m
−1·K
−1 with high accuracy ± 0.02 W·m
−1·K
−1 [
32].
λ values were estimated based on the line source solution under the general assumption of a radial heat flow applied to a linear heat source with infinite length and infinitesimal diameter in an isotropic and homogeneous medium, e.g., [
33,
34]. The results obtained both on intact and reconstituted soil samples collected in the surface layers are presented in
Table 1, together with reference values of
λ on similar soils [
35]. The intact sample was tested in its natural state condition (saturation ratio
Sr = 35%), while the reconstituted samples were tested in dry and partially saturated conditions.
In the second method, the soil thermal conductivity of the different layers collected from the two geothermal boreholes (F16 and F17) was obtained using a semi-empirical relation (Equation (1)) that considers the volumetric fraction of the different soil phases. This approach assumes a geometric mean spatial arrangement of soil volumetric fractions (solid, gaseous, and liquid). The parameters required to be used in this relation (Equation (1)) were obtained in the previous physical characterization of the samples by determining their moisture content
w, particles dry unit weight
Gs, degree of saturation
Sr, and porosity
n.
Based on the geotechnical survey, it was considered that the soil was unsaturated in the first 6 m and completely saturated below that depth. Solid particle thermal conductivity
λs was assumed to be in the range between that of clay and quartz (2.7–7.7) W·m
−1·K
−1 [
36], while water and air thermal conductivities are, respectively,
λw = 0.61 W·m
−1·K
−1 and
λa = 0.025 W·m
−1·K
−1 [
37]. Thermal conductivity results are presented in
Table 2 and
Table 3.
The estimated values of λ fall within 1.93 W·m−1·K−1 and 3.25 W·m−1·K−1 for soils in borehole F16 and between 1.81 W·m−1·K−1 and 2.69 W·m−1·K−1 for soils in borehole F17. Based on λ values, thermal diffusivity was estimated between 7.49 × 10⁻⁷ and 9.78 × 10⁻⁷ m2·s−1. A good agreement is observed between the values estimated by the methods. Those estimations also account for variations in soil structure as the soil samples were uncompressed.
2.3. Site Weather Conditions
Weather conditions at the site, namely air temperature, solar radiation, relative humidity, precipitation, air velocity, and direction, in addition to the building’s three-dimensional geometry and dimensions, as well as type use, orientation, envelope thermal conductivity, and occupants’ habits, among other factors, contribute to the building’s heating and cooling energy needs. The SGE system must be able to sustainably meet these needs while maintaining the user’s thermal comfort. According to the Köppen-Geiger climate classification, Aveiro has a Mediterranean climate characterized by warm, dry summers and mild, wet winters, see
Figure 4 [
38,
39].
According to Portuguese thermal regulation, Aveiro is in climatic Zone 2, which is estimated to have a 4-month cooling season and a 6.2-month heating season. Data from the CESAMET weather station, located at the top of another building department on the campus of Aveiro University, only 100 m away from the CCCI SGE system, were used for the climate condition characterization. Global outdoor dry-bulb temperature, relative humidity, and global radiation were collected with a 10 min time-step, as shown in
Figure 5, where the records for this study period are shown. Regarding the weather characterization, the hottest months with the highest irradiance are July and August. It also shows that the lowest temperature occurs in December, January, and February.
3. Ground Temperature-Monitoring System
The temperature acquisition system was installed in 15 investigation-drilled boreholes (hereafter referred to as B.I.) located between 1 m and 2.5 m from the existent BHE, which provide heating and cooling to the (in Portuguese: Complexo das Ciências de Comunicação e Imagem) CCCI building. The temperature sensors installed are placed at different depths (e.g., −1, −2, −5, −10, −15, −20, −40, −50, −70, −80, −100, −120, −140) m. The temperature profiles recorded over a one-year period allow us to evaluate the occurrence of eventual thermal changes caused by the SGE system operation or by other interferences.
Monitoring started eight months after the geothermal system had been put into operation. The investigation boreholes (B.I.) were assembled in 4 groups defined according to their location near the façades and the BHE, as shown in
Figure 6. Although 16 investigation boreholes are depicted in
Figure 6, data were only collected from 15 investigation boreholes since no data were registered in borehole B.I.7 due to technical problems.
Table 4 summarizes the borehole depth of each group.
Some redundancy in the investigation boreholes of the same group is expected due to the similar distance and approximate position of the geothermal boreholes. However, having several investigation boreholes in the same group also allows for mutual validation of readings and the detection of small trends.
The investigation boreholes B.I.1 to B.I.9 and B.I.16 were placed near the southeast façade of the CCCI building and drilled at 2.5 m to 4.5 m from the BHE, while the boreholes B.I.10 to B.I.15 were localized in the southwest façade near the three energy piles.
Temperature sensors PT100 3-Wire were used [
40], for a total of 92, distributed along specific depths, as shown in
Table 4. They are individually connected to a data logger for continuous recording. The boreholes were filled with bentonite grout after the installation of the sensors. Some aspects of the temperature-depth monitoring system installation are shown in
Figure 7. Temperature data are registered with a time step of 10 min over a 12-month period.
4. Ground Temperature Data Analysis
4.1. Individual Annual Data Temperature Analysis
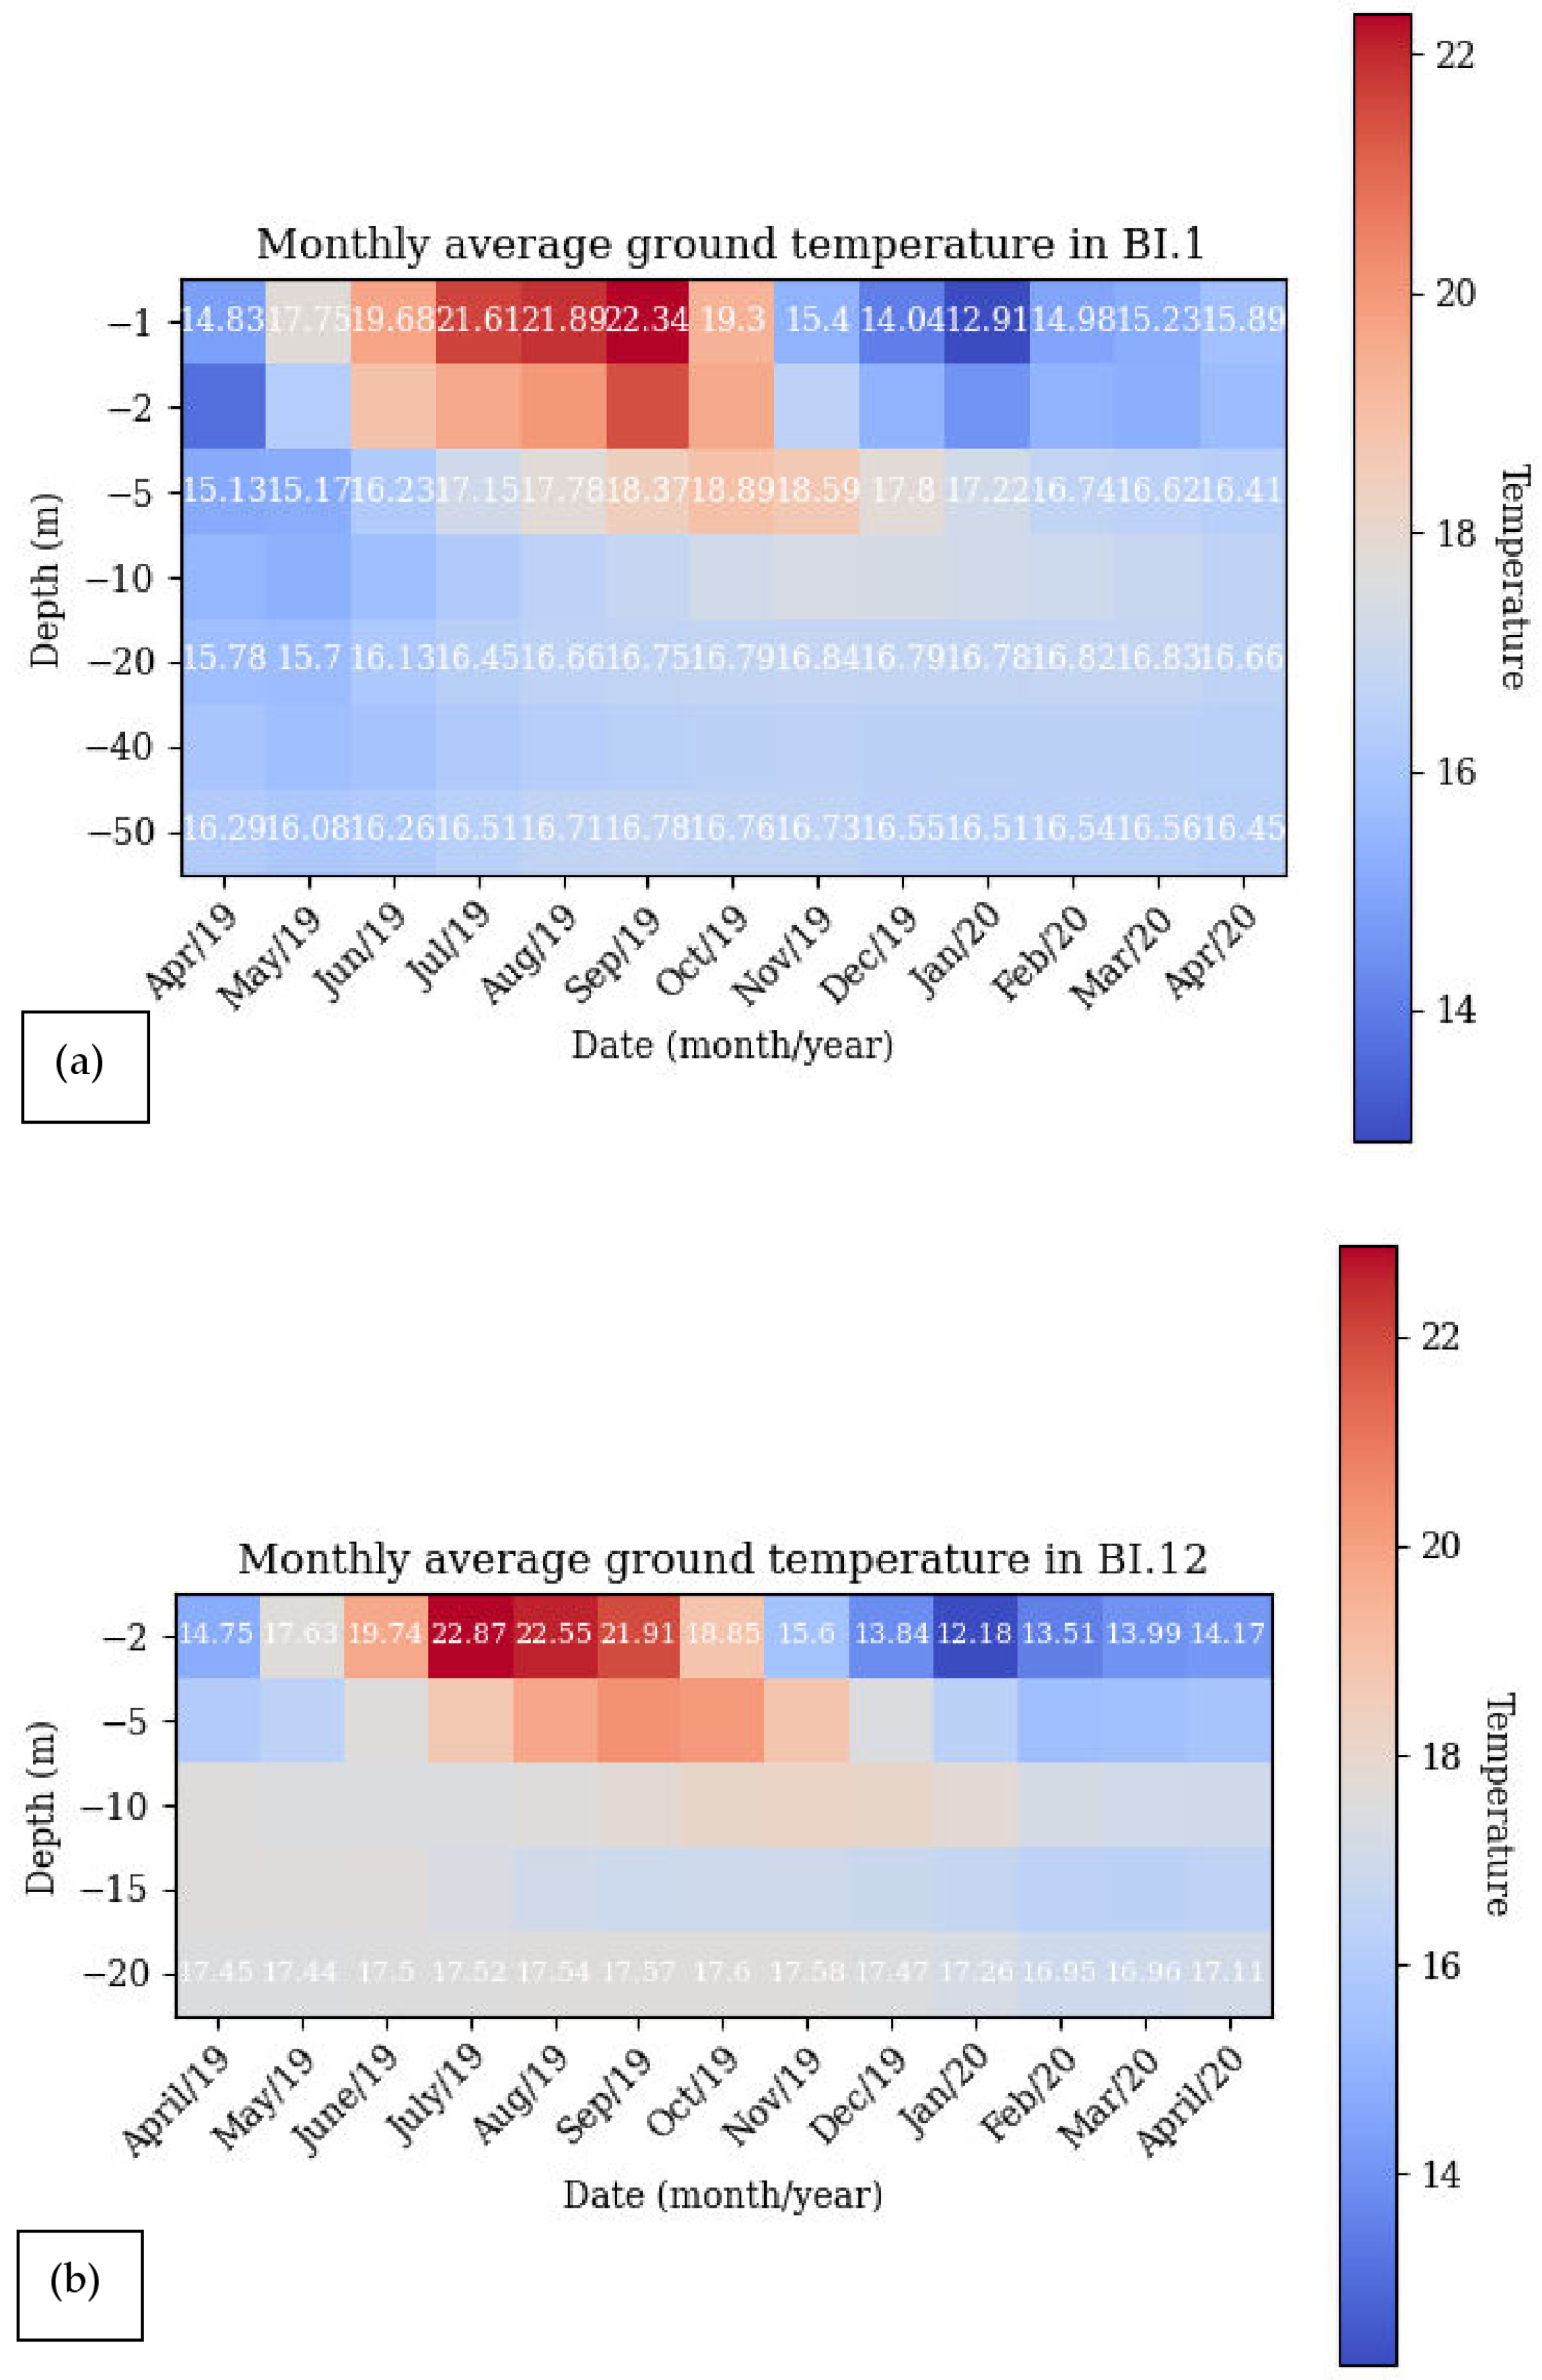
The investigation boreholes B.I.1 and B.I.12 are located at the opposite corners of the CCCI building, with different solar radiation exposures, and were selected to present some trends of the registered values. B.I.1 is placed at 0.62 m from the building and 2.5 m from BHE F17; B.I.12 is placed at 2.7 m from the CCCI building and at 1.9 m from BHE F16. B.I.12 monitors temperature up to −20 m depth, while borehole B.I.1 reaches −50 m.
Figure 8 presents the monthly average ground temperature evolution of B.I.1 and B.I.12 for one monitoring year, as well as the air temperature recorded every 10 min in the meteorological station located on the UA campus with its sinusoidal fitting.
Some conclusions can be drawn from the analysis of
Figure 8, namely:
At −1 and −2 m depths, the ground temperature during the cooling season is higher than the atmospheric temperature (which might be a result of the heat injection into the ground by the BHEs system);
Ground temperature monitored over time in both B.I.1 and B.I.12 at depths (−1, −2, −5, and −10 m) follows the sinusoidal trend of the weather air temperature, however, with an increase in the phase shift and wavelength at depth. For instance, the minimum air temperature occurred in January and the maximum in August. At −5 m depth, they occurred, respectively, in April and in October. At −10 m, the minimum temperature was registered in May and the maximum in November, with an offset of three months. These differences represent a clear indication of the strong influence of the air temperature;
A difference of 15 °C was observed in summer between the maximum air temperature and ground temperature at 1 m depth, and a difference of 8 °C in winter between the minimum air temperature and the ground temperature at −1 m depth. This indicates an unbalanced thermal exchange between the building and the ground and the possibility of some trend toward an increase in temperature in the long-term;
At −15 and −20 m of depth, the ground temperature tends to have constant values between 15.3 °C and 17.4 °C in B.I.1, while in the borehole B.I.12, the ground temperature tends to have higher values between 16.35 and 18.18 °C. Thus, at a depth between −15 and −20 m, a constant temperature was observed in both boreholes;
Ground temperature values at −20 m of depth are higher than the annual mean air temperature (15.46 °C) by almost 1 °C.
In general, similar trends were observed in the other boreholes. An analysis over a longer period will allow us to understand if there is any alteration in these trends. The raw data were converted to monthly average temperature sets, and the average ground temperatures are plotted in a two-dimensional contour graph presented in
Figure 9.
This representation allows us to perceive a higher impact, in terms of amplitude and duration, of the warmer months. It also shows that:
At −2 m and −5 m, in summer, the average ground temperature obtained in B.I.12 is higher than that observed in B.I.1, while the opposite is observed in winter. This can be explained by the fact that B.I.12 is exposed to diurnal weather variations due to the absence of neighboring buildings, which is not the case in B.I.1;
At −10 m and −20 m, during the entire monitoring period, the average ground temperature obtained in B.I.12 is higher than that measured in B.I.1. The temperature difference between B.I.12 and B.I.1 varied from 0.2 °C to 2.1 °C. This can be explained by the proximity of each investigation borehole to the closest BHE. In fact, B.I.12 is 1.9 m close to the BHE F16 and B.I.1 is located at 2.5 m from the BHE F17; therefore, the BHEs operation is more visible in the B.I.12 than in the B.I.1.
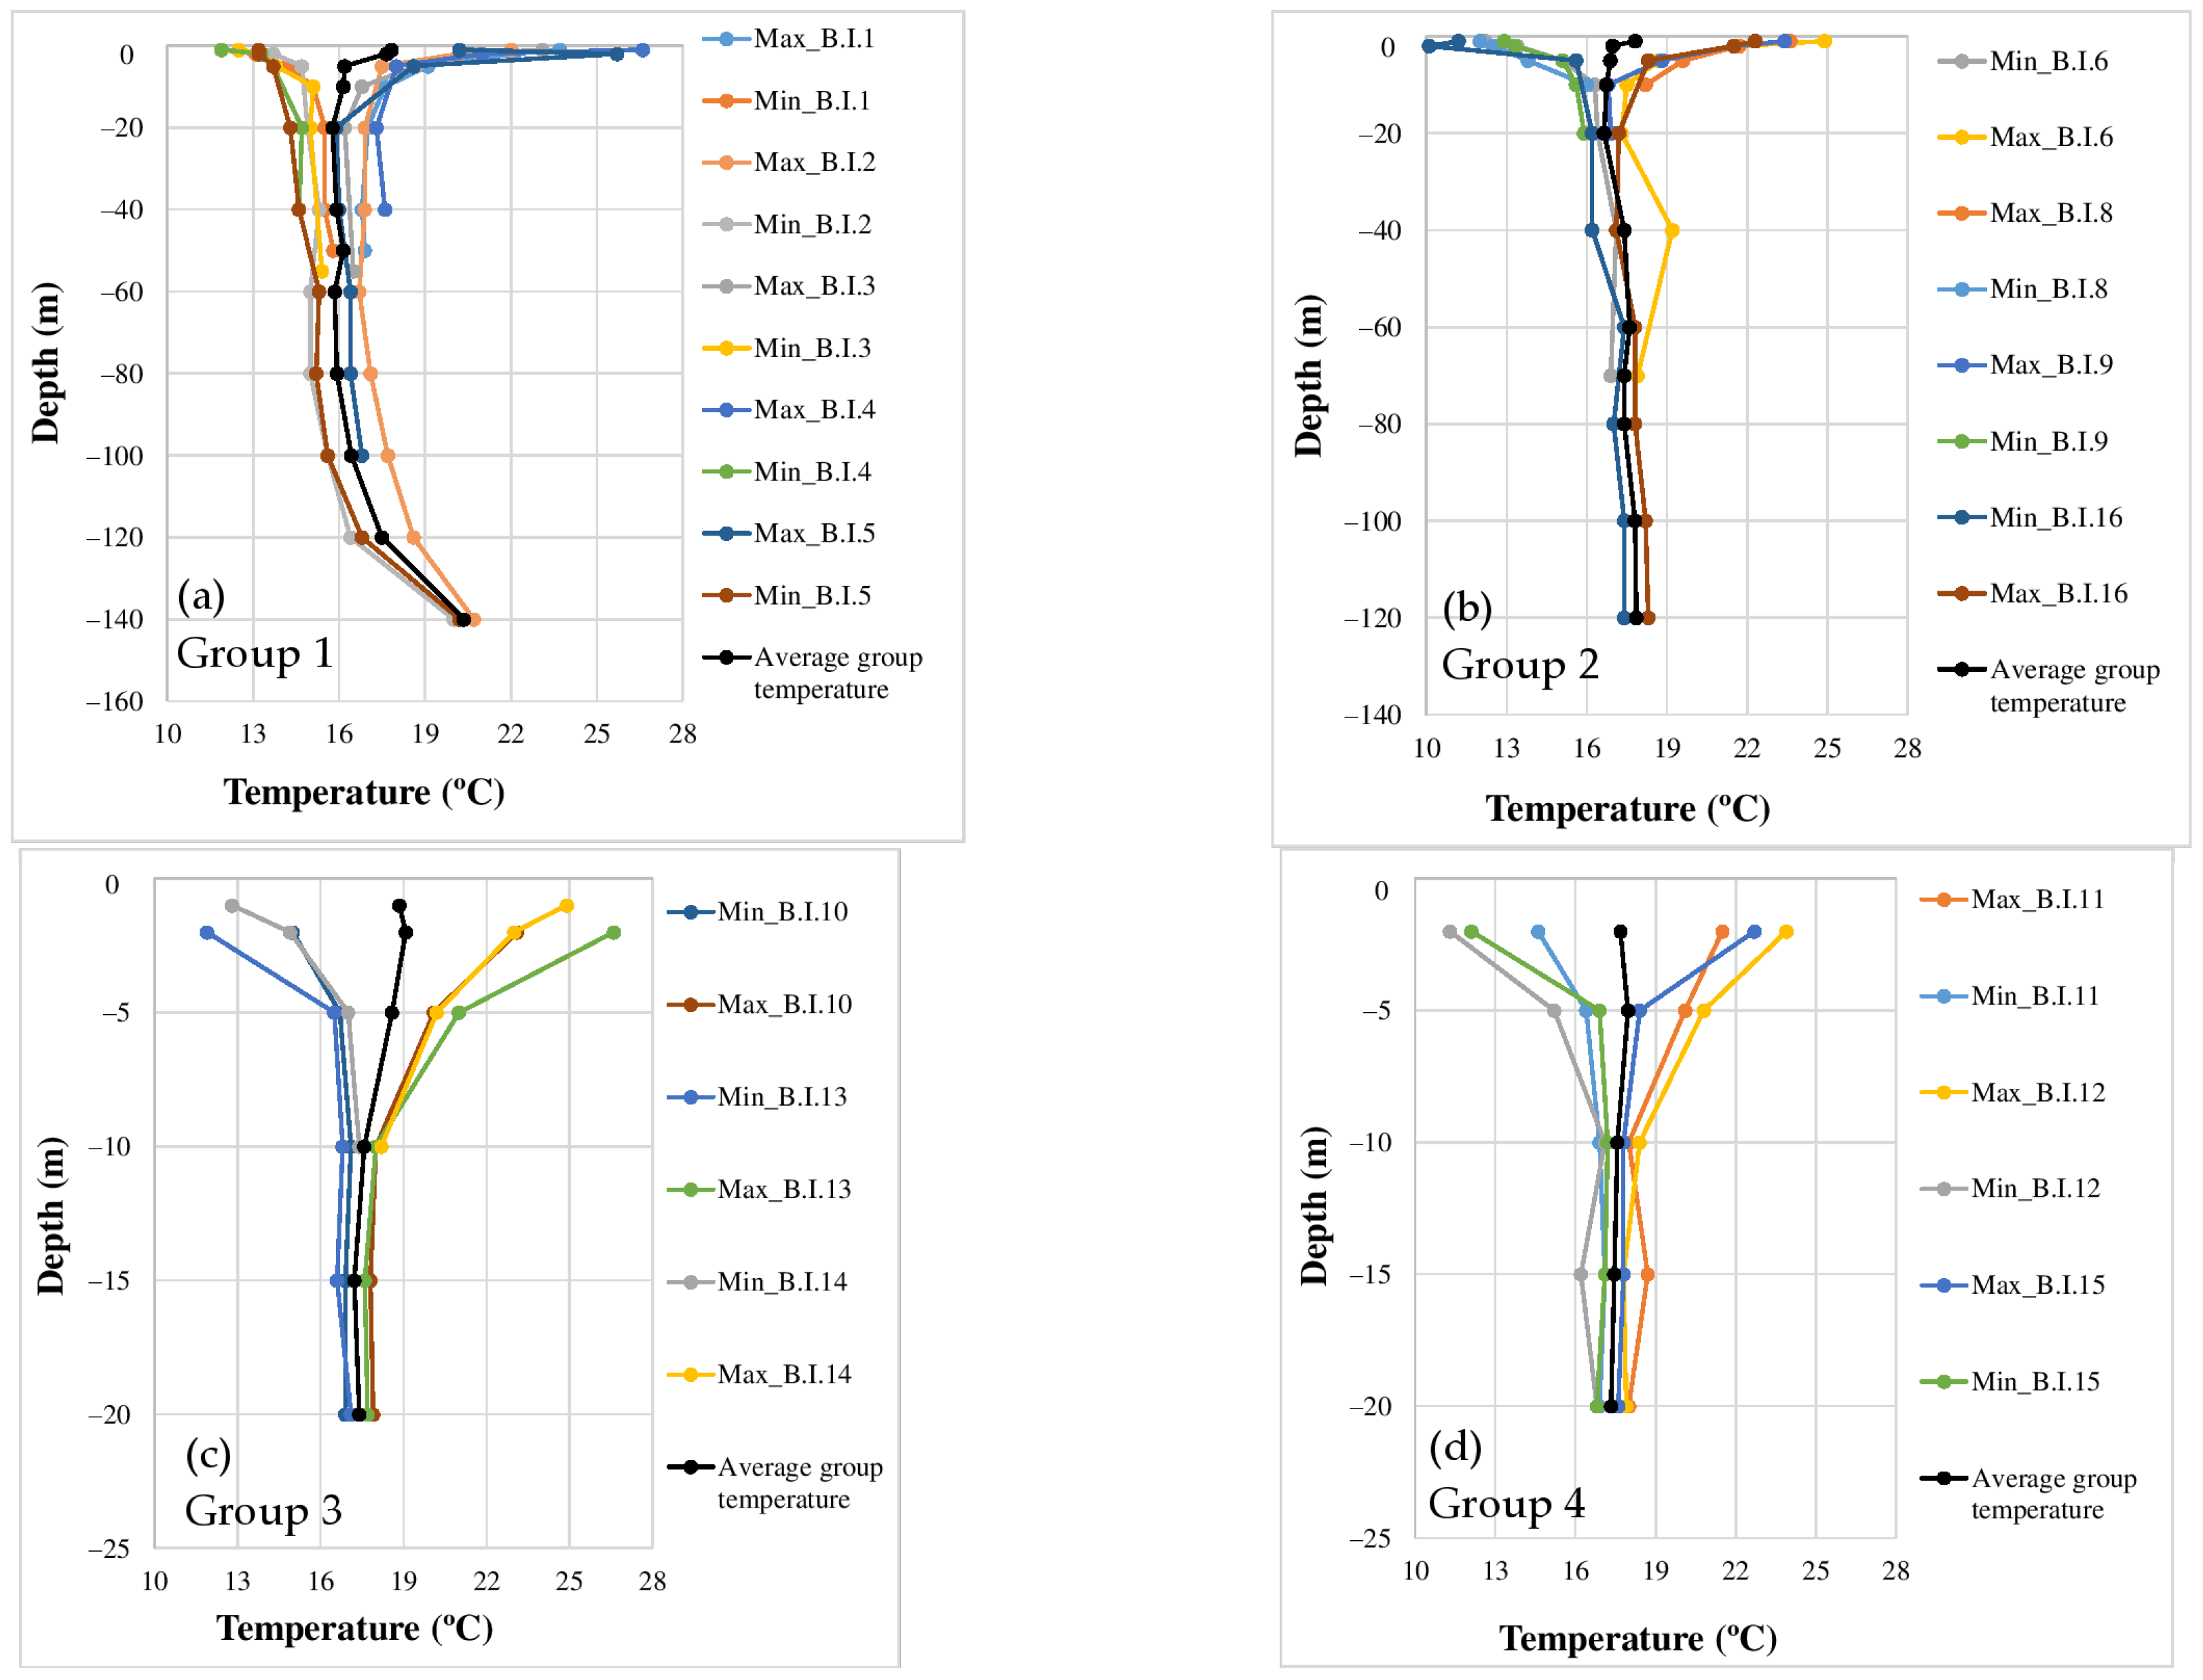
4.2. Global Ground Temperature Analysis
The profiles of the temperatures registered in all the boreholes throughout the entire year and the average temperatures of each group are presented in
Figure 10 organized for each of the four groups (see
Table 4).
The analysis of this global data shows that:
The results are globally consistent, indicating good record quality;
In agreement with the results previously observed in
Figure 7, ground temperature in the superficial soil layers is mainly related to sinusoidal air temperature variations throughout the year;
The effect of atmospheric temperature variations is observed at depths between 10 m and 15 m. It is believed that this relatively high depth of the atmospheric temperature effect is mainly due to weather conditions such as solar radiation, etc. Also, the relatively high soil thermal conductivity resulting from the elevated position of the phreatic level (thermal conductivity superior to 2.5 W·m−1·K−1) can contribute to this effect;
At depths greater than 5 m, the monitored ground temperature shows similar results in boreholes of the same group;
A general trend was observed in all boreholes at 1, 2, and 5 m depth: ground temperature in the heating season tends to be higher in boreholes closer to the building than in those that are farther away. In the cooling season, the opposite is observed, i.e., the ground temperature is lower in boreholes closer to the building. This trend can be a result of the thermal boundary effect of the building on the surrounding ground temperature and the heat flux between the building and the ground;
The effect of the neighboring BHE is evident throughout the depth of the investigation boreholes, with an increase or decrease in the average temperature depending on the direction of the thermal flow;
The difference between the extreme maximum and minimum temperature registered in the boreholes of group 1 is around 14 °C at 2 m depth. This difference decreases to 4 °C at a depth of 5 m and to 2 °C at a depth of ≥20 m. As regard group 2 (shown in
Figure 10b), the difference is around 15 °C at 2 m depth. This difference decreases to 6 °C at 5 m depth and to 1 °C at depth ≥ 20 m;
As regards groups 3 and 4 (
Figure 10c,d), the difference between the extreme maximum and the minimum temperature registered in the borehole of groups 3 and 4 is around 15 and 12 °C at 2 m depth, respectively. This difference decreases to 4 and 7 °C at 5 m depth and to between 1 and 2 °C at depth ≥ 10 m. As a conclusion, the first two groups, as they are located near the same façade, have similar trends and values, while the third and fourth groups have similar readings at 20 m depth, while higher differences are observed at shallow depths such as −1 m;
The SGE system operation introduces thermal changes in the entire length of the boreholes due to the effect of circulating heat carrier fluid;
It can be observed in group 1 that the temperature of the soil layers at large depths (≥80 m) could be the effect of the geothermal gradient of up to 3 °C/100 m;
It was observed that the average ground temperature of each group registered at 10 m depth shows similar values in groups 1 and 2, varying between 16 °C and 17 °C, and between 16 °C and 18 °C in groups 3 and 4. The first two groups are located in front of the same southeast façade of the case study building, near the neighboring building, while the third and fourth groups of boreholes are located near the southwest façade, which is more exposed to solar radiation due to the absence of building shadings in this direction. The data suggests the existence of a boundary effect on the radiation imposed by the building.
5. Undisturbed Initial Ground Temperature Estimation
The raw data were also compared with the undisturbed temperature obtained by a numerical simulation, considering the thermal conductivity of the different layers (
Table 2 and
Table 3) and the atmospheric thermal action recorded at the CESAMET weather station. The numerical simulation was carried out using FLAC v5.0 finite difference code, considering a sinusoidal thermal approximation of the weather annual heat wave in a semi-infinite medium under axisymmetric conditions [
41]. The finite difference mesh has 1300 elements and a domain of 60 × 50 m
2, as shown in
Figure 11.
A time interval of 100 s was used. This numerical simulation is used to estimate the initial ground temperature in the absence of temperature registrations before building construction and the initial operation of the shallow geothermal system. In winter, the upper soil layer was considered saturated, while in summer, this layer was considered dry. The seasonal evolution of atmospheric temperature was simulated by a sinusoidal curve according to the expression:
where
is the temperature at the surface of the ground,
is the annual average temperature,
is the temperature amplitude,
is the time,
is the duration of the period, and
is the phase.
Then, the computed values were compared to the monitored ones. The comparison between calculated temperature profiles and the monitored data are presented in
Figure 12 for the four groups, and we can conclude the following points:
At depths of 1 and 2 m, the soil temperature tends to be higher than the undisturbed ground temperature during both winter and summer seasons, indicating a potential influence of the shallow geothermal system operation and/or the effects associated with the building’s boundaries. It is worth noting that the building is maintained at a temperature of 20 °C during the winter and 25 °C during the summer, both of which exceed the annual mean air temperature of the city of Aveiro;
The effect of the shallow geothermal system operation can also be observed at depths between 20 m and 40 m. As regards group 1, it is observed that the maximum temperature profile measured at those depths in boreholes in this group is 2 °C higher than the maximum numerical temperature. On the other hand, the minimum temperature measured in boreholes in this group is 1 °C lower than the maximum temperature computed numerically;
At higher depths, the temperatures observed in the boreholes of this group have higher ground temperatures in winter and summer than the numerically computed undisturbed ground temperature. This can also be attributed to the effect of the geothermal gradient mentioned above;
Regarding boreholes in groups 2, 3, and 4, it is noteworthy that the recorded maximum and minimum ground temperatures at depths equal to or greater than 20 m exhibit a temperature differential of 2 to 3 °C, surpassing the temperature values computed through numerical modelling during both heating and cooling seasons. This observation emphasizes the noticeable influence of active borehole operations while also suggesting a plausible impact arising from the building’s thermal comfort dead band, which is higher than the annual mean temperature. This can also indicate that with long-term operation, the ground tends to accumulate more heat energy and the ground temperature tends to increase;
A difference of 1 to 2 degrees between the maximum and minimum ground temperature profiles was observed in the four groups, which in turn can manifest the ground capacity to respond thermally to the building energy needs by exchanging energy through the boreholes;
Finally, the values measured and computed in this case study allow identifying the depth values of both daily and seasonal variations and can be compared with those found in the literature, as presented in
Table 5. The depth varies from one site to another as ground and atmospheric conditions differ. Nevertheless, the depth found in this study presented is similar to those found in other studies for similar soil conductivity and air annual average temperature.
6. Conclusions and Remarks
The temperature records obtained from 15 temperature investigation boreholes, drilled next to BHEs operating in a shallow geothermal system (SGE), were presented, and analysed. This is the first time that such a large amount of data has been collected on the climatic conditions of southern Europe and the first research case study on this subject in Portugal. Ground temperature was monitored using 92 thermal sensors installed in-depth up to 140 m for one year while the geothermal system was in continuous operation.
The boreholes were installed after the conditioning system was put into operation; therefore, it was not possible to obtain a direct comparison with the undisturbed ground temperature, and so the initial temperature field was estimated numerically based on a prior characterization of the various soil layers and on the climatic data from a local meteorological station. The investigation boreholes were placed in different positions around the BHE at various distances from them and from the building façades, concentrated in some groups, providing information with some redundancy. The overall temperature-data registered and analysed over the monitoring period produced reliable and consistent results.
In the first year of operation of this monitoring system, the following conclusions can be drawn:
Temperature profiles show that the impact of the seasonal atmospheric temperature variations action reaches depths as high as 20 m, probably due to the saturation conditions of soils and sand percentages in the proximity of Aveiro Lagoon, which results in a relatively high thermal conductivity range, and eventually due to some convection effect towards the lagoon, which increases heat transport;
There is an effect of the geothermal system operation all over the entire borehole depths obtained in groups 1, 2, 3, and 4, with ground temperature amplitudes of 12 to 15 °C at 1 m depth. This ground temperature amplitude decreases to 1 to 2 °C at depths higher than 10 m;
There is an effect of the presence of the building and of the radiation that is evidenced by a higher thermal amplitude in relation to the maximum temperatures at the shallowest levels and on the southeast-oriented facades;
Some of the deeper boreholes show an increase in temperature, which may be due to the development of a geothermal gradient.
Globally, the data presented clearly showed the shallow geothermal system operation and the building boundary effects resulting from a heat flux between the building and the ground. The building orientation, as well as the nearby department buildings, have significant impacts on shallow ground temperature because shaded zones have resulted in lower temperatures in shallow layers until −1 m depth (e.g., group 1) when compared to the boreholes that are exposed to solar radiation (e.g., groups 3 and 4). Overall, there is a clear unbalance as regards the imposed thermal loads and a trend toward a temperature increase at shallow depths, whose evolution will be monitored in the coming years.
According to this research work, the distance between the boreholes plays an important role since thermal exchanges between the boreholes can occur. Therefore, in new geothermal installations, it is recommended to take into consideration the distance between the boreholes in the early design phase. In fact, the higher this ratio between the distance and the borehole depth is, the less thermal interaction would occur between the boreholes, and therefore, a highly sustainable geothermal system would be achieved in the long-term operation. In conclusion, this study provides the scientific community with a comprehensive data base on ground temperature and thermal properties, which will be of great importance in future applications of geothermal energy systems.
The potential of this system has been demonstrated, as have the importance of the collected data and the data that will be collected in the future, which will enable the long-term assessment of the system’s sustainability and energy efficiency. It is also worth mentioning the large amount of data generated, which will be analysed with appropriate big data processing and analysis tools.
Author Contributions
Conceptualization, A.V.; Data curation, K.A. and A.F.; Formal analysis, K.A., A.V., A.F. and R.C.; Funding acquisition, A.V.; Investigation, K.A.; Methodology, K.A.; Project administration, A.V.; Resources, J.L. and A.F.; Software, K.A.; Supervision, A.V. and J.L.; Validation, K.A., A.V., J.L., A.F. and R.C.; Visualization, K.A.; Writing—original draft, K.A.; Writing—review and editing, A.V., J.L., A.F. and R.C. All authors have read and agreed to the published version of the manuscript.
Funding
This research received no external funding.
Data Availability Statement
All data, models, and code generated or used during this study appear in the submitted article.
Acknowledgments
The authors acknowledge the support provided by the Portuguese Foundation for Science and Technology (FCT) under Project GeoSustained (Sustainability assessment of shallow Geothermal systems for Lisbon. Characterization studies of the city soils thermal and thermomechanical behavior), reference PTDC/ECI-CON/1866/2021, and the first author under PhD scholarship reference SFRH/BD/140809/2018.
Conflicts of Interest
The authors declare no conflicts of interest.
References
- Sims, R.E.H.; Schock, R.N.; Adegbululgbe, A.; Fenhann, J.; Konstantinaviciute, I.; Moomaw, W.; Nimir, H.B.; Schlamadinger, B.; Torres-Martínez, J.; Turner, C.; et al. Energy Supply 2007. In Climate Change 2007: Mitigation. Contribution of Working Group III to the Fourth Assessment Report of the Intergovernmental Panel on Climate Change; Metz, B., Davidson, O.R., Bosch, P.R., Dave, R., Meyer, L.A., Eds.; Cambridge University Press: Cambridge, UK; New York, NY, USA, 2007. [Google Scholar]
- Salari, M.; Javid, R.J.; Noghanibehambari, H. The nexus between CO2 emissions, energy consumption, and economic growth in the U.S. Econ. Anal. Policy 2021, 69, 182–194. [Google Scholar] [CrossRef]
- United Nations (UN). Ensure Access to Affordable, Reliable, Sustainable and Modern Energy. Available online: https://www.un.org/sustainabledevelopment/energy/ (accessed on 14 August 2023).
- Brandl, H. Energy foundations and other thermo-active ground structures. Géotechnique 2006, 56, 81–122. [Google Scholar] [CrossRef]
- Stylianou, I.; Florides, G.; Tassou, S.; Tsiolakis, E.; Christodoulides, P. Methodology for estimating the ground heat absorption rate of Ground Heat Exchangers. Energy 2017, 127, 258–270. [Google Scholar] [CrossRef]
- Roka, R.; Figueiredo, A.; Vieira, A.; Cardoso, J. A systematic review on shallow geothermal energy system: A light into six major barriers. Soils Rocks 2022, 46. [Google Scholar] [CrossRef]
- Vieira, A.; Alberdi-Pagola, M.; Christodoulides, P.; Javed, S.; Loveridge, F.; Nguyen, F.; Cecinato, F.; Maranha, J.; Florides, G.; Prodan, I.; et al. Characterisation of ground thermal and thermo-mechanical behaviour for shallow geothermal energy applications. Energies 2017, 10, 2044. [Google Scholar] [CrossRef]
- Sarbu, I.; Sebarchievici, C. Using Ground-Source Heat Pump Systems for Heating/Cooling of Buildings. In Advances in Geothermal Energy; IntechOpen: London, UK, 2016. [Google Scholar] [CrossRef]
- Kurevija, T.; Vulin, D.; Krapec, V. Influence of Undisturbed Ground Temperature and Geothermal Gradient on the Sizing of Borehole Heat Exchangers. In Proceedings of the World Renewable Energy Congress, Linköping, Sweden, 8–11 May 2011. [Google Scholar]
- Ouzzane, M.; Eslami-Nejad, P.; Badache, M.; Aidoun, Z. New correlations for the prediction of the undisturbed ground temperature. Geothermics 2015, 53, 379–384. [Google Scholar] [CrossRef]
- Florides, G.; Kalogirou, S. Ground heat exchangers—A review of systems, models and applications. Renew. Energy 2007, 32, 2461–2478. [Google Scholar] [CrossRef]
- Larwa, B. Heat transfer model to predict temperature distribution in the ground. Energies 2019, 12, 25. [Google Scholar] [CrossRef]
- Badache, M.; Eslami-Nejad, P.; Ouzzane, M.; Aidoun, Z.; Lamarche, L. A new modelling approach for improved ground temperature profile determination. J. Renew. Energy 2016, 85, 436–444. [Google Scholar] [CrossRef]
- Pokorska-Silva, I.; Kadela, M.; Fedorowicz, L. Variations of Ground Temperature in Shallow Depths in the Silesian Region. IOP Conf. Ser. Mater. Sci. Eng. 2019, 603, 052024. [Google Scholar] [CrossRef]
- Popiel, C.O.; Wojtkowiak, J.; Biernacka, B. Measurements of temperature distribution in ground. Exp. Therm. Fluid Sci. 2001, 25, 301–309. [Google Scholar] [CrossRef]
- Dolcek, A.O.; Tinjum, J.M.; Hart, D.J. Numerical Modeling of Ground Temperature Response in a Ground-Source Heat Pump System (GSHP). In Proceedings of the Geo-Congress 2014, Atlanta, GA, USA, 23–26 February 2014. Technical Papers. [Google Scholar] [CrossRef]
- Beier, R.A.; Smith, M.D.; Spitler, J.D. Reference data sets for vertical borehole ground heat exchanger models and thermal response test analysis. Geothermics 2011, 40, 79–85. [Google Scholar] [CrossRef]
- Qian, H.; Wang, Y. Modeling the interactions between the performance of ground source heat pumps and soil temperature variations. Energy Sustain. Dev. 2014, 23, 115–121. [Google Scholar] [CrossRef]
- Zhao, Z.; Shen, R.; Feng, W.; Zhang, Y.; Zhang, Y. Soil thermal balance analysis for a ground source heat pump system in a hot-summer and cold-winter region. Energies 2018, 11, 1206. [Google Scholar] [CrossRef]
- Lv, S.; Zeng, Y.; Wen, J.; Zhao, H.; Su, Z. Estimation of Penetration Depth from Soil Effective Temperature in Microwave Radiometry. Remote Sens. 2018, 10, 519. [Google Scholar] [CrossRef]
- Choi, W.; Ooka, R.; Nam, Y. Impact of long-term operation of ground-source heat pump on subsurface thermal state in urban areas. Sustain. Cities Soc. 2018, 38, 429–439. [Google Scholar] [CrossRef]
- Naicker, S.S.; Rees, S.J. Performance analysis of a large geothermal heating and cooling system. Renew. Energy 2018, 122, 429–442. [Google Scholar] [CrossRef]
- Tinti, F.; Carri, A.; Kasmaee, S.; Valletta, A.; Segalini, A.; Bonduà, S.; Bortolotti, V. Ground temperature monitoring for a coaxial geothermal heat exchangers field: Practical aspects and main issues from the first year of measurements. Rud.-Geol.-Naft. Zb. 2018, 33, 47–57. [Google Scholar] [CrossRef]
- Vienken, T.; Kreck, M.; Dietrich, P. Monitoring the impact of intensive shallow geothermal energy use on groundwater temperatures in a residential neighbourhood. Geotherm. Energy 2019, 7, 8. [Google Scholar] [CrossRef]
- Kim, S.-K.; Lee, Y. Evaluation of ground temperature changes by the operation of the geothermal heat pump system and climate change in Korea. Water 2020, 12, 2931. [Google Scholar] [CrossRef]
- Chicco, J.M.; Mandrone, G. How a sensitive analysis on the coupling geology and borehole heat exchanger characteristics can improve the efficiency and production of shallow geothermal plants. Heliyon 2022, 8, 1–8. [Google Scholar] [CrossRef] [PubMed]
- Walch, A.; Li, X.; Chambers, J.; Mohajeri, N.; Yilmaz, S.; Patel, M.; Scartezzini, J.-L. Shallow geothermal energy potential for heating and cooling of buildings with regeneration under climate change scenarios. Energy 2022, 244, 123086. [Google Scholar] [CrossRef]
- Figueiredo, A.; Lapa, J.; Cardoso, C.; Macedo, J.; Rodrigues, F.; Vieira, A.; Pinto, A.; Maranha, J.R. Shallow geothermal systems for Aveiro University departments: A survey through the energy efficiency and thermal comfort. In Proceedings of the 17th European Conference on Soil Mechanics and Geotechnical Engineering 2019, Reykjavik, Iceland, 1–6 September 2019. [Google Scholar]
- Aljundi, K.; Figueiredo, A.; Vieira, A.; Lapa, J.; Cardoso, R. Geothermal Energy System Application: From basic standard performance to sustainability reflection. Renew. Energy 2024, 220, 119612. [Google Scholar] [CrossRef]
- Dias, J.M.; Lopes, J.F.; Dekeyser, I. Tidal Propagation in Ria de Aveiro Lagoon, Portugal. Phys. Chem. Earth Part B Hydrol. Oceans Atmos. 2000, 25, 369–374. [Google Scholar] [CrossRef]
- Néri, C.S.G. Study of Mechanical Behaviour of Soils under the Influence of Geothermal Systems. Master’s Thesis, Aveiro University, Aveiro, Portugal, 2016. [Google Scholar]
- TPSYS02 Thermal Conductivity Measurement System. Hukseflux Thermal Sensors. 2003. Available online: http://www.hukseflux.com (accessed on 14 August 2023).
- Farouki, O. Evaluation of Methods for Calculating Soil Thermal Conductivity; US Army Corps of Engineers, Cold Regions Research & Engineering Laboratory: Hanover, NH, USA, 1982; Volume 82, No. 8. [Google Scholar]
- Aljundi, K.; Vieira, A.; Maranha, J.; Lapa, J.; Cardoso, R. Effects of Temperature, Test Duration and Heat Flux in Thermal Conductivity Measurements under Transient Conditions in Dry and Fully Saturated States. In Proceedings of the 4th European Conference on Unsaturated Soils (E-UNSAT 2020), Lisbon, Portugal, 24–26 June 2020. [Google Scholar] [CrossRef]
- Luo, J.; Rohn, J.; Xiang, W.; Bertermann, D.; Blum, P. A review of ground investigations for ground source heat pump (GSHP) systems. Energy Build. 2016, 117, 160–175. [Google Scholar] [CrossRef]
- Michot, A.; Smith, D.S.; Degot, S.; Gault, C. Thermal conductivity, and specific heat of kaolinite: Evolution with thermal treatment. J. Eur. Ceram. Soc. 2008, 28, 2639–2644. [Google Scholar] [CrossRef]
- Thomas, H.R.; Rees, S.W. Measured and simulated heat transfer to foundation soils. Géotechnique 2009, 59, 365–375. [Google Scholar] [CrossRef]
- Kottek, M.; Grieser, J.; Beck, C.; Rudolf, B.; Rubel, F. World Map of the Köppen-Geiger climate classification updated. Meteorol. Z. 2006, 15, 259–263. [Google Scholar] [CrossRef]
- The Portuguese Institute for Sea and Atmosphere, I.P. (IPMA, IP). Available online: https://www.ipma.pt/pt (accessed on 16 August 2023).
- Cable Sensor, Pt100. Available online: https://www.baumer.com/medias/__secure__/Baumer_Pt100_Pt1000_cablesensor_EN.pdf?mediaPK=8852884750366 (accessed on 20 September 2023).
- Itasca’s FLAC3D Documentation. Available online: https://docs.itascacg.com/flac3d700/contents.html (accessed on 20 August 2023).
- Kusuda, T.; Achenbach, P.R. Earth Temperature and Thermal Diffusivity at Selected Stations in the United States; National Institute of Standards and Technology: Gaithersburg, MD, USA, 1965. [Google Scholar] [CrossRef]
- Cui, W.; Liao, Q.; Chang, G.; Chen, G.; Peng, Q.; Jen, T.C. Measurement and prediction of undisturbed underground temperature distribution. In Energy Systems Analysis, Thermodynamics and Sustainability; Combustion Science and Engineering; Nanoengineering for Energy, Parts A and B, Proceedings of the ASME 2011 International Mechanical Engineering Congress and Exposition, Denver, CO, USA, 11–17 November 2011; ASME: New York, NY, USA, 2011; Volume 4, pp. 671–676. [Google Scholar] [CrossRef]
- Alam, M.R.; Zain, M.F.M.; Kaish, A.B.M.A.; Jamil, M. Underground soil and thermal conductivity materials-based heat reduction for energy-efficient building in tropical environment. Indoor Built Environ. 2015, 24, 185–200. [Google Scholar] [CrossRef]
- Al-Hinti, I.; Al-Muhtady, A.; Al-Kouz, W. Measurement and modelling of the ground temperature profile in Zarqa, Jordan for geothermal heat pump applications. J. Appl. Therm. Eng. 2017, 123, 131–137. [Google Scholar] [CrossRef]
Figure 1.
Heat pump hourly energy output to heat and cool the case study building.
Figure 1.
Heat pump hourly energy output to heat and cool the case study building.
Figure 2.
Illustration of GSHP system components: (a) Primary circuit, (b) heat pump, and (c) secondary circuit.
Figure 2.
Illustration of GSHP system components: (a) Primary circuit, (b) heat pump, and (c) secondary circuit.
Figure 3.
A plan of the investigation and the borehole heat exchangers, where the two orange boxes were used to refer the structural piles.
Figure 3.
A plan of the investigation and the borehole heat exchangers, where the two orange boxes were used to refer the structural piles.
Figure 4.
Portugal mainland: Aveiro region highlighted (source [
38]).
Figure 4.
Portugal mainland: Aveiro region highlighted (source [
38]).
Figure 5.
Measured data of Aveiro weather: temperature, radiation, and relative humidity, where letters from J to D represent the months over one year from January to December.
Figure 5.
Measured data of Aveiro weather: temperature, radiation, and relative humidity, where letters from J to D represent the months over one year from January to December.
Figure 6.
The investigation boreholes were assembled in four groups. The black and white boreholes are the investigation boreholes (their numbers are in circles), while the black and grey boreholes are the SGE system boreholes (they are named with the letter “F” together with the number of each borehole).
Figure 7.
Installation of the temperature probes for the monitoring system.
Figure 7.
Installation of the temperature probes for the monitoring system.
Figure 8.
Air and ground B.I.1 (a) and B.I.12 (b) at different depths of temperature evolution during the monitoring period, where the letters from A to A represent the months over one year from April to April.
Figure 8.
Air and ground B.I.1 (a) and B.I.12 (b) at different depths of temperature evolution during the monitoring period, where the letters from A to A represent the months over one year from April to April.
Figure 9.
Monthly average ground temperature in B.I.1 (a) and B.I.12 (b) for the monitoring period.
Figure 9.
Monthly average ground temperature in B.I.1 (a) and B.I.12 (b) for the monitoring period.
Figure 10.
Extreme ground temperature is monitored in all boreholes with the average temperature of each group, where (a) is group 1, (b) is group 2, (c) is for group 3, and (d) is for group 4.
Figure 10.
Extreme ground temperature is monitored in all boreholes with the average temperature of each group, where (a) is group 1, (b) is group 2, (c) is for group 3, and (d) is for group 4.
Figure 11.
Mesh of the axisymmetric model.
Figure 11.
Mesh of the axisymmetric model.
Figure 12.
Temperature profiles obtained by numerical simulation were compared to the extreme profiles of groups 1 to 4 of the investigation boreholes corresponds to subfigures (a–d).
Figure 12.
Temperature profiles obtained by numerical simulation were compared to the extreme profiles of groups 1 to 4 of the investigation boreholes corresponds to subfigures (a–d).
Table 1.
Experimental and reference values of the thermal conductivity of superficial soil on the UA campus. Keys: λ = Soil thermal conductivity; (a) refers to saturated conditions; and (b) refers to unsaturated conditions.
Table 1.
Experimental and reference values of the thermal conductivity of superficial soil on the UA campus. Keys: λ = Soil thermal conductivity; (a) refers to saturated conditions; and (b) refers to unsaturated conditions.
| | | λ (W·m−1·K−1) |
|---|
| Dry Soil | Saturated a and Unsaturated b |
|---|
| Soil Type | Depth (m) | Experimental Value | Reference Value | Experimental Value | Reference Value |
|---|
| Clay and sandy clay | 0–6 | (0.21, 0.39) | 0.35 | (1.13, 2.40) a
Sr ≈ 35% | (1.42, 2.70) b |
| Claystone | 6–10 | - | 0.15 | (1.88, 2.59) a
Sr ≈ 70% | (1.18–1.80) b |
| (up to 2.50) a |
Table 2.
Thermal conductivity values are estimated semi-empirically in geothermal borehole F16. Keys: λ = Thermal Conductivity, Sr = degree of saturation, n = porosity, w% = moisture content, and Gs = particle dry unit weight.
Table 2.
Thermal conductivity values are estimated semi-empirically in geothermal borehole F16. Keys: λ = Thermal Conductivity, Sr = degree of saturation, n = porosity, w% = moisture content, and Gs = particle dry unit weight.
| Depth (m) | Gs | w% | n | Sr | λ
(W·m−1·K−1) | Soil Type | Unified Soil
Classification System |
|---|
| 0–6 | 2.62 | 13.74 | 0.42 | 0.5 | 1.93 | Fine | Clay and sandy clay (ML) |
| 6–18 | 2.63 | 18.38 | 0.32 | 1.0 | 2.60 | Fine | Claystone (CL) |
| 18–24 | 2.65 | 10.58 | 0.22 | 1.0 | 3.25 | Coarse | Clayey sand (SC) |
| 24–78 | 2.64 | 32.81 | 0.44 | 1.0 | 2.11 | Fine | Claystone (CL) |
| 78–84 | 2.64 | 24.57 | 0.39 | 1.0 | 2.24 | Coarse | Clayey sand (SC) |
| 84–90 | 2.62 | 31.44 | 0.45 | 1.0 | 1.98 | Fine | Clay and sandy clay (ML) |
| 90–132 | 2.63 | 23.84 | 0.38 | 1.0 | 2.28 | Coarse | Clayey sand (SC) |
Table 3.
Thermal conductivity values were estimated semi-empirically in geothermal borehole F17. Keys: λ = Thermal Conductivity, Sr = degree of saturation, n = porosity, w% = moisture content, and Gs = particle dry unit weight.
Table 3.
Thermal conductivity values were estimated semi-empirically in geothermal borehole F17. Keys: λ = Thermal Conductivity, Sr = degree of saturation, n = porosity, w% = moisture content, and Gs = particle dry unit weight.
| Depth (m) | Gs | w% | n | Sr | λ
(W·m−1·K−1) | Soil Type | Unified Soil
Classification System |
|---|
| 0–6 | 2.64 | 9.30 | 0.20 | 0.5 | 2.49 | Coarse | Clay and sandy clay (ML) |
| 6–18 | 2.59 | 18.90 | 0.33 | 1.0 | 2.57 | Fine | Claystone (CL) |
| 18–24 | 2.58 | 17.20 | 0.31 | 1.0 | 2.69 | Coarse | Clayey sand (SC) |
| 24–78 | 2.57 | 39.57 | 0.50 | 1.0 | 1.81 | Fine | Claystone (CL) |
| 78–84 | 2.56 | 21.90 | 0.36 | 1.0 | 2.40 | Coarse | Clayey sand (SC) |
| 84–90 | 2.58 | 21.70 | 0.36 | 1.0 | 2.41 | Coarse | Clay and sandy clay (ML) |
| 90–132 | 2.62 | 20.56 | 0.35 | 1.0 | 2.46 | Coarse | Clayey sand (SC) |
Table 4.
Investigation boreholes with the respective depth.
Table 4.
Investigation boreholes with the respective depth.
| | Group 1 | Group 2 | Group 3 | Group 4 |
|---|
| Number of investigation borehole | 1 | 2 | 3 | 4 | 5 | 6 | 8 | 9 | 16 | 10 | 13 | 14 | 11 | 12 | 15 |
| Borehole depth (m) | 50 | 140 | 55 | 40 | 120 | 70 | 10 | 20 | 120 | 20 | 20 | 10 | 20 | 20 | 20 |
| Depth at which thermal sensors are placed | 1 | 1 | 1 | 1 | 1 | 1 | 1 | 1 | 1 | 2 | 2 | 1 | 2 | 2 | 2 |
| 2 | 2 | 2 | 2 | 2 | 2 | 2 | 2 | 2 | 5 | 5 | 2 | 5 | 5 | 5 |
| 5 | 5 | 5 | 5 | 5 | 5 | 5 | 5 | 5 | 10 | 10 | 5 | 10 | 10 | 10 |
| 10 | 20 | 10 | 20 | 20 | 10 | 10 | 10 | 20 | 15 | 15 | 10 | 15 | 15 | 15 |
| 20 | 40 | 20 | 40 | 40 | 20 | | 20 | 40 | 20 | 20 | | 20 | 20 | 20 |
| 40 | 60 | 55 | | 60 | 40 | | | 60 | | | | | | |
| 50 | 80 | | | 80 | 70 | | | 80 | | | | | | |
| | 100 | | | 100 | | | | 100 | | | | | | |
| | 120 | | | 120 | | | | 120 | | | | | | |
| | 140 | | | 140 | | | | | | | | | | |
Table 5.
Diurnal and seasonal waves’ penetration depth.
Table 5.
Diurnal and seasonal waves’ penetration depth.
| Source | Location | Soil Type | λ
(W·m−1·K−1) | Penetration
Depth (m) | Annual Average Air Temperature (°C) |
|---|
| Diurnal | Annual |
|---|
| [42] | Lemont, USA | * | 0.6 to 4.0 | 0.9 | 3.0 | 10.0 |
| [14] | Poznan, Poland | Sandy soil, loam, and clay until 3 m
Silty soil after 3 m depth | 1.8 | 1.0 | 8.0 | 9.4 |
| [43] | Chongqing, China | Sandstone and mudstone | 2.5 | 1.0 | 11.0 | 18.2 |
| [44] | Malaysia | Sandy soil | N.A. | 0.5 | 10.0 | 27.5 |
| [45] | Zarqa, Jordan | Fine-silty, mixed, calcareous | 1.2 | 1.0 | 5.0 | 21 |
| [19] | Jamshedpur, India | Sand and clay | N.A. | 0.4 | 4.0 | 28.7 |
| a | Aveiro, Portugal | | 2.2 to 4.4 | 1.0 | 10.0 | 15.5 |
| Disclaimer/Publisher’s Note: The statements, opinions and data contained in all publications are solely those of the individual author(s) and contributor(s) and not of MDPI and/or the editor(s). MDPI and/or the editor(s) disclaim responsibility for any injury to people or property resulting from any ideas, methods, instructions or products referred to in the content. |
© 2024 by the authors. Licensee MDPI, Basel, Switzerland. This article is an open access article distributed under the terms and conditions of the Creative Commons Attribution (CC BY) license (https://creativecommons.org/licenses/by/4.0/).


