Article

Conceptual and Applied Aspects of Water Retention Tests on Tailings Using Columns

by
Fernando A. M. Marinho
1,*,
Yuri Corrêa
1,
Rosiane Soares
2,
Inácio Diniz Carvalho
2 and
João Paulo de Sousa Silva
2
1
Institute of Geoscience, University of São Paulo, São Paulo 05508-080, SP, Brazil
2
Laboratório de Geotecnia da Vale (LGV), Santa Luzia 33040-900, MG, Brazil
*
Author to whom correspondence should be addressed.
Geosciences 2024, 14(10), 273; https://doi.org/10.3390/geosciences14100273
Submission received: 22 June 2024 / Revised: 24 September 2024 / Accepted: 8 October 2024 / Published: 16 October 2024

Abstract

:
The water retention capacity of porous materials is crucial in various geotechnical and environmental engineering applications such as slope stability analysis, landfill management, and mining operations. Filtered tailings stacks are considered an alternative to traditional tailings dams. Nevertheless, the mechanical behaviour and stability of the material under different water content conditions are of concern because these stacks can reach considerable heights. The water behaviour in these structures is poorly understood, particularly the effects of the water content on the stability and potential for liquefaction of the stacks. This study aims to investigate the water retention and flow characteristics of compacted iron ore tailings in high columns to better understand their hydromechanical behaviour. The research used 5 m high columns filled with iron ore tailings from the Quadrilátero Ferrífero region in Minas Gerais, Brazil. The columns were prepared in layers, compacted, and instrumented with moisture content sensors and suction sensors to monitor the water movement during various stages of saturation, drainage, infiltration, and evaporation. The sensors provided consistent data and revealed that the tailings exhibited high drainage capacity. The moisture content and suction profiles were effectively established over time and revealed the dynamic water retention behaviour. The comparison of the data with the theoretical soil water retention curve (SWRC) demonstrated a good correlation which indicates that there was no hysteresis in the material response. The study concludes that the column setup effectively captures the water retention and flow characteristics of compacted tailings and provides valuable insights for the hydromechanical analysis of filtered tailings stacks. These findings can significantly help improve numerical models, calibrate material parameters, and contribute to the safer and more efficient management of tailings storage facilities.

1. Introduction

P, 33.040-900-Santa Luzia-MGarticulate porous materials naturally occur and are also generated through mining processes to yield ore and tailings. These materials play a consistent role in infrastructure projects that involve road cuts or embankments for dams and levees. Ores are typically transported by ships or other means, whereas tailings are deposited in dams or stored in expansive “dry” stacks. However, the inherent porous nature of these materials and the variable yet consistent presence of water pose various challenges to the safety of associated activities. The risks include potential hazards to ships during ore transport, stability concerns for dams, large tailings embankments, and other structural elements.
The eventual saturation of the material can lead to failure. When porous materials become saturated with water, their stability and mechanical properties can be significantly compromised, which may result in liquefaction. Rico et al. [1], Santamarina et al. [2], Koppe [3], Nwigwe and Minami [4], and other studies underscore these risks due to the saturation of those materials. The present study stands out for its originality by addressing a highly relevant and contemporary topic, which has been the subject of limited experimental research. Given the increasing attention to environmental and geotechnical challenges related to filtered tailings and their hydraulic behaviour, this research fills a crucial gap by providing experimental insights that are often overlooked in the literature. The scarcity of empirical studies on re-saturation processes and moisture redistribution in tailings stacks makes this work particularly significant for both academic and practical applications. This work presents experimental data from monitored columns and elucidates the fundamental concepts of water retention in porous media, particularly in ores and tailings. To illustrate this process, Figure 1a depicts an open-air ore pile undergoing drainage with water retention at the time of deposition. The accompanying graph in Figure 1b illustrates the drainage process over time, which tends toward equilibrium in the absence of atmospheric interference.
In the example in Figure 1, the boundary condition at the base enables unrestricted drainage, which ensures that there is no water accumulation at the base.

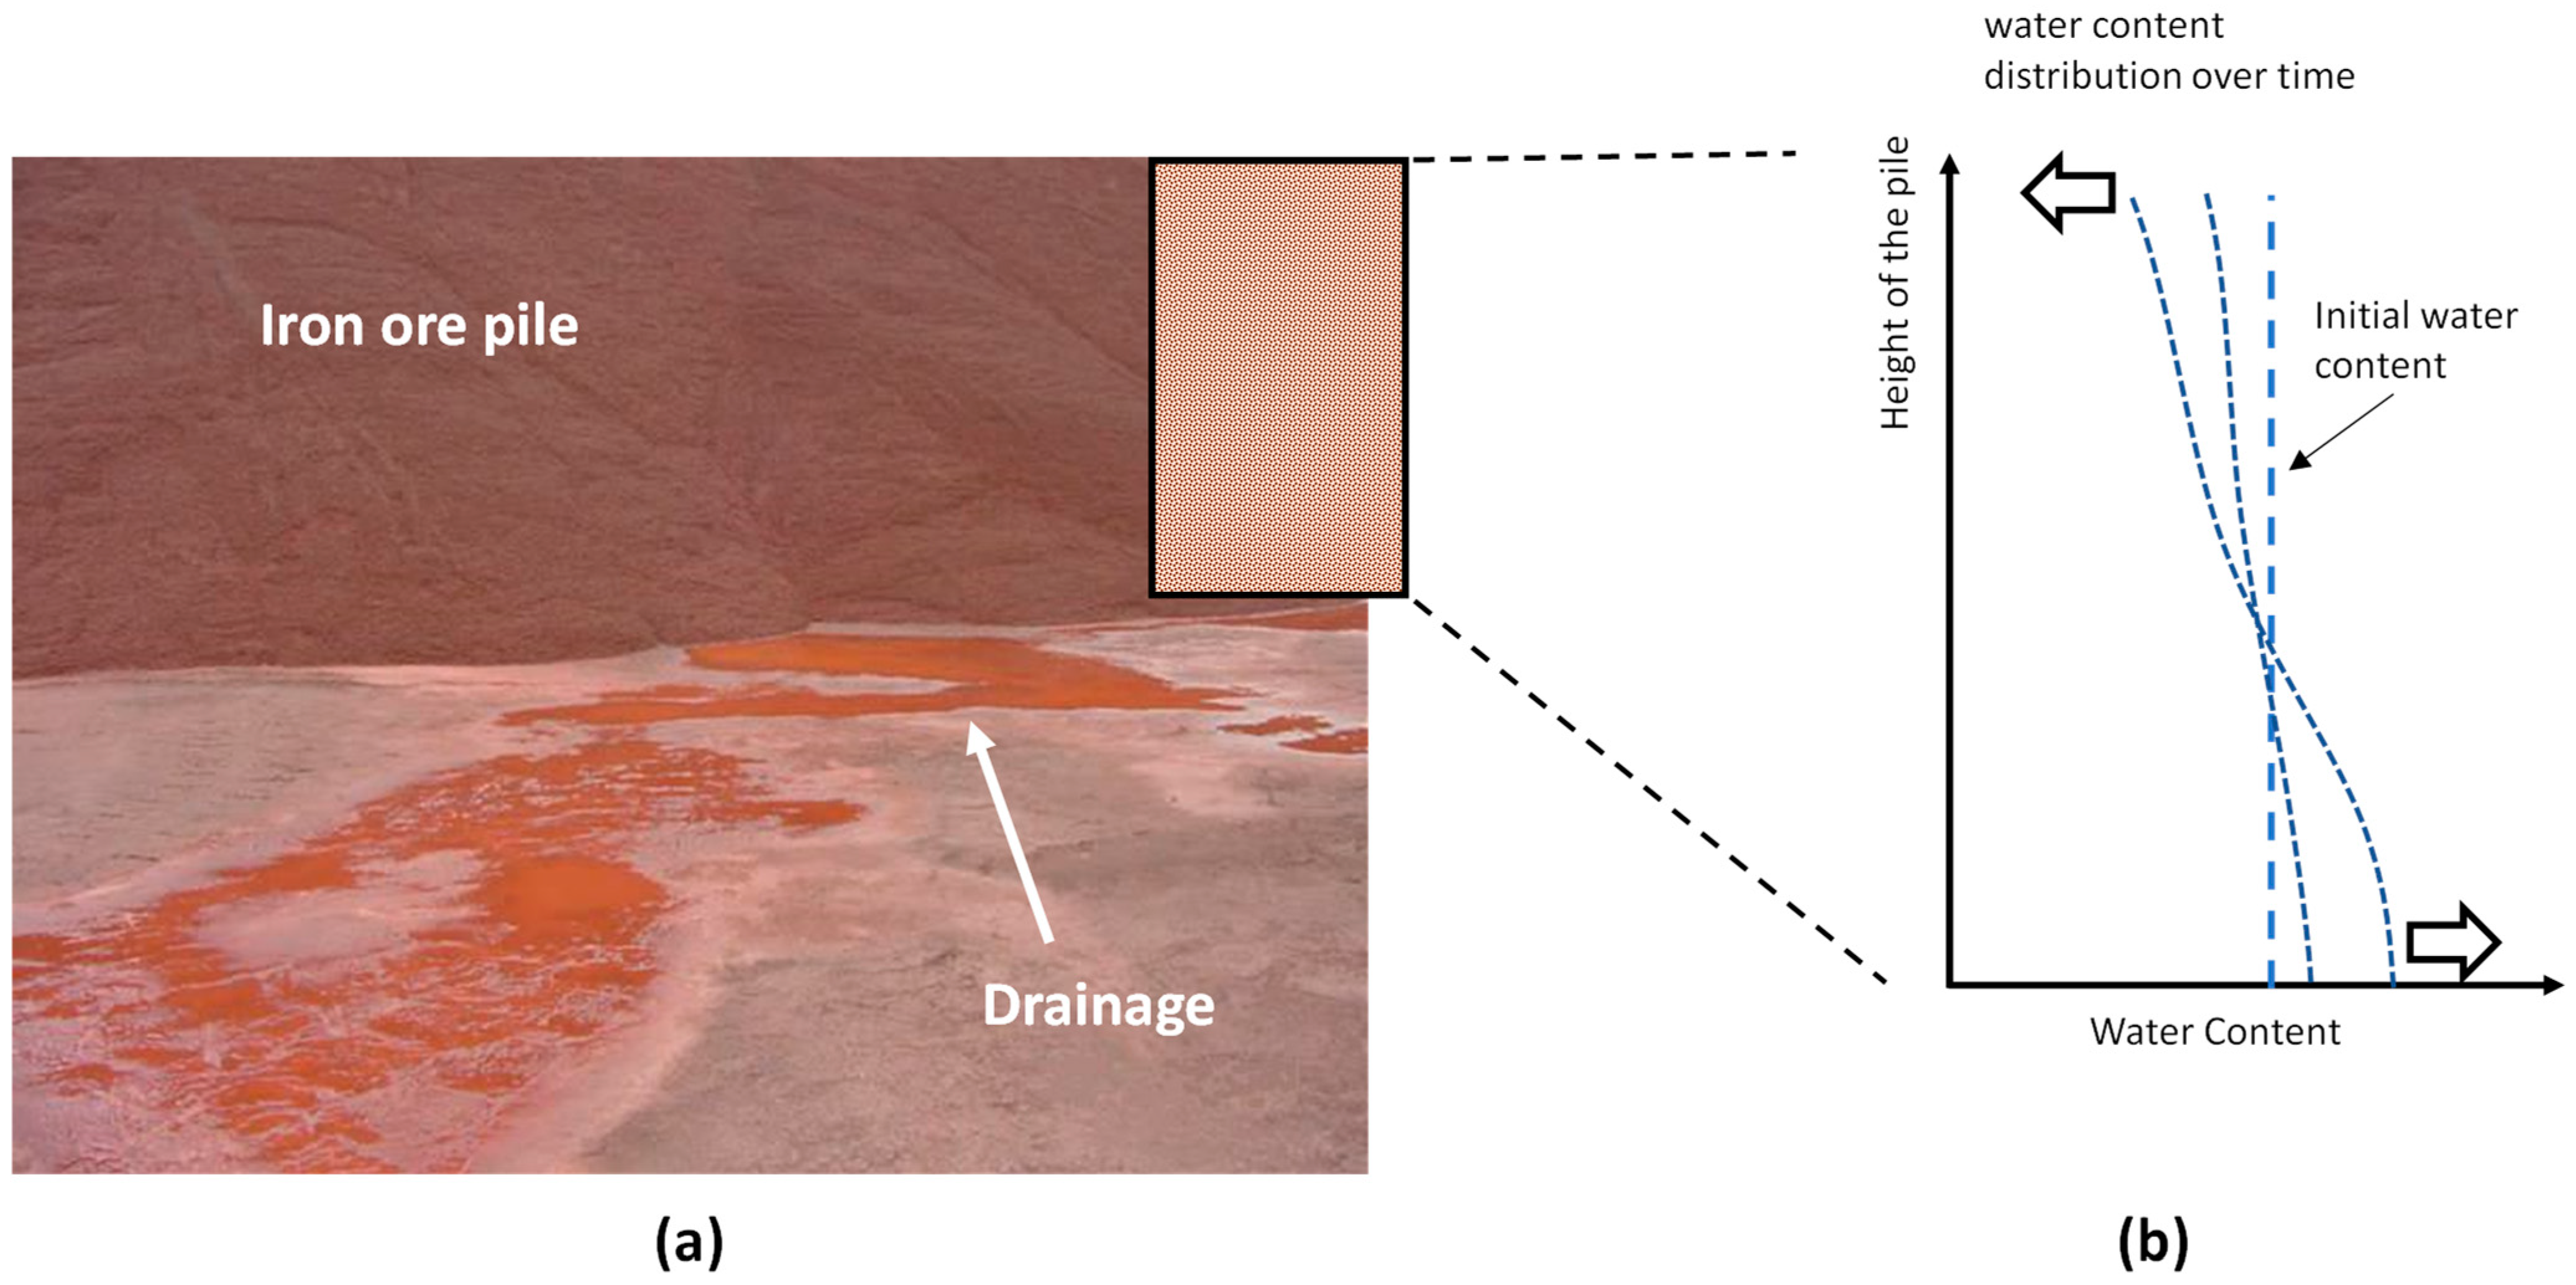
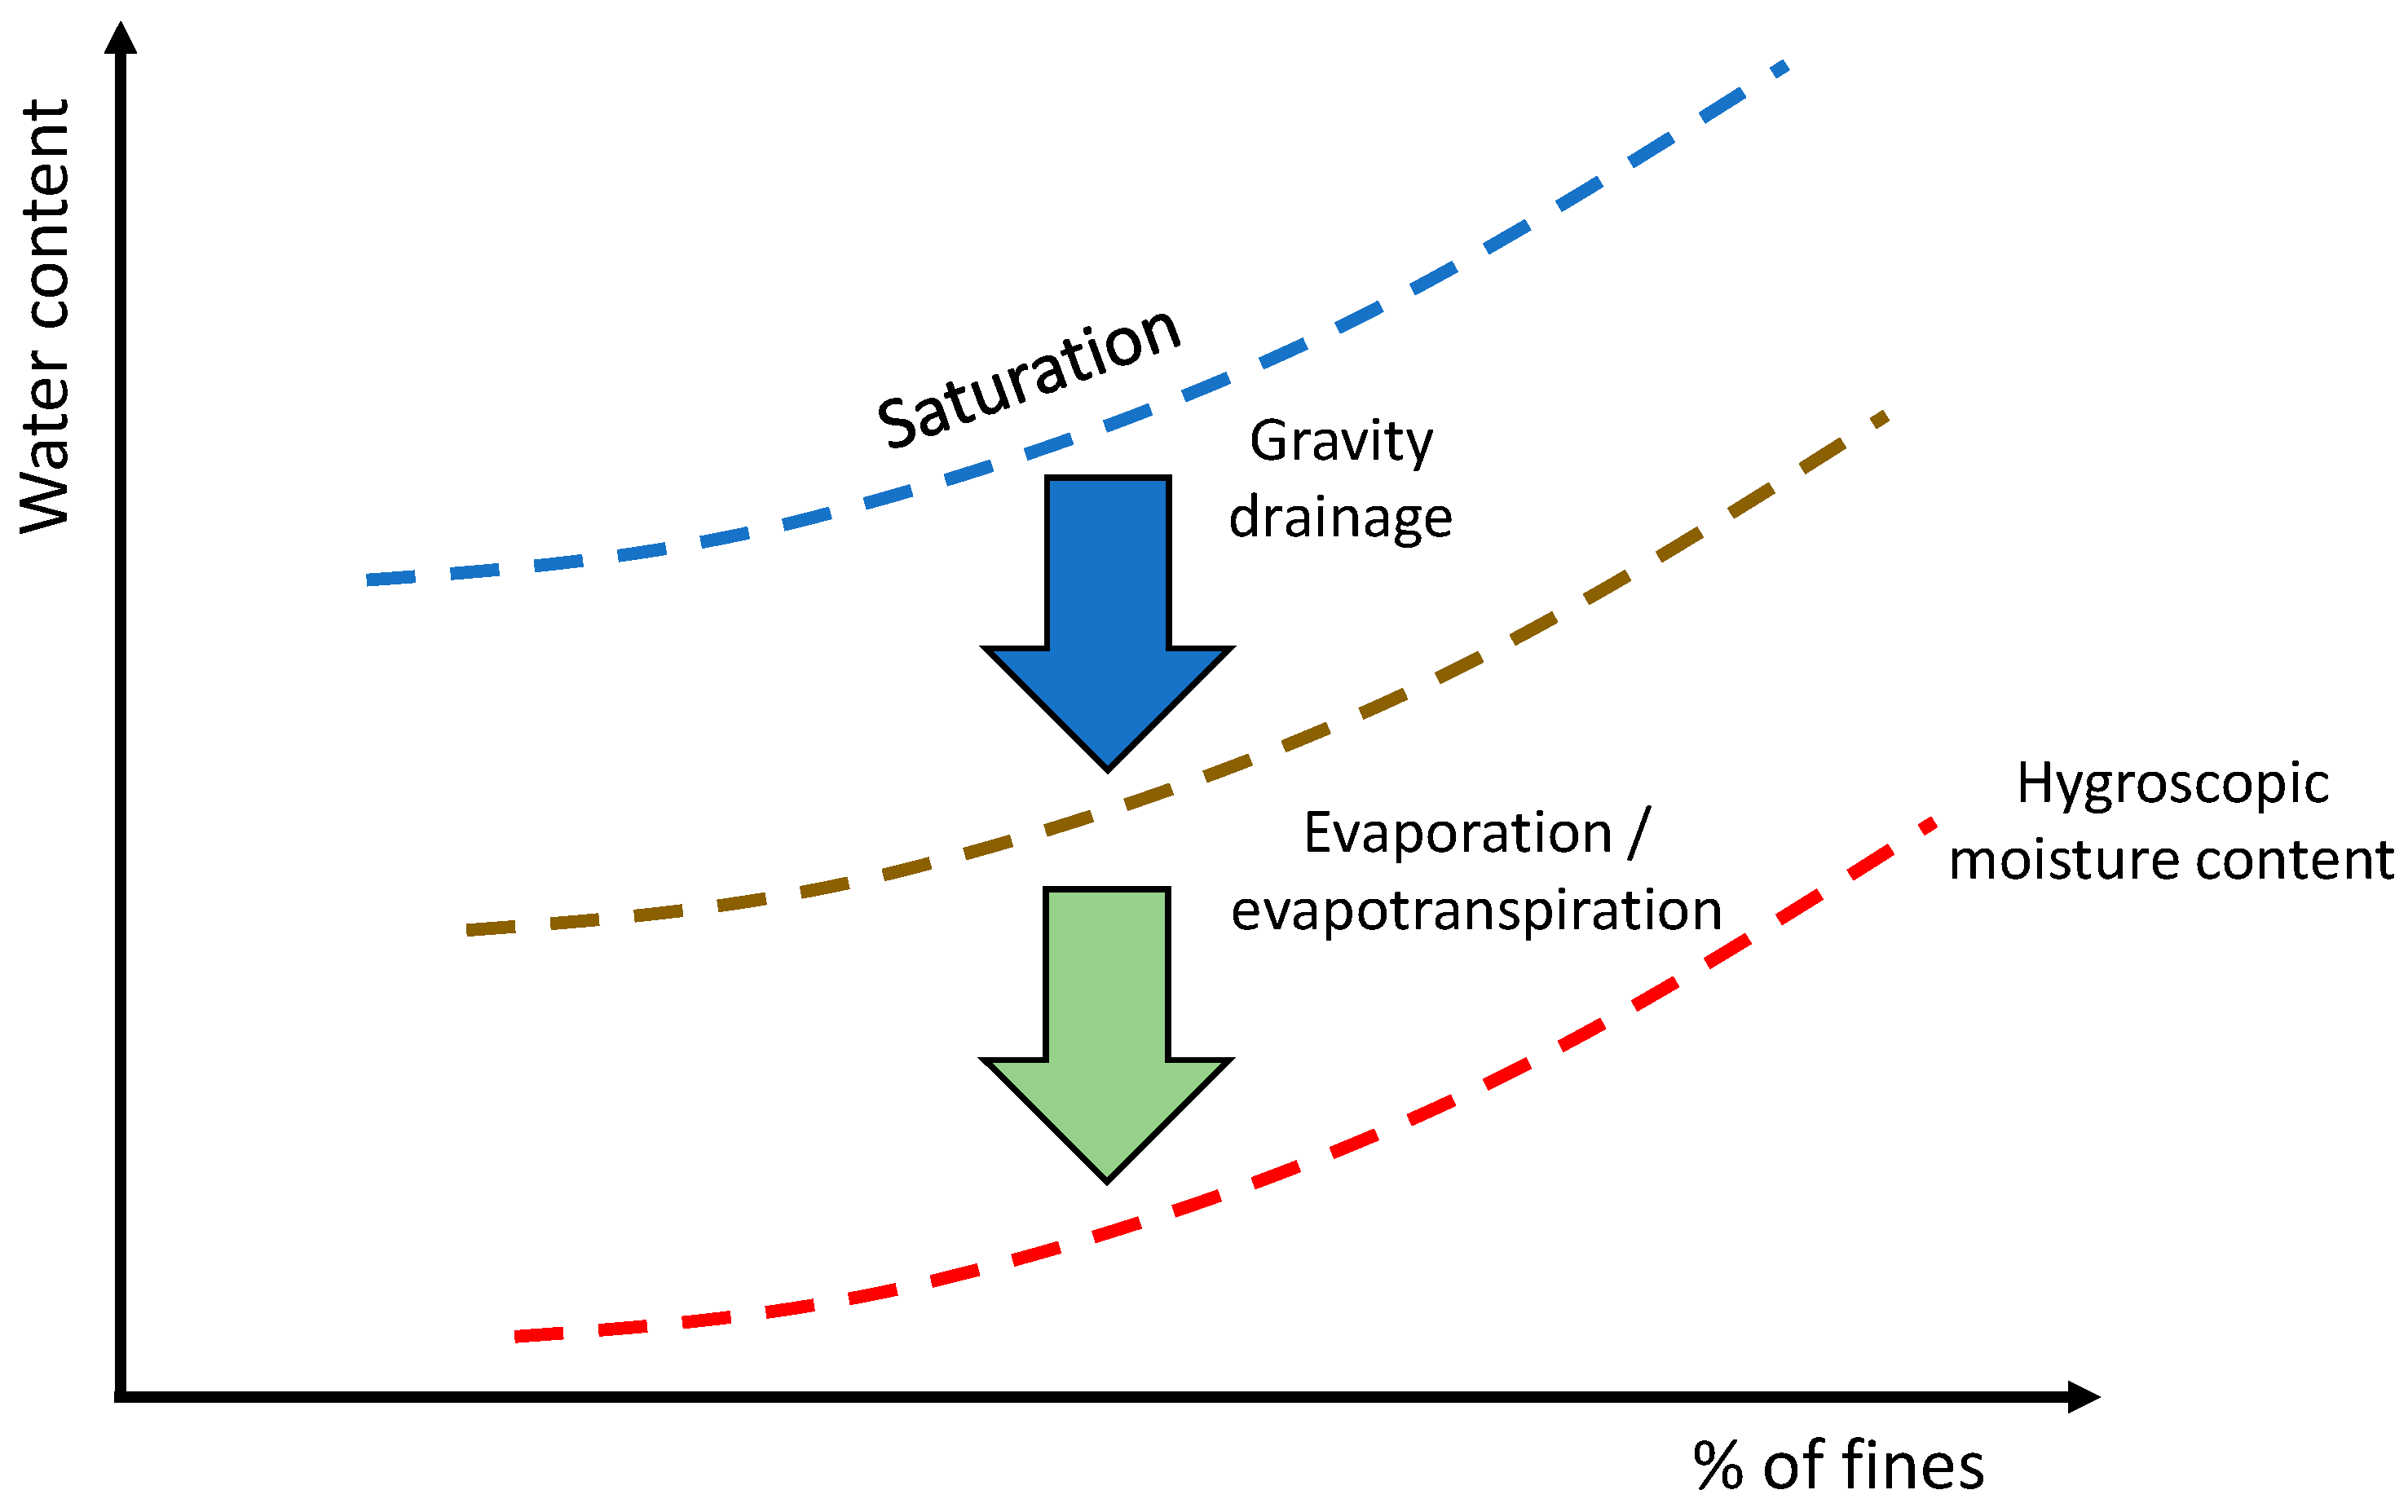
2. Water Retention in Porous Media

The definitions in this section may appear elementary but can help the reader become familiar with certain characteristics of porous materials and understand the relationships among three phases in these materials: solid (particle), liquid (typically water), and gas (typically air). Table 1 shows useful definitions to interpret data related to water retention in porous media [5,6].

Water Retention Curves in Porous Media

The water retention capacity of particulate porous materials is influenced by factors such as the particle size distribution, mineralogy, and material structure. Of particular significance is the fine content, which is composed of particles smaller than 0.074 mm, or more specifically, the clay content, which consists of particles smaller than 2 μm. Capillarity and adsorption forces in clayey materials are primarily responsible for water retention phenomena. Figure 2 shows the relationship between water content and proportion of fines in the material or its plasticity. Figure 2 illustrates two phenomena that drive the variations in moisture content. When initially saturated, water in the soil is primarily drained by gravitational forces, which are counteracted by capillary and physicochemical forces, until it reaches the field capacity. Below this water content threshold, water is only depleted through evapotranspiration (solar and/or vegetation) energy. Beyond the threshold, the water content cannot be reduced under typical environmental conditions. Importantly, materials without fines may struggle to retain water, which limits their ability to maintain a high degree of saturation.
The water distribution in a soil profile is influenced by the material properties and boundary conditions of the problem, particularly the potential presence of free water, such as a water table or another system of free water access. Figure 3a shows a soil column with free water access at the base, which simulates a water table. Water has energy above the water level, which is called free energy [7]. The variation in this energy is numerically equal to the variation in hydrostatic pressure when the density of water is 1 g/cm³. Therefore, we can express it as follows:
f = h ρ g = s u c t i o n
Thus, suction represents the negative pressure of water in the pores. Figure 3b shows the distribution of free energy along a soil column under constant temperature. The rate of change in free energy along the column remains constant and equal to −g. Regardless of the soil type, the distribution of free energy resembles that in Figure 3b when the system is in equilibrium. Figure 3c schematically depicts the change in water content with the column height. This relationship depends on the granulometric, mineralogical, and structural characteristics of the soil.
The profile of the free energy, i.e., the suction profile, can be coupled with the determination of the water content and volume variation of the material to establish the water retention curve. This curve relates the amount of water (w, θ, S) to suction. However, this condition holds true only under equilibrium situations where there is no flow of water or water vapour in the system. Under field conditions, the suction profile is as shown in Figure 4a, which illustrates potential seasonal variations that correlate with the fluctuations in water content (Figure 4b). Figure 4 highlights the active zone, which is the depth at which atmospheric environmental factors can influence the suction profile [8,9].

3. Use of Columns for Water Retention Studies

Some authors consider Philippe de La Hire the inventor of the lysimeter [10,11,12]. De La Hire pioneered the use of columns to study the hydrogeological behaviour of soils in 1703 and constructed a series of lysimeters that resembled columns of different heights. After 15 years of experimentation in the field, he concluded that the infiltration was minimal, and vegetation played an important role in the interaction with the atmosphere. Buckingham [13] could be one of the first to use soil columns in the laboratory to study the water retention and movement in soils. Recently, other researchers successfully used this technique [14,15,16,17,18,19,20]. As described, a column of porous material in contact with free water at the base reaches suction equilibrium and forms a hydrostatic profile. Combined with water content data, this profile enables the determination of the water retention curve. This method is suitable for materials that do not significantly change in volume when subjected to changes in water content. However, it has limitations such as the column height and equilibrium time. Columns taller than 3 m make the assembly procedure difficult and require a robust support structure. The 3 m high columns enable equilibrium suctions of up to 30 kPa, according to Equation (8). Nevertheless, there are cases where longer columns should be used, such as investigations of the active zone. The use of longer columns is particularly interesting for fine materials, such as tailings used for dry stack piles.
Figure 5 presents the concepts in obtaining the retention curve through columns. Columns in general and short columns in particular provide an accurate method to obtain the soil water retention curve (SWRC), especially for lower suction levels. Figure 5a shows a photo of a straightforward column system made of PVC segments. Figure 5b shows an example of a column with a constant water level system at the base. There is a cap at the top of the column to prevent evaporation while maintaining atmospheric pressure. Figure 5c shows the resulting equilibrium profile.
The equilibrium profile is associated with the water content profiles in Figure 5d, which represent three hypothetical materials. The preparation procedure involves defining the assembly density in the column and the column saturation process. The density depends on the simulated conditions and is associated with the specific problem in investigation. Saturation is achieved from bottom to top by raising the water level through a hose connected to the base. After saturation has been complete, the drainage process can be initiated, and the loss of water from the base is monitored over time to determine the time at which equilibrium is attained. In this scenario, the columns lack instruments, and the SWRC determination involves dismantling the columns. The water content is measured along the column and then correlated with the column height.

4. Columns with Compacted Iron Ore Tailings

As previously mentioned, the construction of filtered tailings stacks has been an alternative to deposition in dams. These stacks generally have large heights of hundreds of metres [21]. The considerable heights of these stacks raise doubts regarding the stress state of the material, mechanical behaviour of the material, and the effects of the presence of water and eventual saturation of the compacted material on this behaviour. Understanding the behaviour of water in the stacks in terms of infiltration, evaporation, and capillary rise is crucial to avoid creating additional conditions for liquefaction.
Columns filled with compacted tailings are an alternative to simulate the one-dimensional behaviour of tailings piles in terms of water flow and water retention. This work used columns with a height of 5 m, which enables the understanding of water behaviour associated with precipitation and evaporation to evaluate the active zone. The columns were instrumented to better characterize the water movement process.

4.1. Materials

The material in the studied column was an iron ore tailing from the Quadrilátero Ferrífero in the state of Minas Gerais, Brazil. According to the unified classification, it is a nonplastic silt composed of approximately 90% quartz and 10% iron oxide. Table 2 presents the characteristics of the material.
Figure 6 shows the SWRC of the material. The data were obtained via different techniques, as presented by Jesus et al. [22].
The parameters of the curve were adopted based on Van Genuchten’s [23] equation (Equation (2)) and are shown in Table 3.
θ s u c t i o n = θ r + θ s a t θ r e s i d u a l 1 + α × s u c t i o n n m

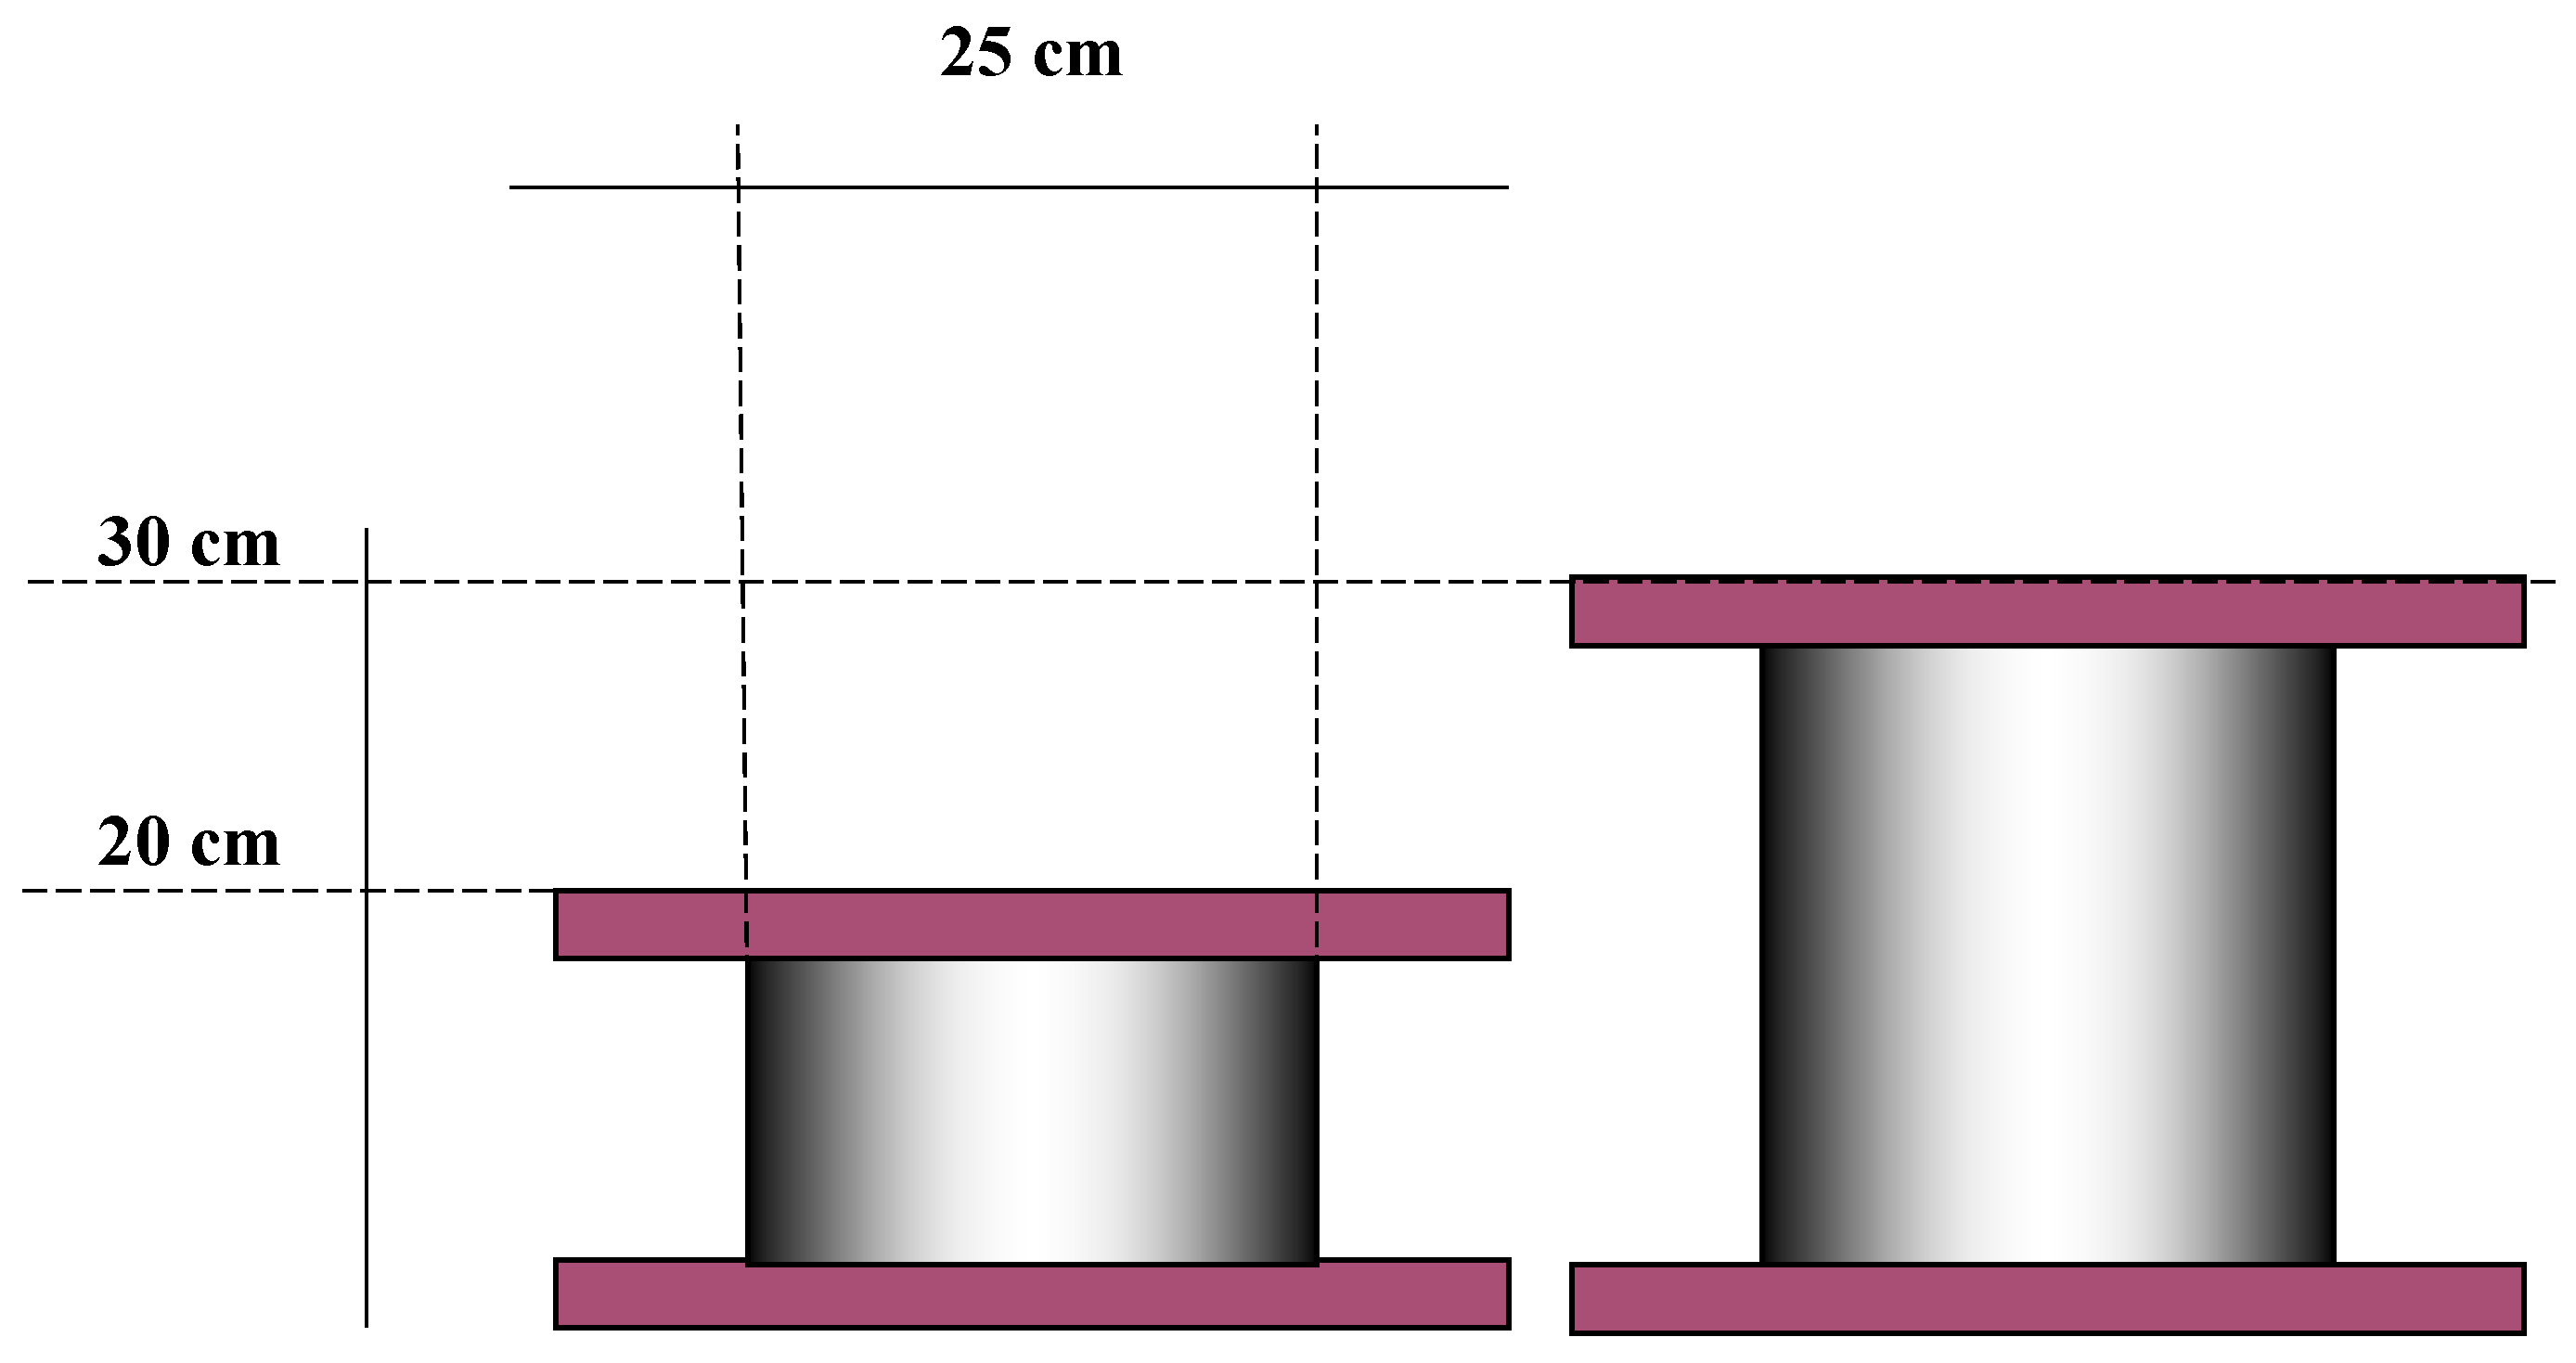
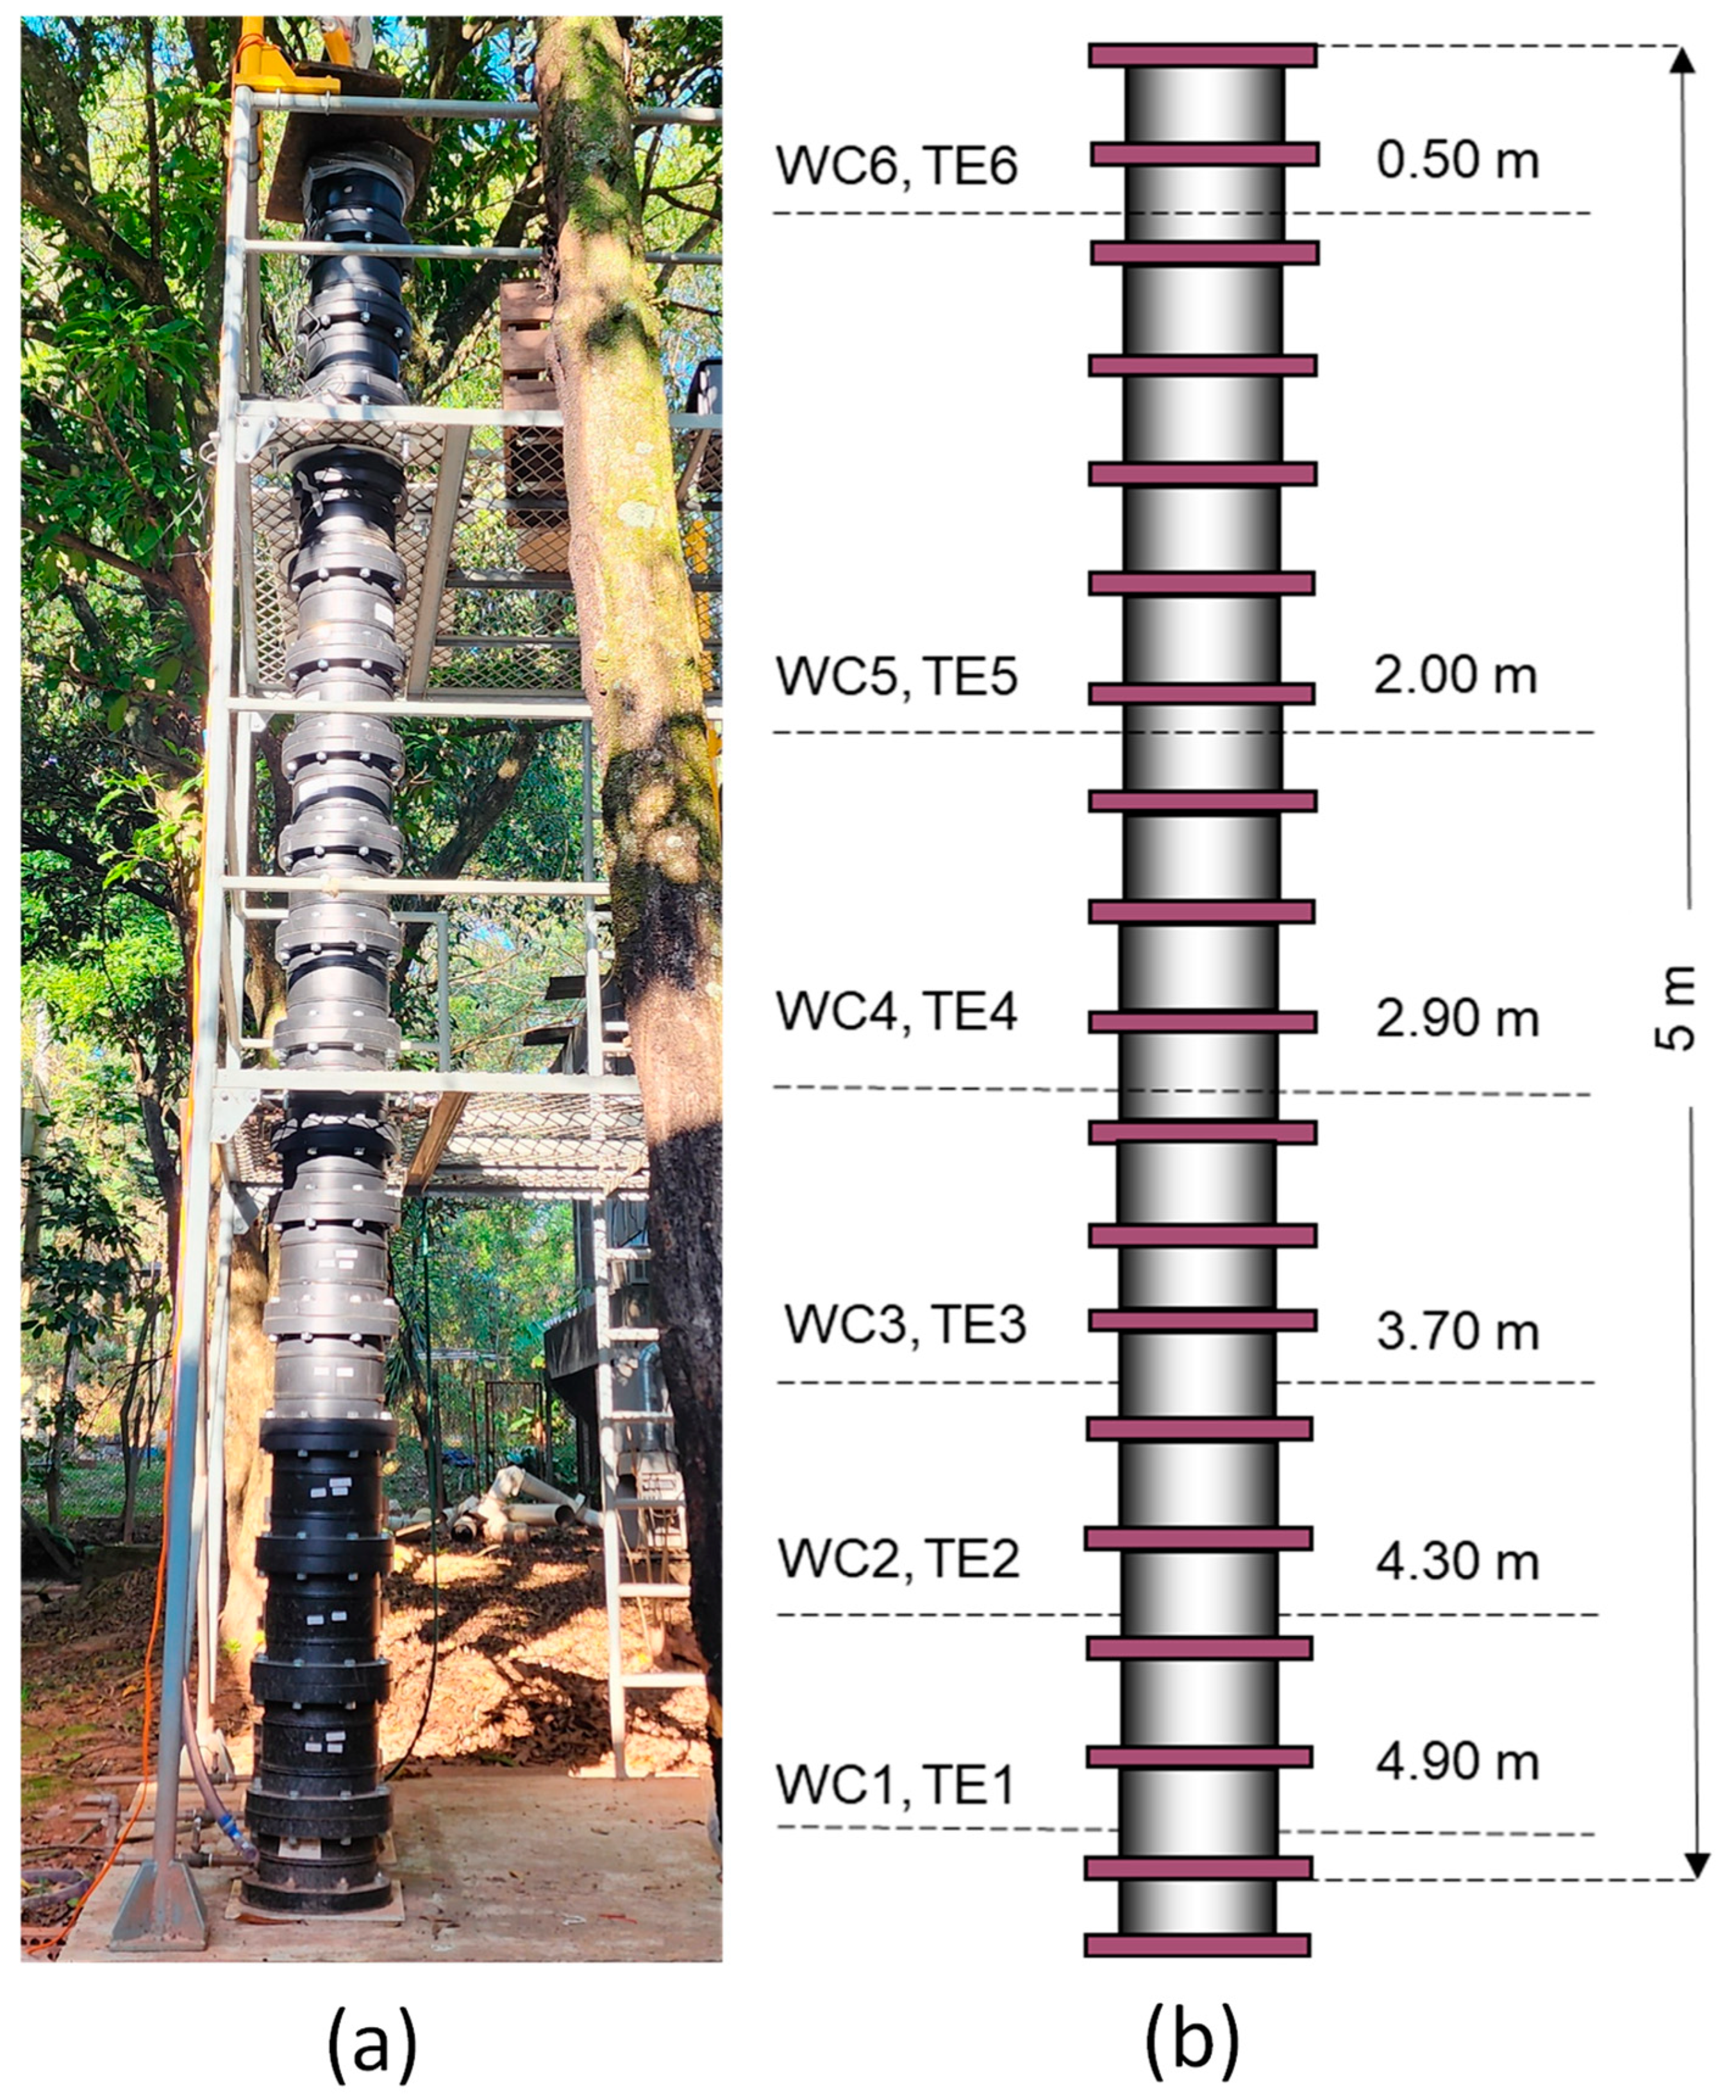
4.2. Column Assembly

To connect the segments, a rubber ring was used to seal them and prevent leakage, and bolts with nuts were employed. The material for the segments was PEAD. The segments were produced with a diameter of 25 cm and in two heights: 30 cm and 20 cm, as shown in Figure 7.
It was necessary to build a steel structure to install the columns. The steel structure was supported and fixed on a concrete slab. The first segment of the column was the drainage system, which consisted of gravel and medium sand. Figure 8 shows the drain preparation, where one can observe the valve that controls the water outlet.
The segments following the drain were compacted according to the characteristics of the material. The main objective was to simulate the field conditions. Water content sensors and suction sensors were installed in some of the segments, as described in detail below.

4.3. Material Preparation and Compaction

Considering the required volume of material to assemble the column, it was necessary to prepare the material for each individual segment. The material was prepared at the optimal water content of the standard Proctor test. The tailings required the addition of water to reach the water content that was used. The material was homogenized using a mortar mixer. After the mixing process had been completed, the material was placed in plastic bags for equilibration for at least 24 h. After this period, the material was divided into six parts for six layers of compaction for each segment. The amount of material per segment was calculated to achieve the maximal dry density specified by the standard Proctor test, which is the target density for the field. Figure 9a illustrates the compaction procedure, and Figure 9b presents the column with six compacted segments. The tailings were compacted with an average water content of 11.11% and a degree of saturation of 52%.

4.4. Sensors and Installation
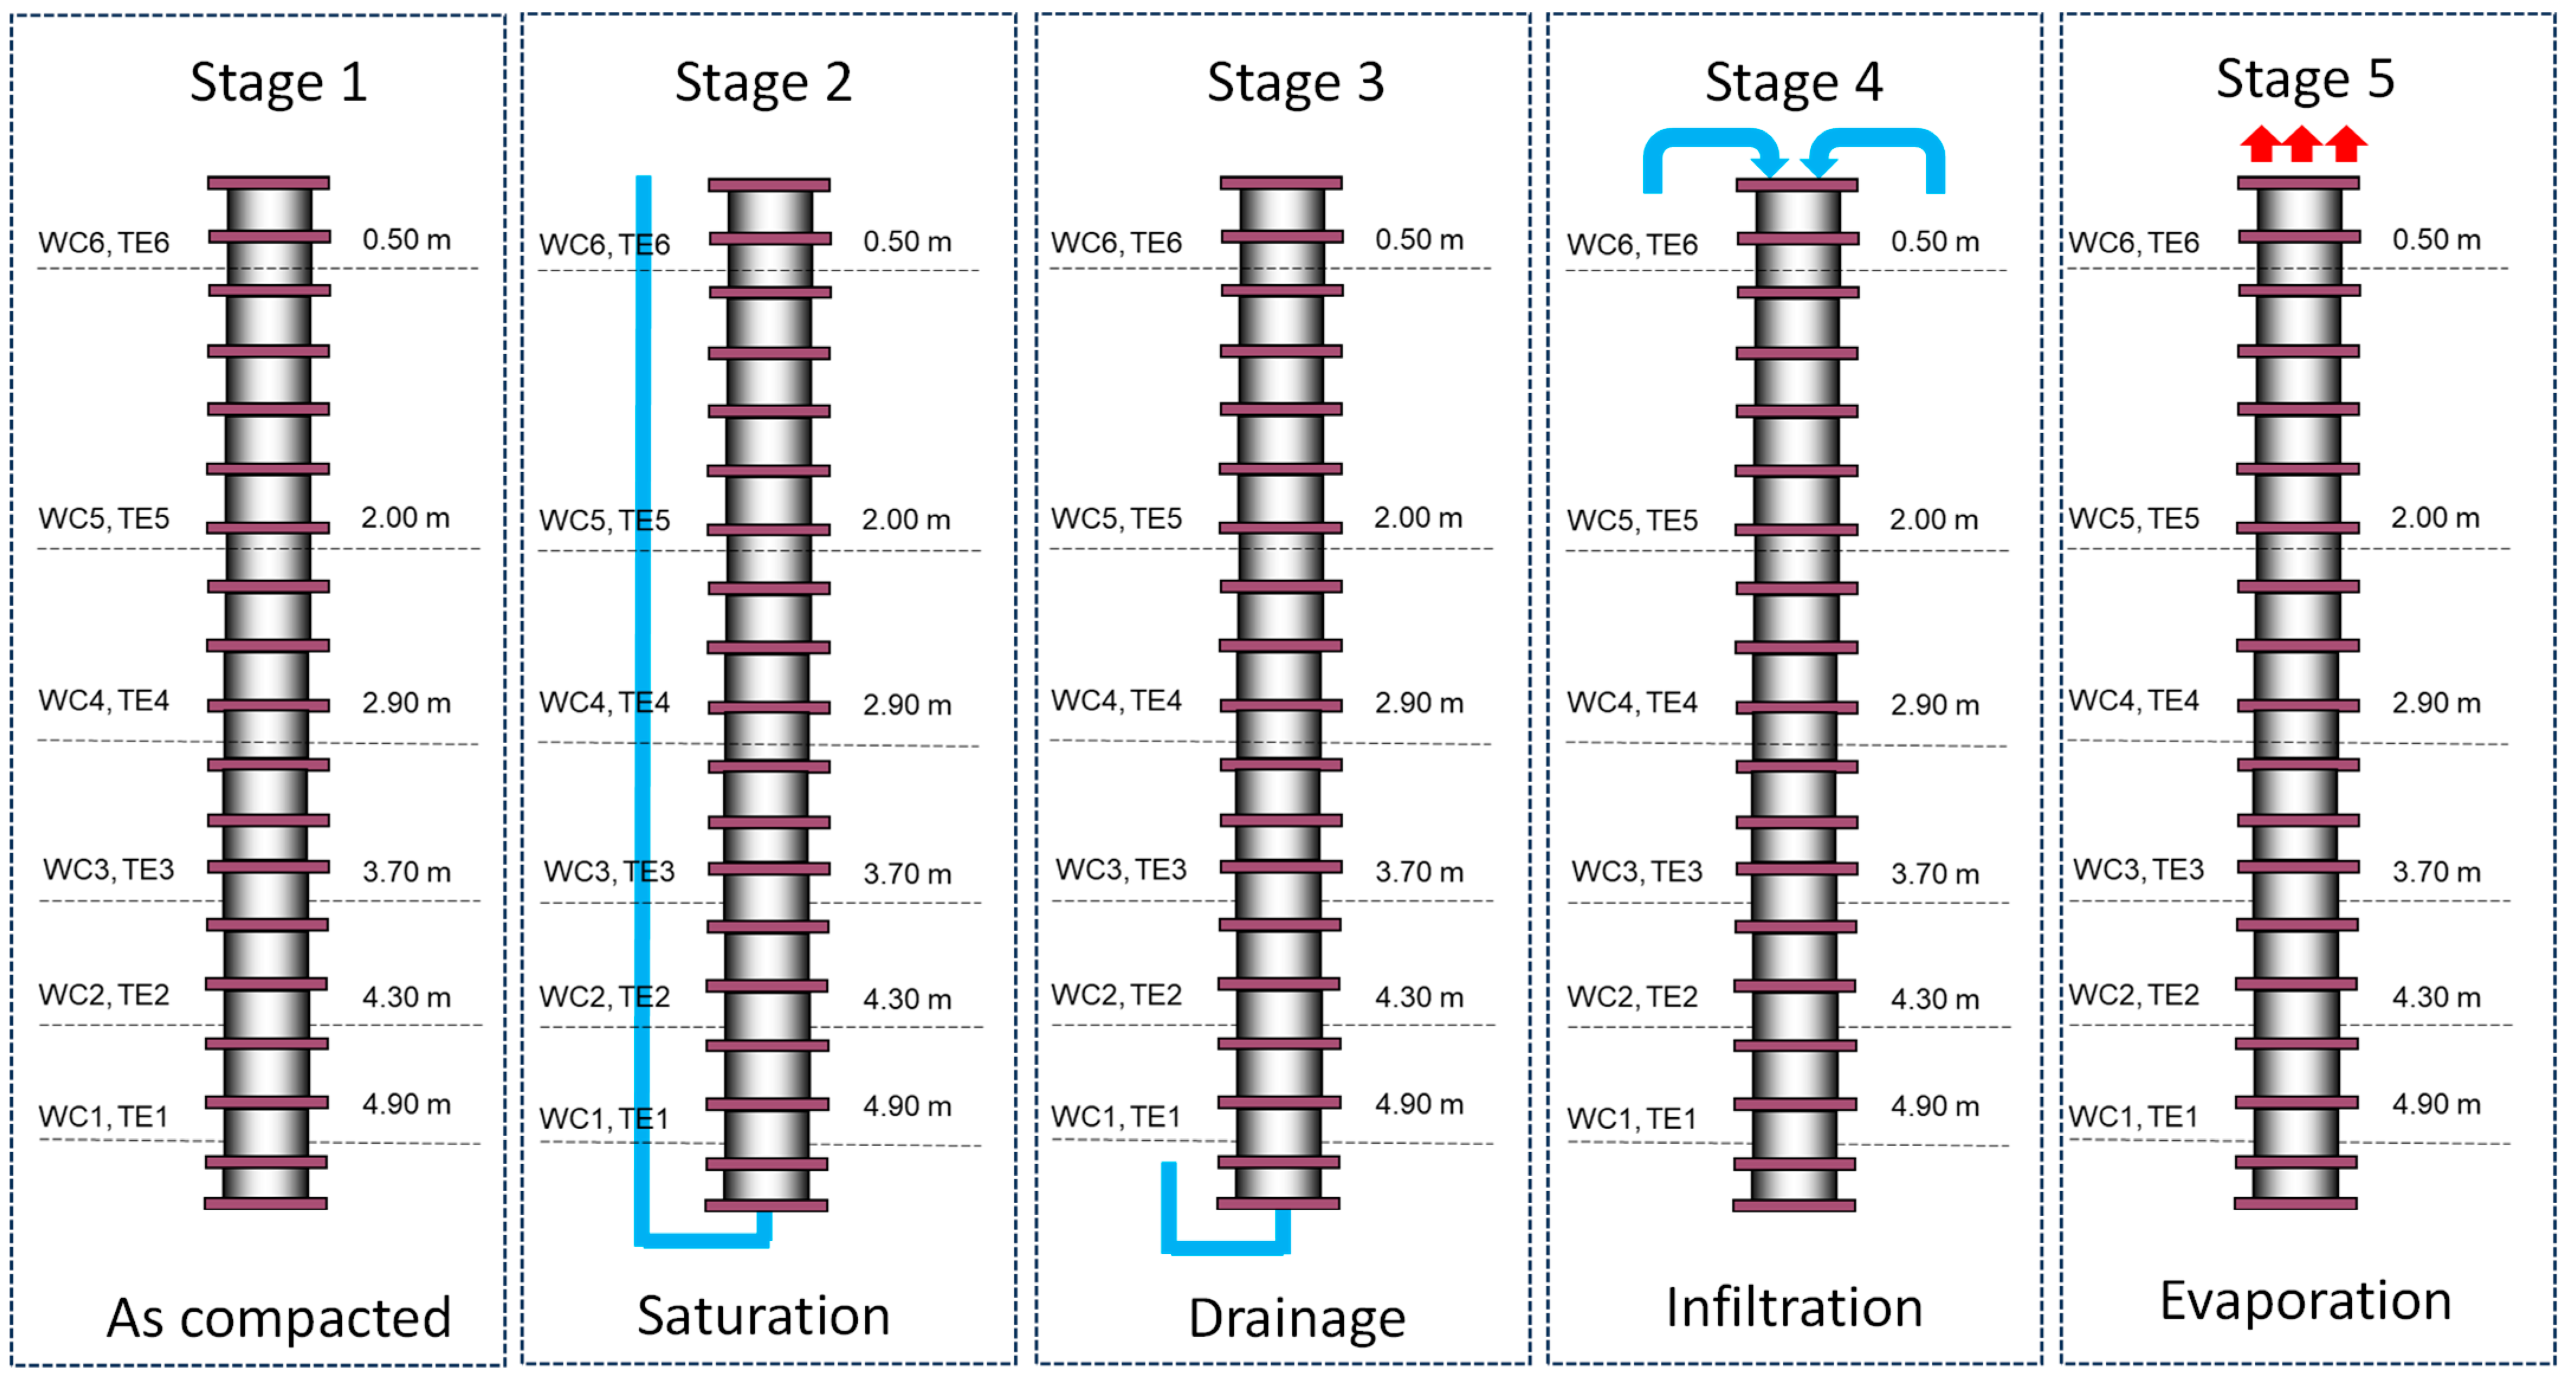
In the columns in this paper, two types of sensors were used: Teros 12 (for the water content) and Teros 21 (for the suction). Considering the operating principle of the Teros 12 sensor and characteristics of the material, a specific calibration for the tailings was applied [24]. Equation (3) was adopted to obtain the volumetric water content.
θ = 0.037 × R A W 75.354
where RAW denotes the raw data readings provided by the sensors.
Similar to all sensors designed to measure the volumetric water content, Teros 12 requires very careful installation. Significant variations in contact between rods and soil can compromise the measurement. In the present study, where the material was compacted over the sensor, this aspect was less relevant.
The Teros 21 sensor is composed of two ceramics with a designed pore distribution to cover a range of possible water content values, which can be inferred through the measured dielectric constant of the ceramic. When installed, the sensor (its porous ceramic) reaches equilibrium with the surrounding material, and suction is inferred through calibration (the SWRC of the ceramic). In this type of sensor, installation is not critical, and the sensor can be simply buried in the material to be measured. For Teros 21, there is no material influence, although there may be effects associated with the water characteristics.
Figure 10a shows a photo of a completed column. Figure 10b shows the positions of the sensors to measure the water content (WC) and suction (TE), which were installed along the column.
The sensors were installed as close to the centre of the segments as possible and on opposite sides. The wiring was adjusted to run through the centre of the column to the top. All sensors had a data logger to record the data at specific time intervals.
The temperature measurements revealed a variation of approximately 2 °C between the top and the base during the compaction and saturation phases. After drainage, the temperature variation between the top and the base was approximately 1 °C. Throughout the entire experiment, the biweekly average variation was 7 °C.
An important aspect of the analysis of the obtained data is the response time or time lag of the sensors. The time lag of a sensor is the delay between the occurrence of an event (e.g., a change in water content or suction) and the response of the sensor to that change. In other words, it is the time for a sensor to detect the change at the point where the sensor is installed. This delay depends on factors associated with the sensor design and operating principle. The response time of a sensor can determine whether it can be used for safety alerts. Generally, water content sensors such as Teros 12 can measure changes as soon as they occur and only depend on the measurement capacity of the data acquisition system. Meanwhile, Teros 21 requires the ceramic to reach equilibrium with the surrounding material before accurately measuring the suction, so there is a time lag.
With this understanding, the water content sensor is expected to respond before the suction sensor, which results in a time lag between the two types of sensors. Assuming that the water content sensor instantaneously responds, it is relatively straightforward to identify the time lag of the suction sensor in the same region. However, measuring this response time (time lag) depends on the sensitivity of the sensors to the imposed changes. Therefore, the obtained time lag is approximate.
In anticipation of one of the analyses performed with the data from the column, Figure 11 presents the measured volumetric water content and suction during specific intervals of four events (not necessarily the end or the beginning of the events): the saturation process (Figure 11a), drainage process (Figure 11b), infiltration process (Figure 11c), and evaporation process (Figure 11d). In the graphs, the response time of the suction sensor to the events was not entirely clear, although some events suggest an immediate response. The values in the data sheets indicate that the response time of the suction sensor was approximately 5 min. This value was used to correct the suction values over time. Immediately after the installation of the moisture sensor, the soil/sensor system may take more than an hour to reach equilibrium. After this period, the responses follow the estimated response time of 5 min. The sensor response depends on the shape of the SWRC. Sections of the curve can be more or less sensitive to different variables.

5. Experiments

To understand the processes that the columns experienced, five stages were specified: Stage 1, immediately after compaction (as compacted); Stage 2, column saturation; Stage 3, drainage after saturation; Stage 4, induced infiltration; Stage 5, evaporation. Figure 12 shows the various stages.
The saturation process (Stage 2) was conducted by introducing water through the base of the column. The water level was monitored by an external hose until the water emerged at the top of the column. The drainage process was executed by opening the valve at the base of the column while maintaining the level at the top of the filter segment. The drained volume was systematically measured by weighing the drained water at the base. The infiltration process was performed on two occasions, interspersed with evaporation.
The infiltration induced through the top of the column was conducted as follows:
Infiltration 1—1.8 l was manually added every 24 h for one hour per day over 7 days. This value corresponds to a low-intensity rainfall of 0.075 mm/h.
Infiltration 2—12.6 l was added over 8 h for one day, which corresponds to a rainfall intensity of 1.58 mm/h.
The evaporation was induced using a closed PVC box at the top of the column with a continuously operating exhaust fan. This system induced a total evaporation of 1.0–1.4 mm/day.

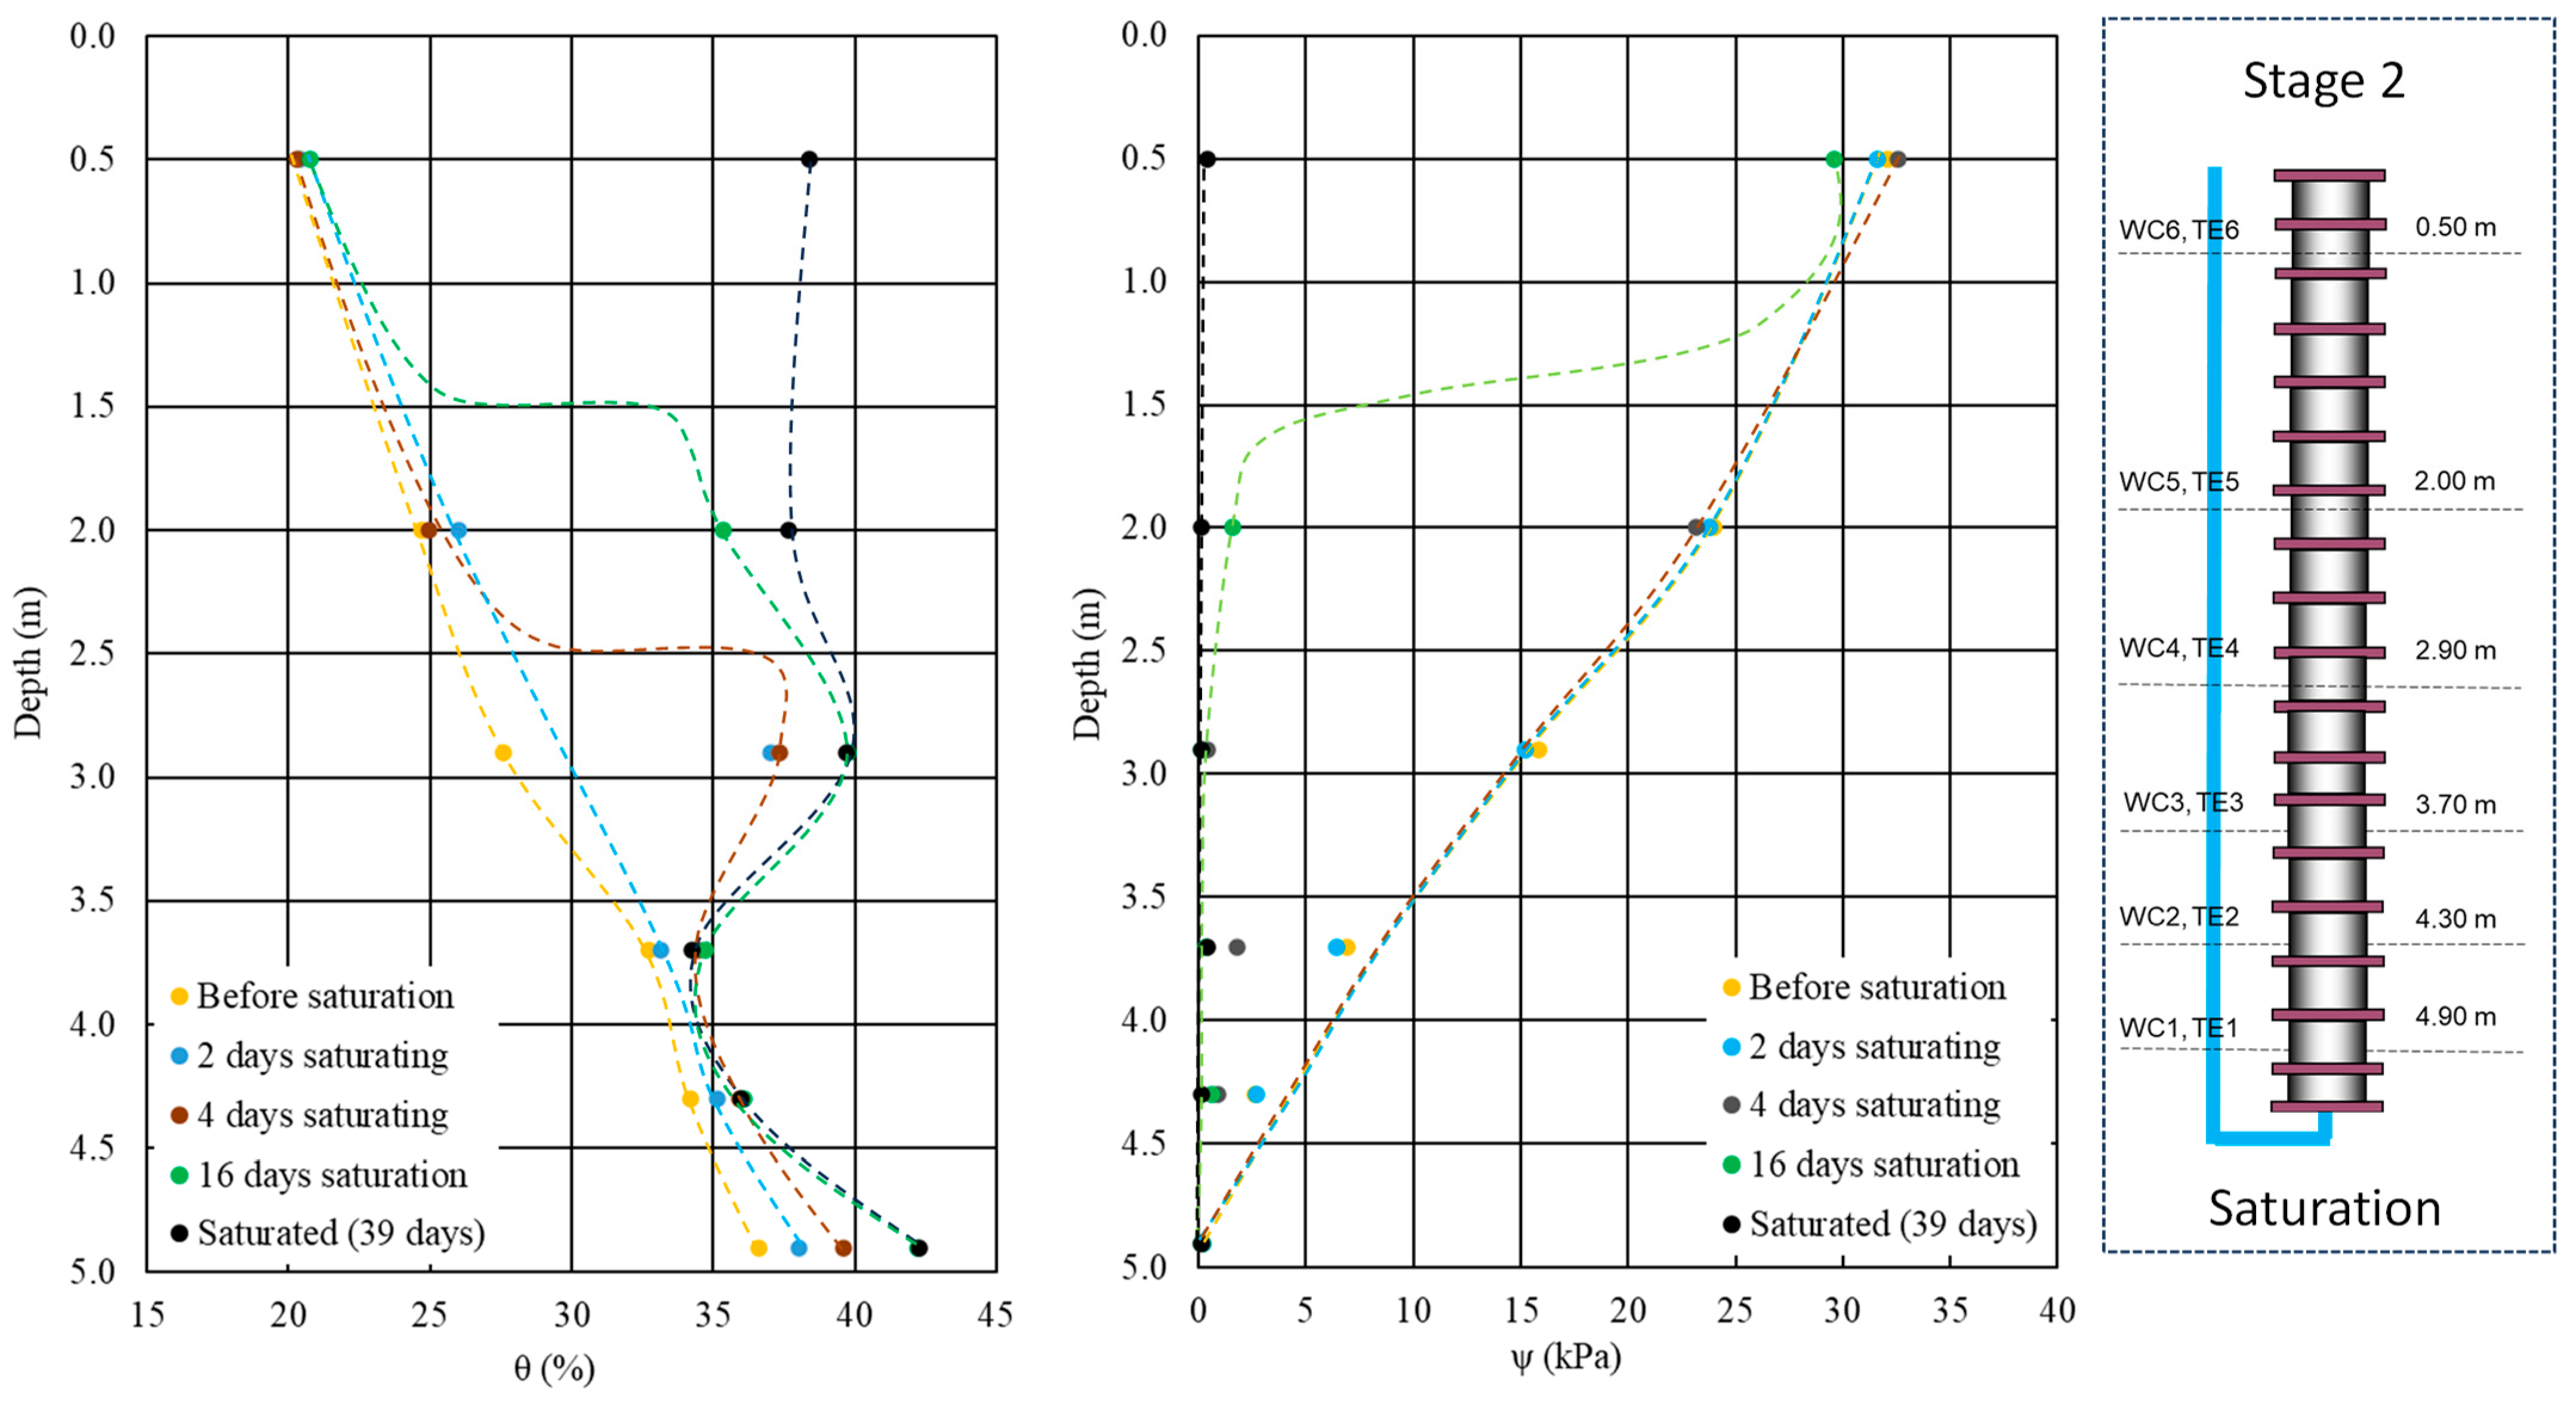
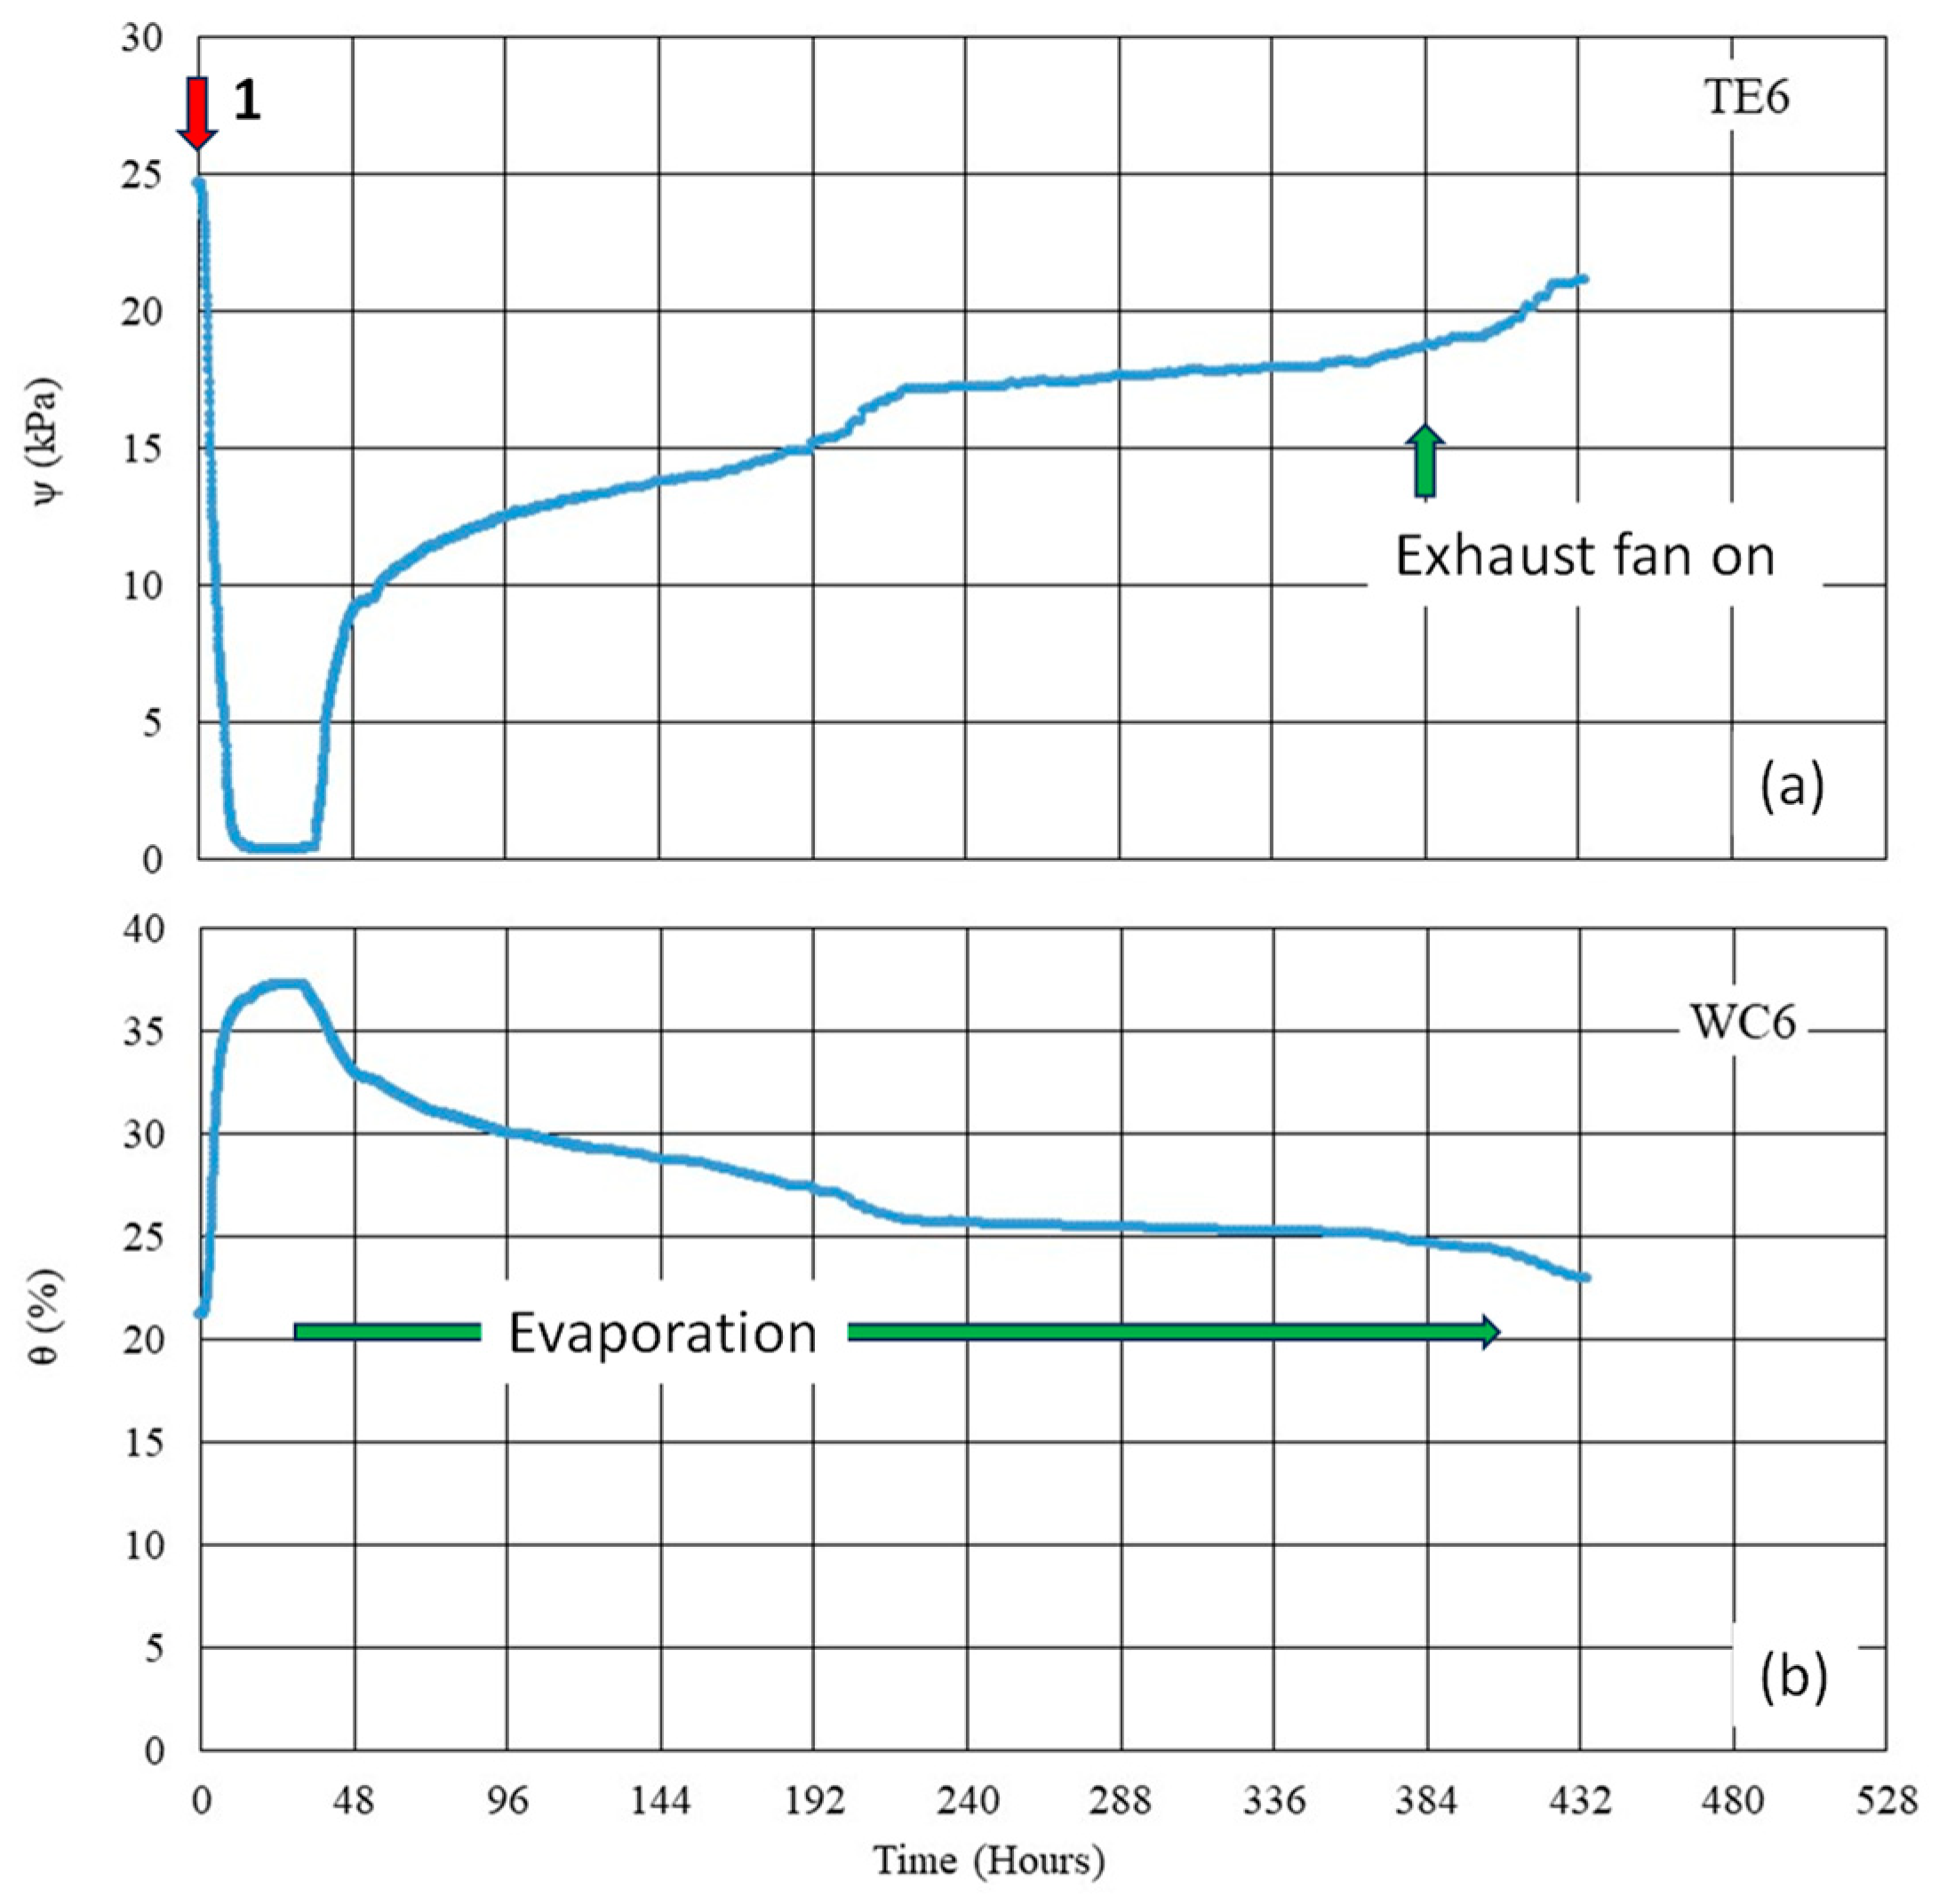
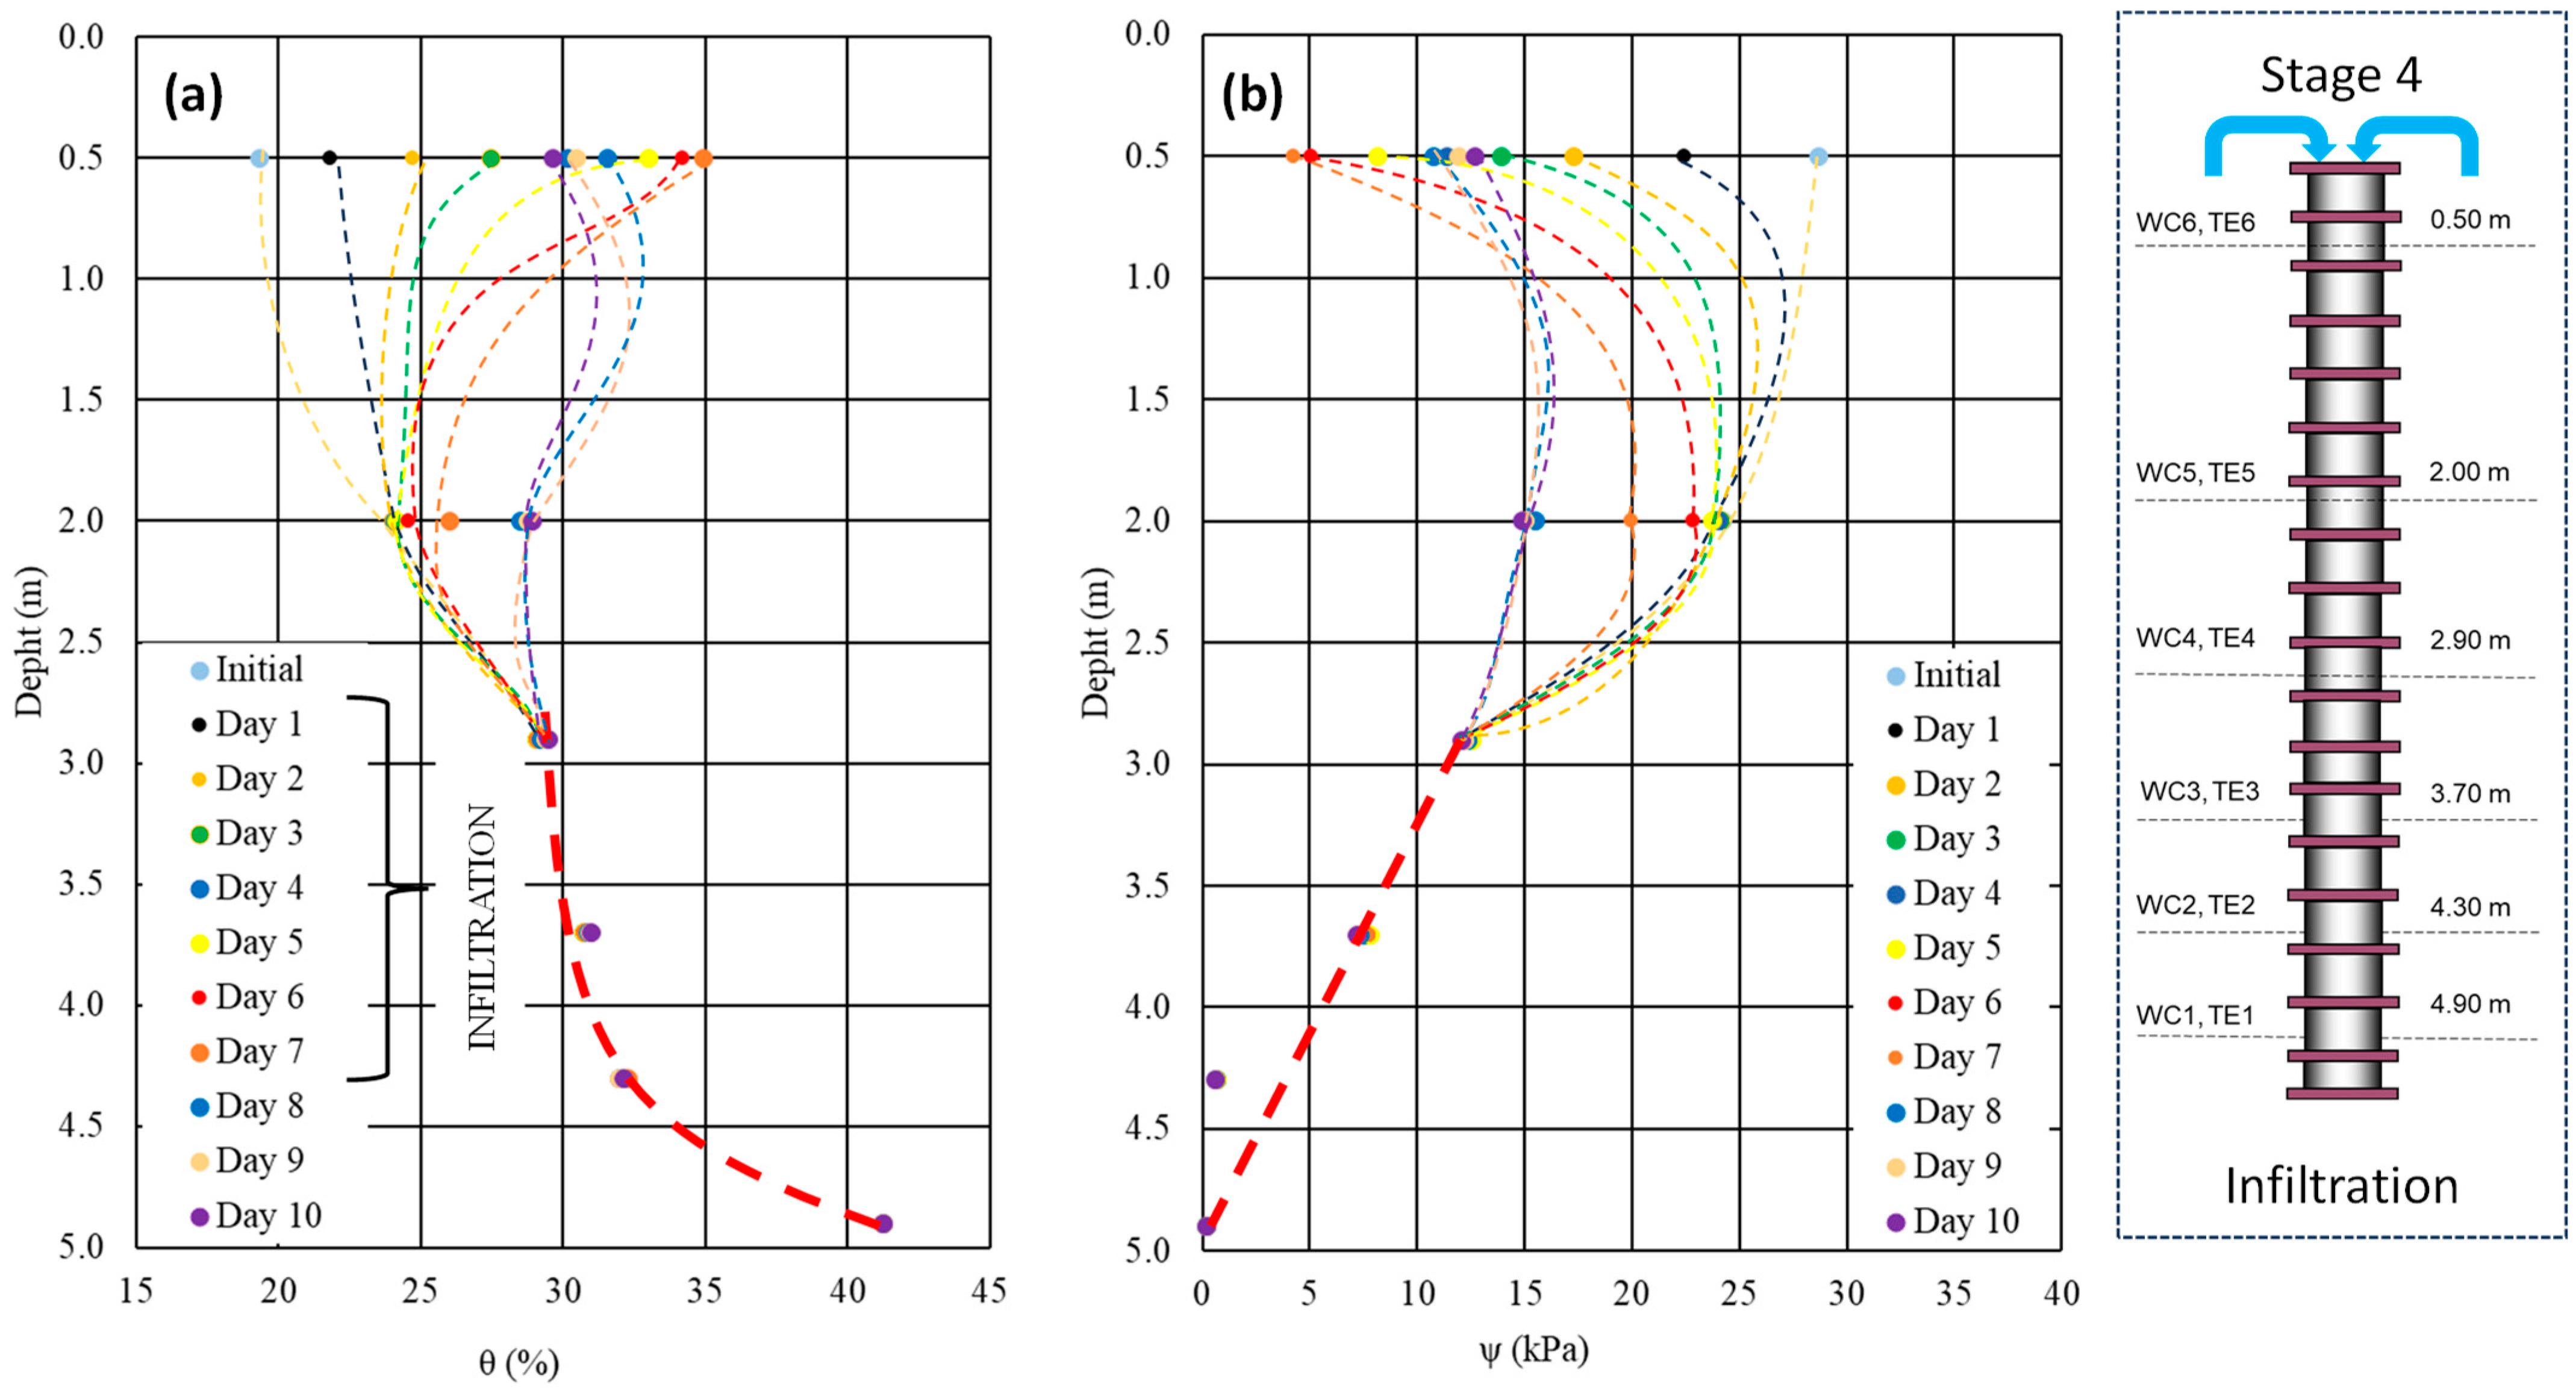
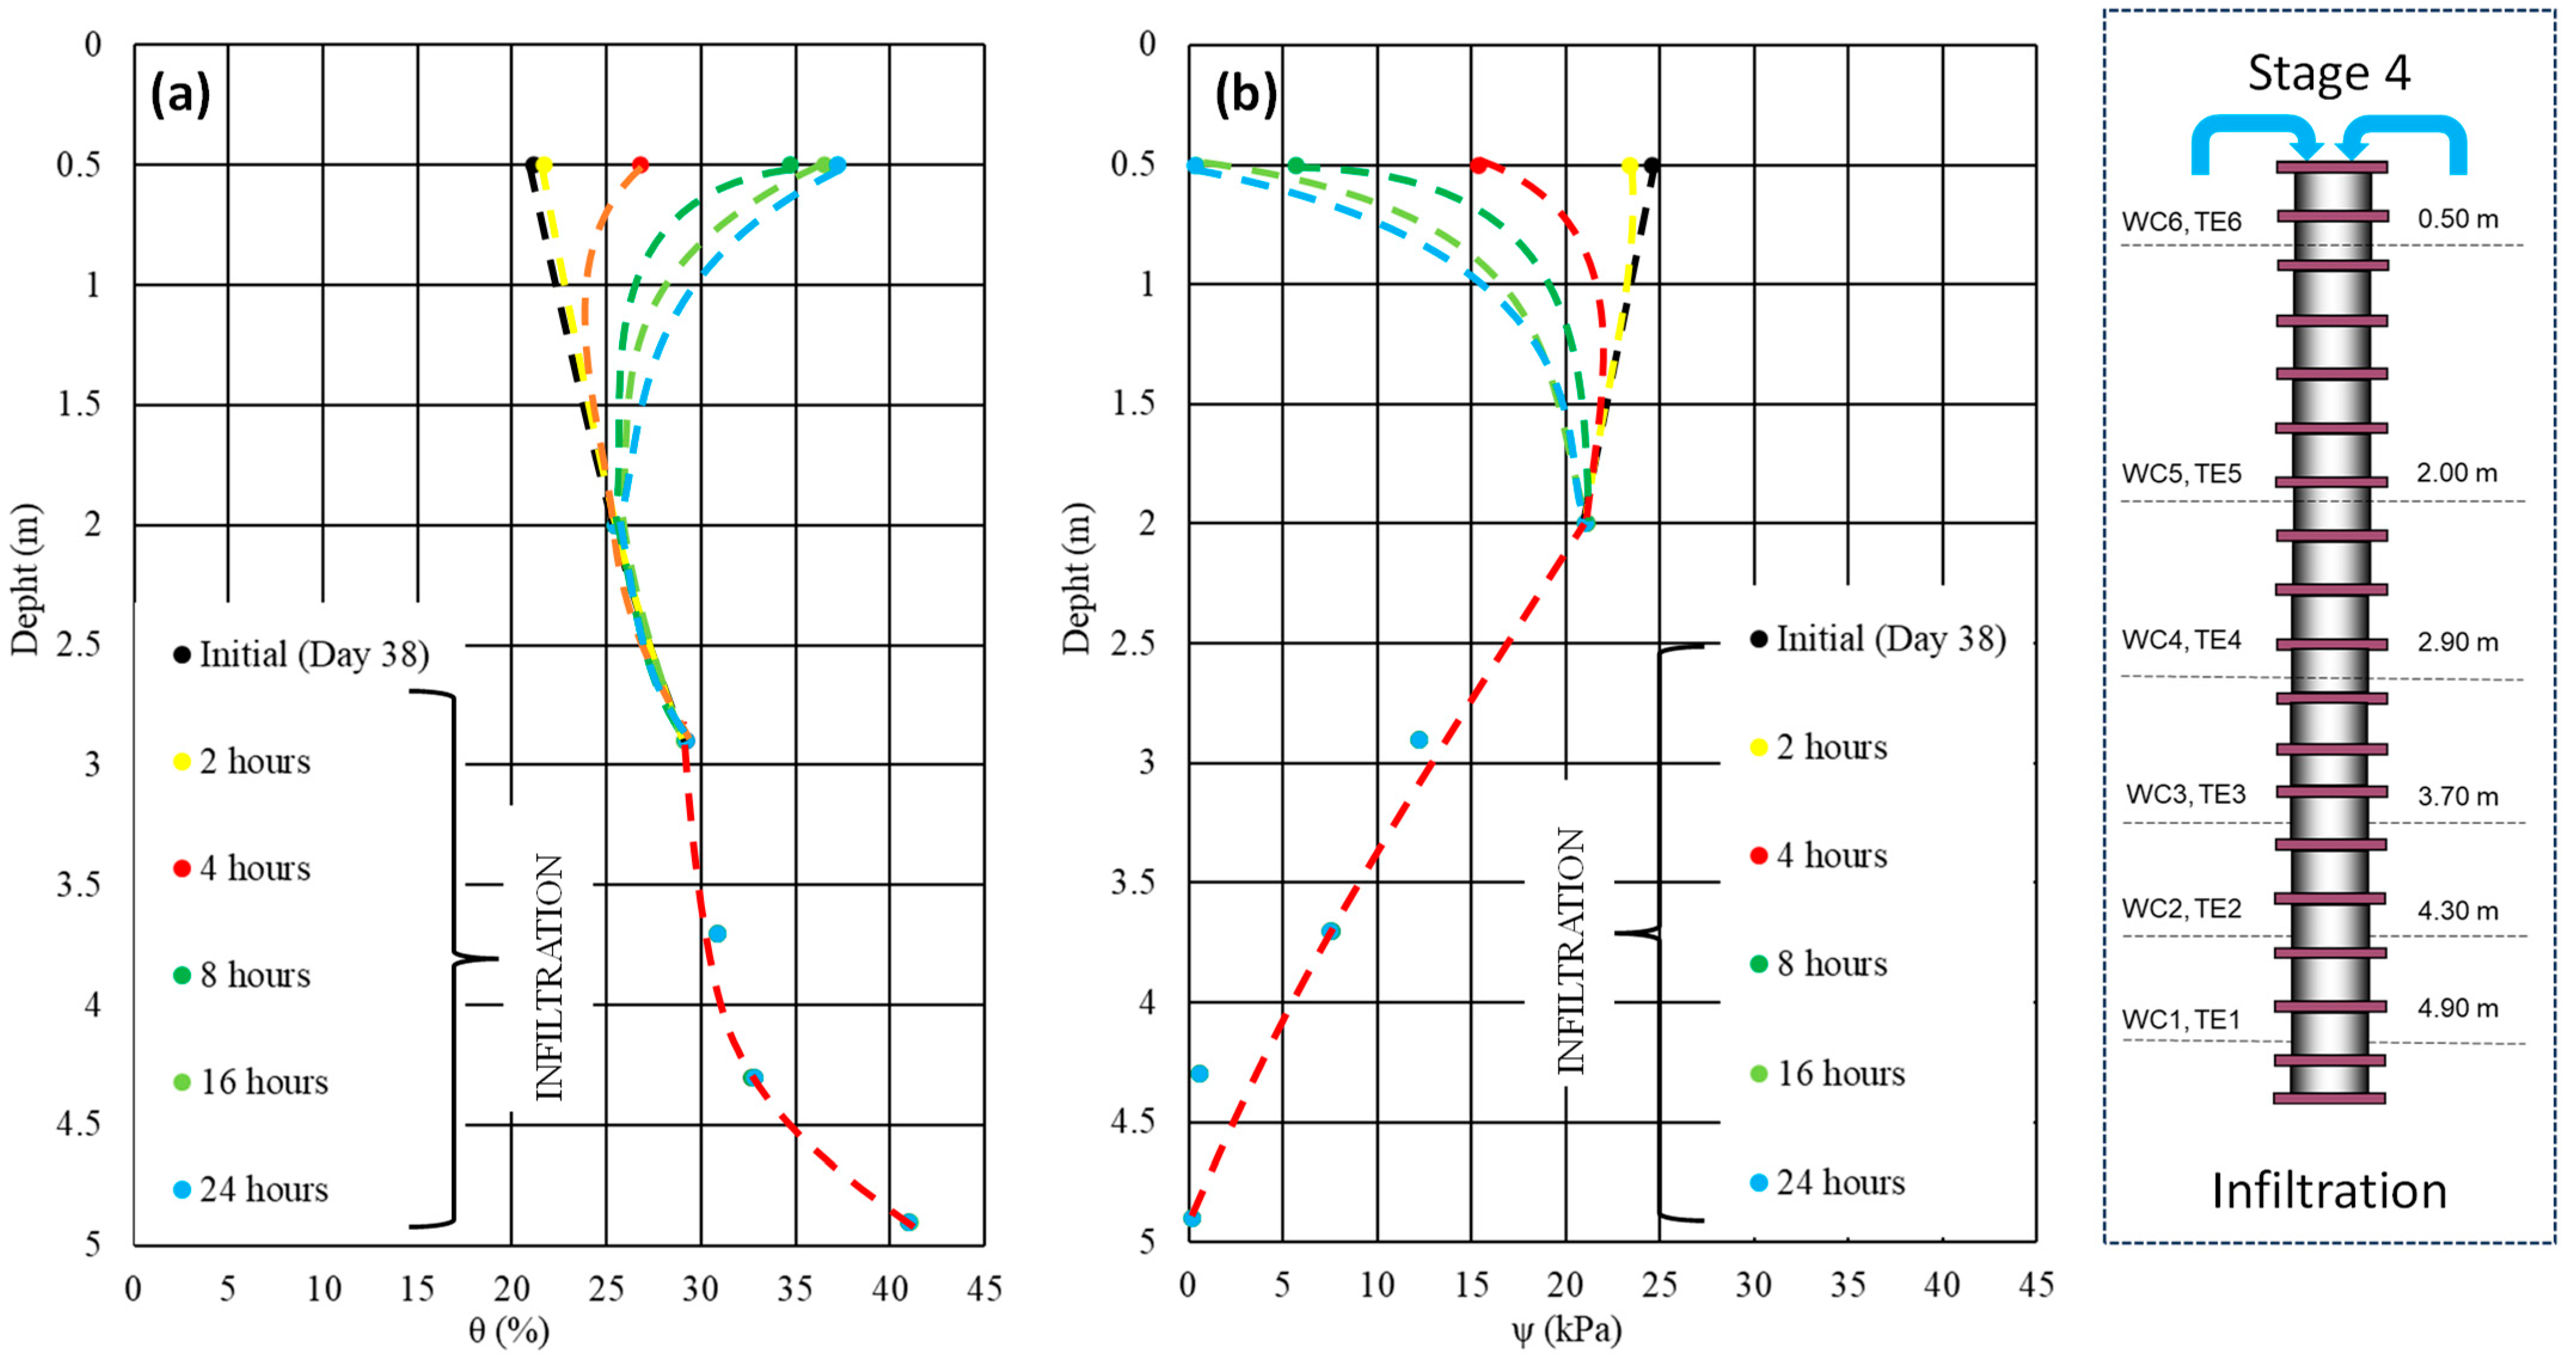
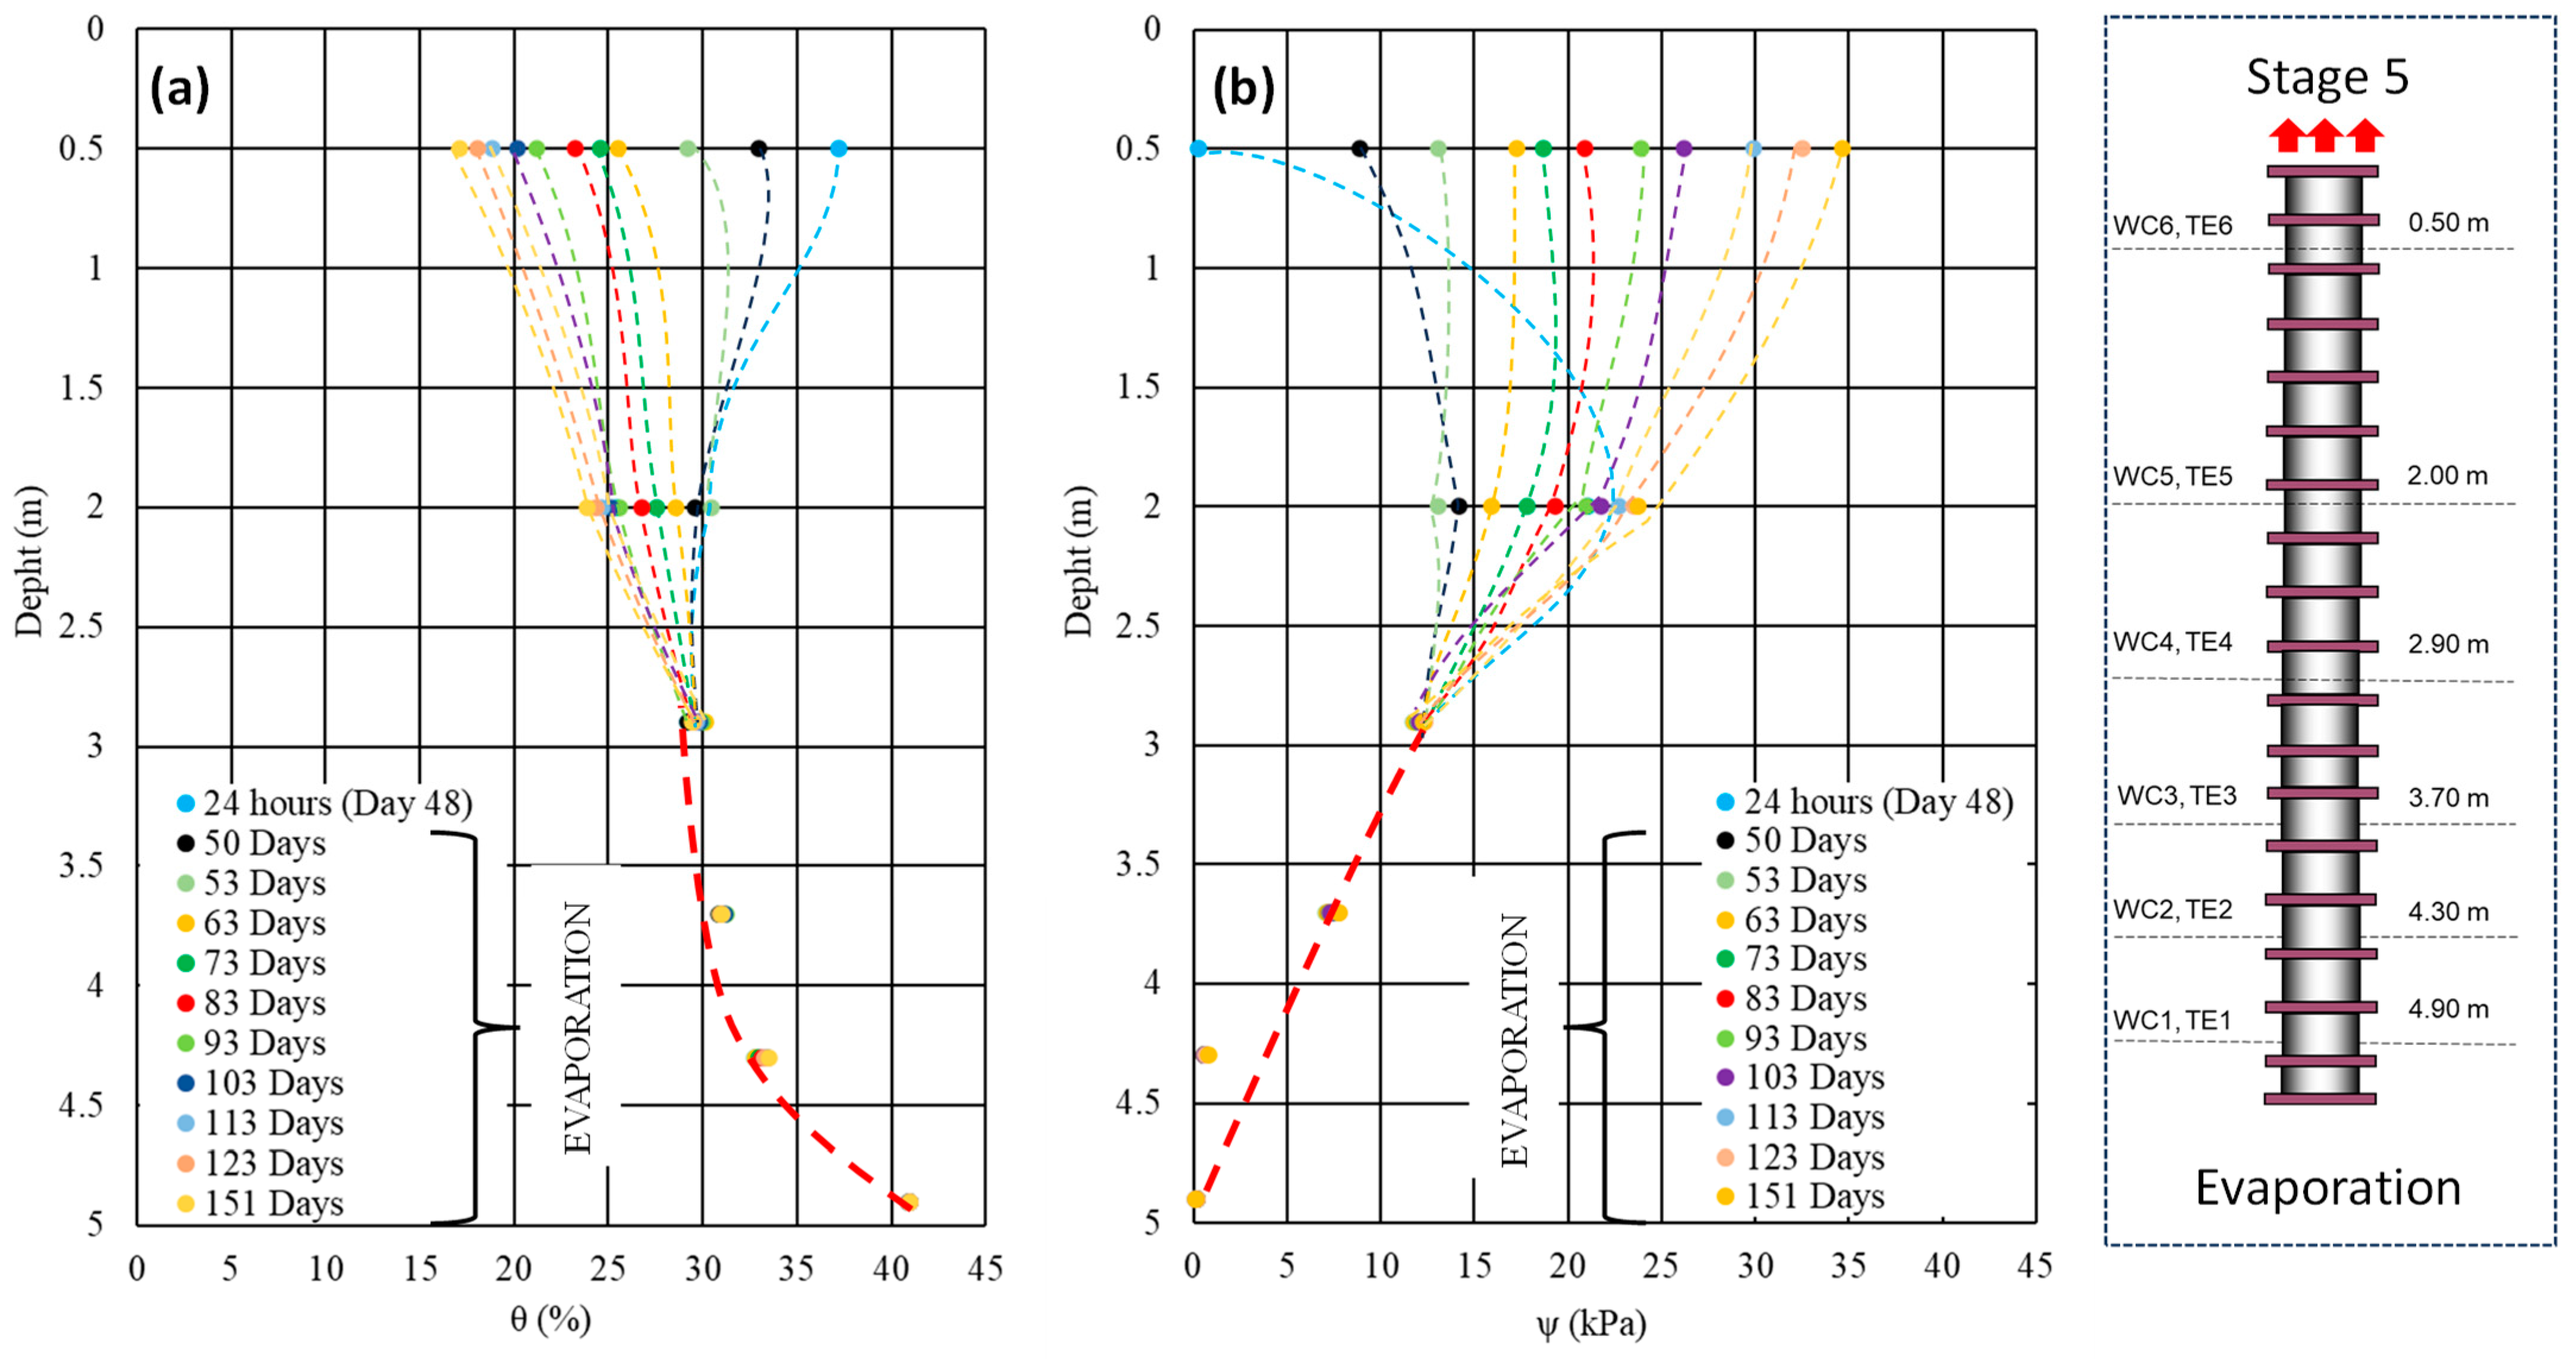
5.1. Profiles at Different Stages

Each stage of the column experiments is presented in the form of profiles of volumetric water content and suction. The reference position in the column is in terms of depth, i.e., the top of the column is the zero reference. Figure 13 shows the profile obtained immediately after the completion of the column (after installation), end of construction, and before saturation. The volumetric water content at the compaction of the material was 24% (w = 11.9%).
Ten days after the column assembly, the water content profile tended to increase with depth, but the point at a depth of 2.9 m had a lower value than the general trend. This deviation was not observed in terms of suction. Considering the soil water retention curve (SWRC), the values are reasonably consistent with the curve.
Figure 14 shows the profile immediately before the saturation process began, the profiles at 2, 4, and 16 days, and the final saturation profile (39 days). The saturated volumetric water content for the compacted material was 42% (porosity of 0.42). At a depth of 2.9 m, θ remained lower than expected. A leak immediately below this level was observed. Leakage occurred through the wires of the electro-resistivity measurement system, which was installed up to this level. This leakage might have interfered with the saturation process, but after drainage and leakage repair, there was no longer a reason for further influence. The suction profile indicates a value very close to zero. However, this low level of suction (<10 kPa) is not accurate for the sensor.

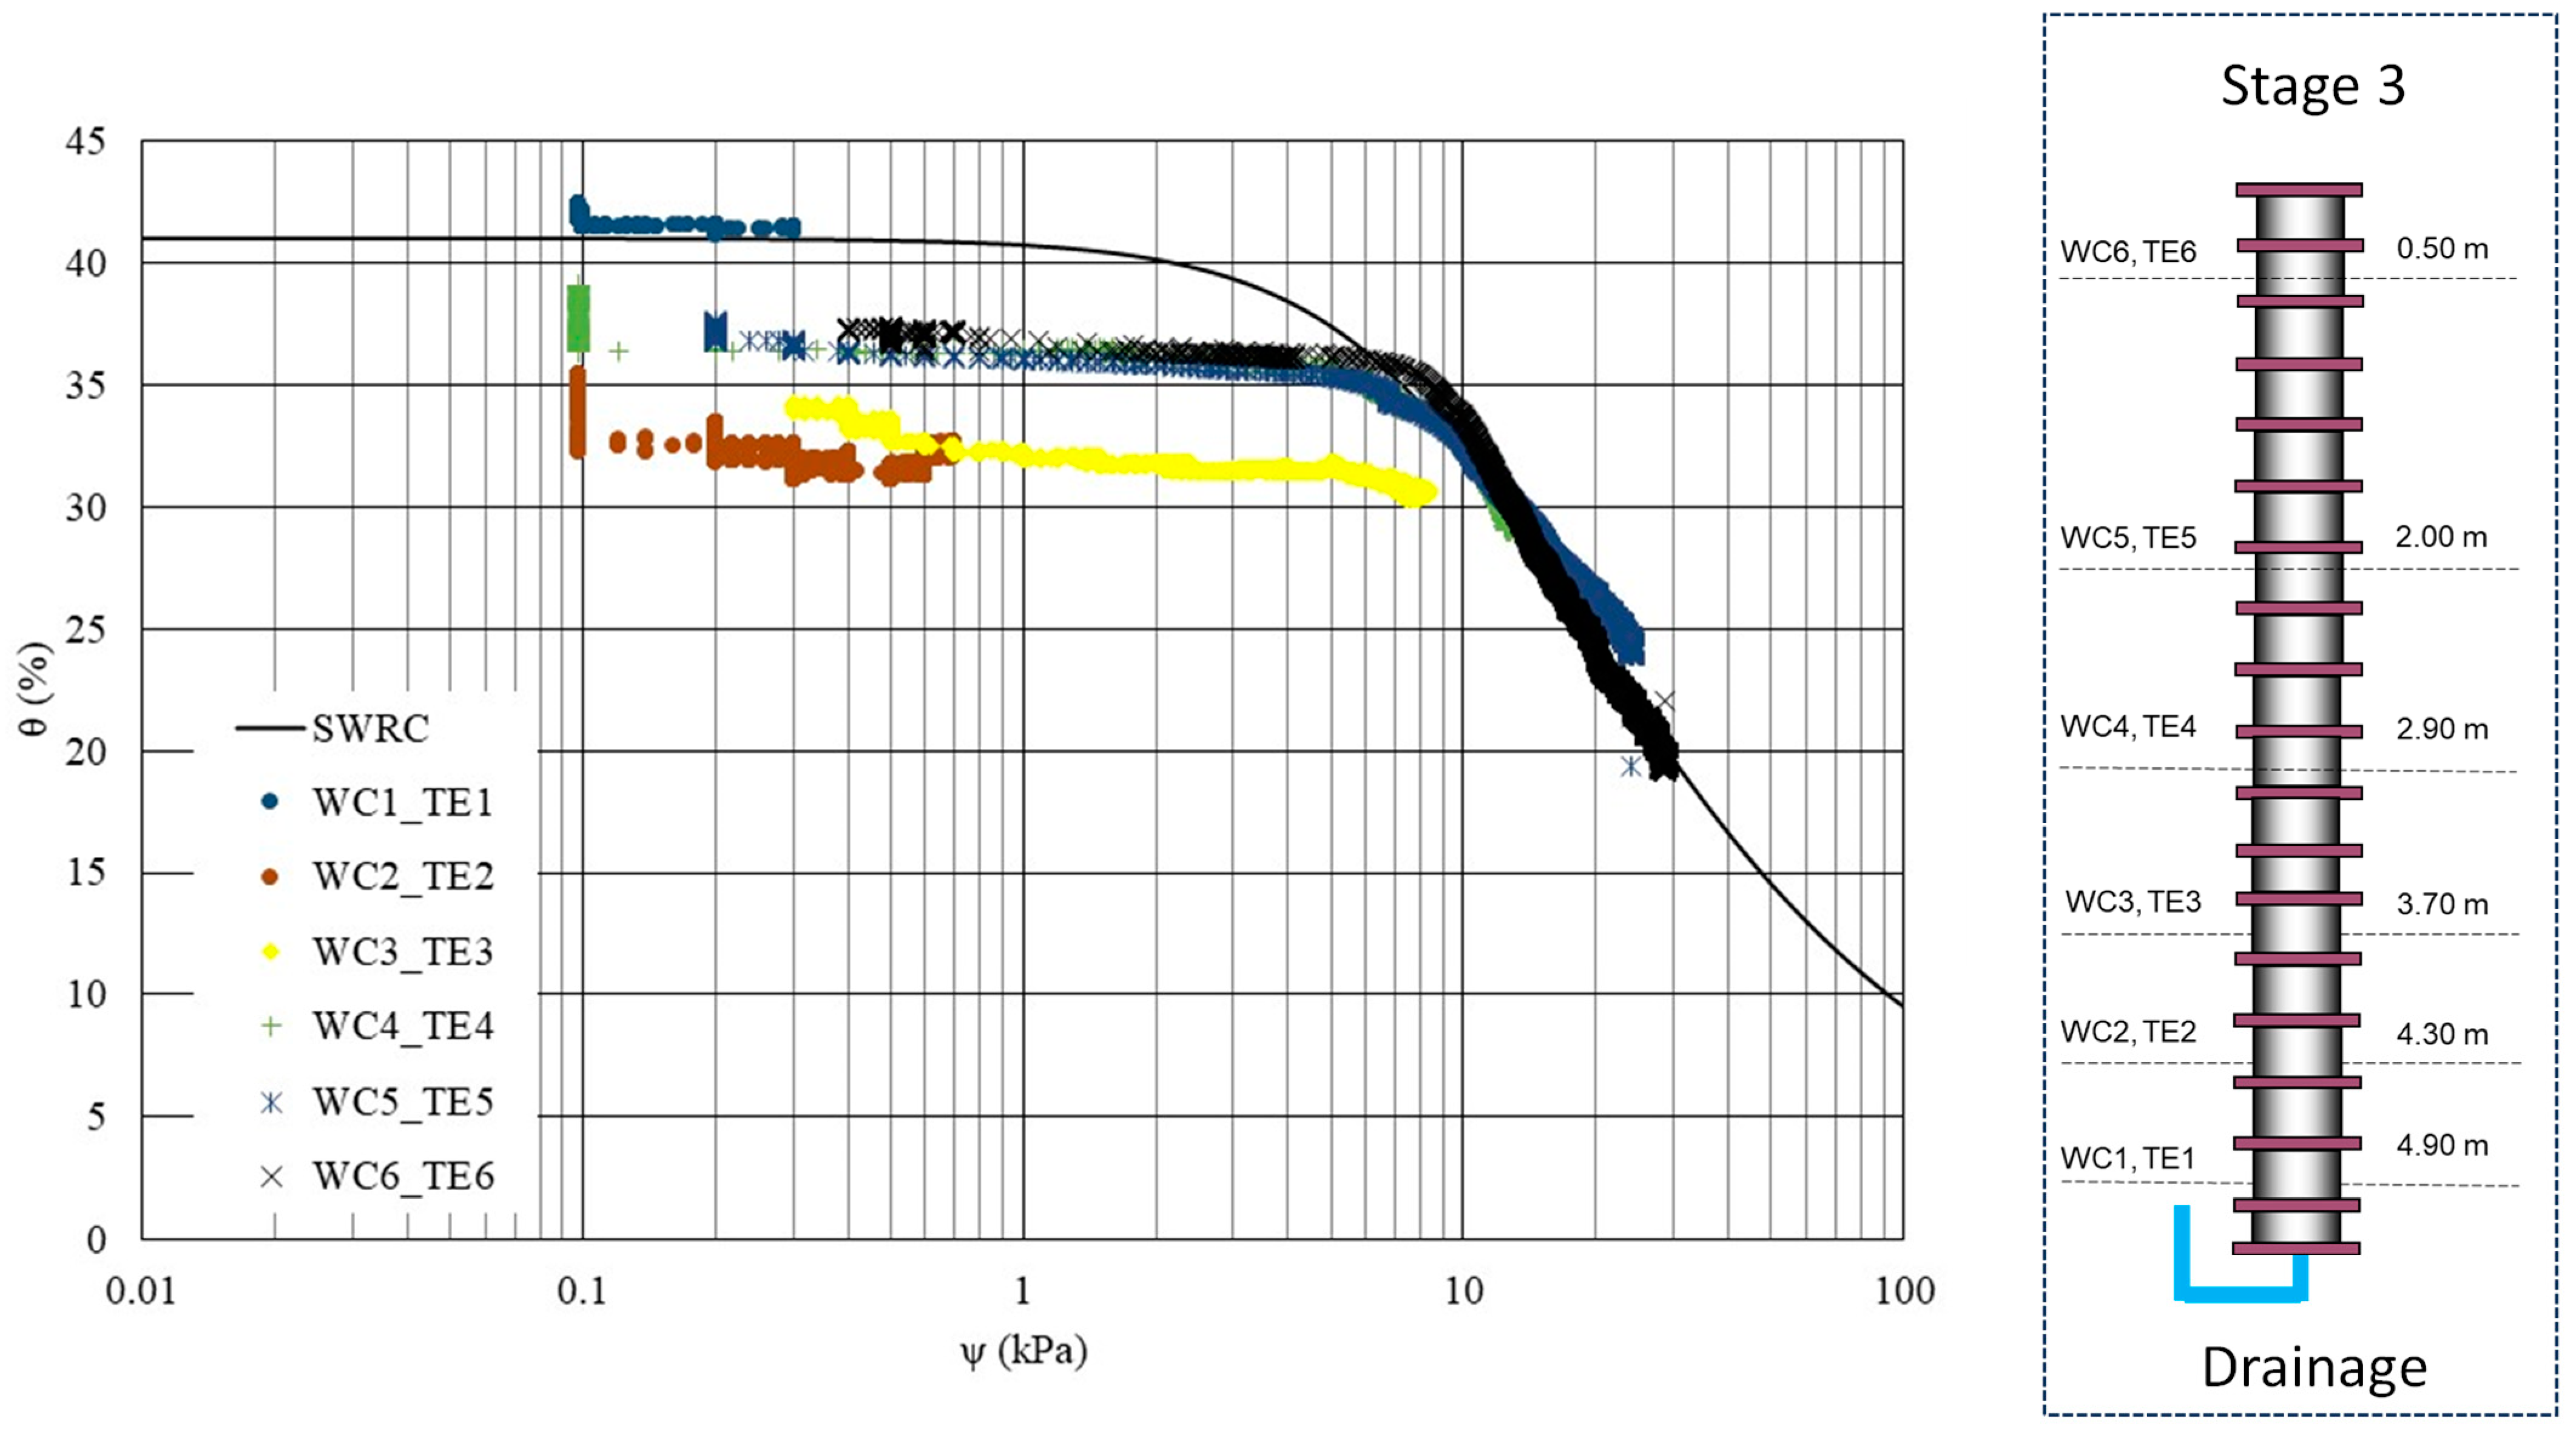
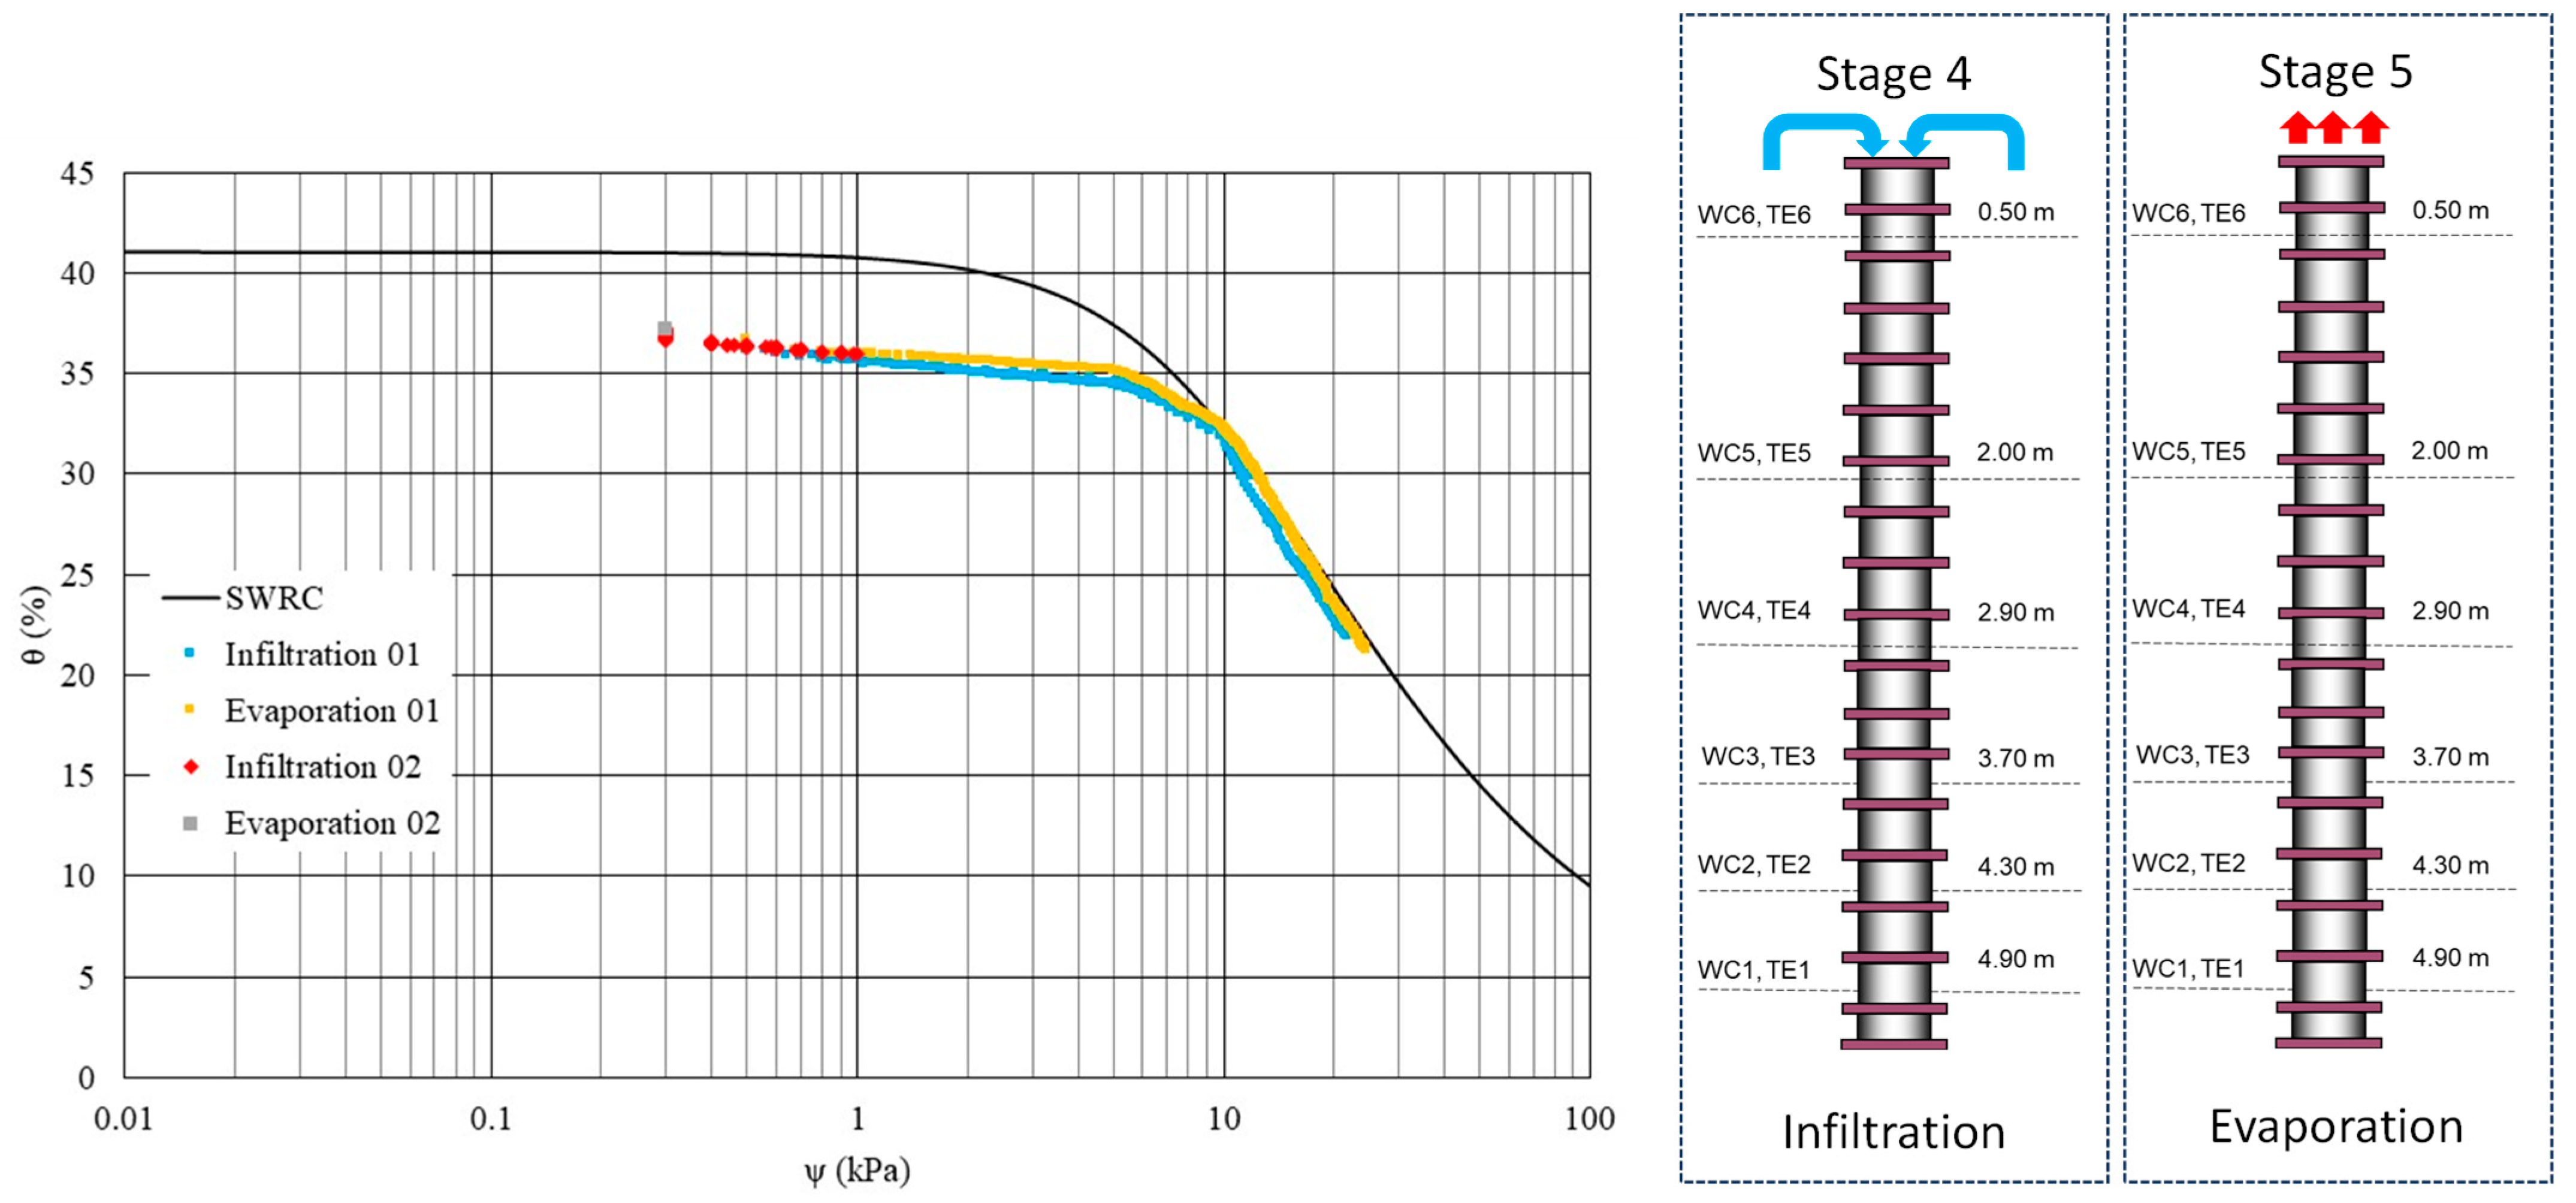
5.2. Results After Drainage

The readings of Stage 3 (drainage) are shown in Figure 15. This stage was the longest with 190 days of free drainage. The readings were expected to show a decrease in water content values and an increase in suction over time. Figure 15 shows the changes in volumetric water content and suction over time at the beginning of this process. As expected, the volumetric water content at the top of the column decreased over time, which demonstrates a vertical downward flow of water. In accordance with the volumetric water content, the suction increased over time. However, even after a long period of drainage, equilibrium was not achieved.
To evaluate the active zone and observe the water response to infiltration days or dry periods, a simulation was conducted with constant infiltration at the surface of the column followed by a period of evaporation from the top of the column.
To illustrate the effects of the initial infiltration and subsequent evaporation, Figure 16 presents the measured suction and volumetric water content over time for the sensor closest to the top of the column. The numbers in Figure 16 are the days of water inlets. The first cycle of water application increased the water content and correspondingly reduced the suction. Within one day, the suction tended to recover due to drainage and without induced evaporation (the top of the column remained covered after the water application). The decrease in suction decreased with subsequent cycles until the sixth cycle when a greater decrease in suction and a more significant recovery of suction were observed. This phenomenon is associated with the retention curve and permeability of the material for that water content.
As soon as the last water application (7) passed through the sensor in Figure 16, the water drained and simultaneously began to interact with the atmosphere, which initiated an evaporation process. Figure 18a shows the moment when the exhaust system was turned on. Apparently, no significant effect of the system was observed, but it prevented an increase in relative humidity in the upper segment of the column.
The second infiltration cycle was performed with the same volume of water but was continuously applied. However, the water accumulation on the surface did not exceed 1 cm, and the saturation front was not allowed to break. The first 2 litres was applied in the first 12 min without the formation of a layer thicker than 1 cm. The water was subsequently added in two 500 mL portions to always maintain a water layer of less than 1 cm in thickness. Eight hours after the process began, 1.1 litres was added, which increased the water accumulation level. After 24 h, a 2.5 cm layer remained. To compare the infiltration processes induced by different water feeding times, Figure 17 presents infiltration cycle 2. The continuous water inlet rapidly increased the water content and quickly decreased the suction at the sensors near the top (0.5 m). This finding indicates that the surface drainage system plays a fundamental role in the infiltration process. The drainage and evaporation that followed the water application had almost identical rates of increase in suction during both infiltration cycles.
Figure 18 presents the suction and water content profiles for the first infiltration cycle. The profile before the infiltration began indicates a water content slightly below 20% and a suction of approximately 28 kPa. One day after the first portion of water had been applied, an increase in water content was observed only at the shallowest sensor. Water was detected at the sensor at 0.5 m only on the seventh day. Afterwards, the profile became more vertical, but there were no changes in water content or suction.
Figure 19 shows the profiles associated with the evaporation process. As expected, a decrease in moisture content and an increase in suction were observed, which only affected the sensors at depths of 0.5 m and 2.0 m during the monitored period.
The described second infiltration process is presented in the form of moisture content and suction profiles in Figure 20. Figure 21 shows the data of Day 48, which indicates the number of days after the first infiltration. Since the water was continuously applied in this case, the profiles refer to the number of hours after the infiltration began. Notably, the water took more than 2 h to reach the sensor at the 0.5 m depth.
Based on the data and interpretation, the active zone for induced infiltration and evaporation was 3 m thick.
Part of the infiltrated water drained through the base of the column and was collected and measured throughout all processes. Figure 22 shows the water discharge from the drain following saturation and the induced infiltration. The volume of water drained after saturation was approximately 42 litres. Using a hyperbolic fitting, the final volume to be drained was estimated to be 43.5 litres. The theoretical total volume of water that the material in the column can retain is 103.1 litres, and the value obtained via the water content sensors was 93 litres. Subsequent infiltration (infiltration 1) drained 10.3 litres, and the second infiltration drained 14.9 litres, which indicates that each infiltration introduced 12.6 litres. The total water drained considering only the volume of water that was placed (infiltration stage) was 25.2 litres, which is exactly the amount of water introduced into the column.
To describe the water volume balance of the experiment in the column, it is important to analyse the process at each phase of the experiment, considering the volumes of drained, infiltrated, and retained water in the porous medium over time. After saturation, the water was allowed to drain under the influence of gravity. This drainage process was monitored by sensors and by collecting water at the base of the column. The drainage continued until near-equilibrium was reached, where there was no significant flow of water. Subsequently, infiltration events were induced to simulate the addition of water to the system from the top in a controlled manner, as if they were rainfall.
The volume balance in the system can be expressed as follows:
V i n i t i a l + V i n f i l t r a t i o n = V d r a i n e d + V r e t a i n e d
where V i n i t i a l is the volume of water in the column after saturation, V i n f i l t r a t i o n   is the volume of water added during the two infiltrations, V d r a i n e d   is the volume of water drained from the system, and V r e t a i n e d   is the volume of water that remained in the tailings after the drainage and infiltration processes.
Table 4 presents the values of the volume of water involved in the experiment. The total volume of water in the system, when saturated, can be calculated based on the average porosity of the column or sensor-measured moisture content. The determined values were 103.1 litres and 93.3 litres, respectively. During the drainage process, part of the water was removed from the column by gravity, as illustrated in Figure 22. The amount of water drained by Day 190 was 42 litres. The hyperbolic fitting indicates that the final drained volume was 42 litres, which indicates that the system was very close to equilibrium.
Each infiltration process introduced 12.6 litres of water. Measurements and drained water after infiltration indicated drained volumes of 10.3 litres and 14.7 litres for each infiltration. The total volume drained after infiltration was 23.6 litres.
After the drainage and infiltration processes, a certain amount of water remained in the column due to the water retention capacity of the material. This retained water volume was calculated by the difference of the initial mass, infiltrations, and drained volume. The sum of the initial water volume (using the theoretical value) and the induced infiltration was 118.5 litres. The sum of the total drained volume by Day 190 plus the retained volume was 117.6 litres. The water volume balance indicates that 0.9 litres remained to be drained.
The volume balance reveals that the column experiment has significant potential for inferring important information about water flow and retention and assessing the possibility of saturation in filtered tailing piles.
Based on Nguyen et al. [25], the permeability coefficient as a function of suction was calculated using the volumetric moisture content and suction profiles that were determined during infiltration. Unfortunately, the suction variations were not sufficient to cover a significant range of suctions. The permeability coefficient was 2.5 × 10⁻⁸–1 × 10⁻⁷ m/s for suctions of 19–26 kPa. The permeability coefficient for an average suction of 22 kPa was 2.2 × 10⁻⁷ m/s.

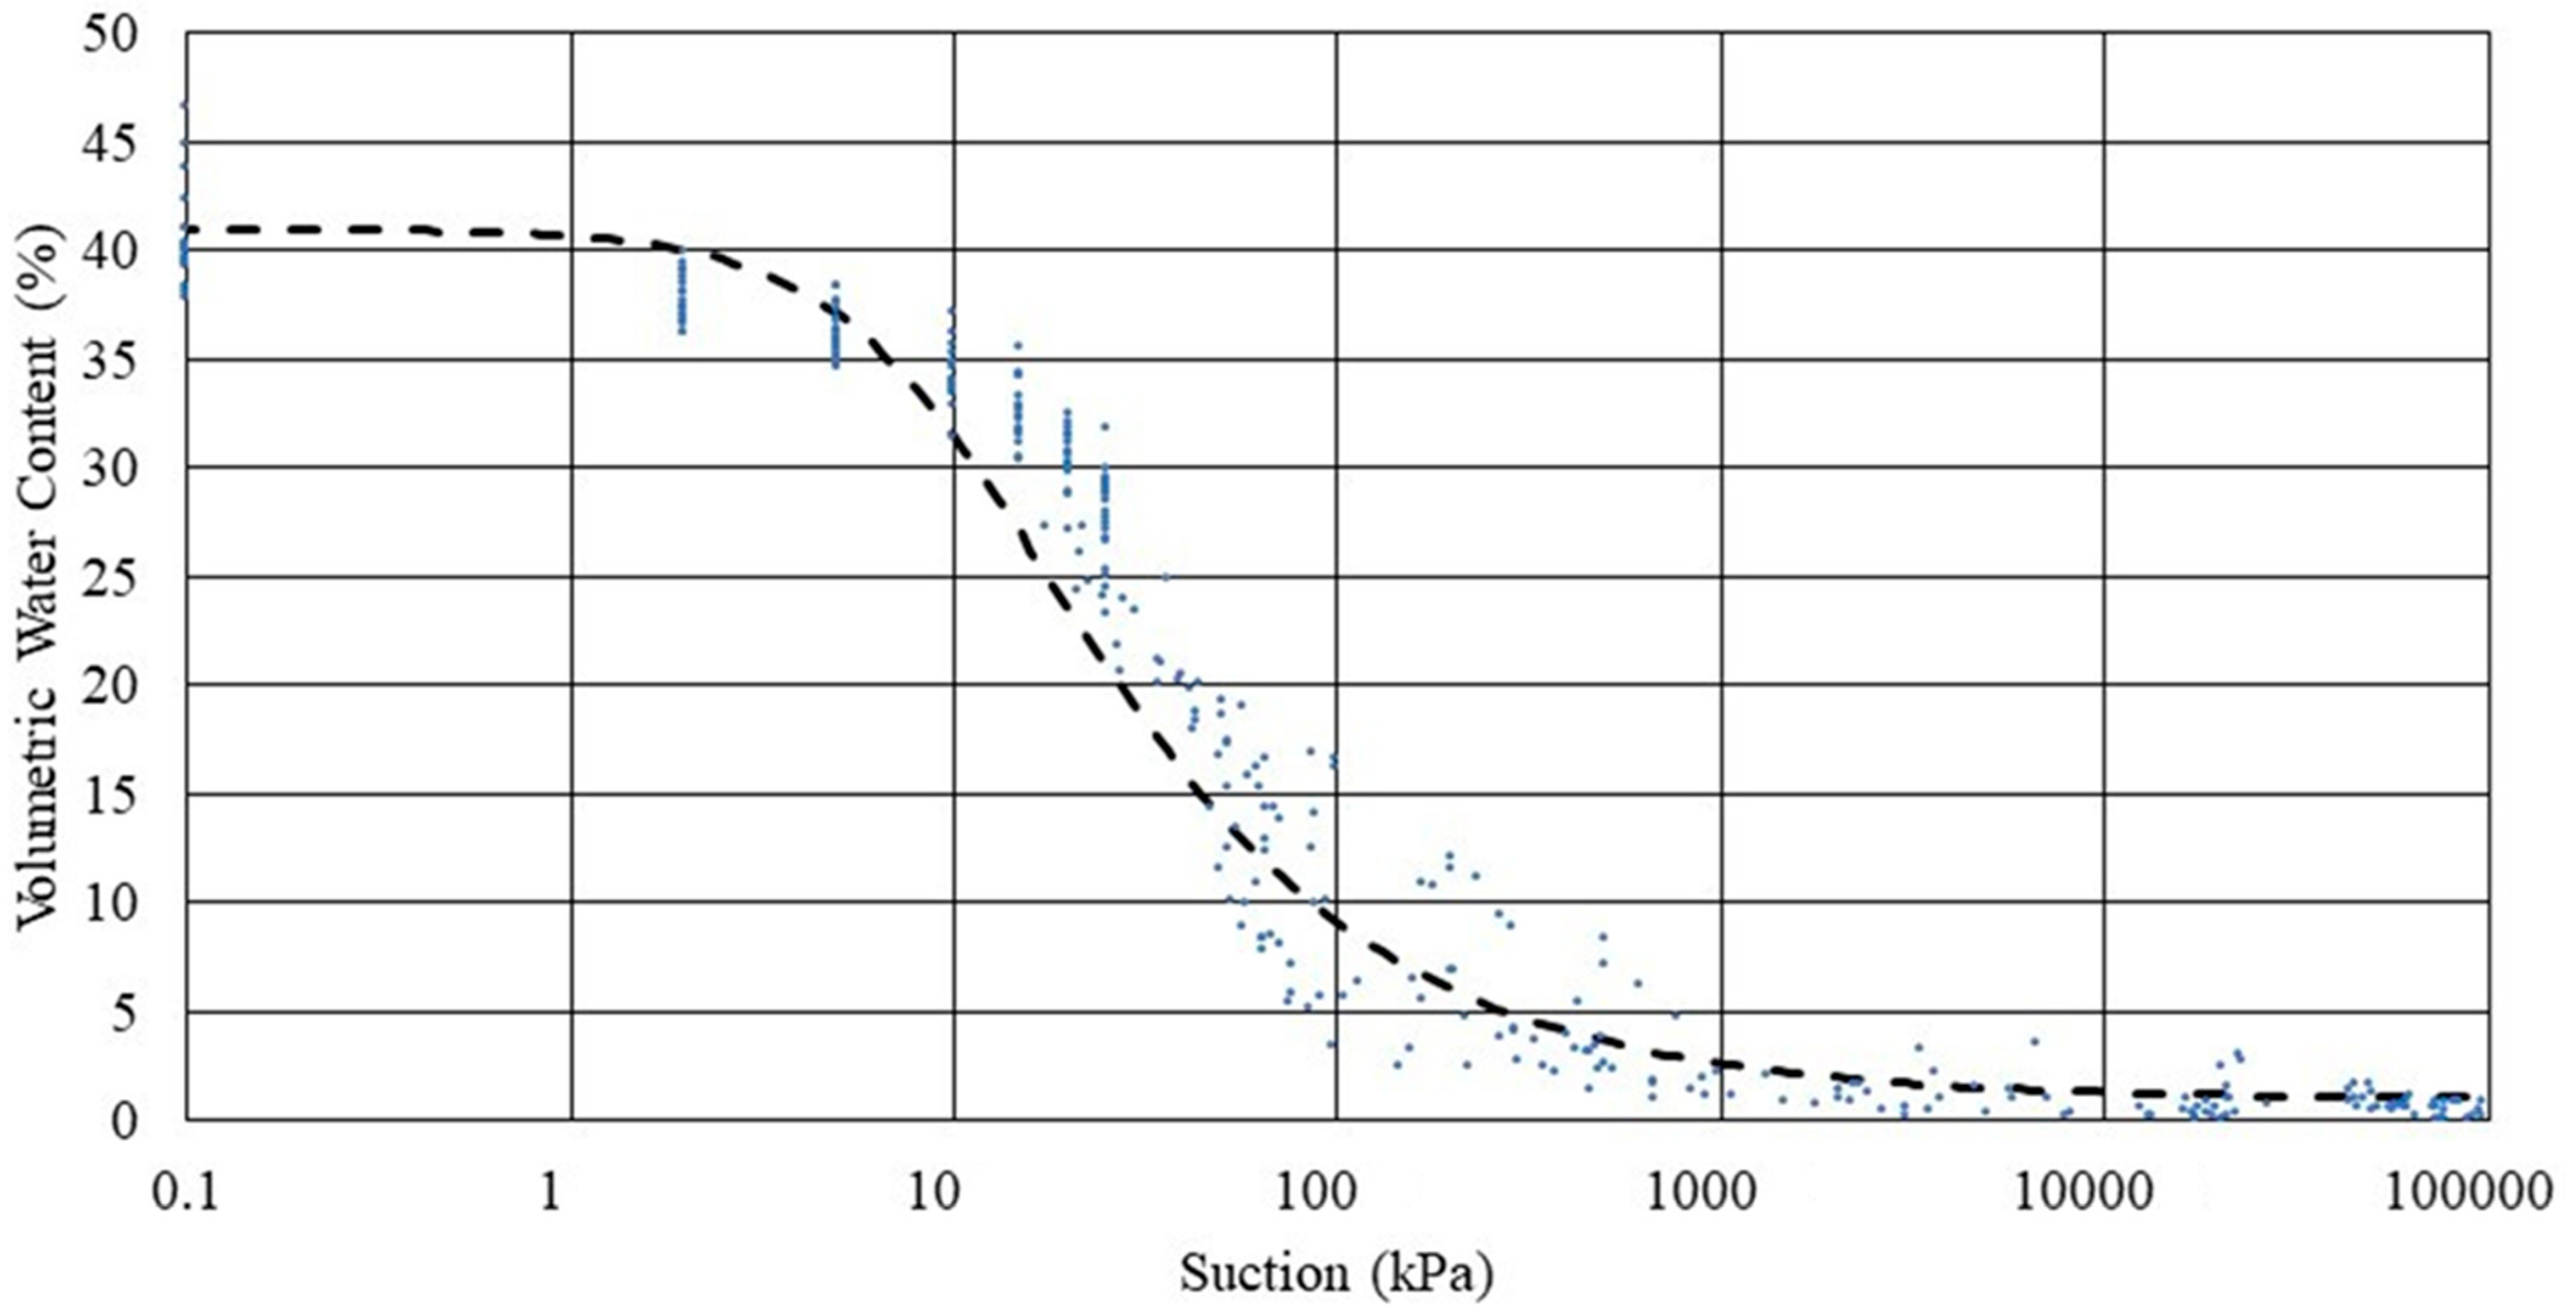
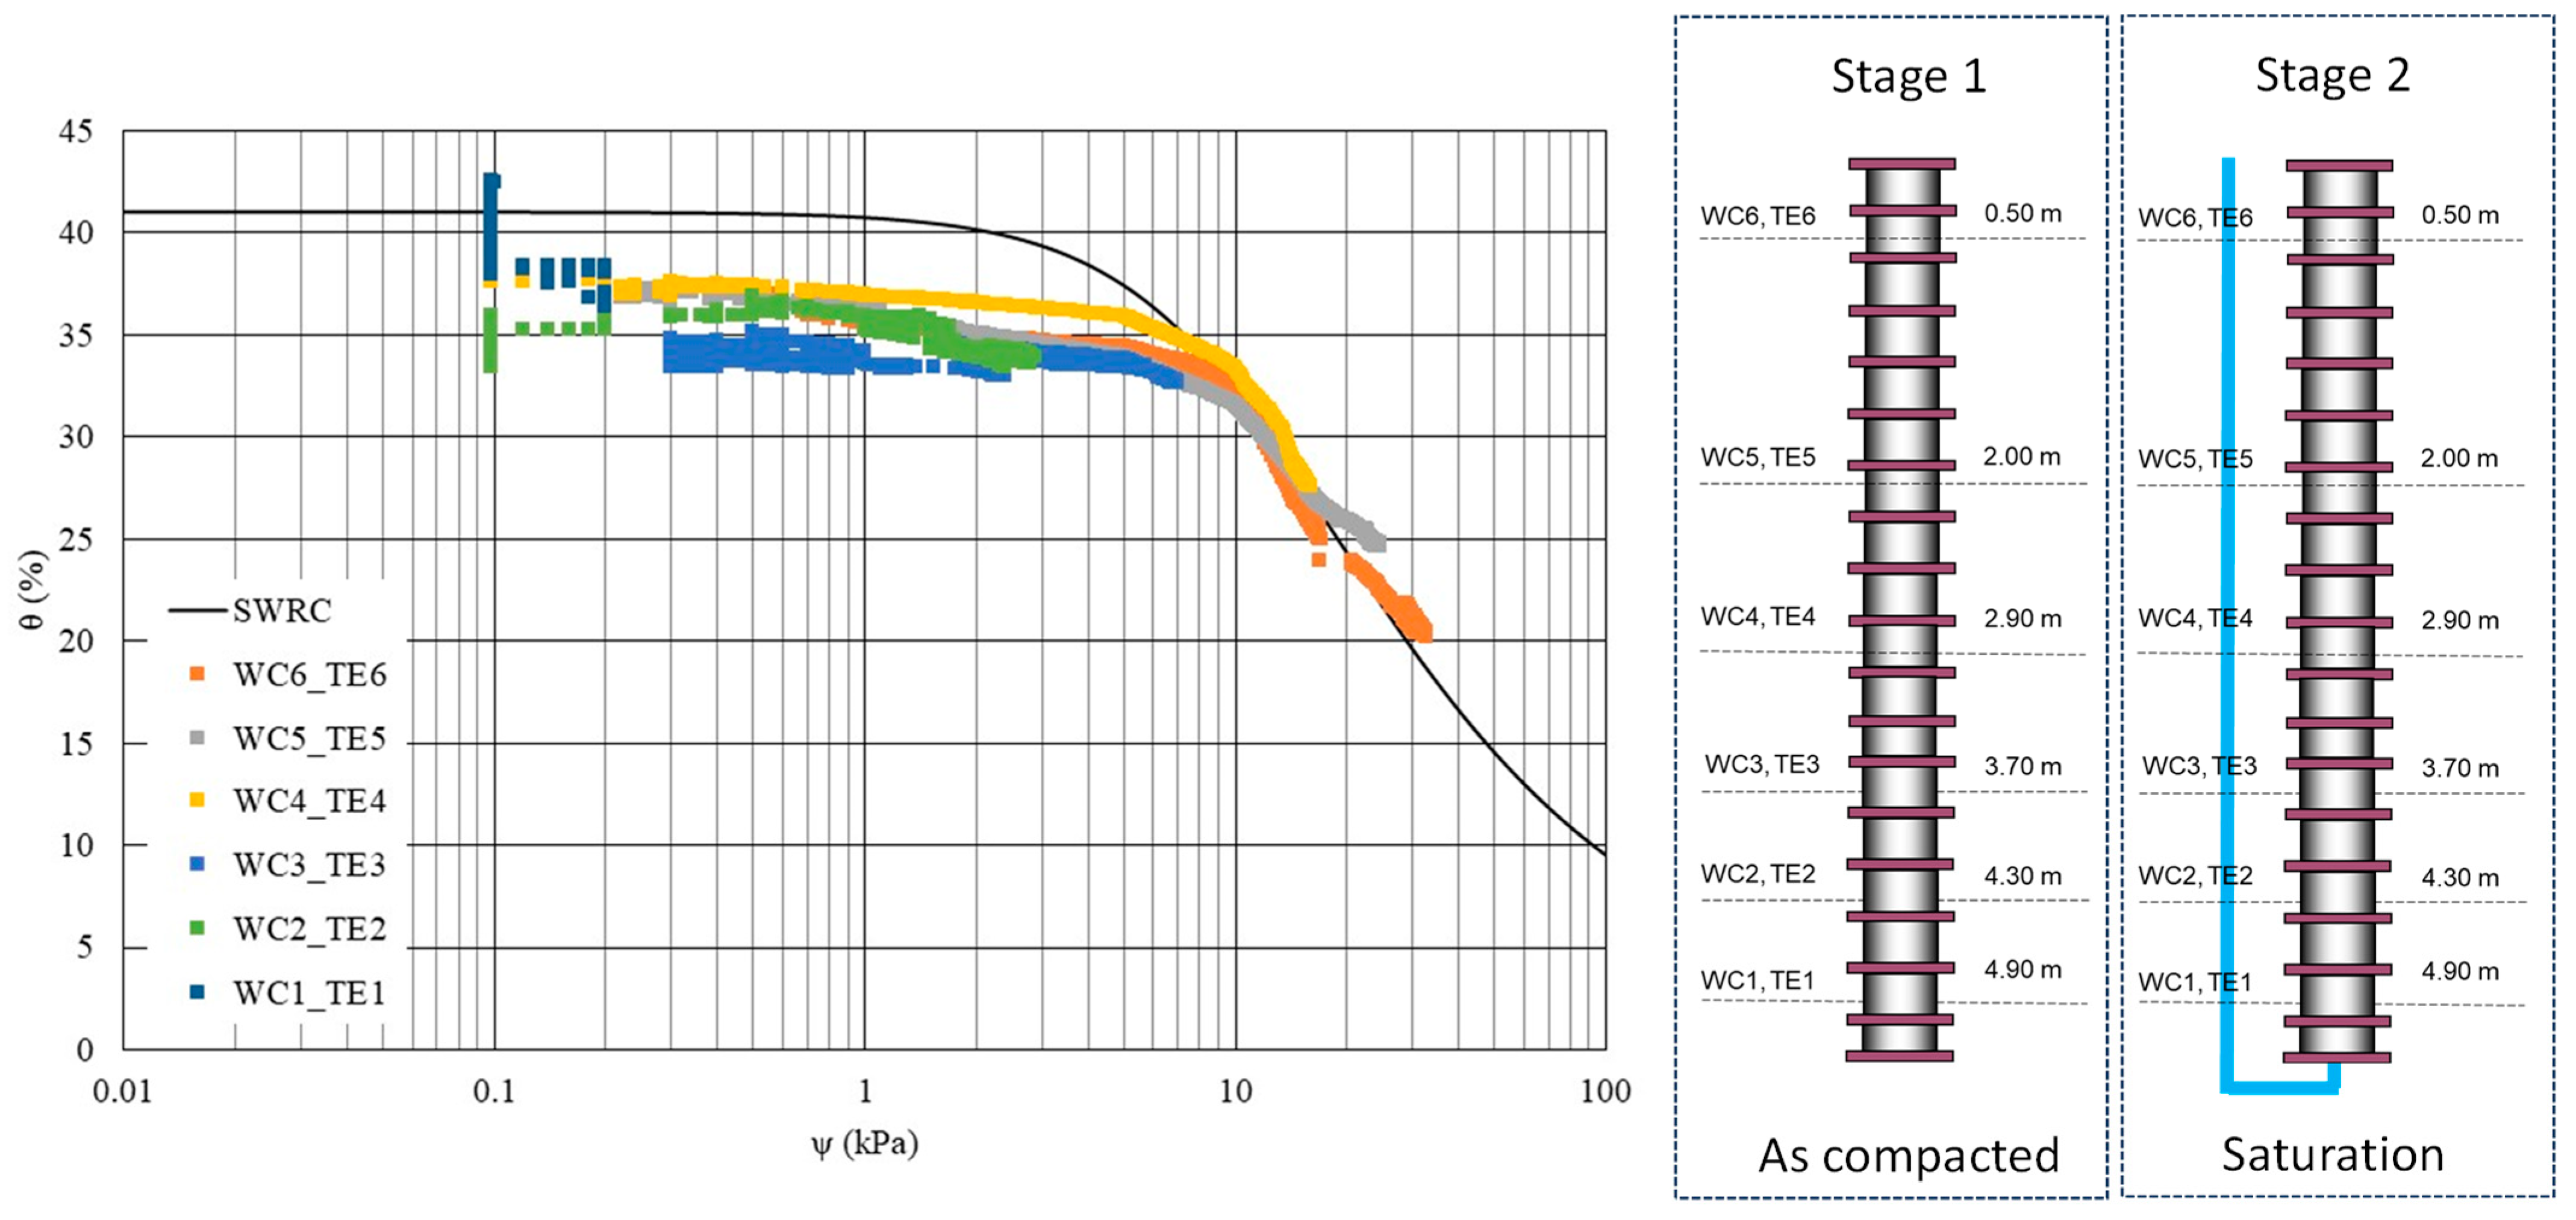
5.3. Soil Water Retention Curve and Column Data

Figure 23, Figure 24 and Figure 25 present the data obtained through the volumetric moisture content and suction sensors and retention curves obtained in the laboratory for various stages of the study.
Figure 23 shows the continuously obtained data from Stages 1 and 2 (during the compaction and saturation process). The deepest sensor had a relatively high saturated water content, whereas the other sensors had water content approximately 7% below the saturation value. The water content and suction trajectories followed a segment with little variation in water content until a suction of approximately 10 kPa was reached. Beyond this point, the data consistently followed the soil water retention curve (SWRC). Importantly, during these two stages, the wetting path was followed.
For suction values of approximately 0–10 kPa, the SWRC showed little variation in volumetric water content. Additionally, the suction sensor is not sufficiently sensitive to these small variations at this suction level. However, the data clearly followed the SWRC when the suction values approached 10 kPa.
In the stages associated with climatic events (Stages 4 and 5), there was minimal variation in moisture content up to a suction of approximately 10 kPa, as noted in previous stages. This finding was indicated in the soil water retention curve (SWRC) in the laboratory and confirms that the water content was not recorded by the moisture sensor. Interestingly, no hysteresis was detected. Only the upper sensor (6) showed variations. As previously described, water can infiltrate to greater depths without altering the suction or water content. However, more intense infiltration and/or evaporation may affect deeper sensors.

6. Conclusions

This study presented the initial findings from an experiment using a 5 m high column filled with compacted iron ore tailings. The volumetric water content and suction were monitored using sensors to evaluate the water retention behaviour and define the active zone in the material. After saturation, drainage, and two cycles of infiltration and evaporation, the experiment provided insights into the complex water dynamics in compacted tailings. The experiment highlighted the critical role of infiltration, drainage, and evaporation processes for effective tailings management, particularly in preventing water-induced instabilities such as liquefaction in tall tailings stacks.
A key aspect of the experiment was the calibration of the volumetric water content sensor, which was specifically tailored for the iron-rich material to account for the influence of iron oxide on the sensor readings. With an instantaneous response time, the moisture content sensor provided immediate data, whereas the suction sensor with a determined response time of 5 min required careful correction to ensure accuracy.
The collected data yielded consistent water content and suction profiles, which clearly defined an active zone of approximately 3 m under simulated climatic conditions. A significant conclusion was the reasonable consistency between laboratory-obtained soil water retention curves (SWRCs) and field data, although further investigation is recommended near saturation levels.
The experiment also provided a detailed water balance and demonstrated that although some infiltrated water was quickly drained, a portion remained in the tailings due to the water retention capacity of the material. This retention is crucial for understanding the long-term stability and assessing potential risks associated with water in tailings stacks. Overall, the experiments are demonstrated to be highly effective in evaluating the behaviour of compacted filtered tailings and serve as a robust basis for precise numerical analyses to calibrate material parameters.

Author Contributions

All authors have contributed extensively to the work presented in this paper. Conceptualization, F.A.M.M., Y.C. and J.P.d.S.S. Methodology, all the authors. Data curation, all the authors. Writing—original draft preparation, F.A.M.M., Y.C. and J.P.d.S.S. Writing—review and editing, all the authors. All authors have read and agreed to the published version of the manuscript.

Funding

The studies were funded by Vale S.A. in partnership with the University of São Paulo (cov. USP 1012802).

Data Availability Statement

The original contributions presented in the study are included in the article material; further inquiries can be directed to the corresponding author.

Acknowledgments

The authors would like to express their thanks to the workers who collaborated in the construction of the experiment, and the students Talita Menegaz and Ana Paula André for their precious collaboration during the activities of the experiment.

Conflicts of Interest

There are no conflicts of interest.

References

  1. Rico, M.; Benito, G.; Salgueiro, A.R.; Díez-Herrero, A.; Pereira, H.G. Reported tailings dam failures: A review of the European incidents in the worldwide context. J. Hazard. Mater. 2008, 152, 846–852. [Google Scholar] [CrossRef] [PubMed]
  2. Santamarina, J.C.; Torres-Cruz, L.A.; Bachus, R.C. Why coal ash and tailings dam disasters occur. Science 2019, 364, 526–528. [Google Scholar] [CrossRef] [PubMed]
  3. Koppe, J.C. Lessons learned from the two major tailings dam accidents in Brazil. Mine Water Environ. 2021, 40, 166–173. [Google Scholar] [CrossRef]
  4. Nwigwe, T.; Minami, K. Assessment of factors contributing to the risks of cargo liquefication accident in bulk carriers (a qualitative approach). TransNav Int. J. Mar. Navig. Saf. Sea Transp. 2022, 16, 149–152. [Google Scholar] [CrossRef]
  5. Marshall, T.J.; Holmes, J.W.; Rose, C.W. Soil Physics; Cambridge University Press: Cambridge, UK, 1996. [Google Scholar]
  6. Murray, E.J.; Sivakumar, V. Unsaturated Soils: A Fundamental Interpretation of Soil Behaviour; John Wiley & Sons: New York, NY, USA, 2010. [Google Scholar]
  7. Edlefsen, N.; Anderson, A. Thermodynamics of soil moisture. Hilgardia 1943, 15, 31–298. [Google Scholar] [CrossRef]
  8. Nelson, J.D.; Miller, D.J. Expansive Soils; Wiley: New York, NY, USA, 1992. [Google Scholar]
  9. Blight, G.E. Unsaturated Soil Mechanics in Geotechnical Practice; CRC Press: Boca Raton, FL, USA, 2013. [Google Scholar]
  10. Goss, M.J.; Ehlers, W. The role of lysimeters in the development of our understanding of soil water and nutrient dynamics in ecosystems. Soil Use Manag. 2009, 25, 213–223. [Google Scholar] [CrossRef]
  11. Lewis, J.; Sjöstrom, J. Optimizing the experimental design of soil columns in saturated and unsaturated transport experiments. J. Contam. Hydrol. 2010, 115, 1–13. [Google Scholar] [CrossRef] [PubMed]
  12. Pütz, T.; Fank, J.; Flury, M. Lysimeters in vadose zone research. Vadose Zone J. 2018, 17, 180035. [Google Scholar] [CrossRef]
  13. Buckingham, E. Studies on the Movement of Soil Moisture; US Department of Agriculture, Bureau of Soils: Washington, DC, USA, 1907. [Google Scholar]
  14. Marinho, F.A.M.; Stuermer, M.M. Aspects of the storage capacity of a compacted residual soil. In Proceedings of the Second International Conference on Unsaturated Soils Beijing, Beijing, China, 27–30 August 1998; International Academic Publishers: Beijing, China, 1998; pp. 581–585. [Google Scholar]
  15. Marinho, F.A.M.; Pinto, C.D.S. Investigating the water retention in iron ore. In Proceeding of the 3rd International Conference on Unsaturated Soils, Recife, Brazil, 10–13 March 2002; CRC Press: Boca Raton, FL, USA, 2004; pp. 1143–1146. [Google Scholar]
  16. Oliveira, O.M.; Marinho, F.A.M. Simulação de chuva em coluna de solo residual compactado. In Proceedings of the VI Simpósio Brasileiro de Solos Não Saturados, Salvador, Brazil, 1–3 November 2007; pp. 291–297. [Google Scholar]
  17. Teixeira, P.F.; Marinho, F.A.; Oliveira, O.M.D. Efeito do fluxo de ar no perfil de umidade de uma areia. In Proceedings of the XIV Congresso Brasileiro de Mecânica dos Solos e Engenharia Geotécnia, Búzios, Brazil, 23–26 August 2008. [Google Scholar]
  18. Reinert, D.J.; Reichert, J.M. Coluna de areia para medir a retenção de água no solo: Protótipos e teste. Ciênc. Rural 2006, 36, 1931–1935. [Google Scholar] [CrossRef]
  19. McCartney, J.S.; Zornberg, J.G. Effects of infiltration and evaporation on geosynthetic capillary barrier performance. Can. Geotech. J. 2010, 47, 1201–1213. [Google Scholar] [CrossRef]
  20. Ng, C.W.W.; Leung, A.K. Measurements of drying and wetting permeability functions using a new stress-controllable soil column. J. Geotech. Geoenviron. Eng. 2012, 138, 58–68. [Google Scholar] [CrossRef]
  21. Crystal, C.; Hore, C.; Ezama, I. Filter-pressed dry stacking: Design considerations based on practical experience. In Proceedings of the Tailings and Mine Waste, Brisbane, Australia, 23–24 July 2018; pp. 209–219. [Google Scholar]
  22. Jesus, M.H.; Silva, J.P.D.S.; Marinho, F.A.M. Soil water retention curve of a compacted iron ore tailing obtained by various methods. In Proceedings of the 17th Pan-American Conference on Soil Mechanics and Geotechnical Engineering (XVII PCSMGE), La Serena, Chile, 12–17 November 2024. [Google Scholar]
  23. Van Genuchten, M.T. A closed-form equation for predicting the hydraulic conductivity of unsaturated soils. Soil Sci. Soc. Am. J. 1980, 44, 892–898. [Google Scholar] [CrossRef]
  24. De Sá Landim, A.; Corrêa, Y.; Silva, J.P.; Marinho, A.M.F. Evaluation a volumetric water content sensor to be used for compacted filtered iron ore tailings. In E3S Web of Conferences; EDP Sciences: Les Ulis, France, 2023; p. 16003. [Google Scholar]
  25. Nguyen, B.T.; Ishikawa, T.; Zhu, Y.; Subramanian, S.S.; Nguyen, T.T. New simplified transient method for determining the coefficient of permeability of unsaturated soil. Eng. Geol. 2022, 300, 106564. [Google Scholar] [CrossRef]
Figure 1. (a) Ore-pile draining and (b) water content variation along the pile.
Geosciences 14 00273 g001
Figure 2. Relationship between the water content and the amount of fines.
Geosciences 14 00273 g002
Figure 3. (a) Physical model of a soil column with a water table (b) Relationships between free energy and water content in a soil column with a fixed water table (c) Variation of water content with the height of the column (modified from Edlefesen and Anderson [7]).
Geosciences 14 00273 g003
Figure 4. Suction (a) and water content (b) profile in the field.
Geosciences 14 00273 g004
Figure 5. (a) PVC column; (b) schematic drawing of the column; (c) suction equilibrium profile, and (d) water content profiles for three hypothetical materials [15].
Geosciences 14 00273 g005
Figure 6. Soil water retention curve of the material (data from Jesus et al. [22]).
Geosciences 14 00273 g006
Figure 7. Segments for the column assembly.
Geosciences 14 00273 g007
Figure 8. Drainage segment. Placement of (a) gravel and (b) medium sand.
Geosciences 14 00273 g008
Figure 9. Column compaction process: (a) Details of the compaction; (b) column at its 6th segment.
Geosciences 14 00273 g009
Figure 10. First completed column: (a) Image of the completed column; (b) sensor positions.
Geosciences 14 00273 g010
Figure 11. Time lag graphical analysis between sensors WC6 and TE6 during (a) saturation, (b) drainage, (c) infiltration, and (d) evaporation.
Geosciences 14 00273 g011
Figure 12. Stages imposed in the columns.
Geosciences 14 00273 g012
Figure 13. Profiles at the end of construction and before saturation: (a) Volumetric water content and (b) suction.
Geosciences 14 00273 g013
Figure 14. Profiles during saturation: (a) Volumetric water content and (b) suction.
Geosciences 14 00273 g014
Figure 15. Profiles during drainage: (a) Volumetric water content and (b) suction.
Geosciences 14 00273 g015
Figure 16. Responses of the TE6 (a) and WC6 (b) sensors to the first infiltration and evaporation.
Geosciences 14 00273 g016
Figure 17. Responses of the TE6 (a) and WC6 (b) sensors to the second infiltration and evaporation.
Geosciences 14 00273 g017
Figure 18. Profiles during the first infiltration: (a) volumetric water content and (b) suction.
Geosciences 14 00273 g018
Figure 19. Profiles during the first evaporation: (a) volumetric water content and (b) suction.
Geosciences 14 00273 g019
Figure 20. Profiles during the second infiltration: (a) volumetric water content and (b) suction.
Geosciences 14 00273 g020
Figure 21. Profiles during the second evaporation: (a) Volumetric water content and (b) suction.
Geosciences 14 00273 g021
Figure 22. Measured water flux at the base of the column.
Geosciences 14 00273 g022
Figure 23. A closer look at the sensor readings plotted with the retention curve.
Geosciences 14 00273 g023
Figure 24. Water retention curve with the sensor readings.
Geosciences 14 00273 g024
Figure 25. SWRC versus infiltration and evaporation data.
Geosciences 14 00273 g025
Table 1. Interrelations of indices involving water.
θ= G s 1 n w h w h T nS
w= θ G s ( 1 n ) h w ρ w h T ρ d n G s ρ w ρ d 1 θ G s
S= w G s e h w n h T θ n
hw= θ h T n S h T w h T ρ d ρ w
Where θ is the volumetric water content ( V o l u m e o f w a t e r T o t a l v o l u m e o f t h e s o i l ). ρ d = M s V t is the dry density. G s = ρ s ρ w is the specific gravity. S is the degree of saturation. n is the porosity. e is the void ratio. hw is the water height at a specific soil depth. hT is the soil height.
Table 2. General characteristics of the material.
Specific gravity (Gs)3.35
Fine sand13.5%
Silt83.7%
% < 2 mm2.8%
wopt11.9%
θopt24.0%
Sopt58.0%
Maximum dry unit weight19.77 kN/m3
θsat40%
Quartz89.1%
Fe2O310.9%
wopt—Optimum gravimetric water content; θopt—Optimum volumetric water content; θsat—Saturated volumetric water content.
Table 3. Parameters for the SWRC.
a0.09
n1.7
m = (1-1/n)0.4118
θsat41%
θresidual1%
Table 4. Water volumes of the experiment.
DescriptionVolume (Litres)
Theoretical pore saturation volume103.1
Sensor-estimated saturation volume93.3
Volume of water drained after 190 days42
Estimated volume for initial drainage (hyperbolic fitting)43.5
Volume of water in the first infiltration12.6
Volume of water in the second infiltration12.6
Drainage after the first infiltration (47 days)10.3
Drainage after the second infiltration (103 days)14.7
Total volume of water present in the column since the start118.5
Total increase in drained water after induced infiltrations23.6
Volume to be drained over time0.9
Disclaimer/Publisher’s Note: The statements, opinions and data contained in all publications are solely those of the individual author(s) and contributor(s) and not of MDPI and/or the editor(s). MDPI and/or the editor(s) disclaim responsibility for any injury to people or property resulting from any ideas, methods, instructions or products referred to in the content.

