Article

Seismic Response of Pile Foundations in Clayey Soil Deposits Considering Soil Suction Changes Caused by Soil–Atmospheric Interactions

School of Civil Engineering and Environmental Science, University of Oklahoma, Norman, OK 73019, USA
*
Author to whom correspondence should be addressed.
Geosciences 2024, 14(9), 234; https://doi.org/10.3390/geosciences14090234
Submission received: 25 March 2024 / Revised: 1 July 2024 / Accepted: 26 August 2024 / Published: 29 August 2024

Abstract

:
Extreme variations in weather patterns have become increasingly common across the Southern Great Plains of the United States. The soil layer in the active zone above the groundwater table is often subjected to moisture variations due to seasonal weather changes that will influence the behavior of soils, including their strength and stiffness parameters. Designing a pile foundation in seismic-prone areas without considering the moisture changes in soil interacting with piles may adversely impact the seismic performance of the piles. The main aim of this study is to investigate the role of soil moisture conditions and suction caused by soil–atmospheric interactions on the dynamic behavior of the pile foundations interacting with clayey soils. This study uses a stand-alone finite element computer code called DYPAC (Dynamic Piles Analysis Code) developed using the Beams on Nonlinear Winkler Foundation (BNWF) approach. The influence of soil suction is incorporated into the p-y curves and free-field soil displacements using site response analyses by employing the concept of apparent cohesion. To perform nonlinear site response analyses, DEEPSOIL software V6.1 is utilized. The variation in soil suction with depth along the pile is considered using unsaturated seepage analysis performed by employing the commercial software PLAXIS LE Groundwater for three different clayey soils with plasticity ranging from low to medium to high. The analyses were performed using actual past daily recorded weather data for a testbed that experienced significant back-to-back flash droughts in 2022. This study found that extreme weather events like flash droughts can significantly affect the soil suction and seismic performance of the piles interacting with the unsaturated clayey soils.

1. Introduction and Background

The main aim of this study is to investigate the role of soil moisture conditions and suction caused by soil–atmospheric interactions on the dynamic behavior of the pile foundations interacting with clayey soils. In this section, the motivation for this work is discussed relative to the occurrence of increasingly extreme weather in the form of flash drought, followed by the impacts of this weather on soil and the behavior of pile foundations. Particular emphasis is placed on lateral load behavior during earthquakes. Finally, the method of analysis used in this study to examine dynamic pile–soil interaction, and the influence of moisture conditions is introduced at the end of this section.
Extreme variations in weather patterns have become increasingly common across the Southern Great Plains of the United States. The frequency, duration, and intensity of these events is projected to increase as we progress into the mid-21st century [1]. One of the many features of these weather patterns is extreme and rapid changes from normal to drought conditions and vice versa. Rapid changes from normal to drought conditions have been termed flash droughts. Flash droughts have become a common phenomenon across the Southern Great Plains. Flash drought was observed in portions of this area for 26 of the 37 years between 1979 and 2016 [2]. More recently, back-to-back flash droughts have been observed. These events are characterized by a series of flash droughts in a short amount of time. The back-to-back flash drought used in this study occurred over five months. There was a small period of rainfall between the flash droughts indicating the end of one drought and the beginning of another. Soil moisture contents in the active zone near the ground surface can change significantly during the wetter and dry periods associated with these flash droughts, which can significantly influence the soil strength and stiffness. The active zone generally extends from 3 to 5 m below the ground surface in Oklahoma, and so changes in soil properties in this zone can have a large impact on the behavior of foundations interacting with these soils.
It is well established that the behavior of foundations is impacted by changes in soil moisture content and soil suction. These impacts are most notable in clayey soils which experience large variations in soil suction and volume change due to changes in soil moisture. Shallow foundations are much more susceptible to the effects of soil volume change that results from variations in soil moisture. As a result, shallow foundations have received much attention with respect to unsaturated soils. Deep foundations, particularly those that are founded in bedrock, are assumed to be isolated from the effects of variations in soil moisture content under axial loads. The lateral loading of deep foundations, however, will depend on soil moisture variations and this dependency has not been very well investigated.
Pile foundations are commonly employed to effectively transmit axial and lateral loads from superstructures to the subsurface in situations where the superstructure loads are substantial and/or there are weak soil layers near the ground surface. Lateral loads are important in the structural analysis and design of pile foundations, which serve as essential support systems for various structures such as tall buildings, bridges, transmission lines, and offshore installations. Earthquakes have resulted in substantial damage to civil engineering structures, often due to insufficient lateral load capacity and excessive deformation of pile foundations that support these structures [3,4]. The moisture content of the soil in the active zone above the groundwater table fluctuates due to seasonal weather or water table changes. The groundwater table level can vary seasonally and spatially, leading to saturated soils transitioning to unsaturated conditions at specific times. A considerable proportion of many pile foundations are embedded in unsaturated soils, and the fluctuations in moisture levels in the surrounding soils can impact the characteristics of the soils, such as their strength and stiffness parameters. Changes in these soil parameters can have a significant impact on the seismic response of pile foundations. Unsaturated soils exhibit distinct dynamic properties when compared to soils that are either fully saturated or completely dry [5,6]. As demonstrated by Hoyos et al. [7], unsaturated soils exhibit greater shear stiffness but lower damping in comparison to both dry and fully saturated soils. In addition, it has been found in other studies that the level of soil saturation significantly influences the settlement of soils caused by seismic activity [8]. Moreover, the seismic response of sites [9,10] and the response of foundations to seismic events [11,12,13] have also been observed to be affected by the degree of soil saturation. The seismic performance of pile foundations may be negatively affected if the soil moisture changes are not considered in the soil–pile interaction analyses during the design process.
The literature contains many notable studies about the behavior of laterally loaded piles. The primary focus of the majority of these studies pertains to the seismic response of piles in soils that are fully saturated. Insufficient emphasis has been placed on investigating the impact of unsaturated soil conditions on the behavior of laterally loaded piles. Nevertheless, it is widely recognized that the mechanical properties of soil layers near the ground surface, often situated above the groundwater table, exert a significant influence on pile response [14]. Based on the available literature, it appears that limited research has been conducted on the influence of soil suction on the behavior of laterally loaded piles in unsaturated soils. Mokwa et al. [15], in their study, presented a methodology aimed at determining the load versus lateral displacement curves for unsaturated soils. This approach was developed by analyzing the outcomes of five comprehensive load tests conducted at full scale. In their study, Stacul et al. [16] employed the Modified Kovacs model to develop a hybrid BEM p-y curve methodology for individual piles. This technique effectively replicates the impact of matric suction by elevating the stress state and stiffness of near-surface soil layers. Lalicata et al. [11] conducted centrifuge experiments to investigate the influence of the degree of saturation on the response of laterally loaded piles. Based on their study, a significant enhancement in soil stiffness and ultimate lateral resistance was observed in unsaturated soils.
The main aim of this present study is to investigate the role of moisture conditions and soil suction, as affected by season-to-season weather extremes, on the dynamic behavior of the pile foundations interacting with clayey soils. This study uses a stand-alone finite element computer code called DYPAC (Dynamic Piles Analysis Code) developed using the Beams on Nonlinear Winkler Foundation (BNWF) approach [17]. DYPAC analyzes the seismic response of a single pile in a layer of soil. This computer code models the pile as a beam element and the nonlinear soil behavior as springs and viscous dashpots using a nonlinear p-y element [18]. The influence of soil suction is incorporated into the p-y curves and site response analyses using the concept of apparent cohesion, which is a nonlinear relationship as described by Vanapalli et al. [19]. To perform nonlinear site response analyses, DEEPSOIL software is utilized. The variation in soil suction with depth along the embedded portion of the pile is also considered in the analysis. To incorporate these effects, unsaturated seepage analysis was completed using the commercial software PLAXIS LE Groundwater [20] for three different hypothetical clayey soils with plasticity ranging from low to medium to high. The soil properties selected for analysis encompass the range of clayey soil types across the testbed area. The seepage analyses were performed using actual past daily recorded weather data for this testbed which experienced significant flash droughts in 2022. An illustrative case study is presented to show how a pile foundation’s seismic response can be affected in unsaturated clayey soils by changes in moisture conditions caused by soil–atmospheric interactions.

2. Method of Approach

This section begins with a brief introduction to moisture migration analysis. It is followed by the DYPAC modeling description with a discussion of the Winkler model used in DYPAC as a soil–pile interaction analysis method and Hilber–Hughes–Taylor (HHT)-α method as a numerical method to solve the governing equation. This section proceeds with a description of site response analyses and will end with an explanation to clarify how the effects of unsaturated conditions are incorporated into DYPAC modeling to estimate the seismic response of pile foundations in clayey soils subjected to seasonal weather changes. The next section is an illustrative case study to show how a comprehensive study can be conducted using real weather data.

2.1. Moisture Migration Analysis

The effects of back-to-back flash droughts on soil moisture were incorporated in this study using seepage analysis performed with PLAXIS LE Groundwater. PLAXIS LE Groundwater allows the user to import weather data for the study duration which act as the input for the soil–atmospheric interaction analysis. The weather data can include average daily temperatures, wind speed, solar radiation, relative humidity, and daily precipitation. The potential evaporation is estimated by the software according to Penman [21]. The weather loading is then applied in the soil model as a series of time steps. Pertinent information such as soil moisture content, soil suction, moisture flux, and evaporation can be obtained from the software at different times of the analysis.

2.2. DYPAC Modeling

DYPAC is a stand-alone finite element computer code developed using the Beams on Nonlinear Winkler Foundation (BNWF) approach. Winkler [22] developed a simplified method called Beams on Elastic Foundation (BEF) that is commonly used in civil engineering practice today to analyze soil–pile interactions. This approach models the pile as a beam element and the interaction with the soil through an infinite number of discrete spring elements with the interactions described using a p-y curve. Here, “p” denotes lateral soil resistance per unit length of the pile, and “y” denotes the lateral pile displacement. Later, this concept was extended as the BNWF and used discrete nonlinear springs to account for the nonlinearity of soils. DYPAC analyzes the seismic response of a single pile in a layer of soil. This computer code models the pile as a beam element and the nonlinear soil behavior as springs and viscous dashpots using a nonlinear p-y element [18].
It is important to consider factors such as soil yielding, gapping, radiation damping, and soil cave-in and recompression when employing BNWF for seismic problems [23]. The integration of these elements into the nonlinear p-y components poses a notably intricate and demanding challenge, even in cases where the soil system exhibits homogeneity. DYPAC utilizes the Boulanger et al. [18] model for its p-y representation. This model features a nonlinear p-y element comprising elastic, plastic, and gap constituents (Figure 1) interconnected in series. The elastic component simulates the far-field soil motion through a linear spring and a dashpot in parallel, mimicking radiation damping. The plastic component simulates the near-field motion of the soil adjacent to the pile using a nonlinear spring that accounts for stiffness and strength degradation. The gap component simulates the drag force on the pile when it moves within the gap by using a nonlinear drag spring. The transition from the gap to contact is made smooth by a parallel nonlinear closure spring. Free-field soil displacements (soil displacements relative to the base) obtained using a site response analysis are input to the free end of elastic spring/dashpot to solve the nonlinear governing differential equation at every time step using an iterative numerical algorithm. The governing differential equation contains mass, damping, and stiffness of the pile, stiffness due to soil–pile interactions (stiffness from the p-y curves), and the applied base acceleration time history [15]. The y in the p-y curve is the difference between the pile displacement relative to the base and the soil displacement relative to the base. For this study, the input parameters pult and y50 were based upon Matlock’s [24] Equations (1)–(3):
p u l t = c u b N p
N p = 3 + γ x c u + J x b 9
y 50 = 2.5 b ε 50
where b = pile diameter, N p = lateral bearing capacity factor, γ = average buoyant unit weight, x = depth, c u = undrained shear strength, and ε 50 = strain corresponding to a stress of 50% of the ultimate stress in a laboratory stress–strain curve. ε 50 was taken as 0.005 for c u 96   k P a based on the typical values proposed in the literature for stiff clay. Also, J was taken as 0.25 according to Matlock’s recommendations for stiff clay.
In addressing nonlinear dynamic issues, a robust time-stepping approach proves effective in mitigating the spurious effects of high-frequency modes and achieving rapid convergence, thereby enhancing computational efficiency. The Hilber–Hughes–Taylor (HHT)-α method [25], also known as the α-method, stands out as a widely utilized numerical integration technique in structural dynamics. A precursor to the HHT-α method is the Newmark time integration method. Notably, the HHT-α method exhibits superior accuracy and favorable numerical damping characteristics when compared to the Newmark method. Muraleetharan et al. [26] applied a time integration scheme based on the HHT-α method to address the dynamic behavior of saturated soils governed by nonlinear equations. In this present study, the HHT-α method is combined with the Newton–Raphson method to solve the nonlinear governing equations in DYPAC similar to the approach used by Muraleetharan et al. [26].
Nonlinear site response analyses to obtain free-field soil displacements were conducted using the DEEPSOIL computer code [27]. The curves representing G/Gmax and damping ratio (%) were established as functions of shear strain (%) for clayey soils using the nonlinear approach proposed by Darendeli [28] and Equation (4). Dickenson [29] introduced an empirical relationship for the shear wave velocity ( v s ) in cohesive soils as follows in Equation (5):
v s = G m a x ρ
v s = 18 c u 0.475
where v s is shear wave velocity in m/s, G m a x is the maximum shear modulus of the soil, ρ is the density of the soil, and c u is undrained shear strength in kPa. In free-field soil displacement analyses, the impact of suction was considered by adjusting the shear strength and consequently the shear wave velocity for each suction value based on Equation (5). For simplicity, G/Gmax and damping ratio curves are kept constant across all suction values. Free-field soil displacements were determined for each suction level and subsequently utilized as input for DYPAC analyses.
The influence of soil moisture is incorporated into the p-y curves and site response analyses using a nonlinear relationship that was proposed by Vanapalli et al. [19] as follows in Equation (6):
τ = c + σ n u a tan ϕ + u a u w ( tan ϕ ) S S r 100 S r
where τ is the shear strength of an unsaturated soil, c′ denotes the effective cohesion for a saturated soil, ϕ′ represents the effective internal friction for a saturated soil, ( σ n u a ) is the net normal stress on the plane of failure, u a u w is the matric suction of the soil on the plane of failure, S is the degree of saturation, and Sr is the residual degree of saturation. An approximation of c u τ has been used here based on the assumption that τ is reasonably close to the top of the Mohr’s circle and c u is equal to one-half the difference in major and minor net principal stresses [30]. Hence, the values of τ were used for c u , as a close approximation, in Equations (1) and (2) to calculate the p u l t values and were also used in the Dickenson equation (Equation (5)) to assess the shear wave velocities for DEEPSOIL analyses. This implies that changes in matric suction leads to changes in shear strength ( c u ), shear wave velocity, and free-field soil displacements. Furthermore, changes in suction results in updates to the pult in the p-y model. These modifications collectively impact the seismic response of a pile foundation as the moisture conditions in unsaturated soil undergo changes.

3. Illustrative Case Study

An illustrative case study is presented to show how a pile foundation’s seismic response can be affected in unsaturated soils by changes in moisture conditions induced by soil–atmospheric interactions. The testbed for this case study is Pittsburg County, Oklahoma. Pittsburg County is in southeast Oklahoma. The site was chosen because it is home to expansive soils and experienced back-to-back flash droughts in 2022. The soils in the testbed are diverse, ranging from moderate to high PI clayey soils to non-plastic silty sands. A wide range of PI and percent of fines (w) were chosen to characterize the soils for this case study (see Table 1). Based on the literature, there are some correlations between effective cohesion/friction angle and the plasticity index of clay. Given the utilization of unsaturated soils, which commonly display overconsolidated characteristics, Equations (7) and (8) have been chosen. These equations are recommended for application in overconsolidated clays. To estimate the effective cohesion Equation (7), which is proposed by Tchakalova [31], is used. For friction angle estimation, Equation (8), proposed by Sorensen [32], is used. Values of effective cohesion and friction angle obtained using these equations are listed in Table 1.
c = 8.476 + 0.776   P I
ϕ = 45 15 log P I
where c′ denotes the effective cohesion for a saturated soil, ϕ′ represents the effective internal friction for a saturated soil, and PI is the plasticity index of the soil.
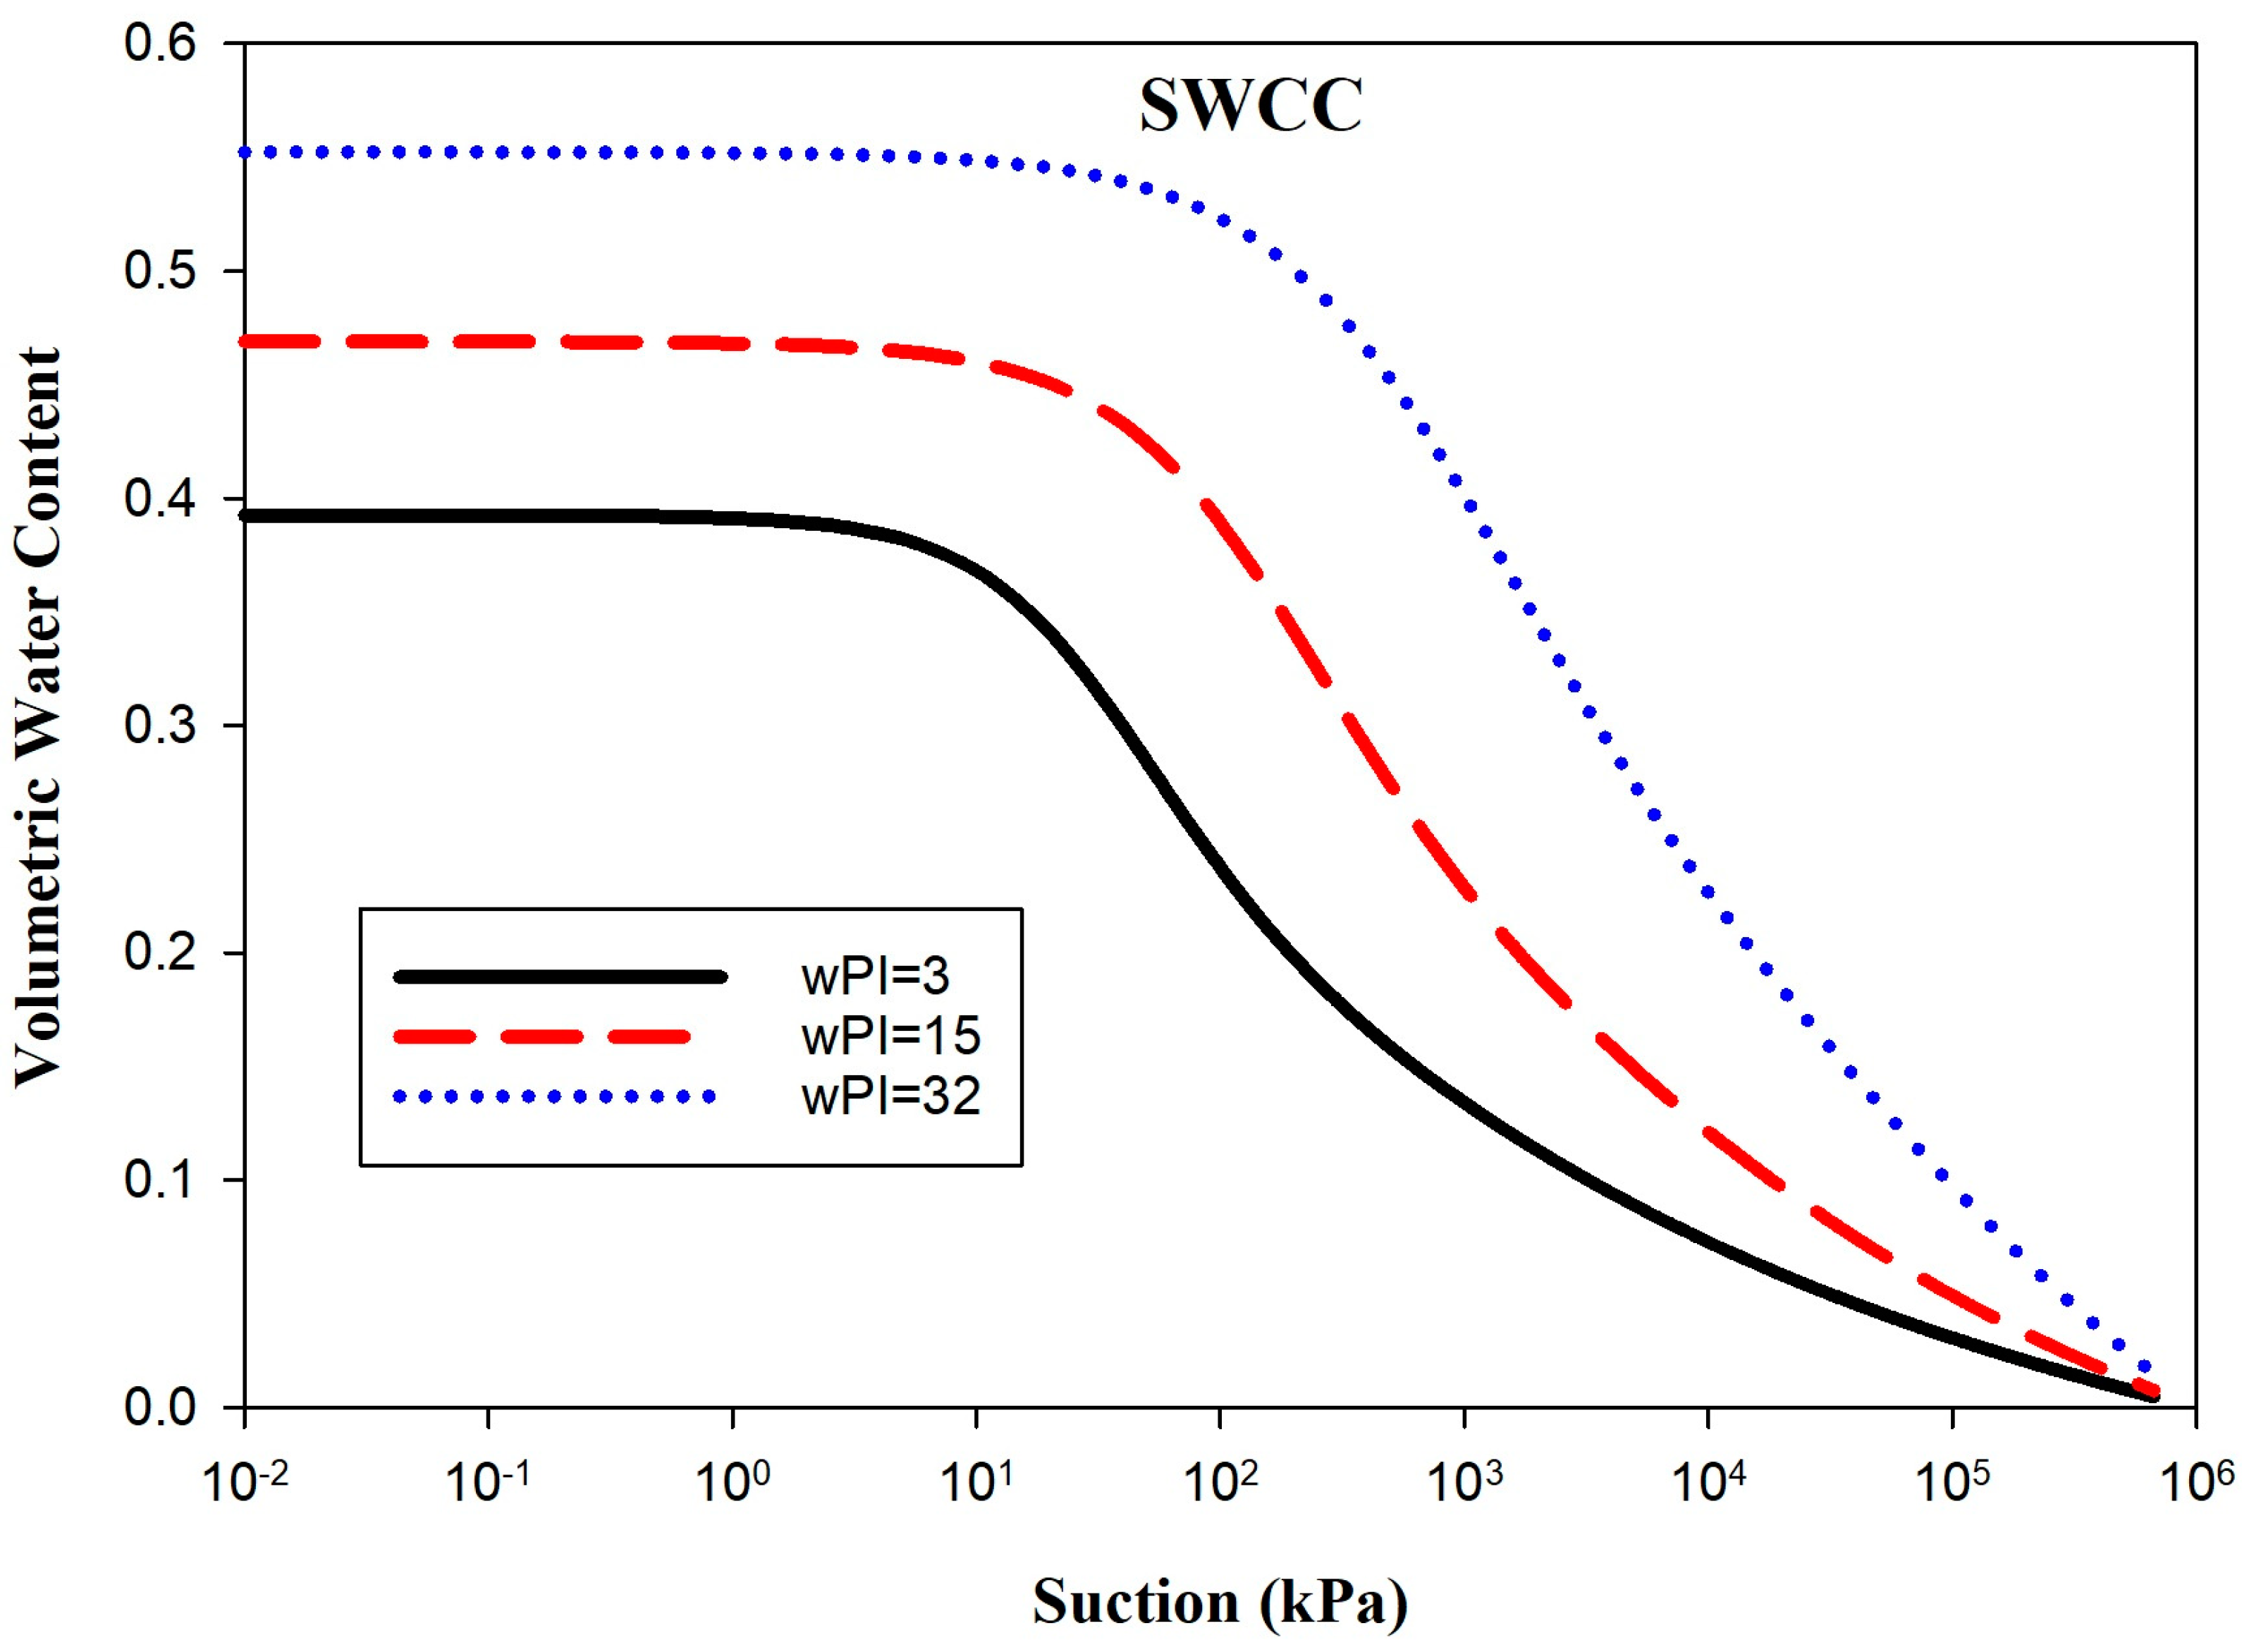
Soil water characteristic curves (SWCCs) were developed for each of the study soils according to the relationship developed by Fredlund and Xing [33]. This relationship requires four fitting parameters that can be estimated based on the soil PI and percent fines according to Zapata [34]. The SWCCs for each of the soils according to these relationships are shown in Figure 2.
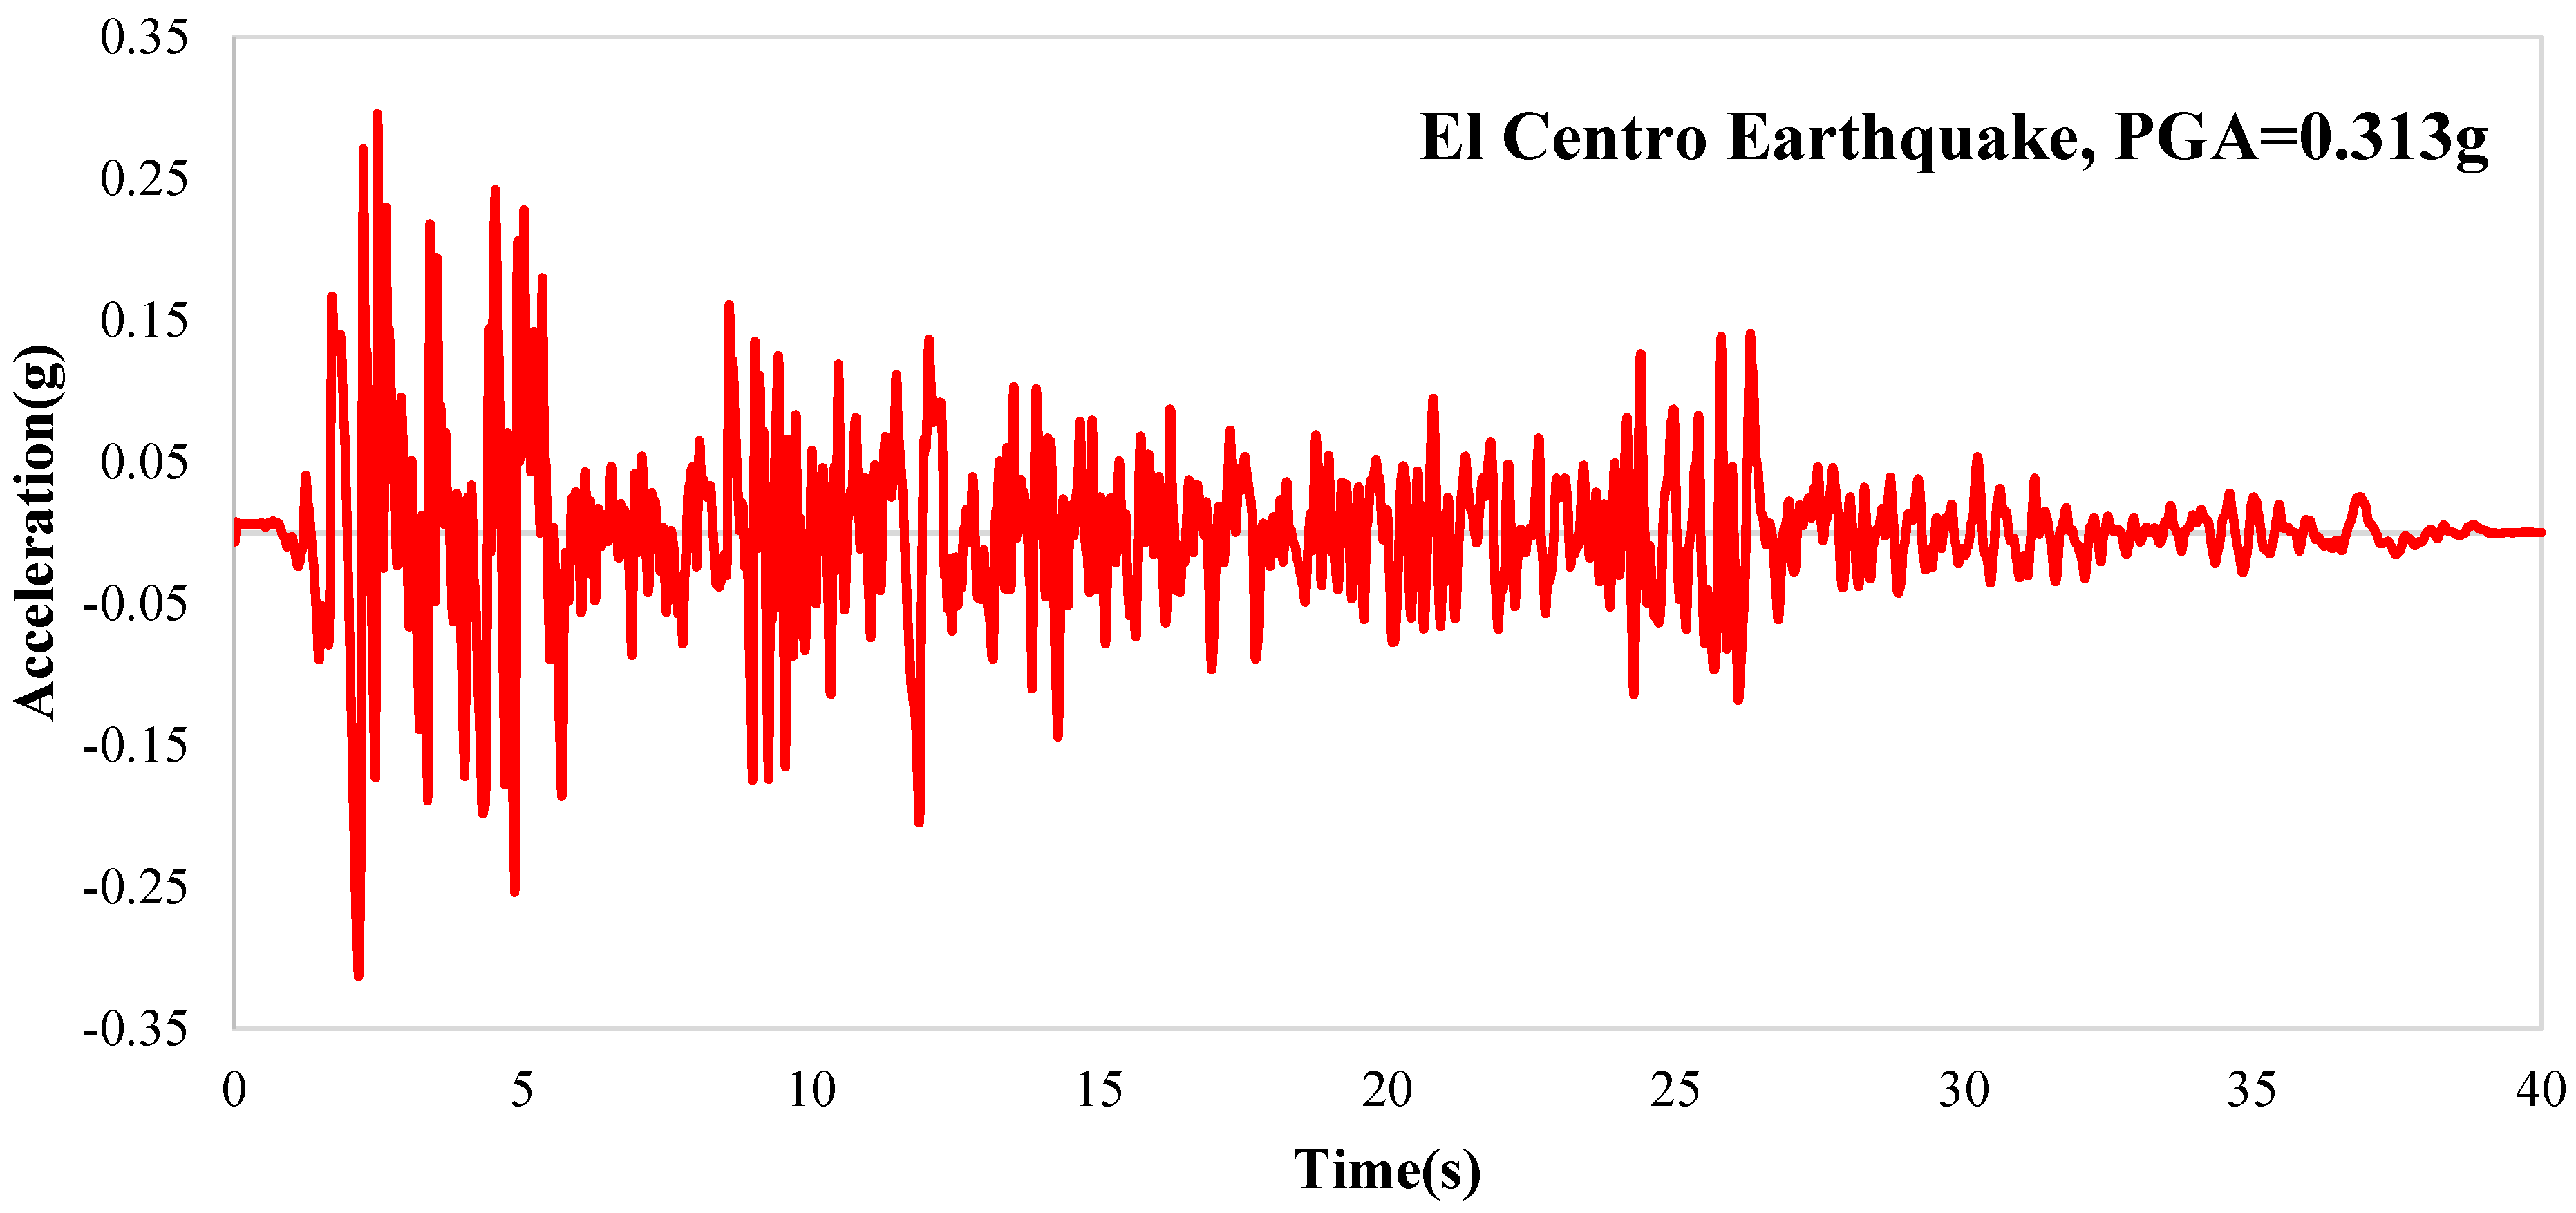
The base motion event used in this study is a scaled version of a motion recorded during the 1979 El Centro earthquake in California. Figure 3 shows the base motion acceleration time history used in DEEPSOIL analyses and DYPAC modeling.
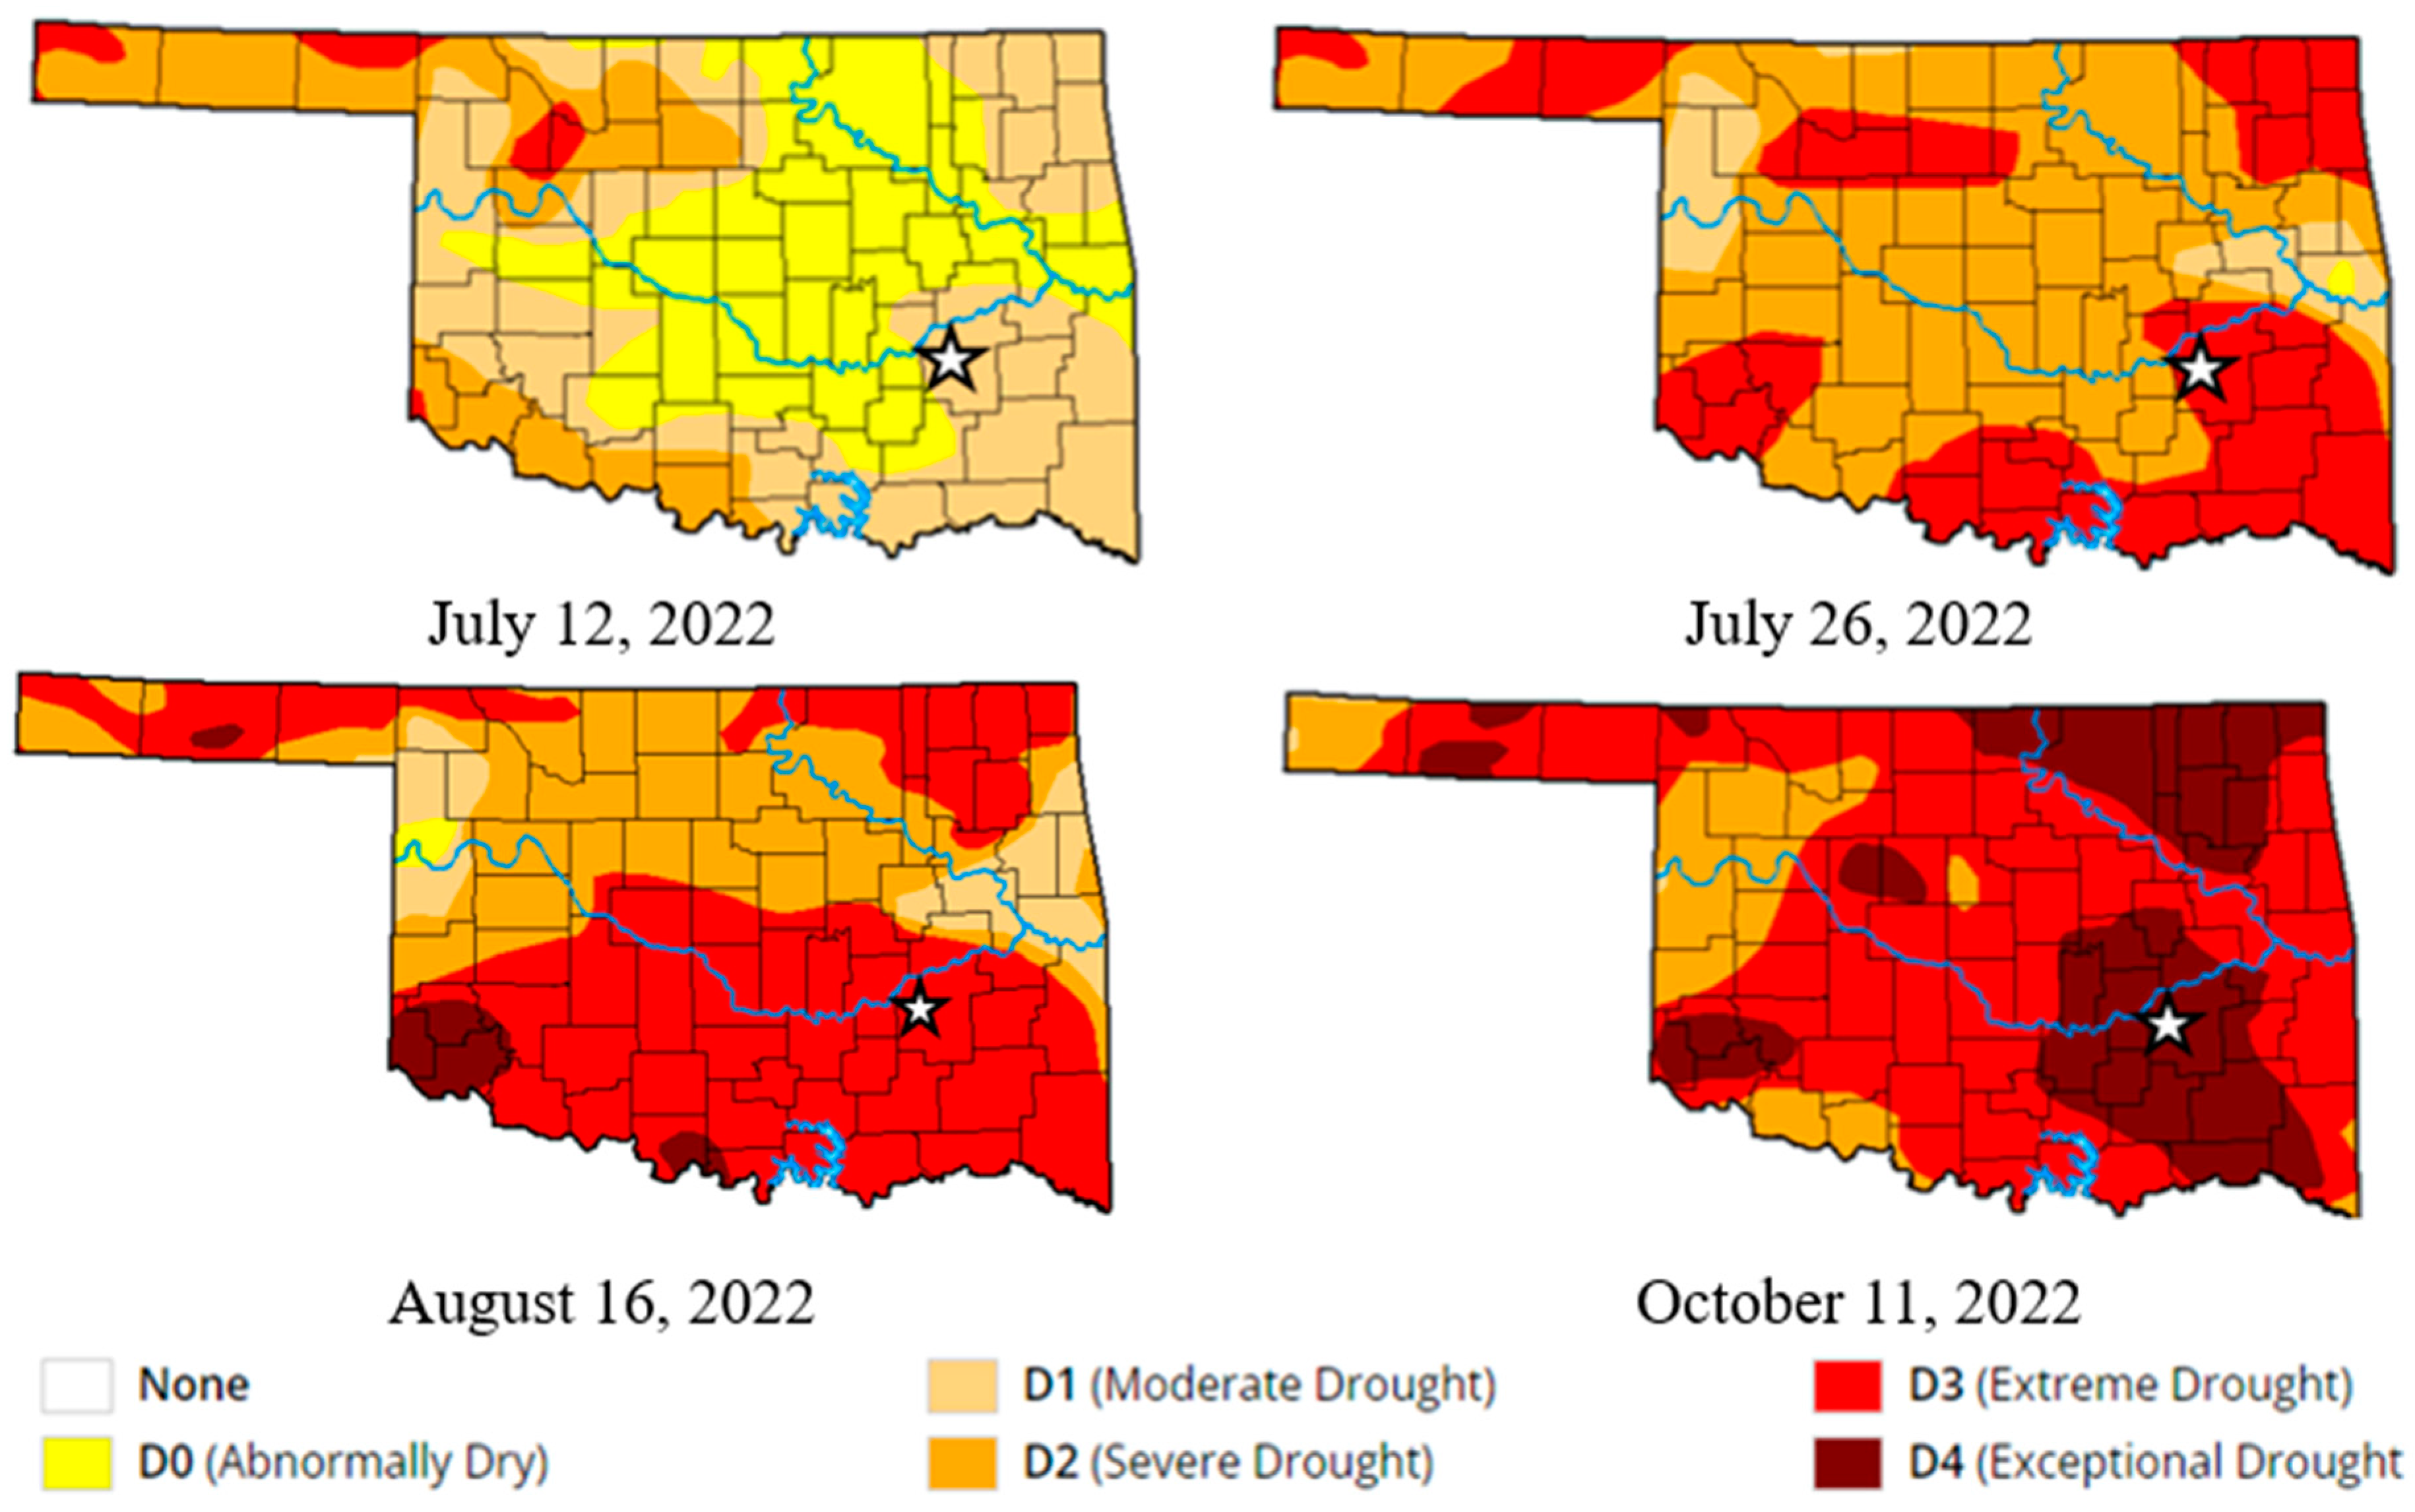
The testbed experienced back-to-back flash droughts in 2022. The first flash drought peaked in August and the second started in September and drought conditions lasted through October [35]. The variation in flash drought across Oklahoma in 2022 is shown in Figure 4. Pittsburg County is indicated by the white star in the image. It can be observed from the images that the back-to-back flash droughts resulted in exceptional drought conditions for the testbed.
Seepage analysis for each soil profile was conducted using the finite element software PLAXIS LE Groundwater [20]. PLAXIS LE Groundwater models seepage within the context of continuum mechanics and therefore assumes that soil phases can be described according to continuum mechanics. Furthermore, pore air including water vapor is assumed to behave as an ideal gas, thermodynamic equilibrium between liquid and vapor phases exists at all points in the soil and during all times of the analysis, and atmospheric pressure gradients are negligible. The software estimates the variation in soil moisture conditions as a function of weather input at the soil surface. Weather input for this study included precipitation, relative humidity, radiation, air temperature, and wind speed. The initial pore-water pressure is calculated according to hydrostatic conditions using the following equation:
u w = γ w h y
where uw is the pore-water pressure, γw is the unit weight of water, h represents the total water head, and y is the elevation. The phreatic surface occurs when h = y, saturated regions occur when h > y, and unsaturated regions occur when h < y. The initial groundwater table for the soil model was set at a depth of 50 m resulting in an initial maximum soil suction of 490.5 kPa at the surface. The initial moisture profile was identical for each soil profile since the pore-water pressure was initialized independent of soil properties according to Equation (9). The soil moisture profiles quickly deviated from the initial values as a function of soil properties and weather loading on the model.
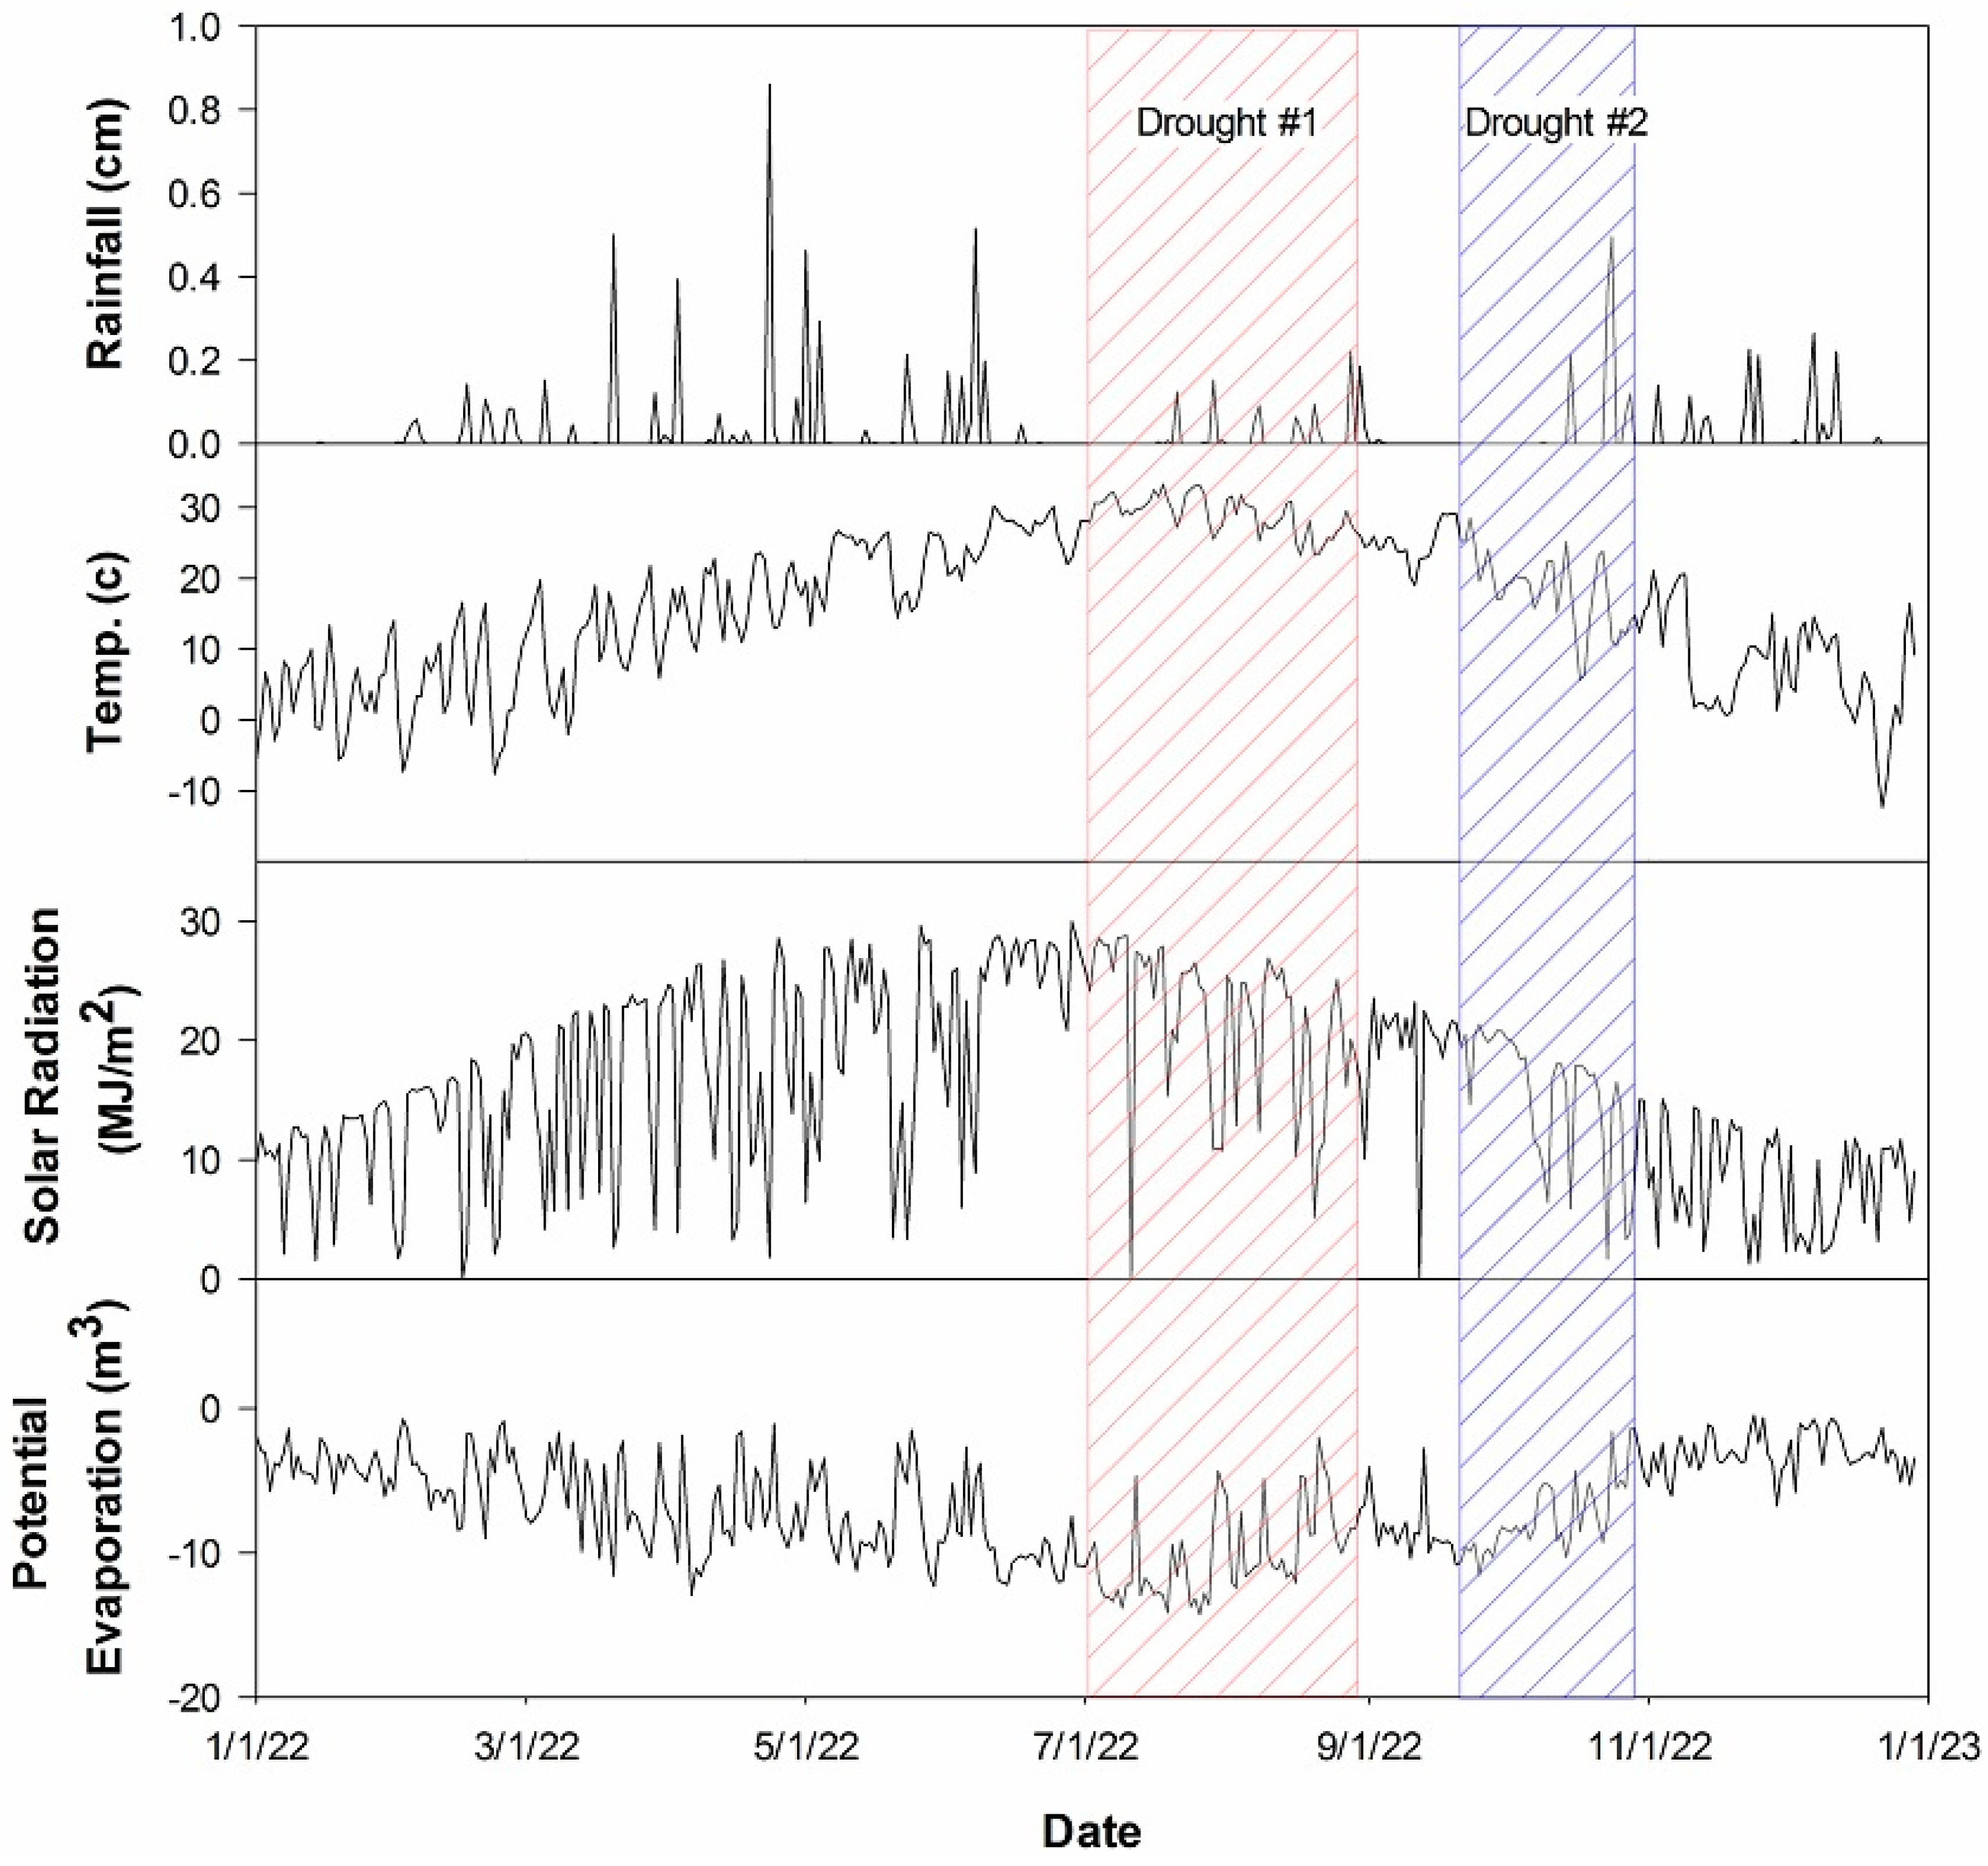
Daily weather data collected by the Pittsburg County Mesonet station was used in the seepage analysis to capture the impacts of weather variations on soil suction. The Mesonet network is a system of weather stations throughout Oklahoma that are monitored and maintained by the University of Oklahoma and Oklahoma State University [36,37]. The weather data collected at the Pittsburg County Mesonet and used in this study are shown in Figure 5. The potential evaporation as estimated by PLAXIS LE Groundwater during the analysis for this weather data is also included in the figure. The flash droughts can be observed in Figure 5 according to the rainfall data. There is a delay between dry conditions and droughts. The same is true for ending the drought. Rainfall events occurred during August, but the drought persisted during this time.
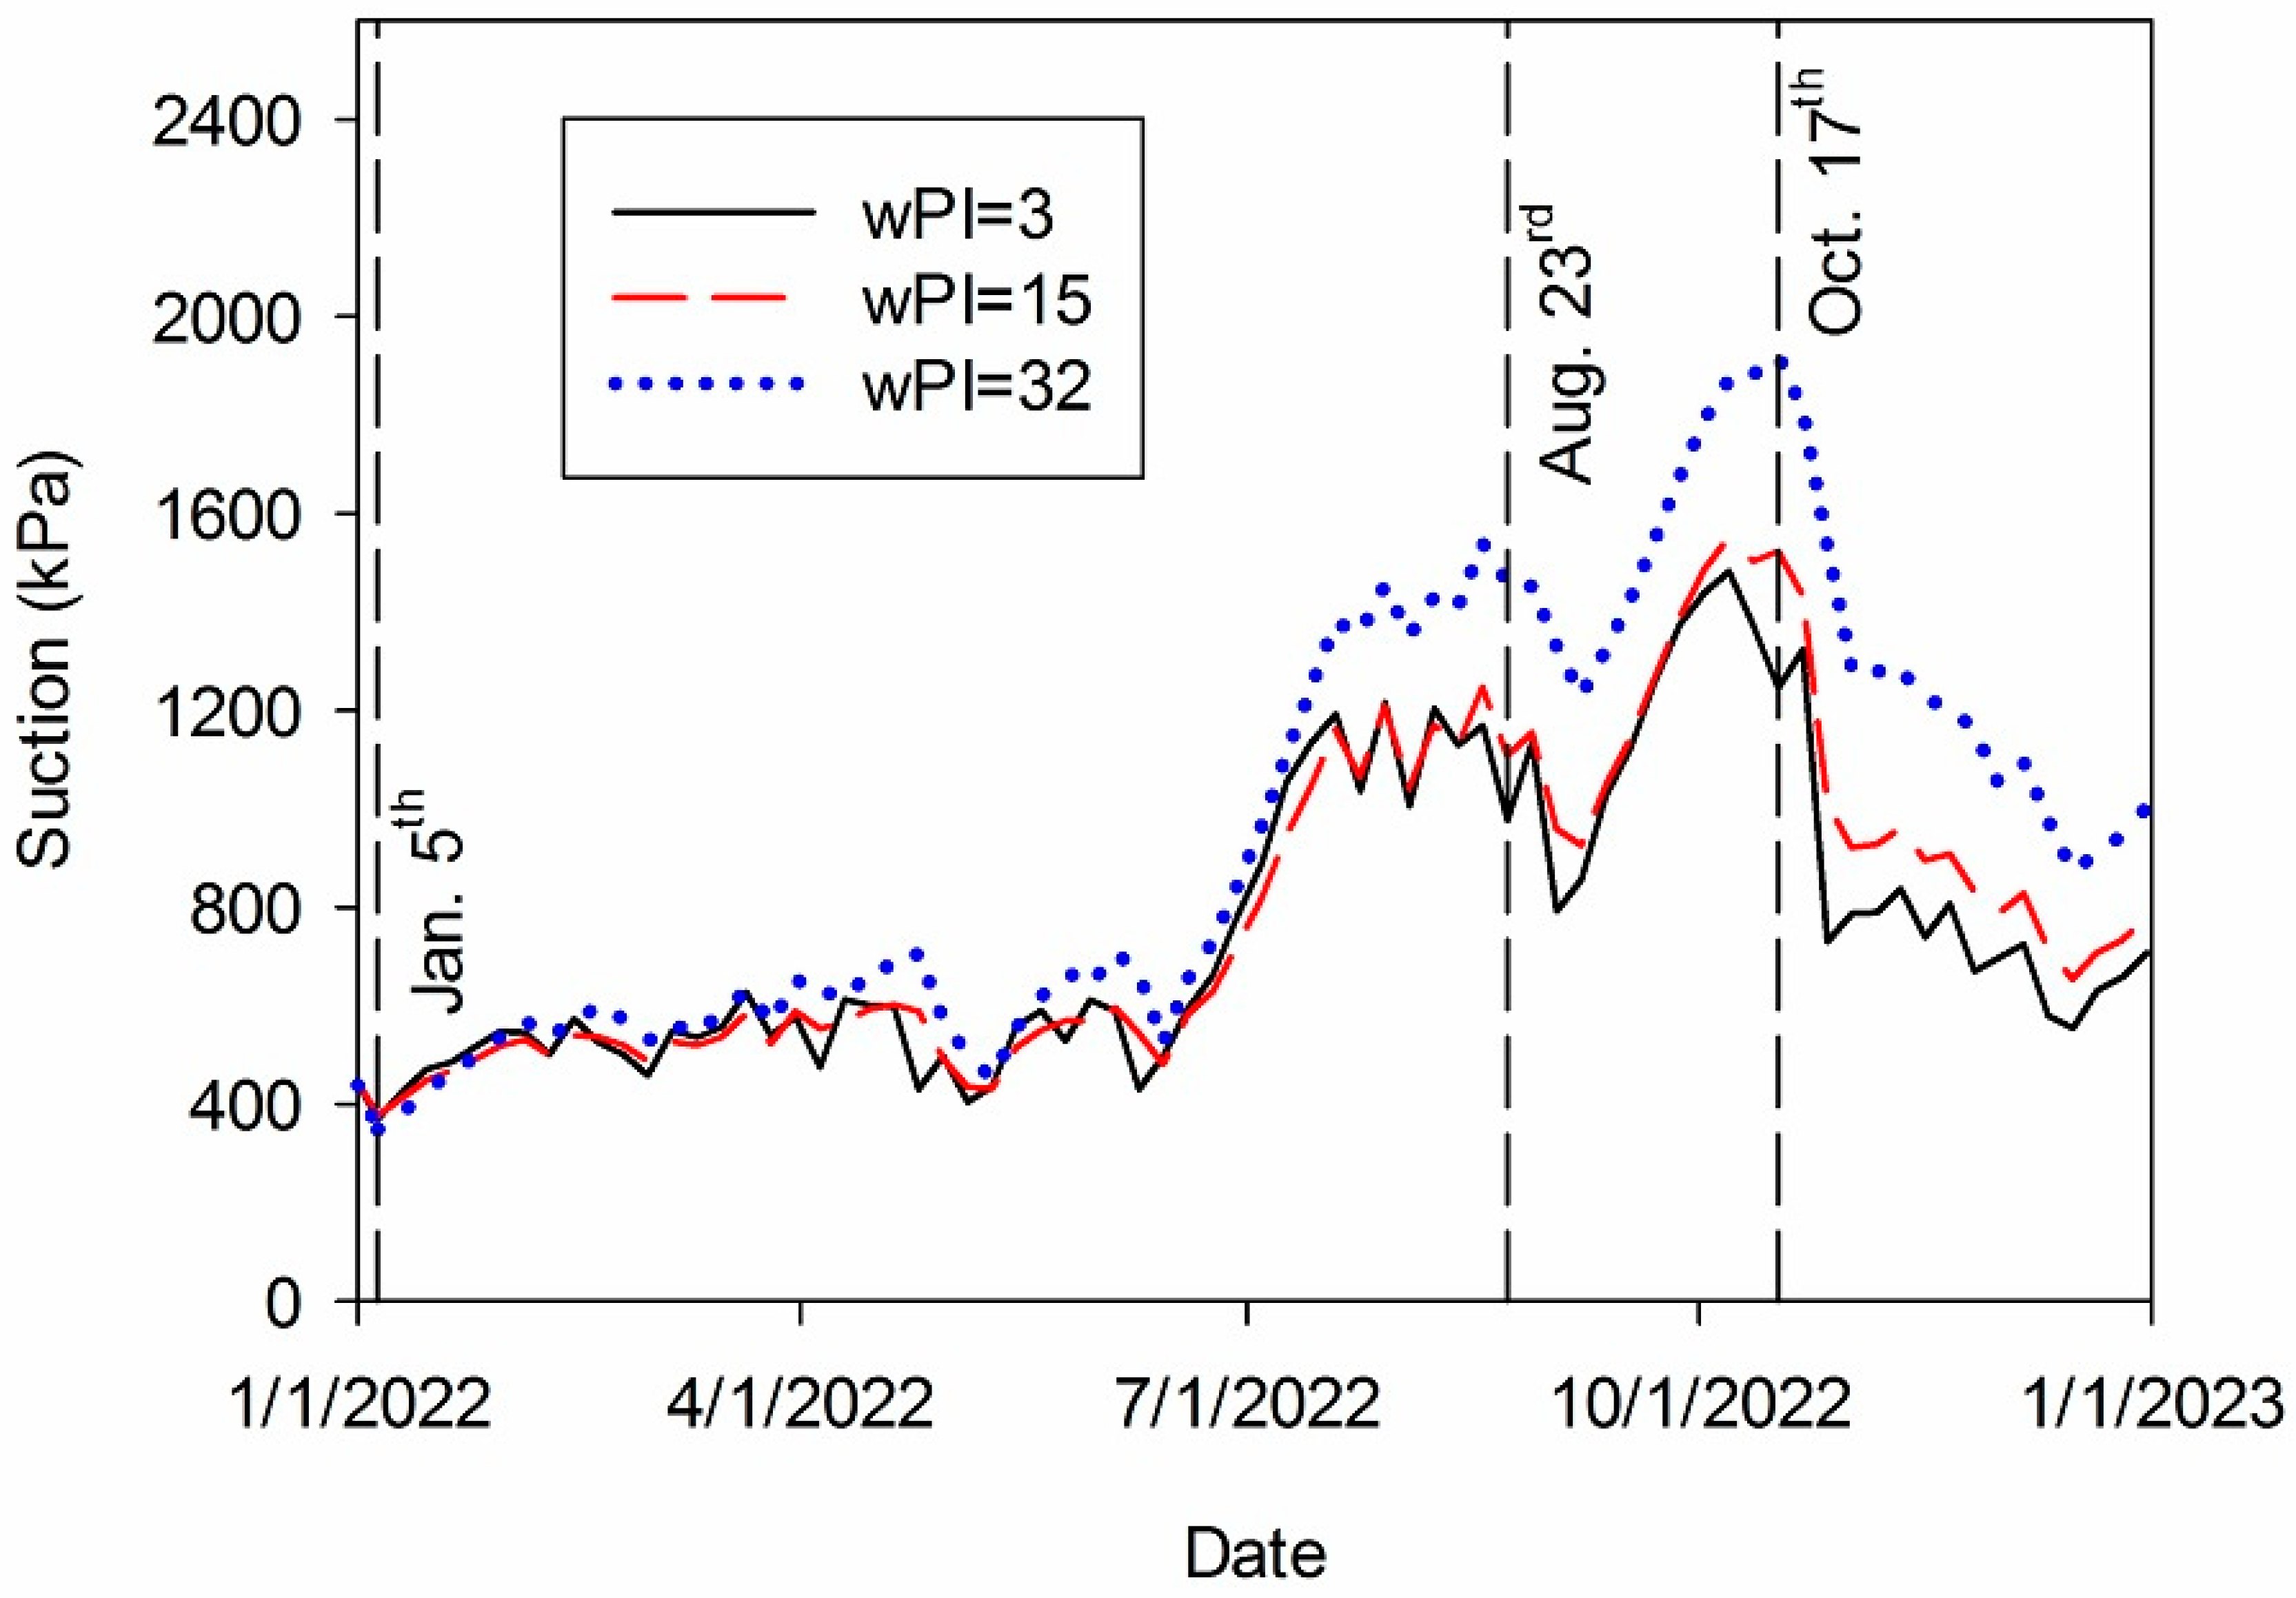
The permeability of unsaturated soils is related to the soil suction according to the SWCC for the soil. The change in permeability with respect to soil suction was estimated by the software according to Fredlund et al. [38]. The seepage analysis was conducted using 1D conditions. The 1D column of soil had a height of 50 m and contained 100 elements with a uniform height of 0.5 m. The suction for the wPI = 3 soil was found to vary erratically for shallow depths (less than 1 m) throughout the analysis. The variation in suction throughout the analysis at a depth of 1.5 m is shown in Figure 6. At this depth, most of the erratic variations in suction are not present. The effects of the first flash drought are shown as the first large increase in suction during July. A series of rain events in August provides some moisture to the soil reducing the suction between the two events. The rain events occurred on 8, 17, 21, 29, and 31 August. The total rainfall from this series of events was 8.3 cm. It should be noted that for events such as these, the suction remains elevated above baseline conditions despite the temporary brake in the drought. The second flash drought begins shortly after these rain events and takes the soils to higher suction levels than the first flash drought. The effects of back-to-back flash droughts are apparent from Figure 6. Without proper time to return to the baseline conditions, the soil will dry out more than it would have otherwise.
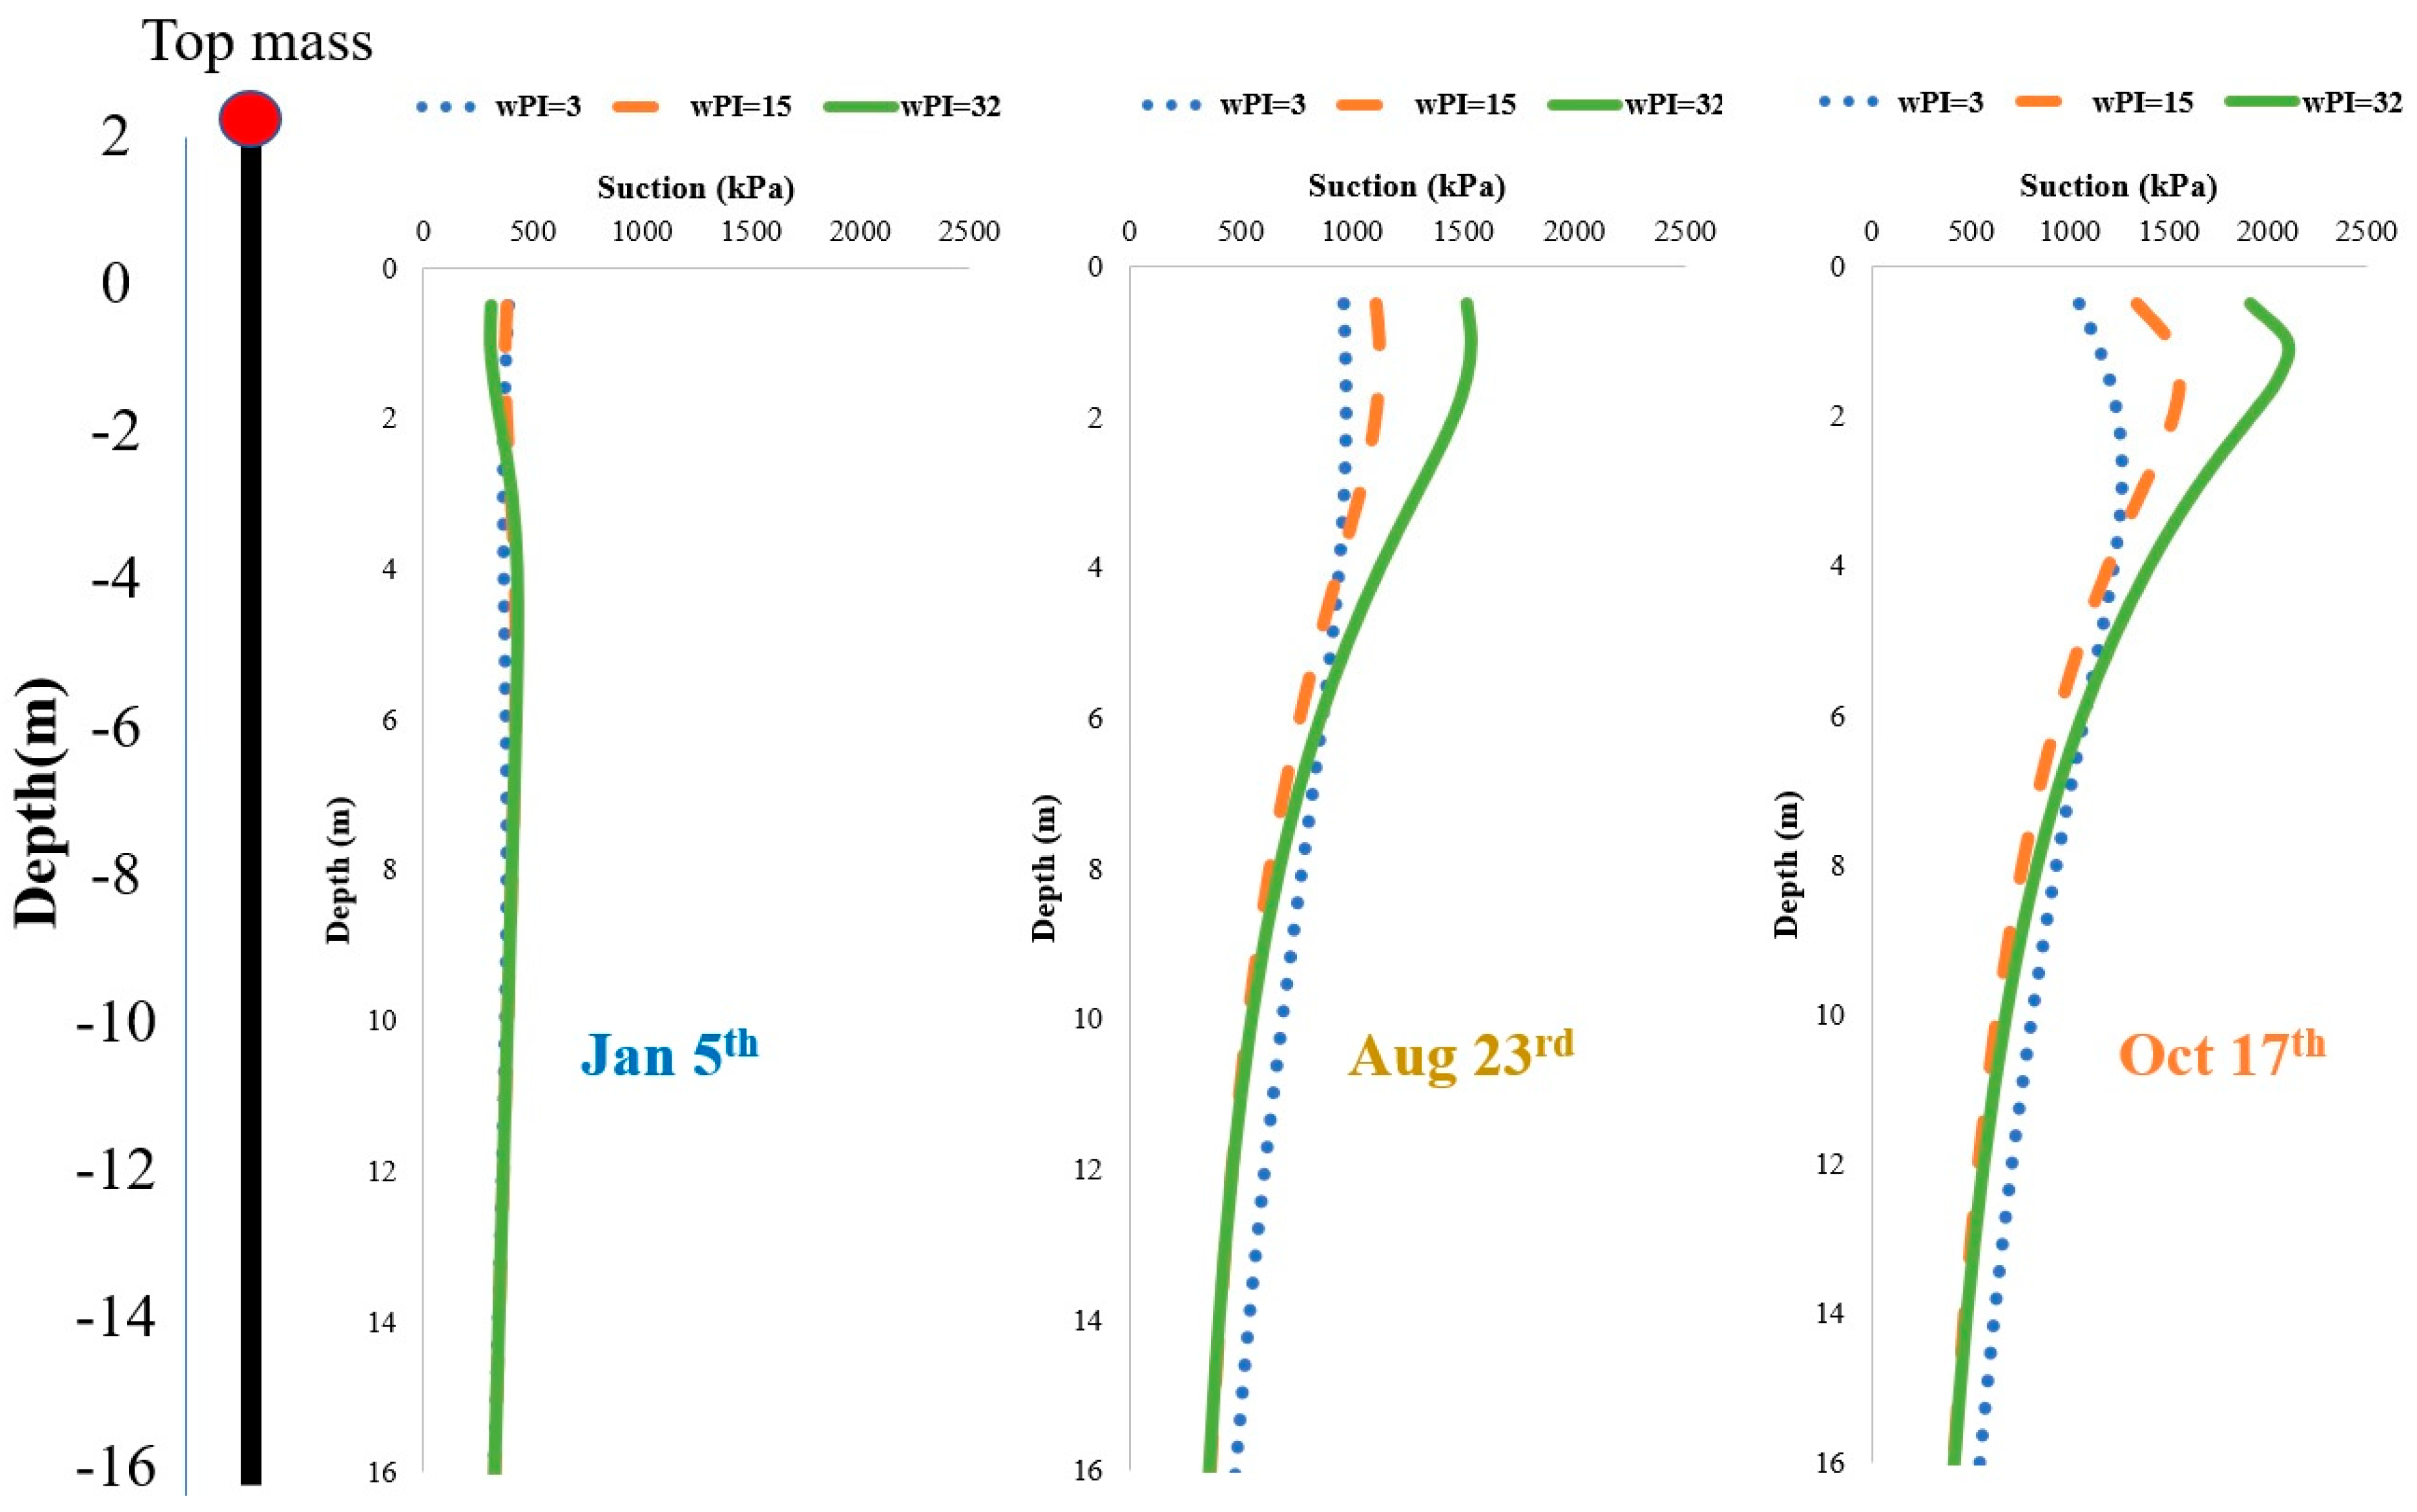
Soil suction profiles for the soil column were obtained on three dates: 5 January, 23 August, and 17 October. The first date represents the soil under initial conditions. The second and third dates occur when the first and second droughts are at their maximum with respect to soil moisture. It should be noted that the second profile occurs after several of the rain events that caused the end of the first drought. However, at this time only 3.7 cm of rain has entered the model. These small rain events set the stage for ending the drought, but the suction remains relatively high in the soil during this time. This can be observed in Figure 6 by the spikes in soil suction proceeding the valley in the profile between the two events. Soil suction profiles for the three study soils on these dates are shown below in Figure 7. As shown in the figure, the variations between different soil types are minimal for the 5 January profile and become pronounced for the 17 October profile. During drought periods, higher values of suction are observed for the higher wPI soils in the top 5 m of the soil profile. Beyond this depth, there is some deviation between the profiles, but the overall trend is consistent between the three profiles.
As shown in Figure 7, the pile has a length of 18 m and 2 m of the pile was assumed to be above the ground surface. The pile diameter was assumed to be 0.3 m. The analysis also includes a seismic mass of 660 kg on top of the pile.

4. Results and Discussion

The results obtained from the investigation of the role of moisture conditions and soil suction on the seismic response of pile foundations in clayey soils are presented and key findings are discussed in this section. The primary focus is to illustrate the impact of varying moisture content, driven by extreme weather patterns, on free-field soil displacements, p-y curves, and ultimately on the response of pile foundations. The results presented here are derived from simulations using DEEPSOIL and DYPAC, incorporating realistic soil suction profiles obtained by PLAXIS LE as shown in Figure 7. The results of these analyses are presented in Figure 8, Figure 9, Figure 10, Figure 11, Figure 12, Figure 13, Figure 14 and Figure 15 and observed trends and patterns are systematically discussed. The discussion starts with the site response analyses followed by the effects of moisture variations on the p-y curves, illustrating how changes in soil moisture content influence free-field soil displacements and the lateral soil resistance, respectively. Finally, these findings are integrated to evaluate the seismic response of pile foundations impacted by moisture variations. The results underscore the significance of moisture variations on soil–pile interactions, highlighting the necessity for incorporating these factors in seismic design considerations.
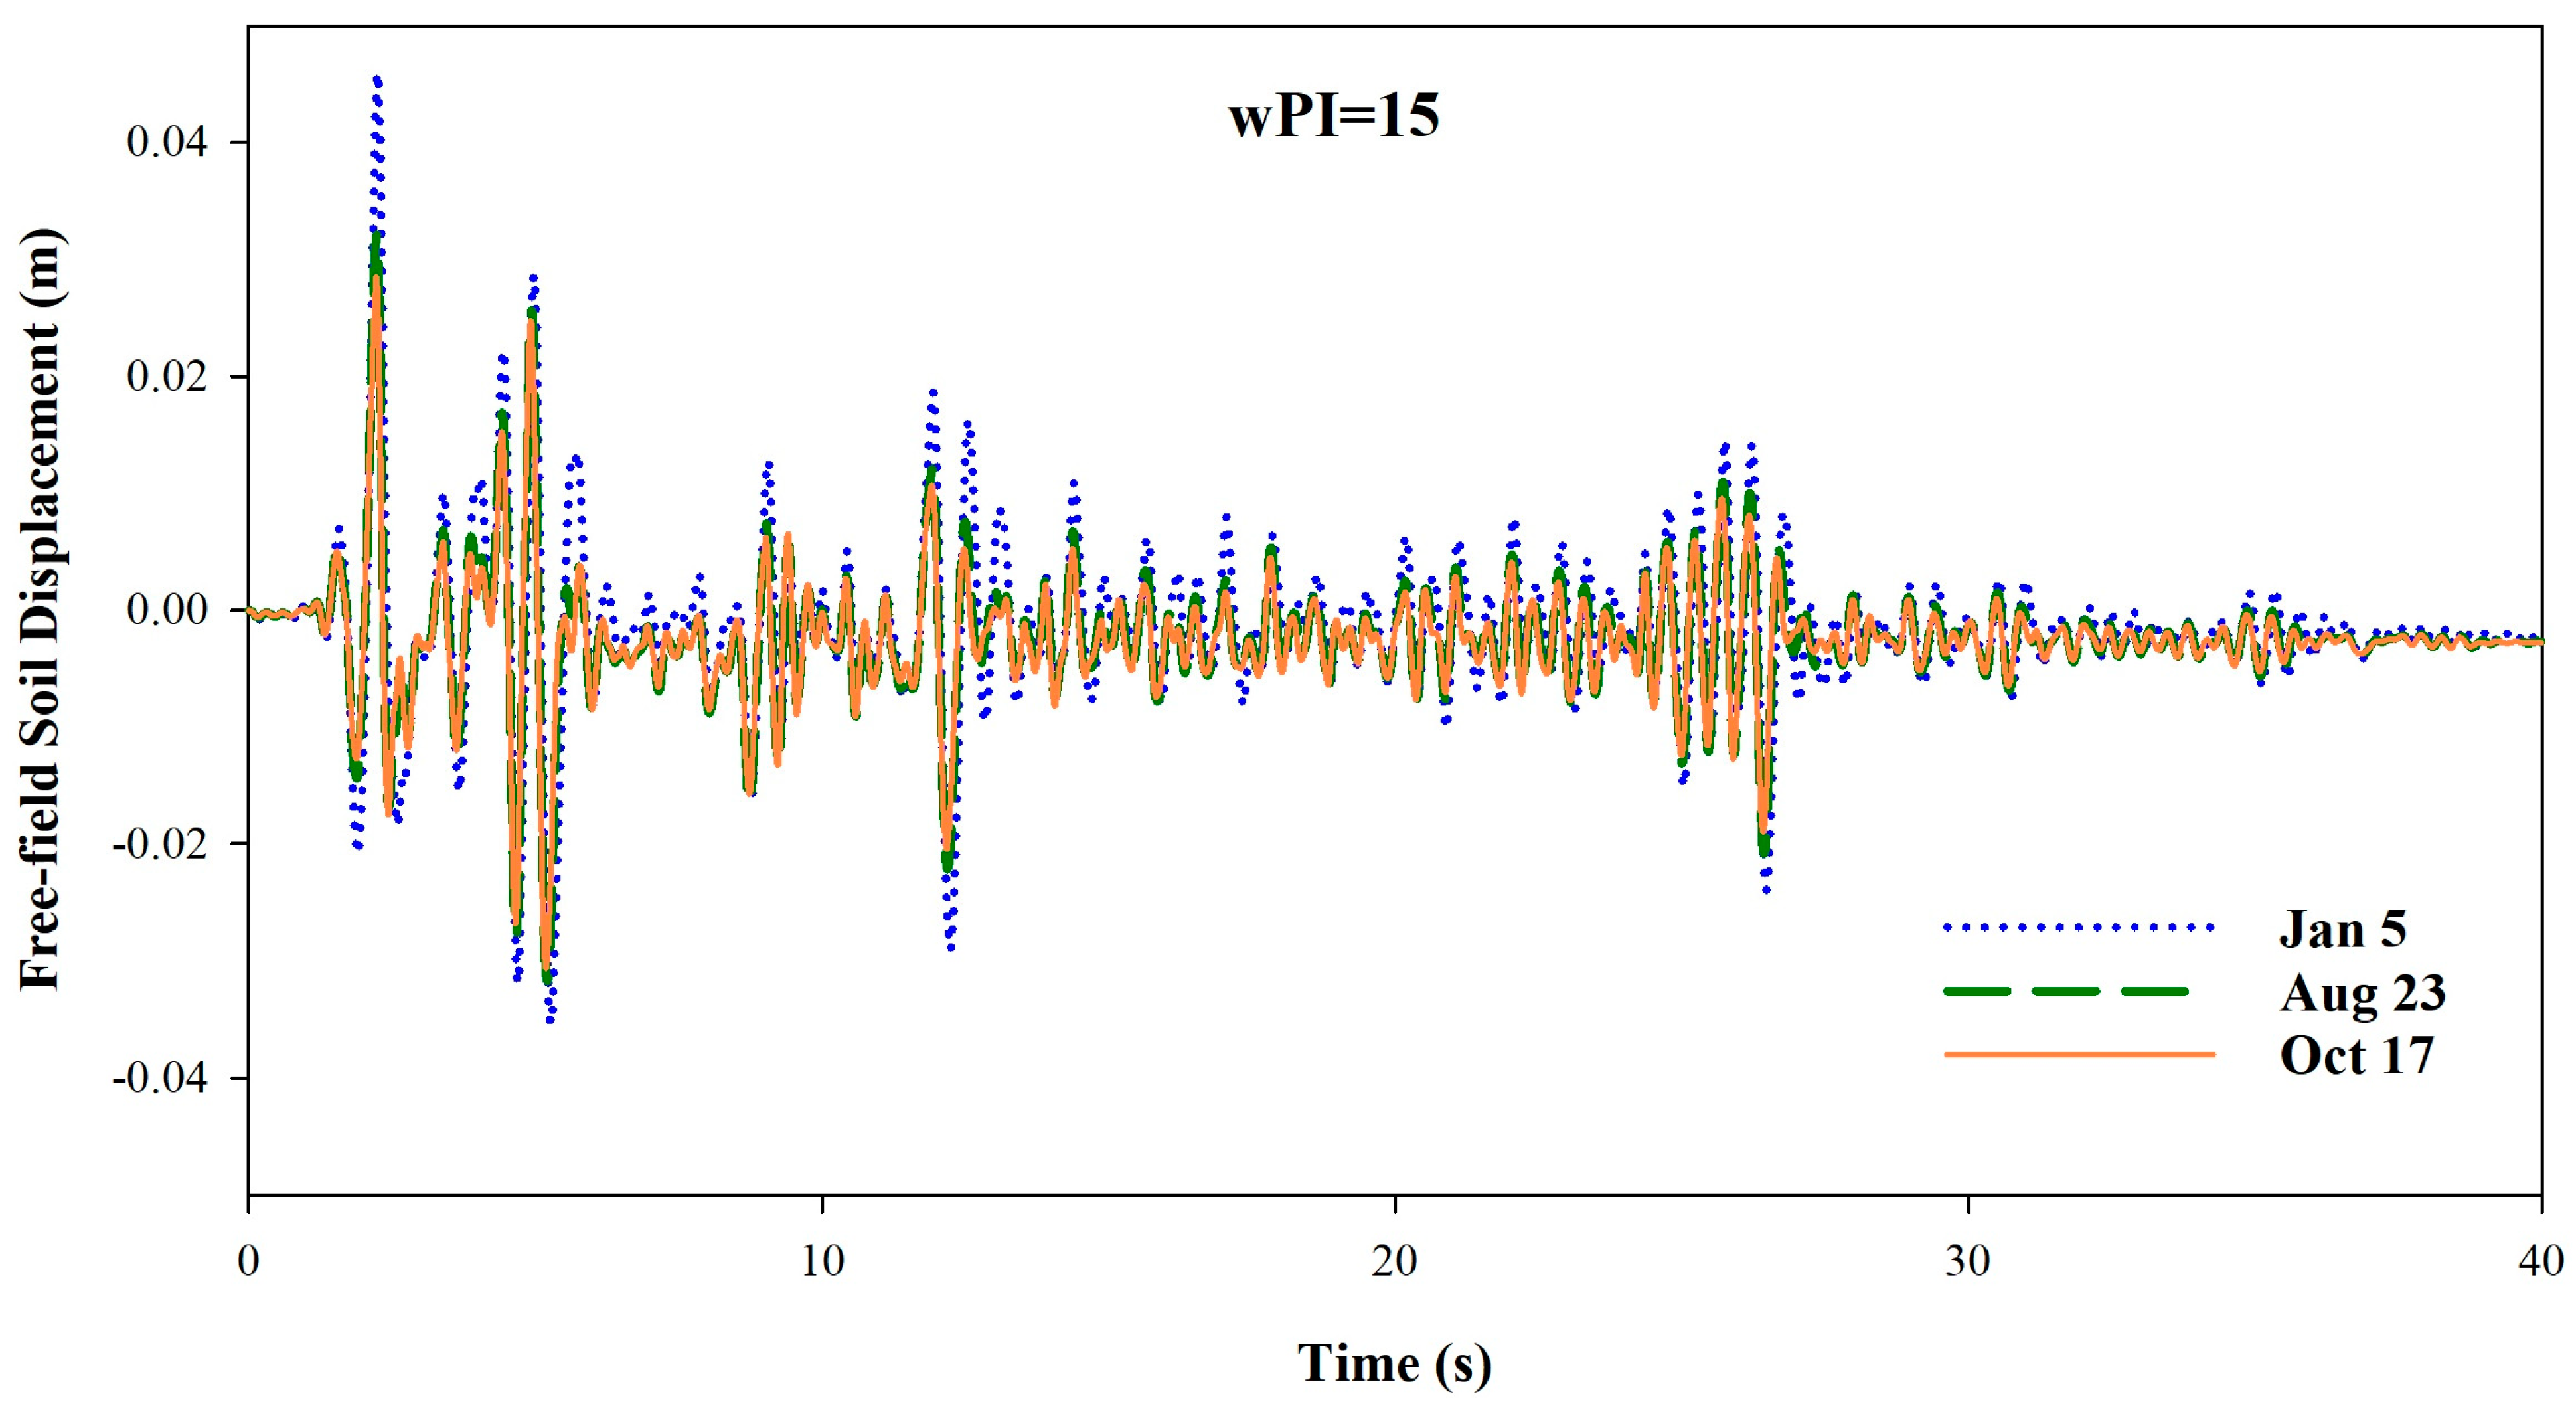
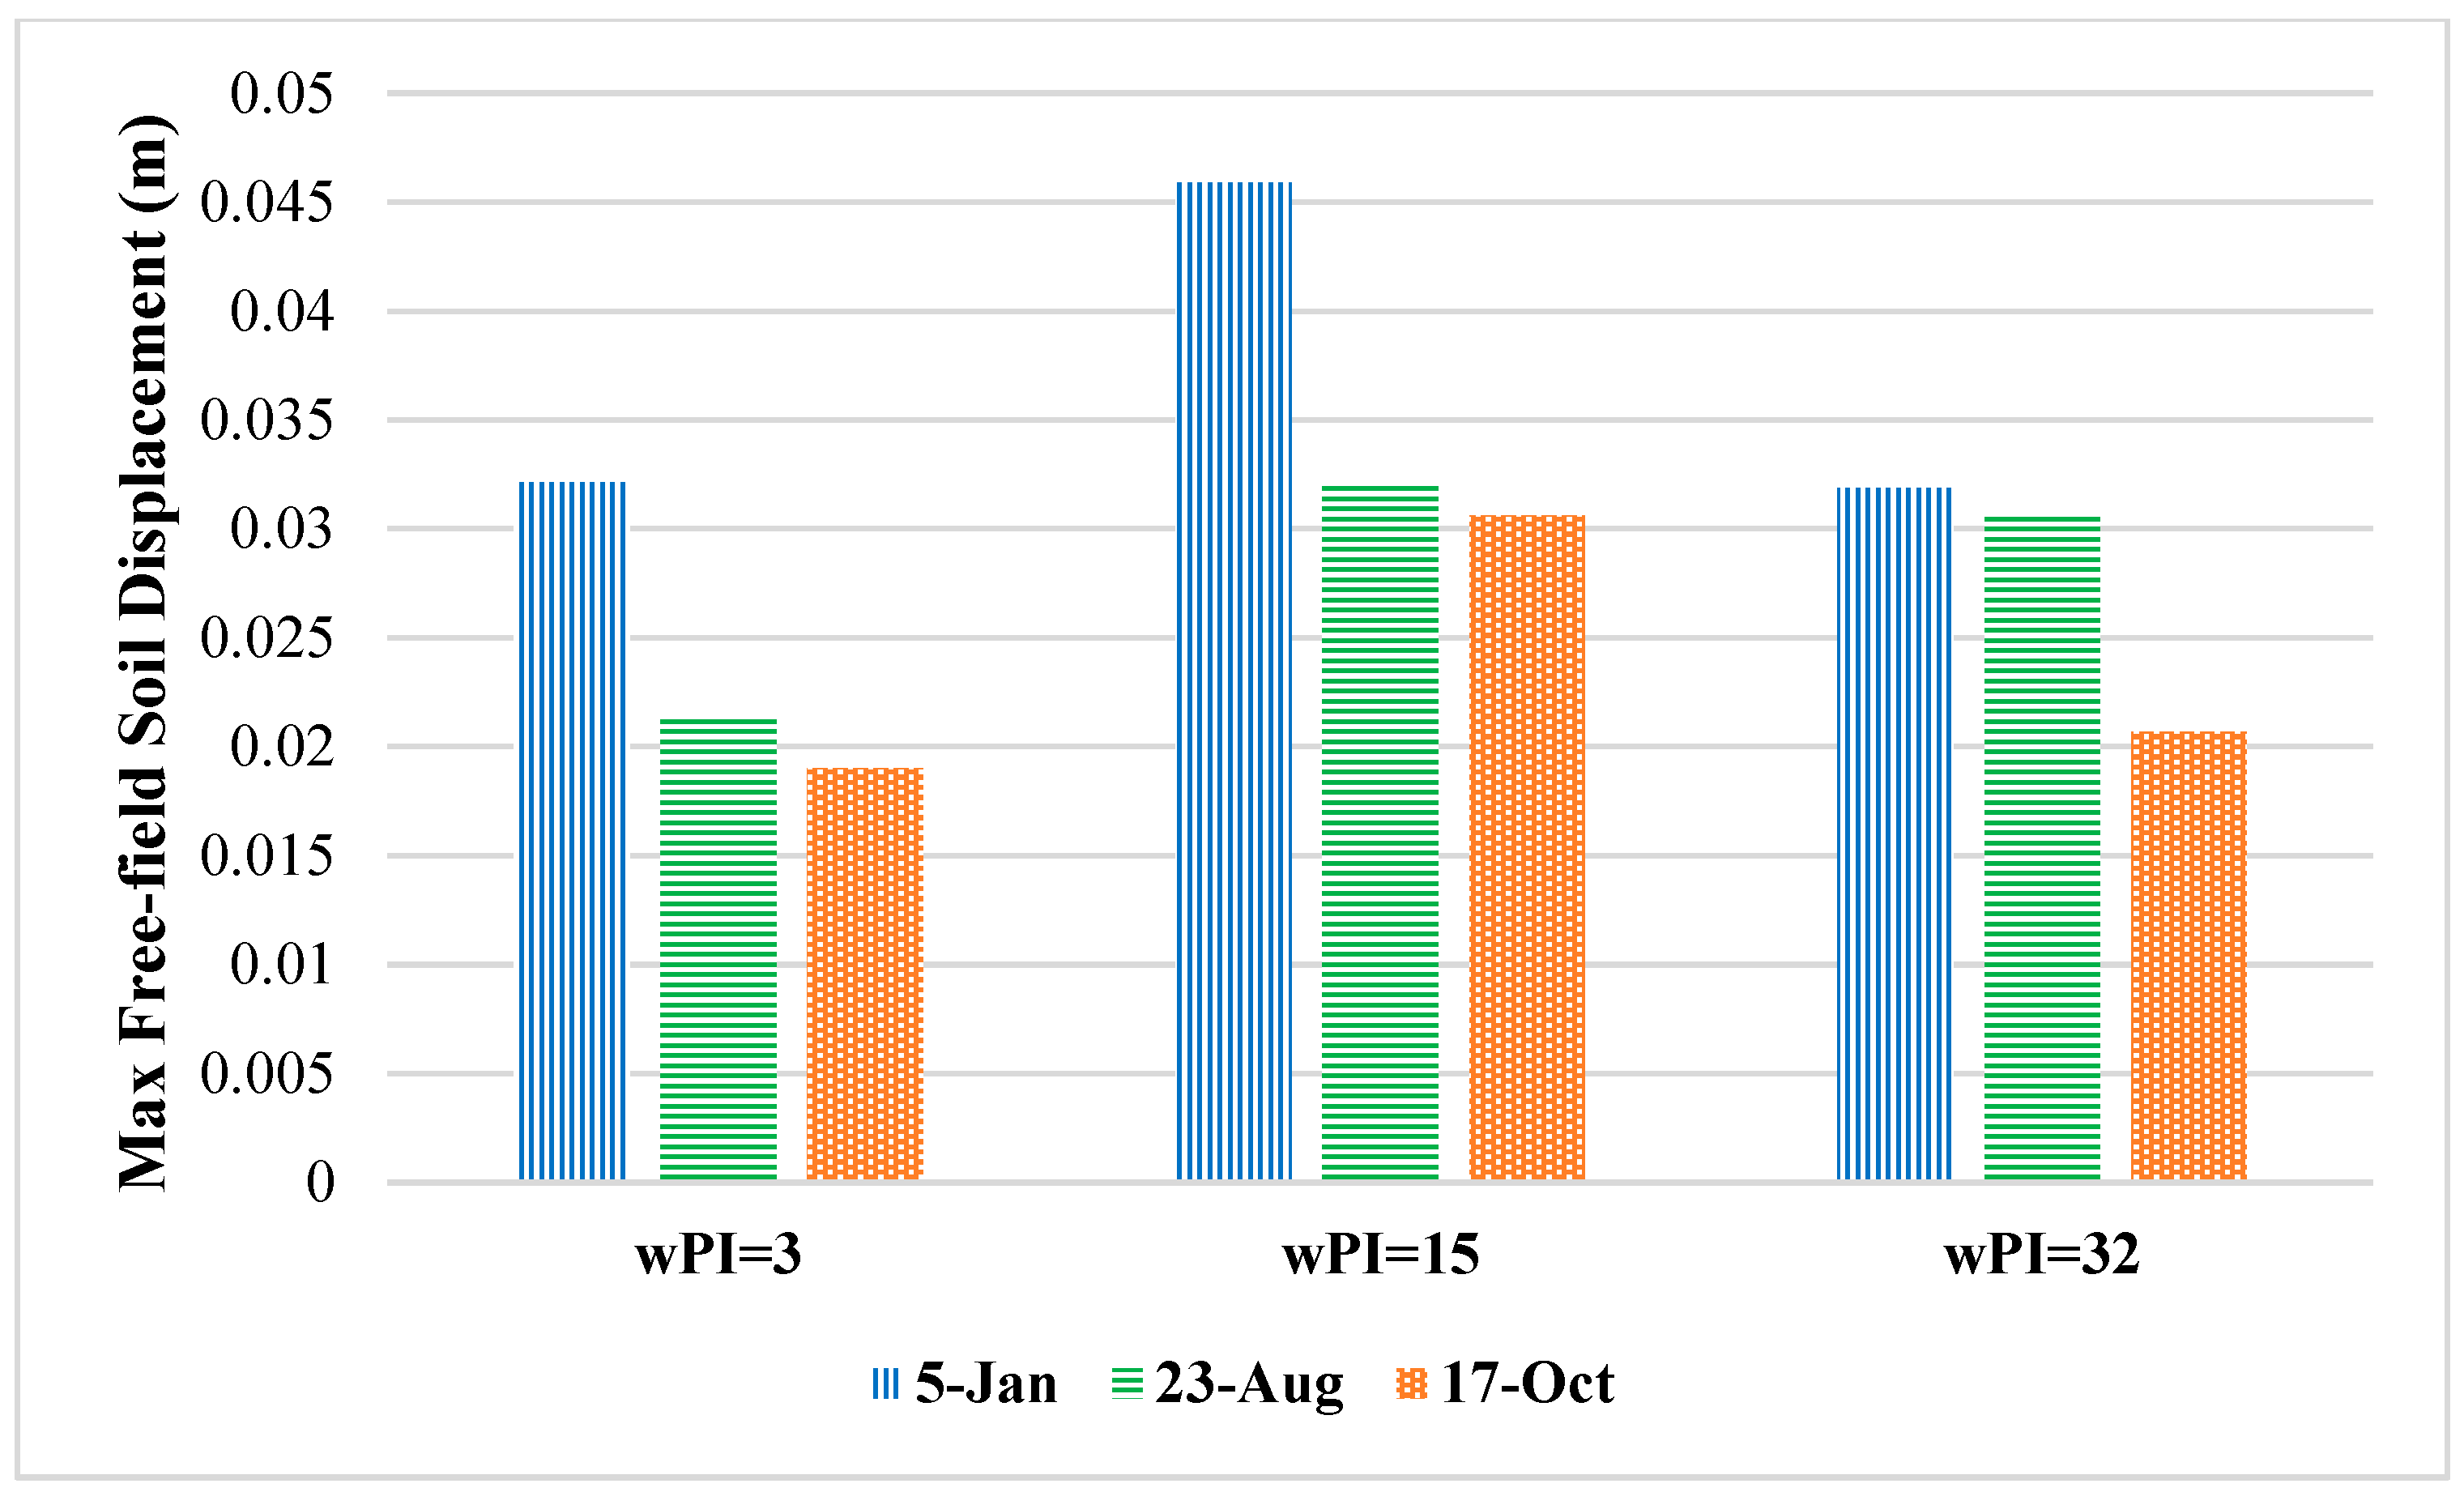
Site response analyses were performed using DEEPSOIL to obtain the free-field soil displacements as input for DYPAC analyses. As shown in Figure 8 and Figure 9, the free-field soil displacements at the node on the ground surface are compared for different suction scenarios based on the weather conditions. These serve as examples of free-field soil displacement analyses conducted to prepare input for DYPAC analyses. Figure 10 compares the maximum free-field surface soil displacement in different seasons for different soil types. As shown, for each soil type, the minimum displacement is associated with 17 October when the maximum drought occurs, which is reasonable because of the high value of soil suction in dry seasons. In all three soil types, the maximum free-field surface soil displacement on 5 January is almost 1.5 times that of 17 October. Soil suction is incorporated into the free-field displacement analysis through modification of the shear wave velocity according to Equation (5). According to Equations (5) and (6), higher suctions will result in larger shear strengths and shear wave velocities. Higher shear wave velocities result in higher shear modulus (Gmax) values and, in general, result in lower displacements at the ground surface.
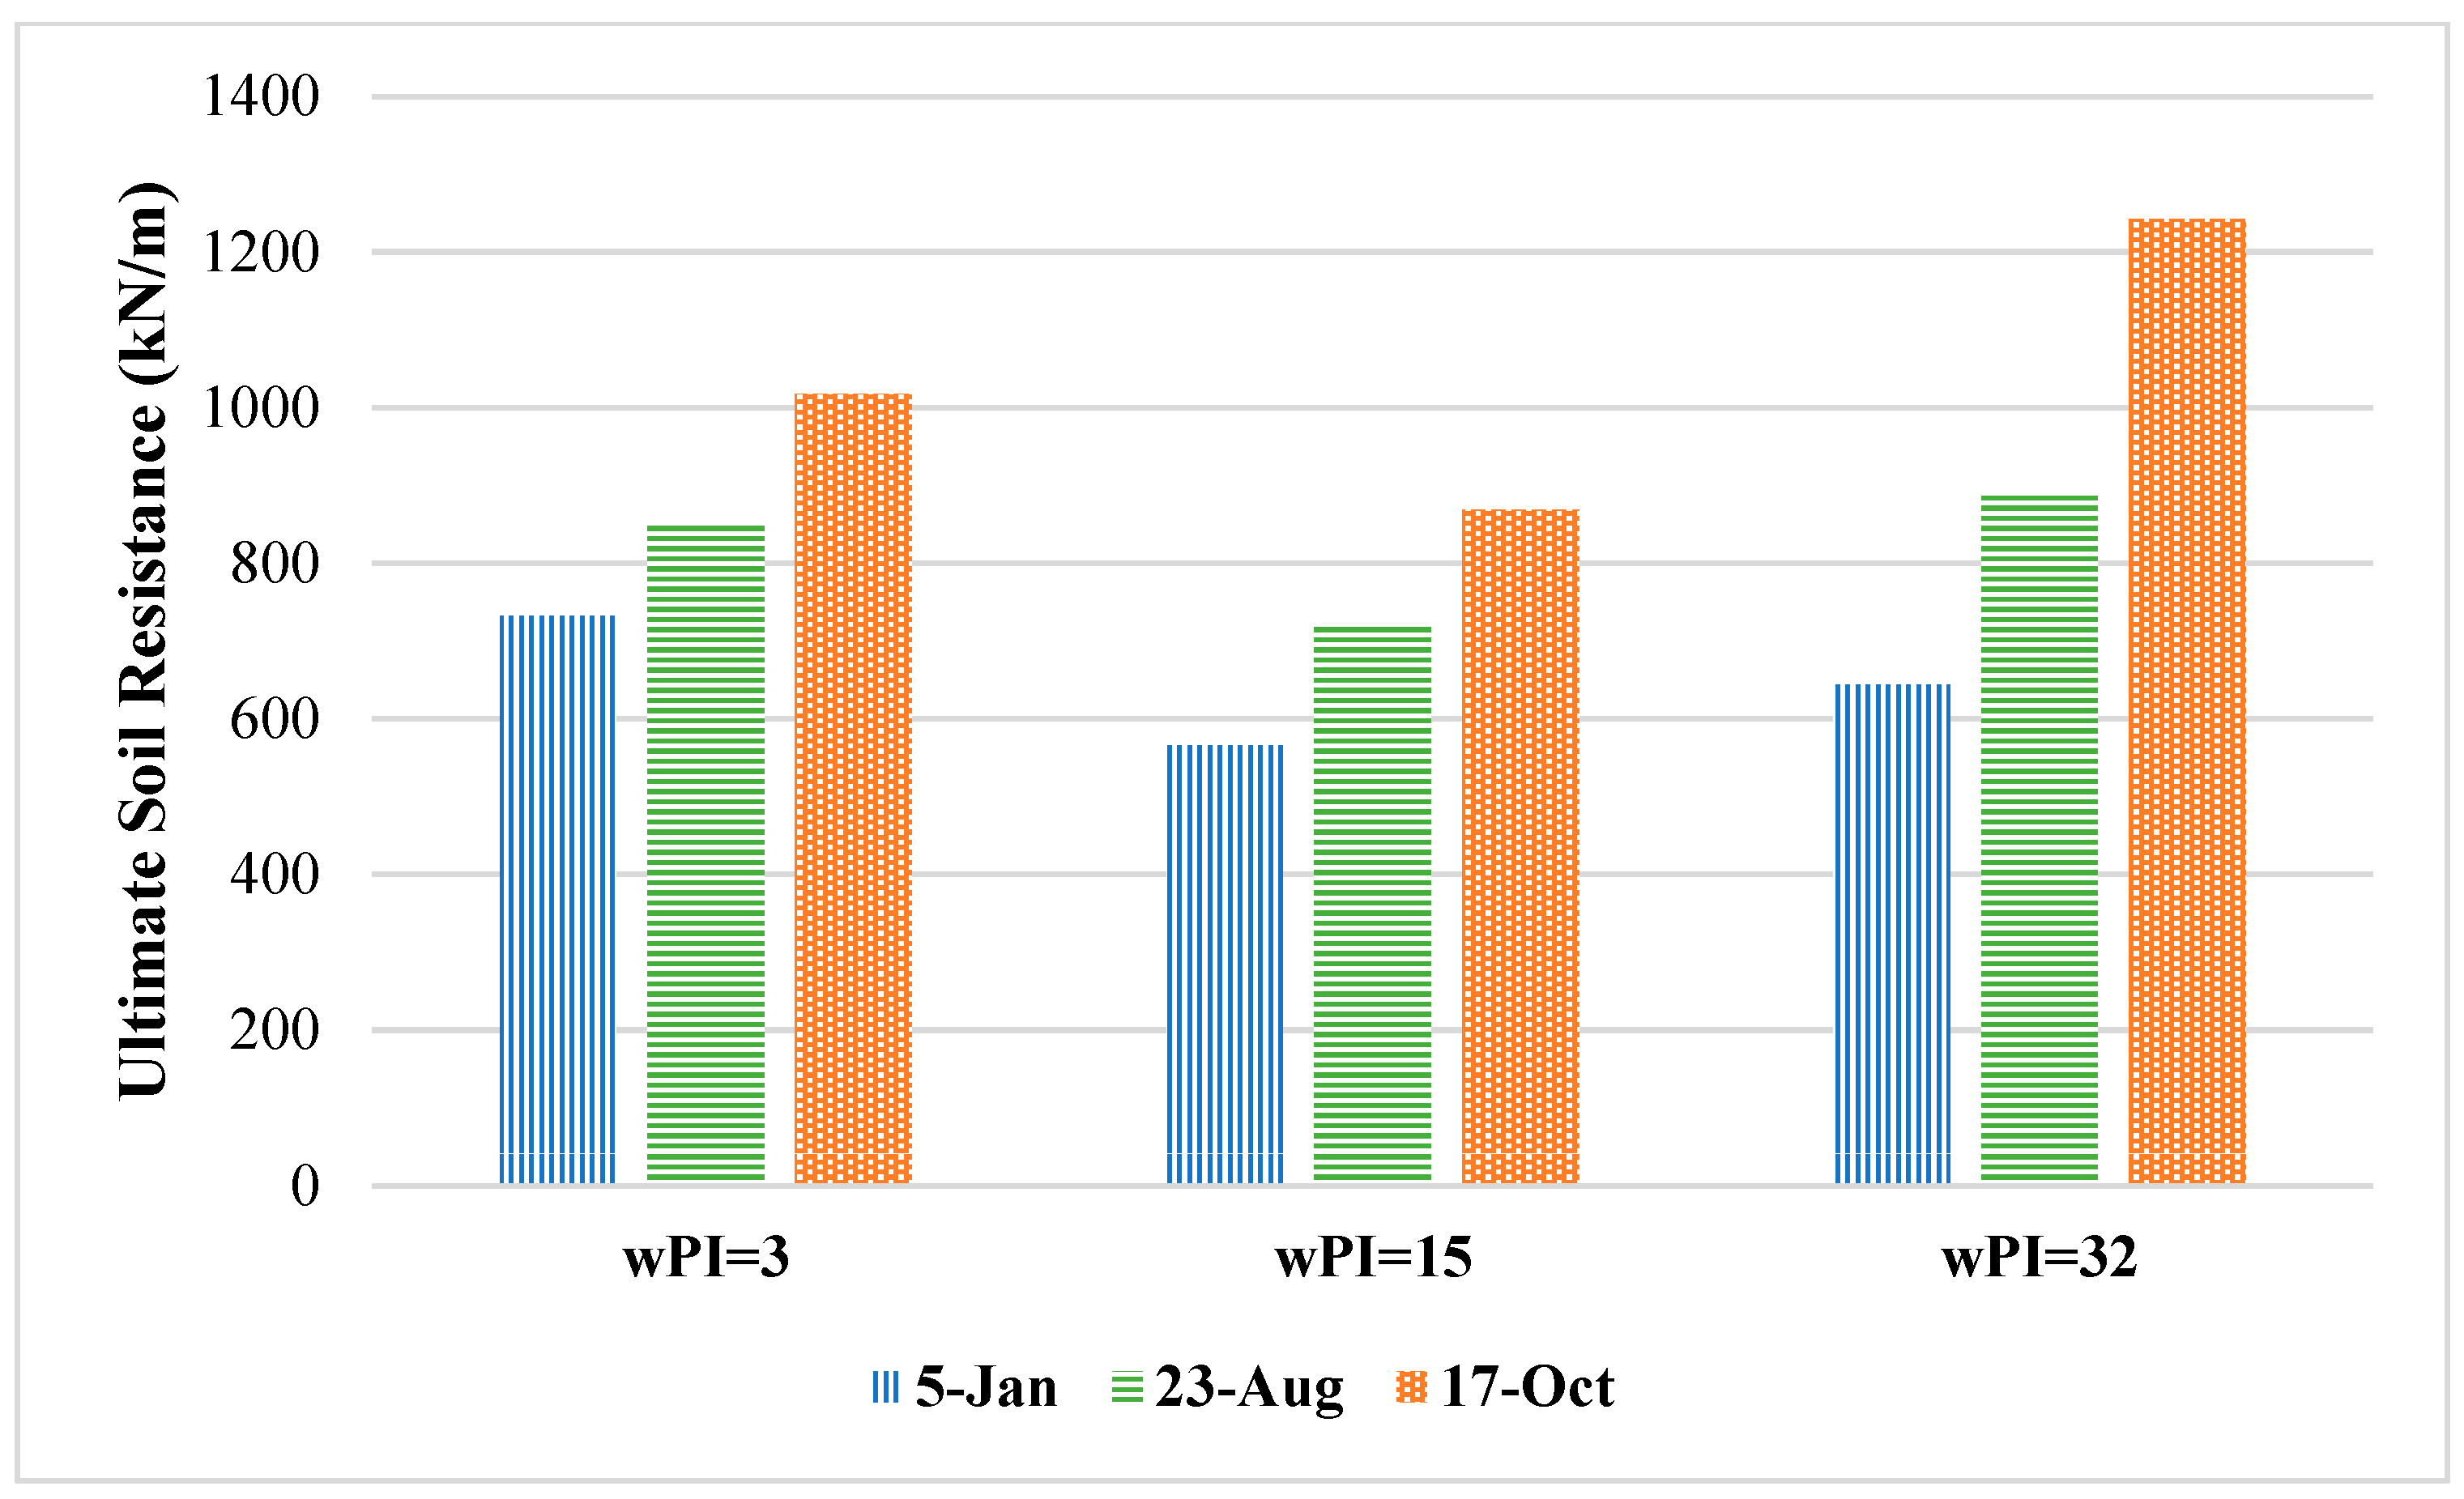
The influence of soil suction is also incorporated into the p-y curves to consider the effects of seasonal moisture changes in soil–pile interaction. The p-y curves for various weather and soil-type scenarios were evaluated using the Boulanger et al. model [18]. As shown in Figure 11, the ultimate lateral soil resistance increased with the soil suction in the dry period for each soil type. The wPI = 15 soil had lower pult values for each of the conditions considered, which is counter intuitive. We would expect that the wPI = 3 profile would have the lowest pult values for the range of conditions. The observed behavior is a function of the moisture migration analysis, the initial parameters, and the relationship used to define cu. It can be observed from Equations (1)–(3) and (5) that the soil’s effective friction angle and suction have a profound influence on the calculation of pult. For example, the wPI = 3 soil had the highest value of pult on January 5 despite the suction being very similar for each profile. This soil also has the highest effective friction angle. At the height of the droughts the wPI = 32 soil had the largest value of pult despite having the lowest effective friction angle. The wPI = 15 soil had an effective friction angle in between the other two soils but had the lowest calculated maximum pult value on each of the dates. This interesting relationship highlights the complexity of the problem since there are many parameters influencing the behavior of the soil.
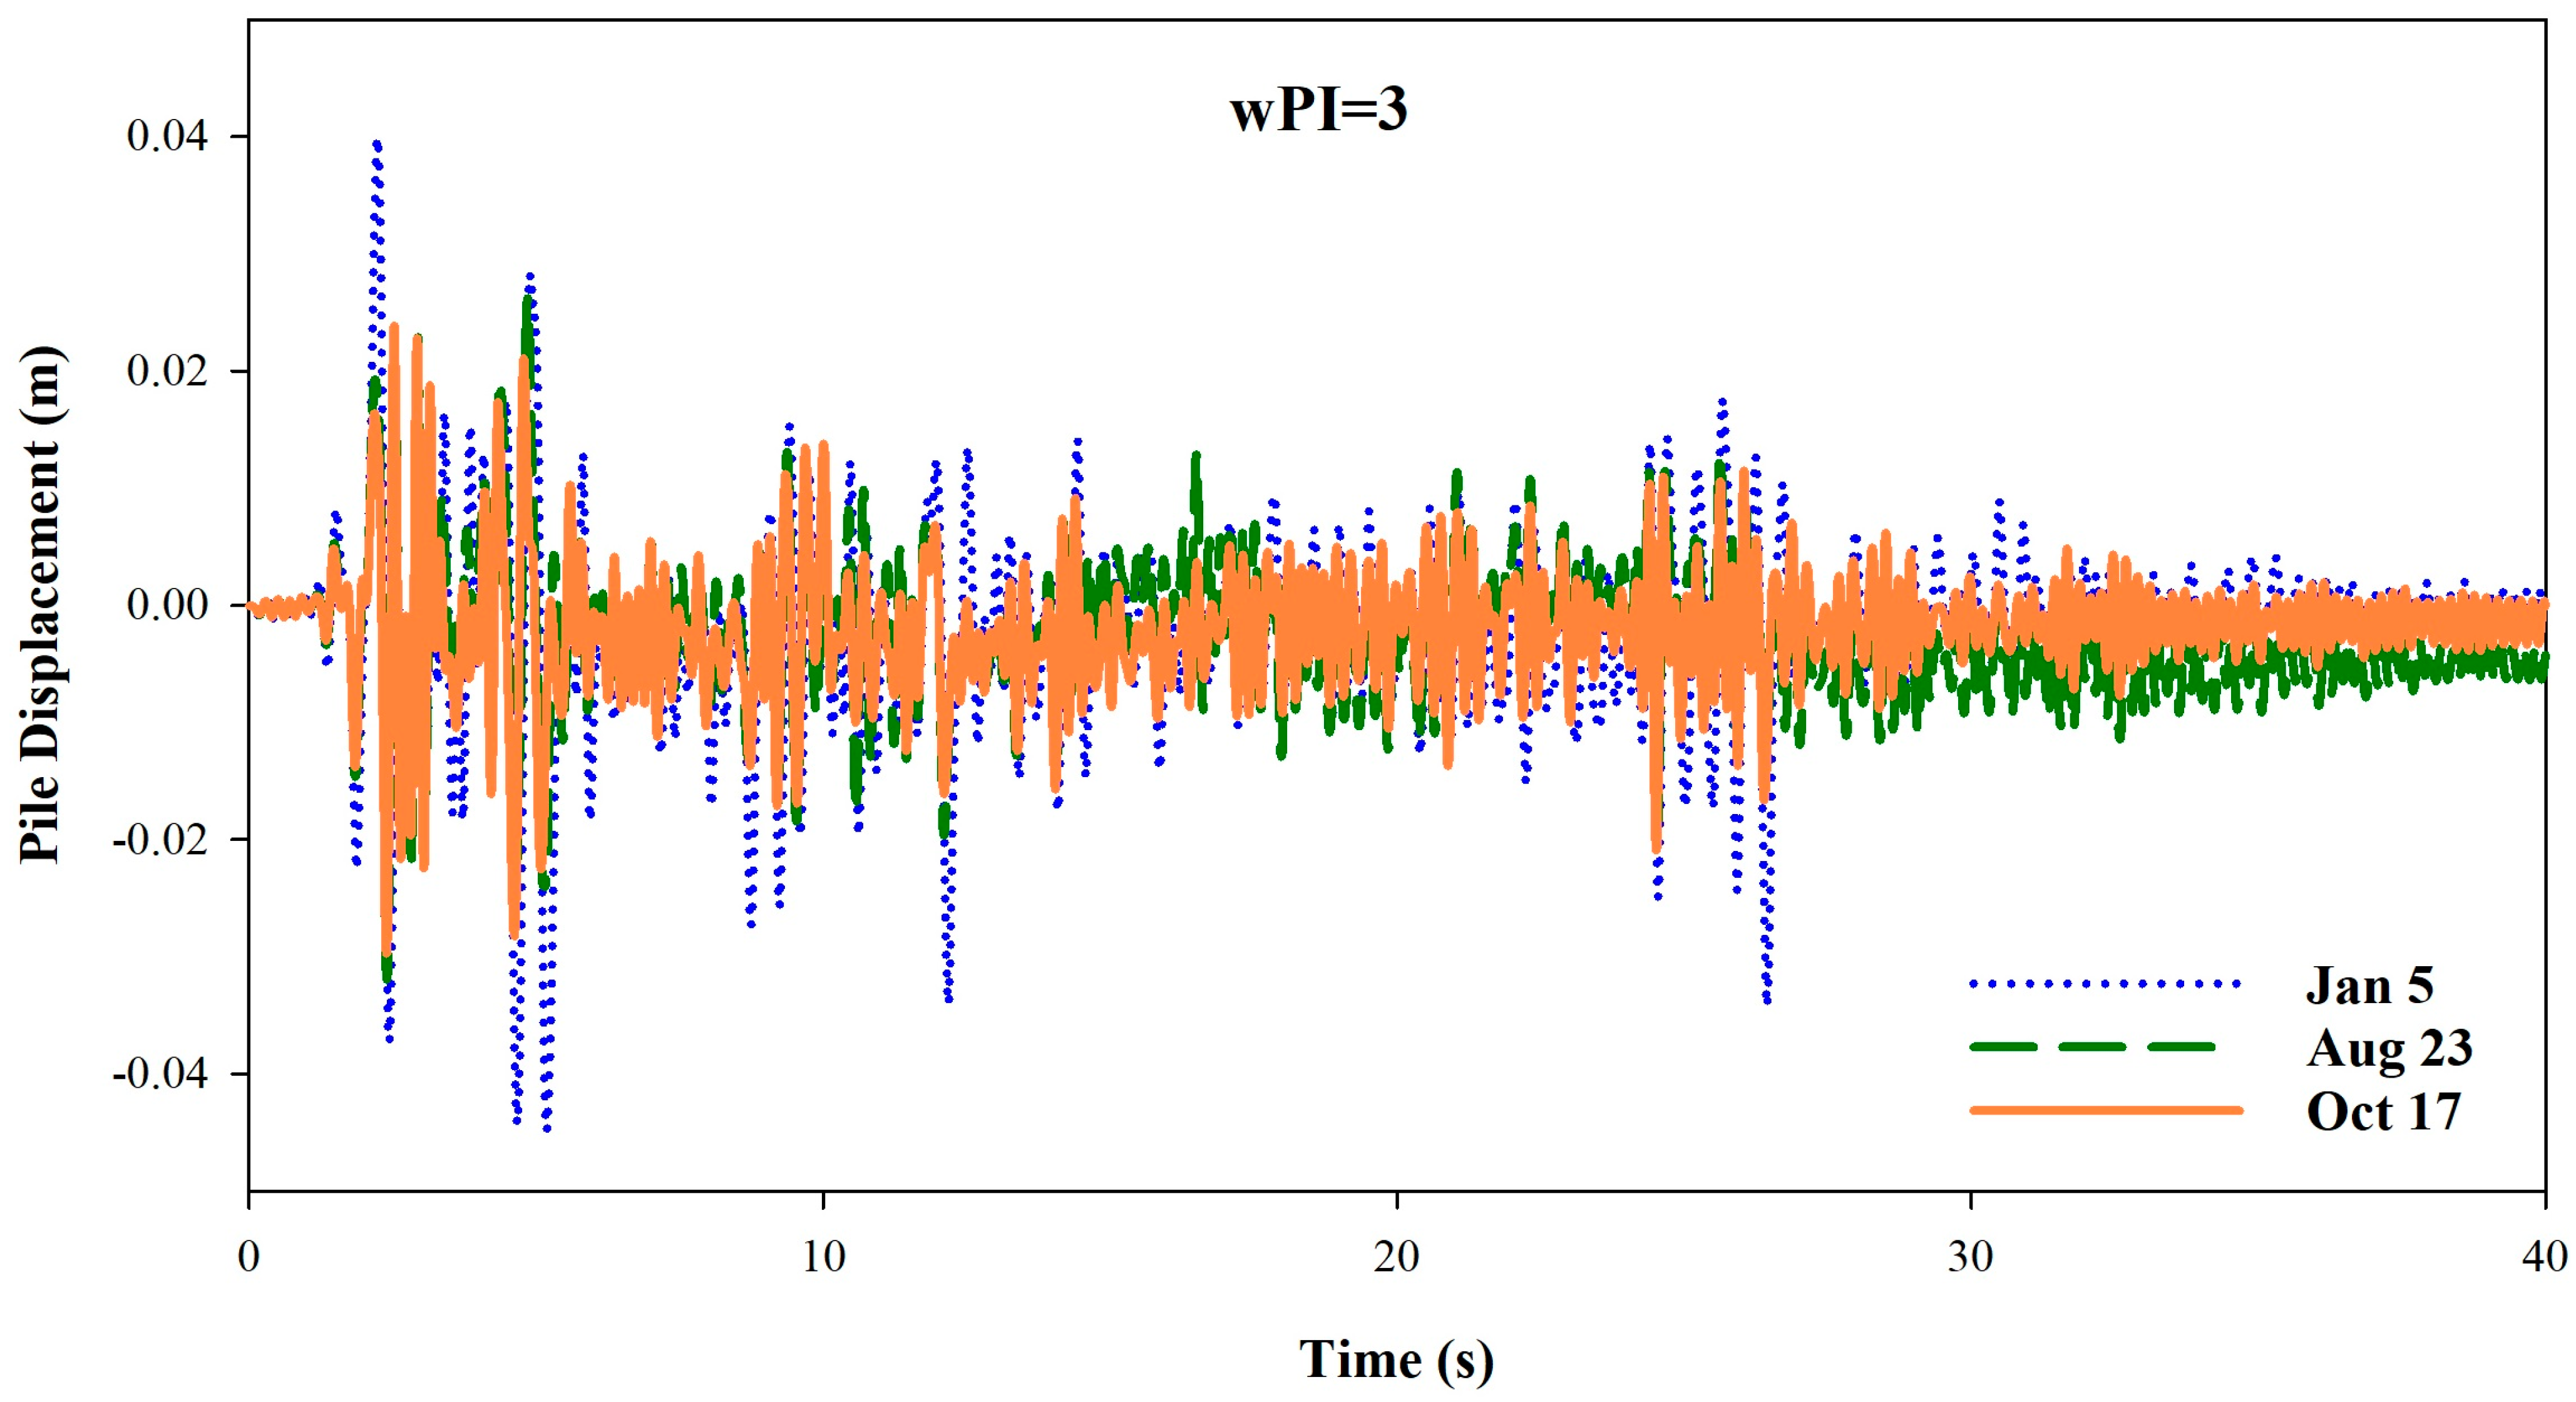
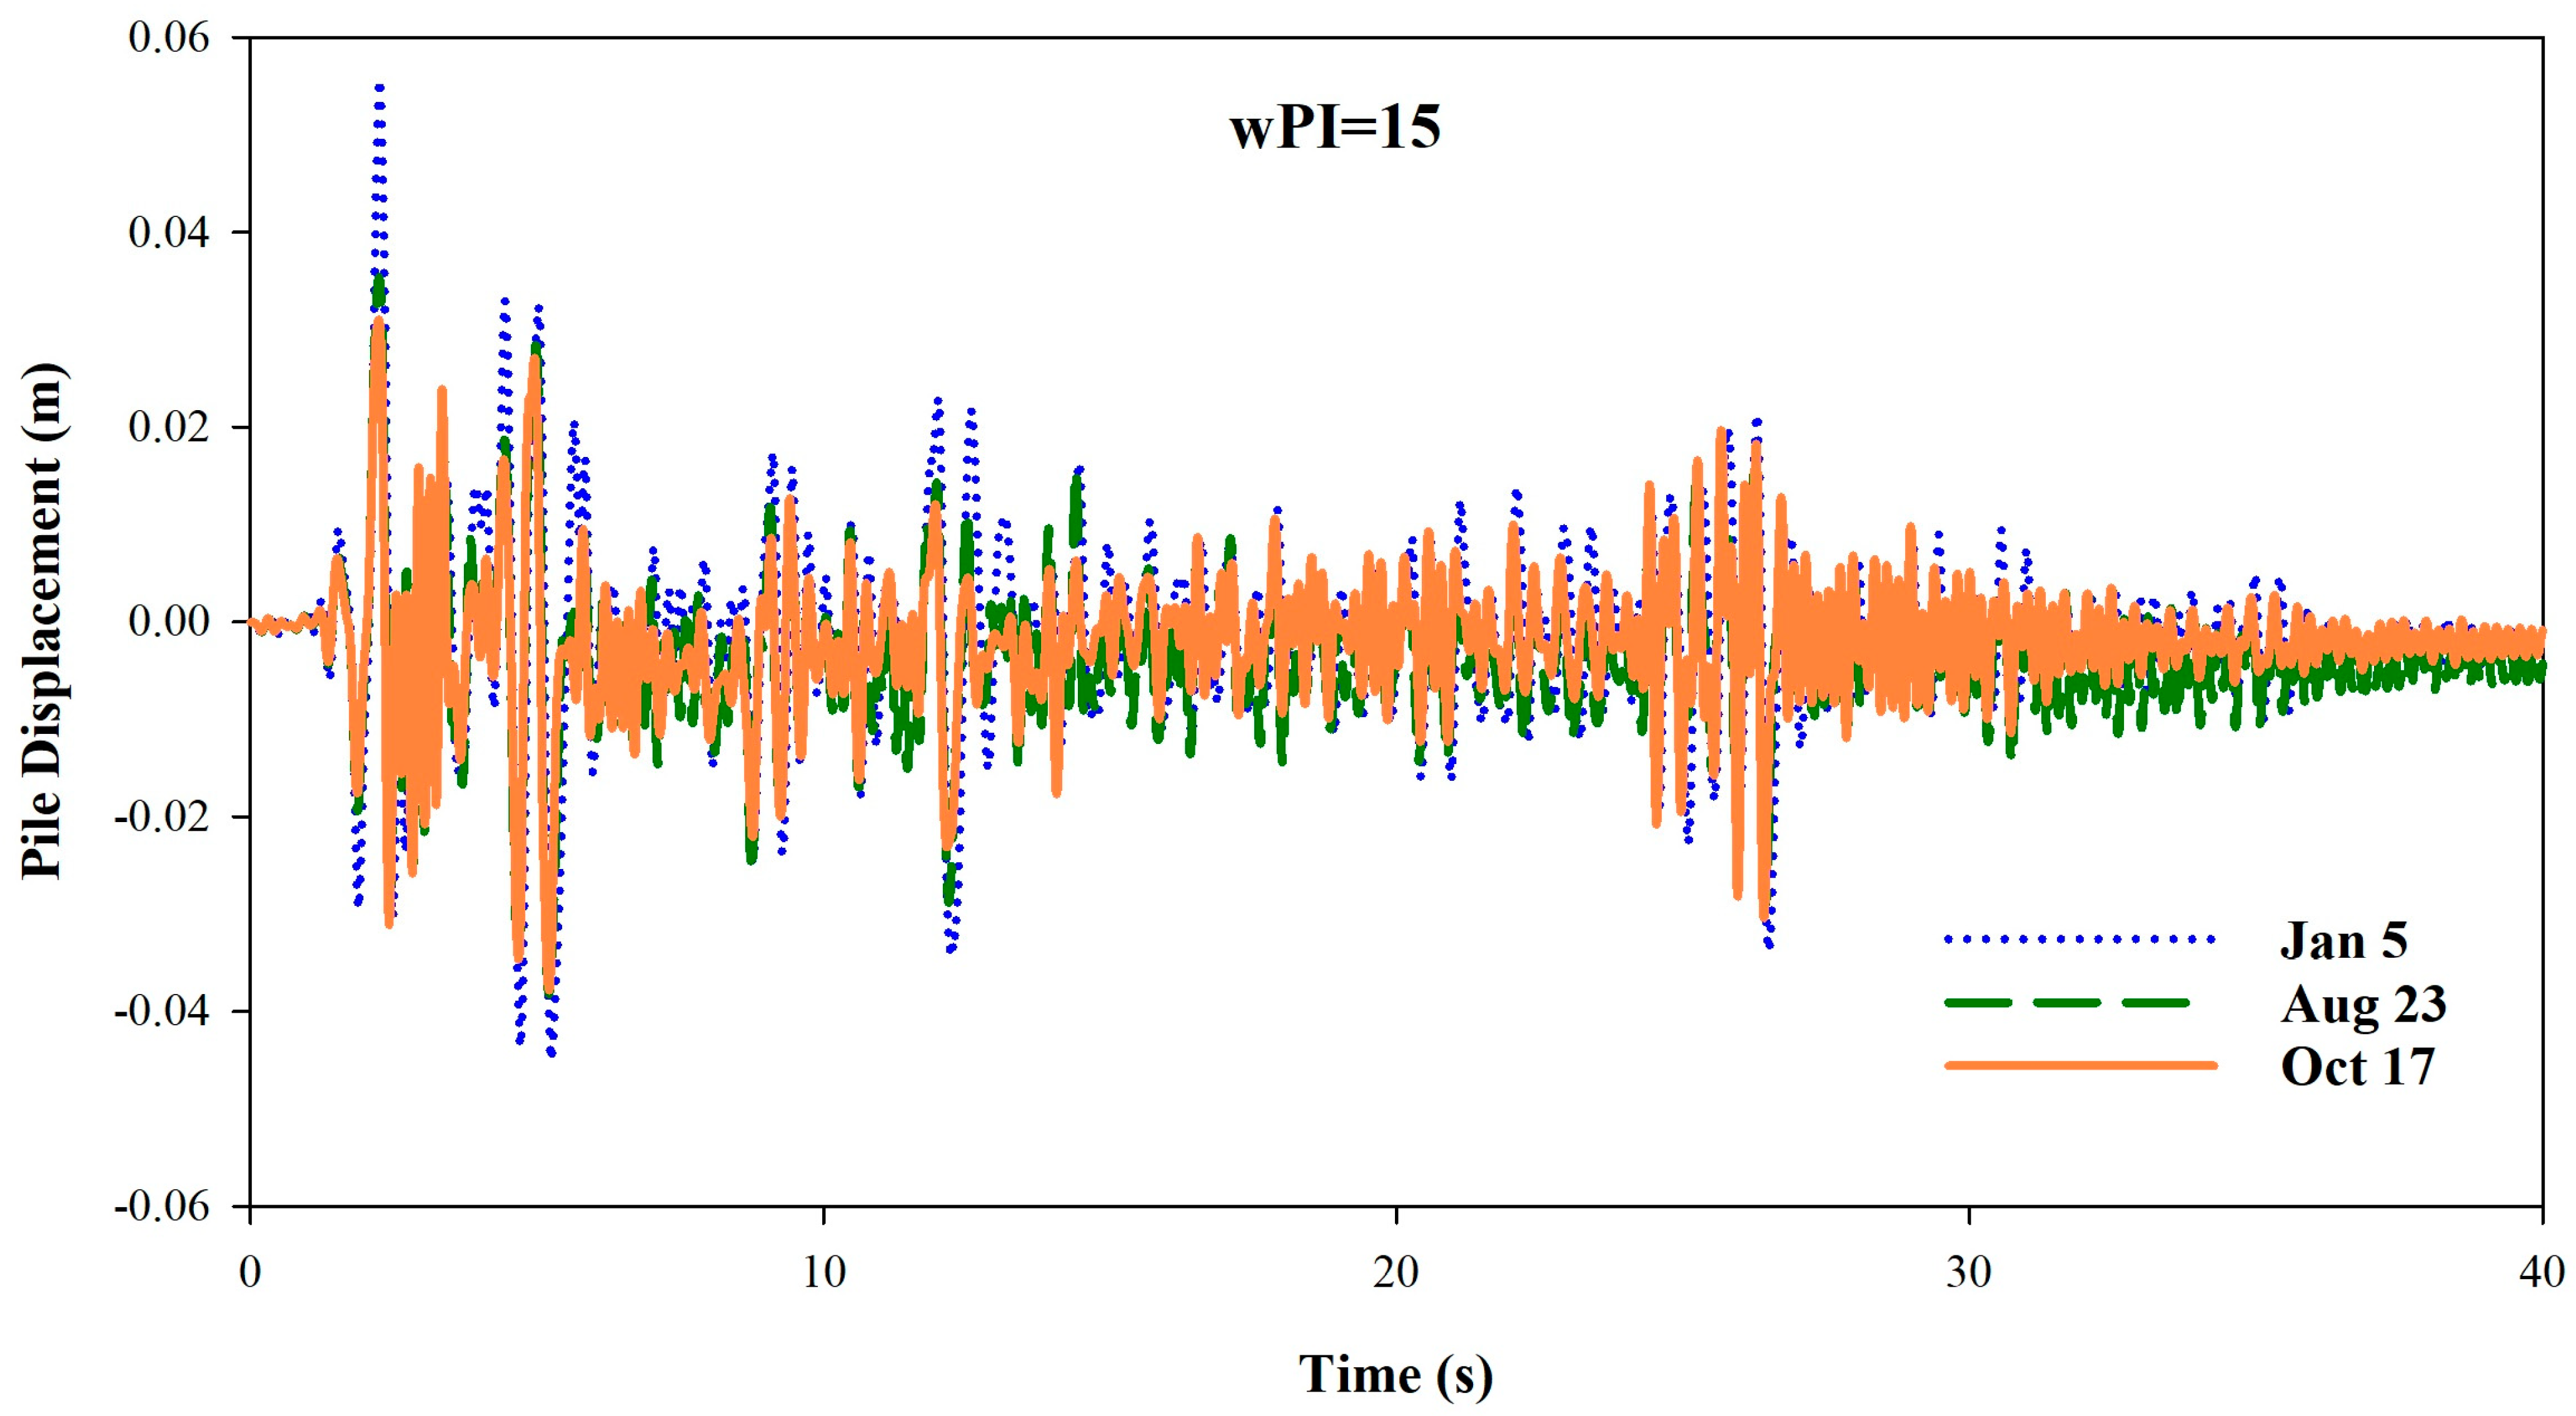
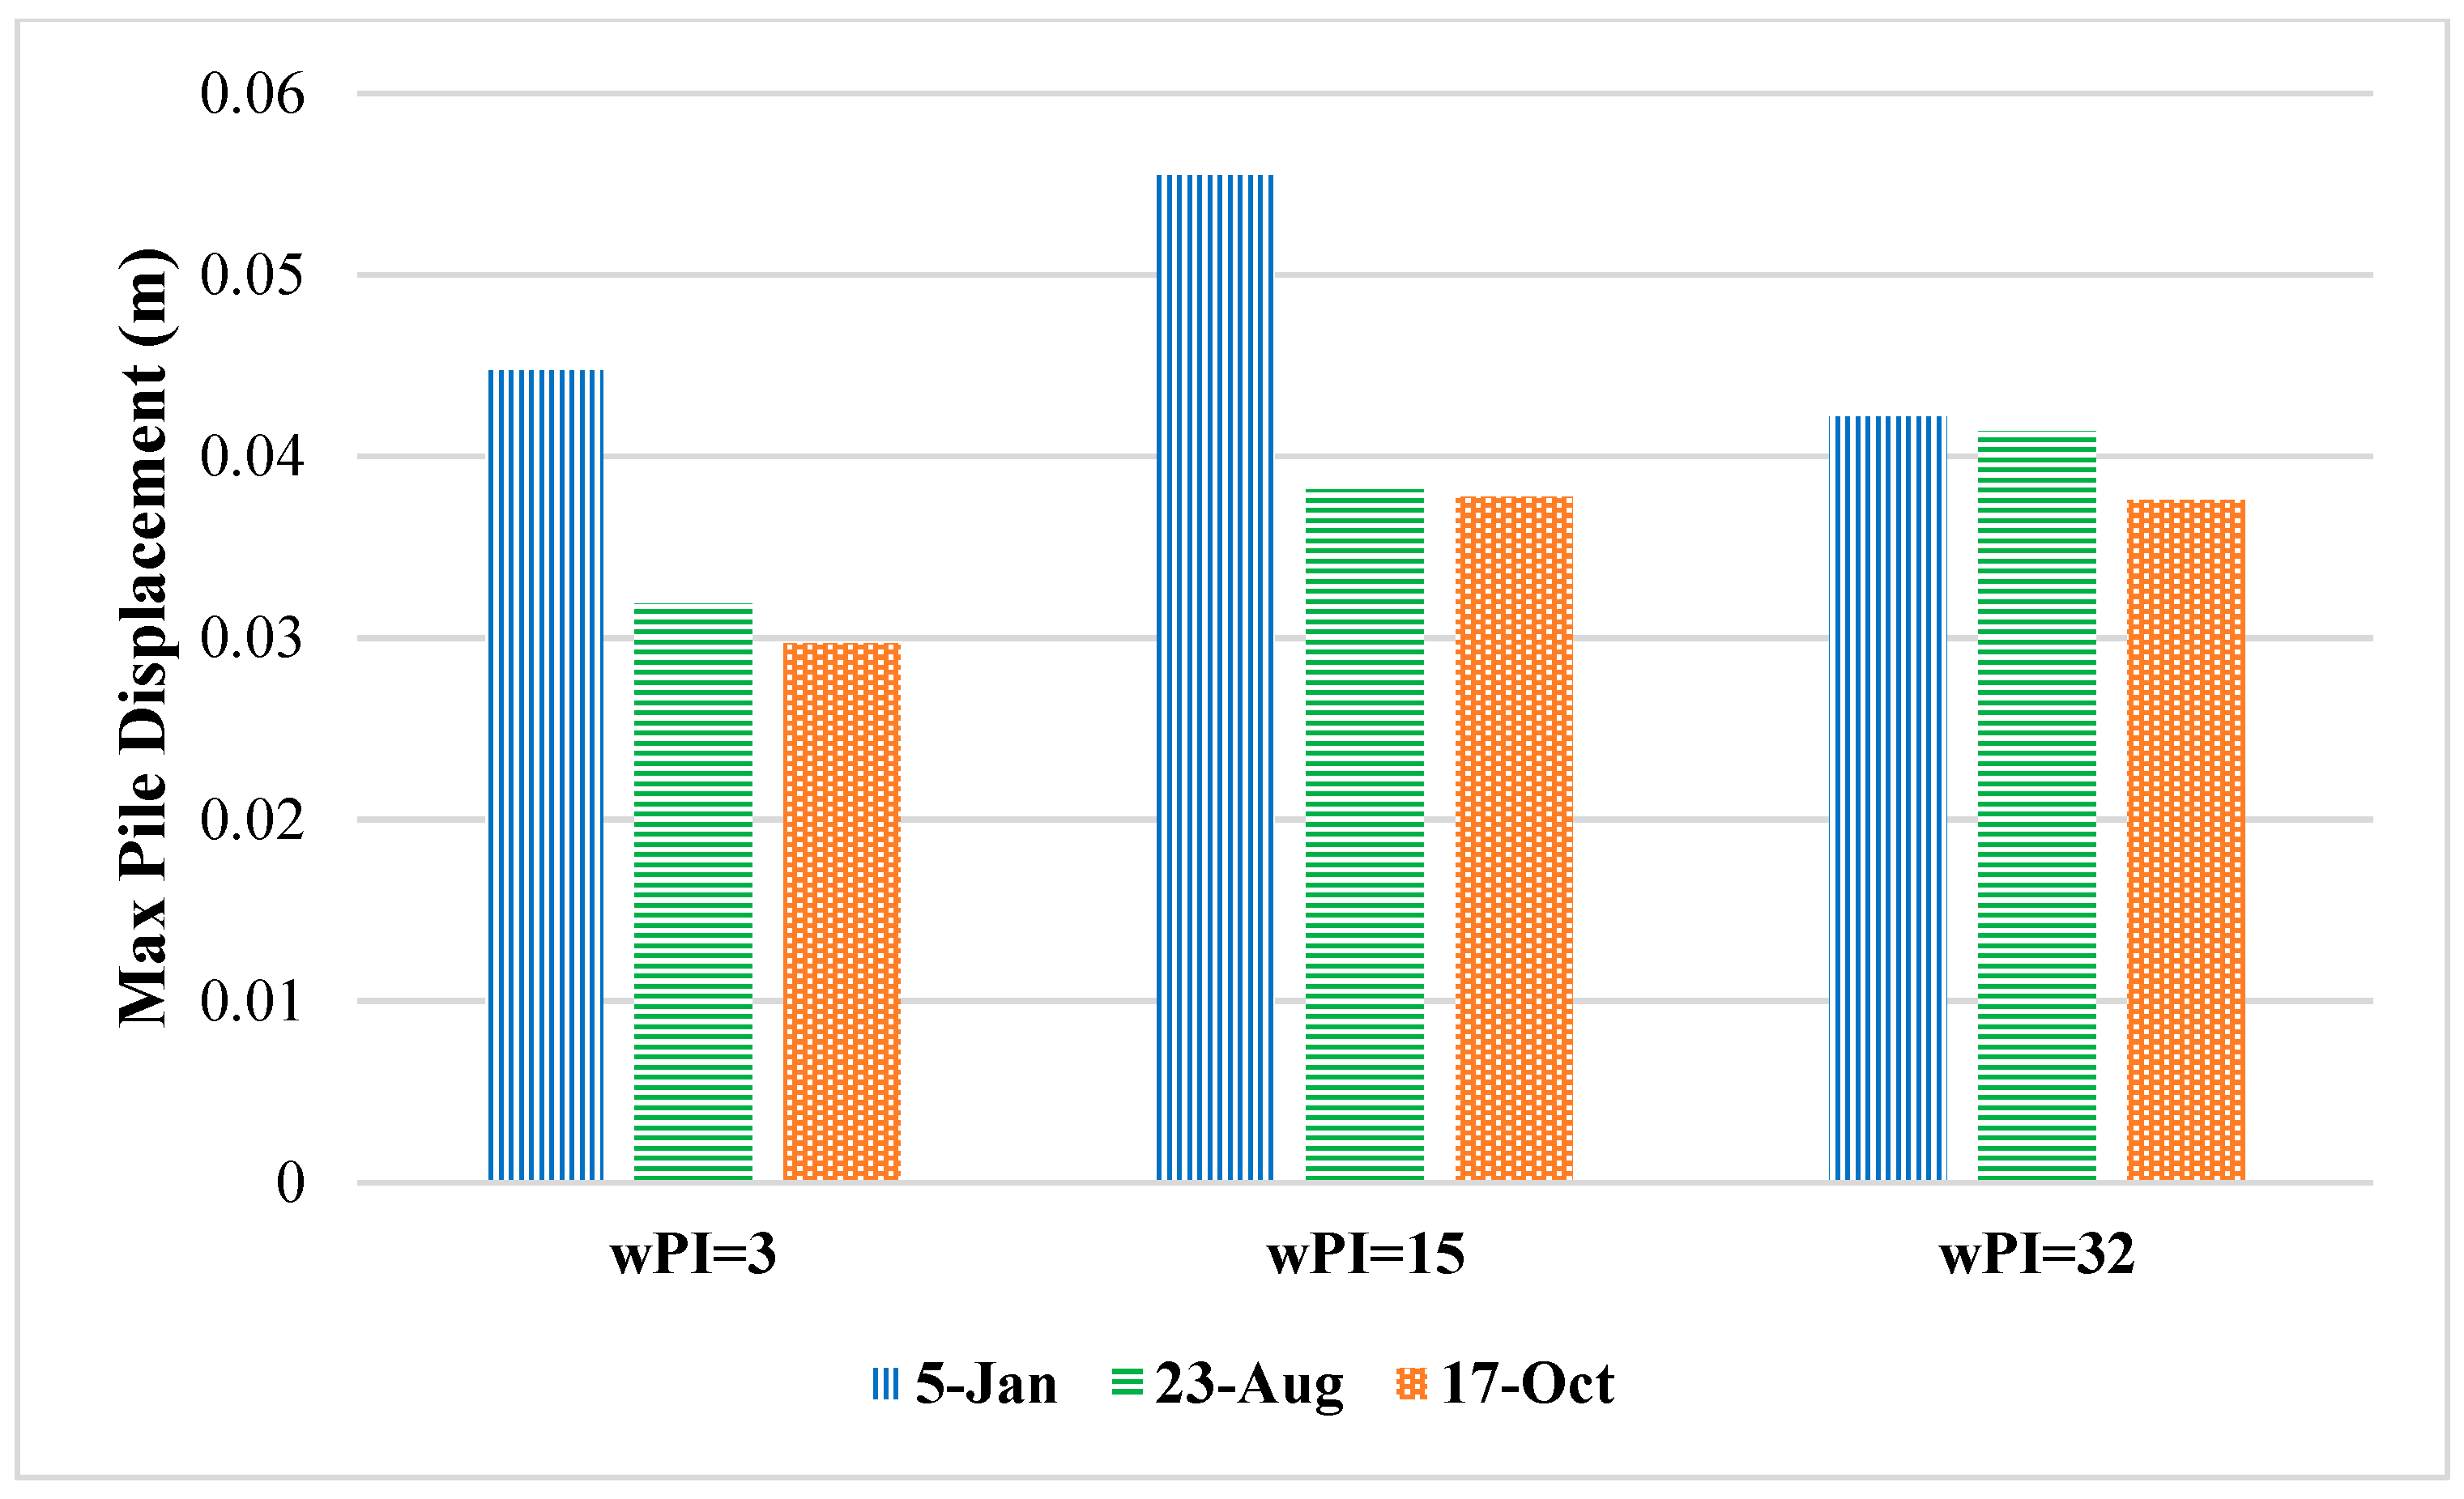
Figure 12, Figure 13 and Figure 14 show pile top displacement obtained by DYPAC for specific low-, medium-, and high-plasticity clays in different seasons, facilitating a comparison of the impact of seasonal weather changes on the seismic response of piles in diverse clayey soils. Figure 15 provides a summary comparison of maximum pile displacements for various scenarios leading to the following findings:
  • The most significant pile displacements occurred on 5 January, the wettest period of the year, while the lowest pile displacements occurred on 17 Oct, coinciding with the maximum suction values due to compounded flash droughts. Higher suction values are directly linked to a higher pult for each soil through Equations (1)–(3) and (6). In lateral pile analysis, pult serves as the maximum lateral resistance for soil and defines the p-y curve. For a given y50 parameter, a larger pult will result in smaller pile displacements.
  • Seasonal weather changes notably influence pile response in low- and medium-plasticity clay. The disparity between pile responses during the wet period and dry period is negligible for high-plasticity clays. In low- and medium-plasticity clay, pile displacement during the wet period is nearly 1.5 times that during drought.
  • The minimum pile displacement in the wet period is associated with piles in high-plasticity clays. However, the pile displacement in low-plasticity clays is the lowest one compared to the medium- and high-plasticity clays in the dry period. This observation can be explained by the relatively high pult values found for the low-plasticity clay paired with the low free-field motion estimated by DEEPSOIL during the dry period for the low-plasticity clay.
  • The most substantial pile displacement occurred in medium-plasticity clay on 5 January, almost twice that of the lowest pile response related to low-plasticity clay on 17 October. This significant variation underscores the influence of seasonal weather changes on the seismic response of pile foundations in low- and medium-plasticity clays. It can highlight the importance of understanding the impact of seasonal weather conditions on the seismic design of pile foundations.

5. Conclusions

It is well established that the behavior of foundations is impacted by changes in soil moisture content and soil suction due to extreme variations in weather patterns that have become increasingly common across the Southern Great Plains of the United States. The main aim of this study was to investigate the role of moisture conditions and soil suction, as affected by season-to-season extreme weather variations, on the dynamic behavior of the pile foundations interacting with clayey soils. This study used a stand-alone finite element computer code called DYPAC (Dynamic Piles Analysis Code) developed using the Beams on Nonlinear Winkler Foundation (BNWF).
Predicted suction values corresponding to different moisture contents were used to determine the p-y curve parameters needed for DYPAC modeling. The free-filed soil displacements were also obtained using the affected soil shear strength and shear wave velocity values based on the moisture migration analyses. The variation in soil suction with depth along the embedded portion of the pile was also considered in the analysis. To incorporate these effects, unsaturated seepage analysis was completed using the commercial software PLAXIS LE Groundwater for three different clayey soils with plasticity ranging from low to medium to high. The seepage analysis used past daily recorded precipitation and other realistic weather data for a testbed that experienced back-to-back flash droughts in 2022.
This study found that soil suction variation due to the changing moisture conditions induced by soil–atmospheric interactions can significantly affect the seismic performance of the piles in unsaturated clayey soils. Results showed that the best seismic performance of the pile with the minimum lateral pile displacement occurred in low-plasticity clays when experiencing back-to-back flash droughts, while the maximum pile displacement occurred in medium-plasticity clays during the wettest period. In medium-plasticity clay, pile displacement during the wet period is nearly twice that in low-plasticity clay during drought. The seasonal variations in pile displacements were minimal for the high-plasticity clays.

Author Contributions

Conceptualization, K.K.M. and G.M.; methodology, K.K.M., T.B. and A.S.; software, A.S. and T.B.; validation, A.S., T.B. and K.K.M.; formal analysis A.S. and T.B.; investigation, A.S. and T.B.; resources, K.K.M. and G.M.; data curation, A.S.; writing—original draft preparation, A.S. and T.B.; writing—review and editing, K.K.M., G.M., T.B. and A.S.; visualization, K.K.M.; supervision, K.K.M., G.M. and T.B.; project administration, K.K.M.; funding acquisition, K.K.M. and G.M. All authors have read and agreed to the published version of the manuscript.

Funding

This research was funded by the U.S. National Science Foundation and the Oklahoma EPSCoR under Grant No. OIA-1946093.

Data Availability Statement

Some or all data, models, or code that support the findings of this study are available from the corresponding author upon reasonable request.

Acknowledgments

This work was supported by the U.S. National Science Foundation and the Oklahoma EPSCoR under Grant No. OIA-1946093. Their support is greatly appreciated. Any opinions, findings, and conclusions or recommendations expressed in this paper are those of the authors and do not necessarily reflect the views of the U.S. National Science Foundation or the Oklahoma EPSCoR.

Conflicts of Interest

The authors declare no conflict of interest.

References

  1. Kloesel, K.; Bartush, B.; Banner, J.; Brown, D.P.; Lemery, J.; Lin, L.; Loeffler, C.; Mcmanus, G.; Mullens, E.; Nielsen-Gammon, J.; et al. Southern Great Plains. In Impacts, Risks, and Adaptation in the United States: Fourth National Climate Assessment; U.S. Global Research Program: Washington, DC, USA, 2018; Volume 2, pp. 987–1035. [Google Scholar] [CrossRef]
  2. Christian, J.I.; Basara, J.B.; Otkin, J.A.; Hunt, E.D.; Wakefield, R.A.; Flanagan, P.X.; Xiao, X. A methodology for flash drought identification: Application of flash drought frequency across the United States. J. Hydrometeorol. 2019, 20, 833–846. [Google Scholar] [CrossRef]
  3. Mylonakis, G.; Gazetas, G. Seismic soil-structure interaction: Beneficial or detrimental? J. Earthq. Eng. 2000, 4, 277–301. [Google Scholar] [CrossRef]
  4. Yang, H.; Wang, H.; Jeremić, B. An energy-based analysis framework for soil structure interaction systems. Comput. Struct. 2022, 265, 106758. [Google Scholar] [CrossRef]
  5. Le, K.N.; Ghayoomi, M. Cyclic direct simple shear test to measure strain-dependent dynamic properties of unsaturated sand. Geotech. Test. J. 2017, 40, 381–395. [Google Scholar] [CrossRef]
  6. Zhang, B.; Muraleetharan, K.K.; Liu, C. Liquefaction of unsaturated sands. Int. J. Geomech. 2016, 16, D4015002. [Google Scholar] [CrossRef]
  7. Hoyos, L.R.; Cruz, J.A.; Puppala, A.J.; Douglas, W.A.; Suescún, E.A. Dynamic shear modulus and damping of compacted silty sand via suction-controlled resonant column testing. In Proceedings of the 18th International Conference on Soil Mechanics and Geotechnical Engineering, Paris, France, 2–6 September 2013; pp. 1125–1128. [Google Scholar]
  8. Yee, E.; Duku, P.M.; Stewart, J.P. Cyclic volumetric strain behavior of sands with fines of low plasticity. J. Geotech. Geoenviron. Eng. 2014, 140, 04013042. [Google Scholar] [CrossRef]
  9. Mirshekari, M.; Ghayoomi, M. Centrifuge tests to assess seismic site response of partially saturated sand layers. Soil Dyn. Earthquake Eng. 2017, 94, 254–265. [Google Scholar] [CrossRef]
  10. Zhang, B.; Muraleetharan, K.K. Liquefaction of level ground unsaturated sand deposits using a validated fully coupled analysis procedure. Int. J. Geomech. 2018, 18, 04018118. [Google Scholar] [CrossRef]
  11. Lalicata, L.M.; Desideri, A.; Casini, F.; Thorel, L. Experimental observation on a laterally loaded pile in unsaturated silty soil. Can. Geotech. J. 2018, 56, 1545–1556. [Google Scholar] [CrossRef]
  12. Borghei, A.; Ghayoomi, M.; Turner, M. Centrifuge tests to evaluate seismic settlement of shallow foundations on unsaturated silty sand. In Geo-Congress 2020; American Society of Civil Engineers: Reston, VA, USA, 2020; pp. 198–207. [Google Scholar]
  13. Shojaeian, A.; Sivakumaran, S.; Muraleetharan, K.K. Seismic behavior of pile foundations in unsaturated soils. In E3S Web of Conferences; EDP Sciences: Les Ulis, France, 2023; Volume 382. [Google Scholar]
  14. Borghei, A.; Ghayoomi, M.; Turner, M. Effects of groundwater level on seismic response of soil–foundation systems. J. Geotech. Geoenviron. Eng. 2020, 146, 04020110. [Google Scholar] [CrossRef]
  15. Mokwa, R.L.; Duncan, J.M.; Helmers, M.J. Development of py curves for partly saturated silts and clays. In New Technological and Design Developments in Deep Foundations; American Society of Civil Engineers: Reston, VA, USA, 2000; pp. 224–239. [Google Scholar]
  16. Stacul, S.; Squeglia, N.; Morelli, F. Laterally loaded single pile response considering the influence of suction and nonlinear behaviour of reinforced concrete sections. Appl. Sci. 2017, 7, 1310. [Google Scholar] [CrossRef]
  17. Sivakumaran, S. Development of a Verified Non-Linear Winkler Model for the Seismic Analysis of Piles in Improved Ground. Master’s Thesis, University of Oklahoma, Norman, OK, USA, 2019. [Google Scholar]
  18. Boulanger, R.W.; Curras, C.J.; Kutter, B.L.; Wilson, D.W.; Abghari, A. Seismic soil-pile-structure interaction experiments and analyses. J. Geotech. Geoenviron. Eng. 1999, 125, 750–759. [Google Scholar] [CrossRef]
  19. Vanapalli, S.K.; Fredlund, D.G.; Pufahl, D.E.; Clifton, A.W. Model for the prediction of shear strength with respect to soil suction. Can. Geotech. J. 1996, 33, 379–392. [Google Scholar] [CrossRef]
  20. Bentley Systems Team. PLAXIS LE Groundwater; Bentley: Exton, PA, USA, 2021. [Google Scholar]
  21. Penman, H.L. Natural evaporation from open water, bare soil and grass. Proc. R. Soc. Lond. Ser. A Math. Phys. Sci. 1948, 193, 120–145. [Google Scholar]
  22. Winkler, E. Die Lehre vonder Elastizitaf Und Festigkeit; on Elasticity and Fixity; Czechoslovakia: Prague, Czech Republic, 1867; p. 182. [Google Scholar]
  23. Soltani, H.; Muraleetharan, K.K. Predicting Seismic Response of a Single Pile in Cement-Treated Soft Clay Using a Bouc-Wen Type Model. In IFCEE 2018; American Society of Civil Engineers: Reston, VA, USA, 2018; pp. 262–271. [Google Scholar]
  24. Matlock, H. Correlation for design of laterally loaded piles in soft clay. In Offshore Technology Conference; OnePetro: Richardson, TX, USA, 1970. [Google Scholar]
  25. Hilber, H.M.; Hughes, T.J.; Taylor, R.L. Improved numerical dissipation for time integration algorithms in structural dynamics. Earthq. Eng. Struct. Dyn. 1977, 5, 283–292. [Google Scholar] [CrossRef]
  26. Muraleetharan, K.K.; Mish, K.D.; Arulanandan, K. A fully coupled non-linear dynamic analysis procedure and its verification using centrifuge test results. Int. J. Numer. Anal. Methods Geomech. 1994, 18, 305–325. [Google Scholar] [CrossRef]
  27. Hashash, Y.M.A.; Musgrove, M.I.; Harmon, J.A.; Groholski, D.R.; Phillips, C.A.; Park, D. DEEPSOIL 6.1, Users Manual; Board of Trustees of University of Illinois at Urbana-Champaign: Urbana, IL, USA, 2016. [Google Scholar]
  28. Darendeli, M.B. Development of a New Family of Normalized Modulus Reduction and Material Damping Curves. Ph.D. Thesis, The University of Texas at Austin, Austin, TX, USA, 2001. [Google Scholar]
  29. Dickenson, S.E.; Seed, R.B. Preliminary Report on Correlations of Shear Wave Velocity and Engineering Properties for Soft Soil Deposits in the San Francisco Bay Region; research report; Department of Civil Engineering, UCB/EERC-94/XX: Berkeley, CA, USA, 1994. [Google Scholar]
  30. Fredlund, D.G.; Rahardjo, H. Soil Mechanics for Unsaturated Soils; John Wiley & Sons: Hoboken, NJ, USA, 1993. [Google Scholar]
  31. Tchakalova, B.; Ivanov, P. Correlation between effective cohesion and plasticity index of clay. Geolodica Balc. 2021, 51, 45–49. [Google Scholar] [CrossRef]
  32. Sorensen, K.K.; Okkels, N. Correlation between drained shear strength and plasticity index of undisturbed overconsolidated clays. In Proceedings of the 18th International Conference on Soil Mechanics and Geotechnical Engineering, Paris, France, 2–6 September 2013; Volume 1, pp. 423–428. [Google Scholar]
  33. Fredlund, D.G.; Xing, A. Equations for the soil-water characteristic curve. Can. Geotech. J. 1994, 31, 521–532. [Google Scholar] [CrossRef]
  34. Zapata, C. Uncertainty in Soil-Water-Characteristic Curve and Impacts on Unsaturated Shear Strength Predictions. Ph.D. Thesis, Arizona State University, Tempe, AZ, USA, 1999. [Google Scholar]
  35. National Drought Mitigation Center (NDMC); U.S. Department of Agriculture (USDA); National Oceanic and Atmospheric Administration (NOAA). US Drought Monitor. 2022. Available online: https://droughtmonitor.unl.edu/Maps/MapViewer.aspx (accessed on 25 August 2024).
  36. McPherson, R.A.; Fiebrich, C.A.; Crawford, K.C.; Kilby, J.R.; Grimsley, D.L.; Martinez, J.E.; Basara, J.B.; Illston, B.G.; Morris, D.A.; Kloesel, K.A.; et al. Statewide monitoring of the mesoscale environment: A technical update on the Oklahoma Mesonet. J. Atmos. Ocean. Technol. 2007, 24, 301–321. [Google Scholar] [CrossRef]
  37. Brock, F.V.; Crawford, K.C.; Elliott, R.L.; Cuperus, G.W.; Stadler, S.J.; Johnson, H.L.; Eilts, M.D. The Oklahoma Mesonet: A technical overview. J. Atmos. Ocean. Technol. 1995, 12, 5–19. [Google Scholar] [CrossRef]
  38. Fredlund, D.G.; Xing, A.; Huang, S. Predicting the permeability function for unsaturated soils using the soil-water characteristic curve. Can. Geotech. J. 1994, 31, 533–546. [Google Scholar] [CrossRef]
Figure 1. Nonlinear p-y element that includes elastic, plastic, and gap components interconnected in series to simulates the far-field soil motion, near-field soil motion, and drag force on the pile, respectively [18].
Geosciences 14 00234 g001
Figure 2. SWCCs for study soils obtained using Fredlund and Xing [33] model.
Geosciences 14 00234 g002
Figure 3. El Centro earthquake acceleration time history used in the current study with a PGA (Peak Ground Acceleration) of 0.313 g.
Geosciences 14 00234 g003
Figure 4. Variation in exceptional drought conditions across Oklahoma in 2022 [35] that shows the back-to-back flash droughts. Testbed indicated by white star.
Geosciences 14 00234 g004
Figure 5. Pittsburg Co. Oklahoma weather data and potential evaporation as estimated by PLAXIS LE Groundwater.
Geosciences 14 00234 g005
Figure 6. Variation in suction for 1.5 m depth that clearly shows the first and second flash droughts on 23 August and 17 October.
Geosciences 14 00234 g006
Figure 7. Soil suction profiles for three different clayey soils in various seasons.
Geosciences 14 00234 g007
Figure 8. Free-field surface displacement time histories predicted by DEEPSOIL for medium-plasticity clay in different seasons.
Geosciences 14 00234 g008
Figure 9. Free-field surface displacement time histories predicted by DEEPSOIL for various clays on Jan 5th.
Geosciences 14 00234 g009
Figure 10. Maximum free-field surface soil displacements in different seasons for different soil types.
Geosciences 14 00234 g010
Figure 11. Ultimate soil resistance ( p u l t ) in different seasons and soil types.
Geosciences 14 00234 g011
Figure 12. Pile top displacement time history for low-plasticity clay.
Geosciences 14 00234 g012
Figure 13. Pile top displacement time history for medium-plasticity clay.
Geosciences 14 00234 g013
Figure 14. Pile top displacement time history for high-plasticity clay.
Geosciences 14 00234 g014
Figure 15. Maximum pile top displacements for various clays in different seasons.
Geosciences 14 00234 g015
Table 1. Characteristic soil properties.
Clay TypewPIwPIEffective Cohesion (kPa)Effective Friction Angle (°)
Low-plasticity0.60531234
Medium-plasticity0.7520152425
High-plasticity0.9035323522
Disclaimer/Publisher’s Note: The statements, opinions and data contained in all publications are solely those of the individual author(s) and contributor(s) and not of MDPI and/or the editor(s). MDPI and/or the editor(s) disclaim responsibility for any injury to people or property resulting from any ideas, methods, instructions or products referred to in the content.