

Seeps and Tectonic Structure of the Hydrothermal System of the Panarea Volcanic Complex (Aeolian Islands, Tyrrhenian Sea)

 ,
,  ,
,  , and
, and
Abstract
1. Introduction and Setting
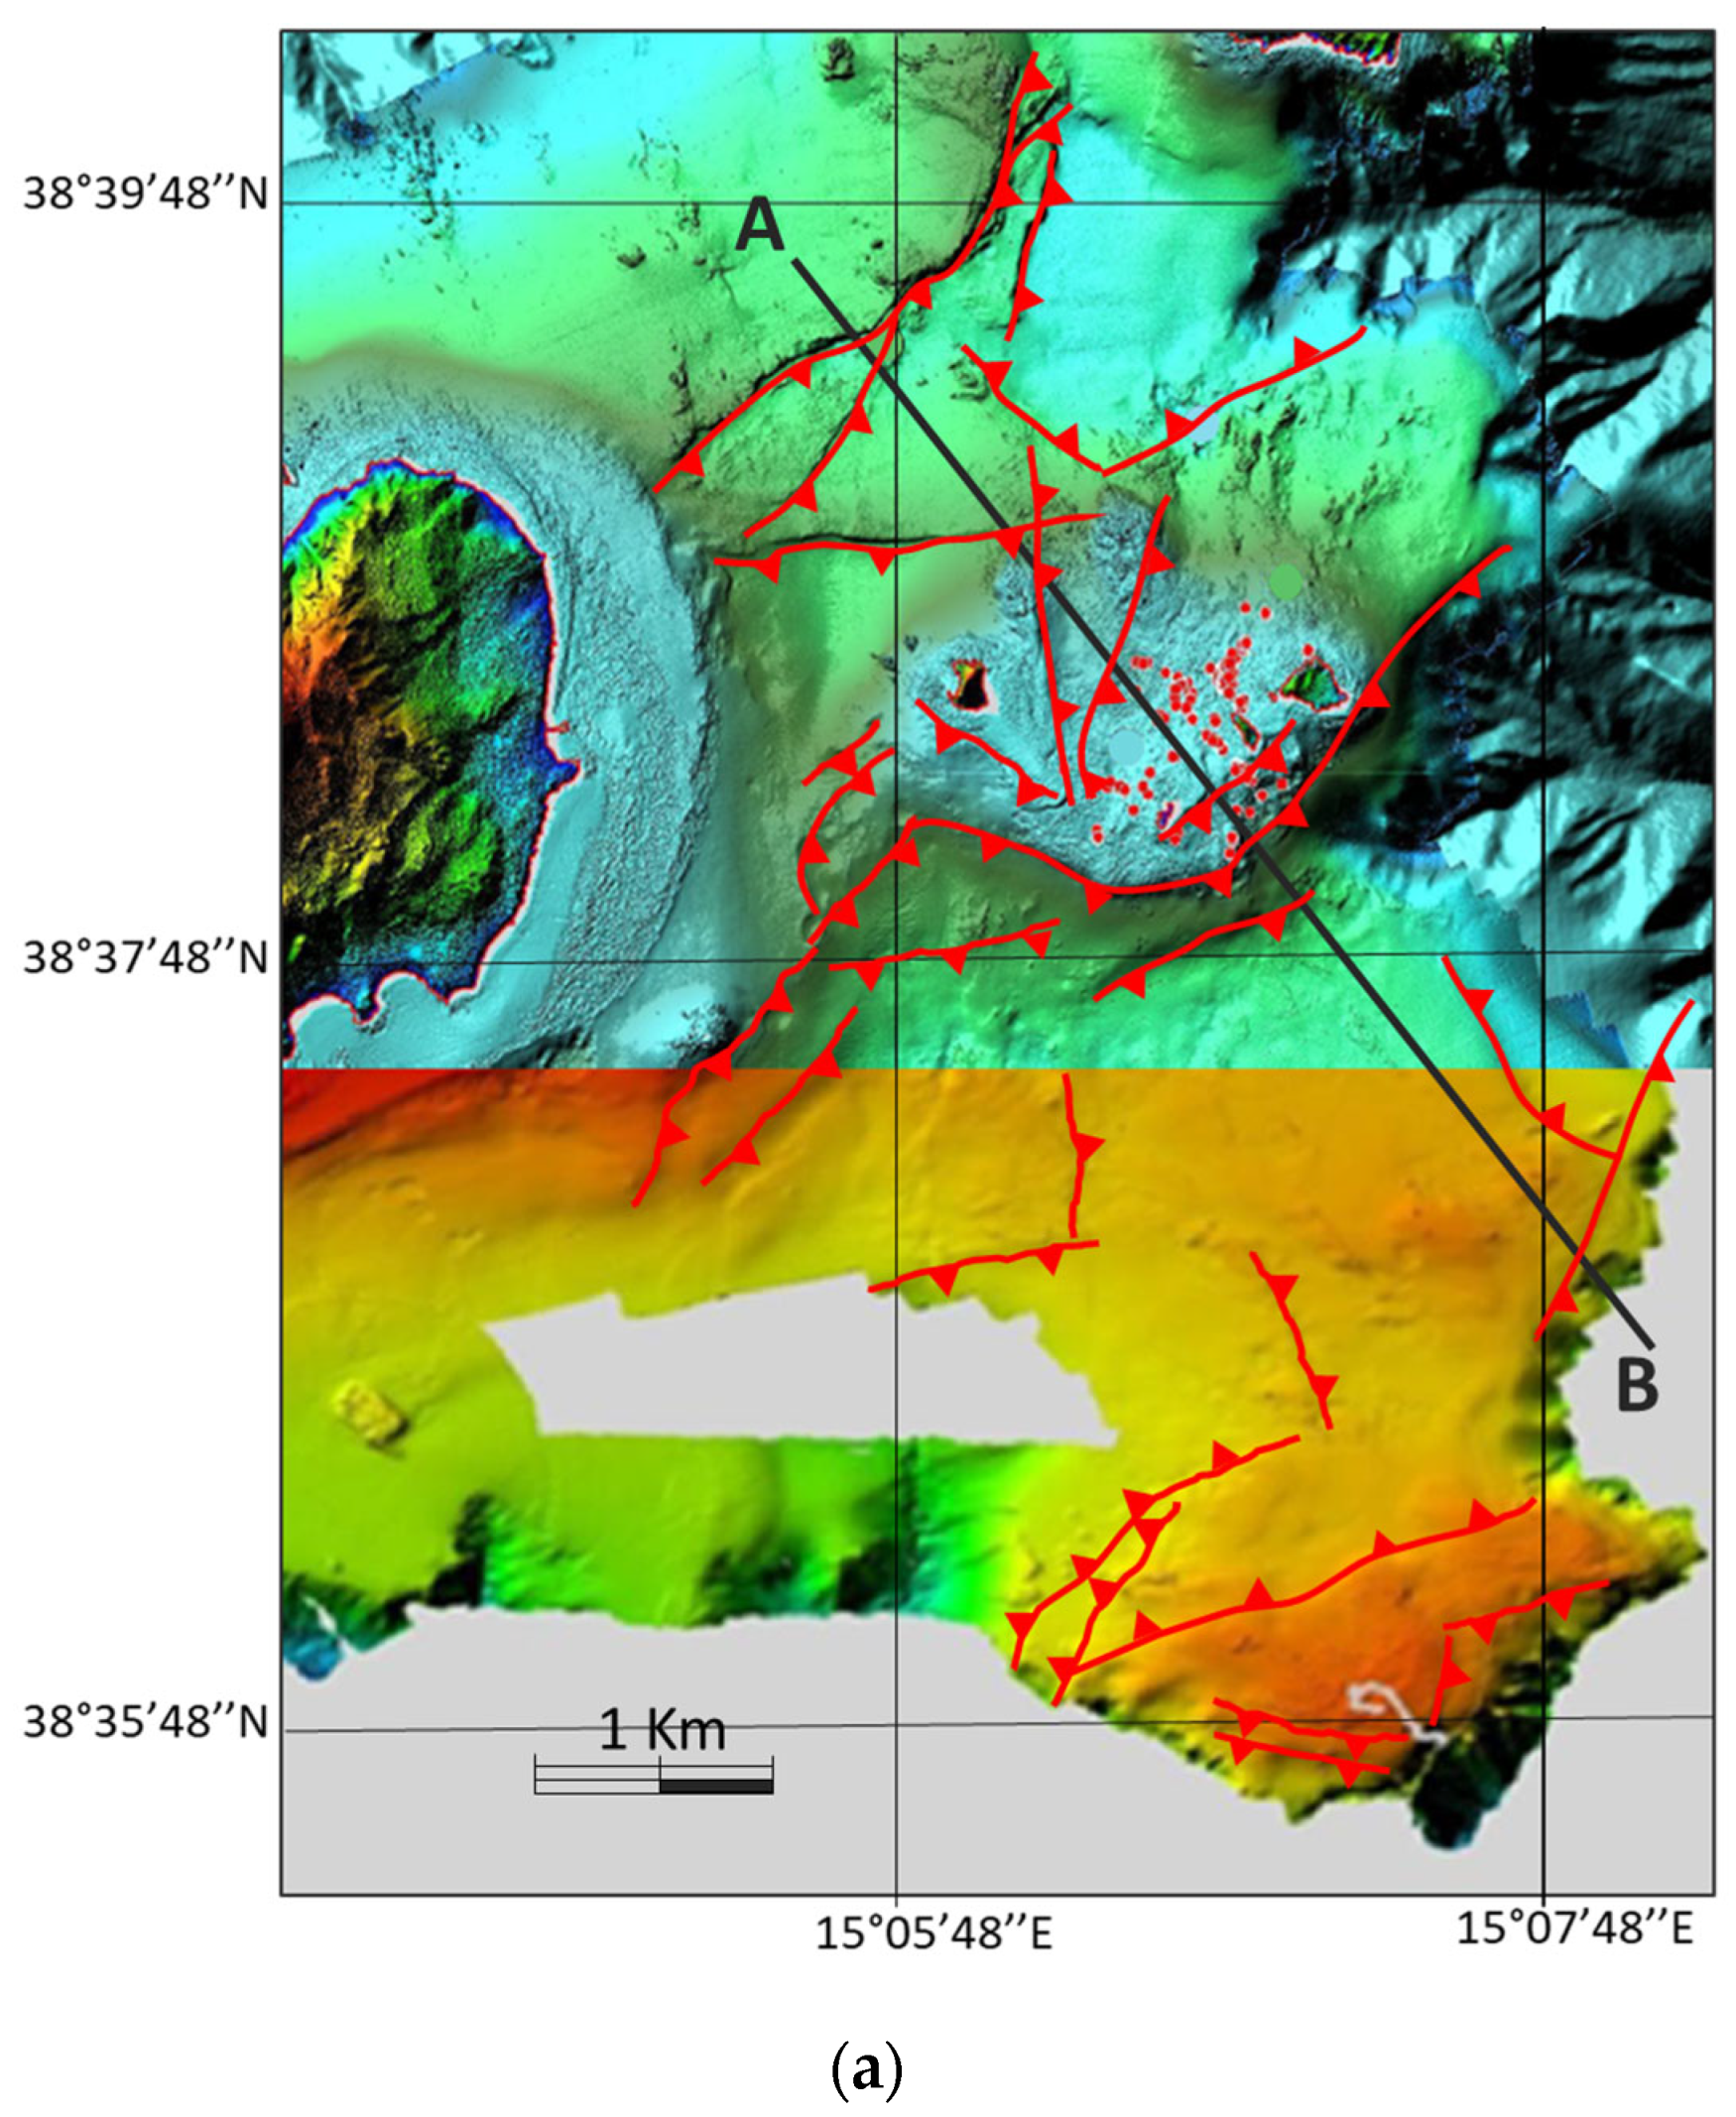
 Reverse and trusting compressional areas,
  normal and extensional area,
  trust,
  strike-slip faults,
  extensional faults. Depths in meters.
Reverse and trusting compressional areas, normal and extensional area, trust, strike-slip faults, extensional faults. Depths in meters.
extensional faults. Depths in meters.
Reverse and trusting compressional areas, normal and extensional area, trust, strike-slip faults, extensional faults. Depths in meters.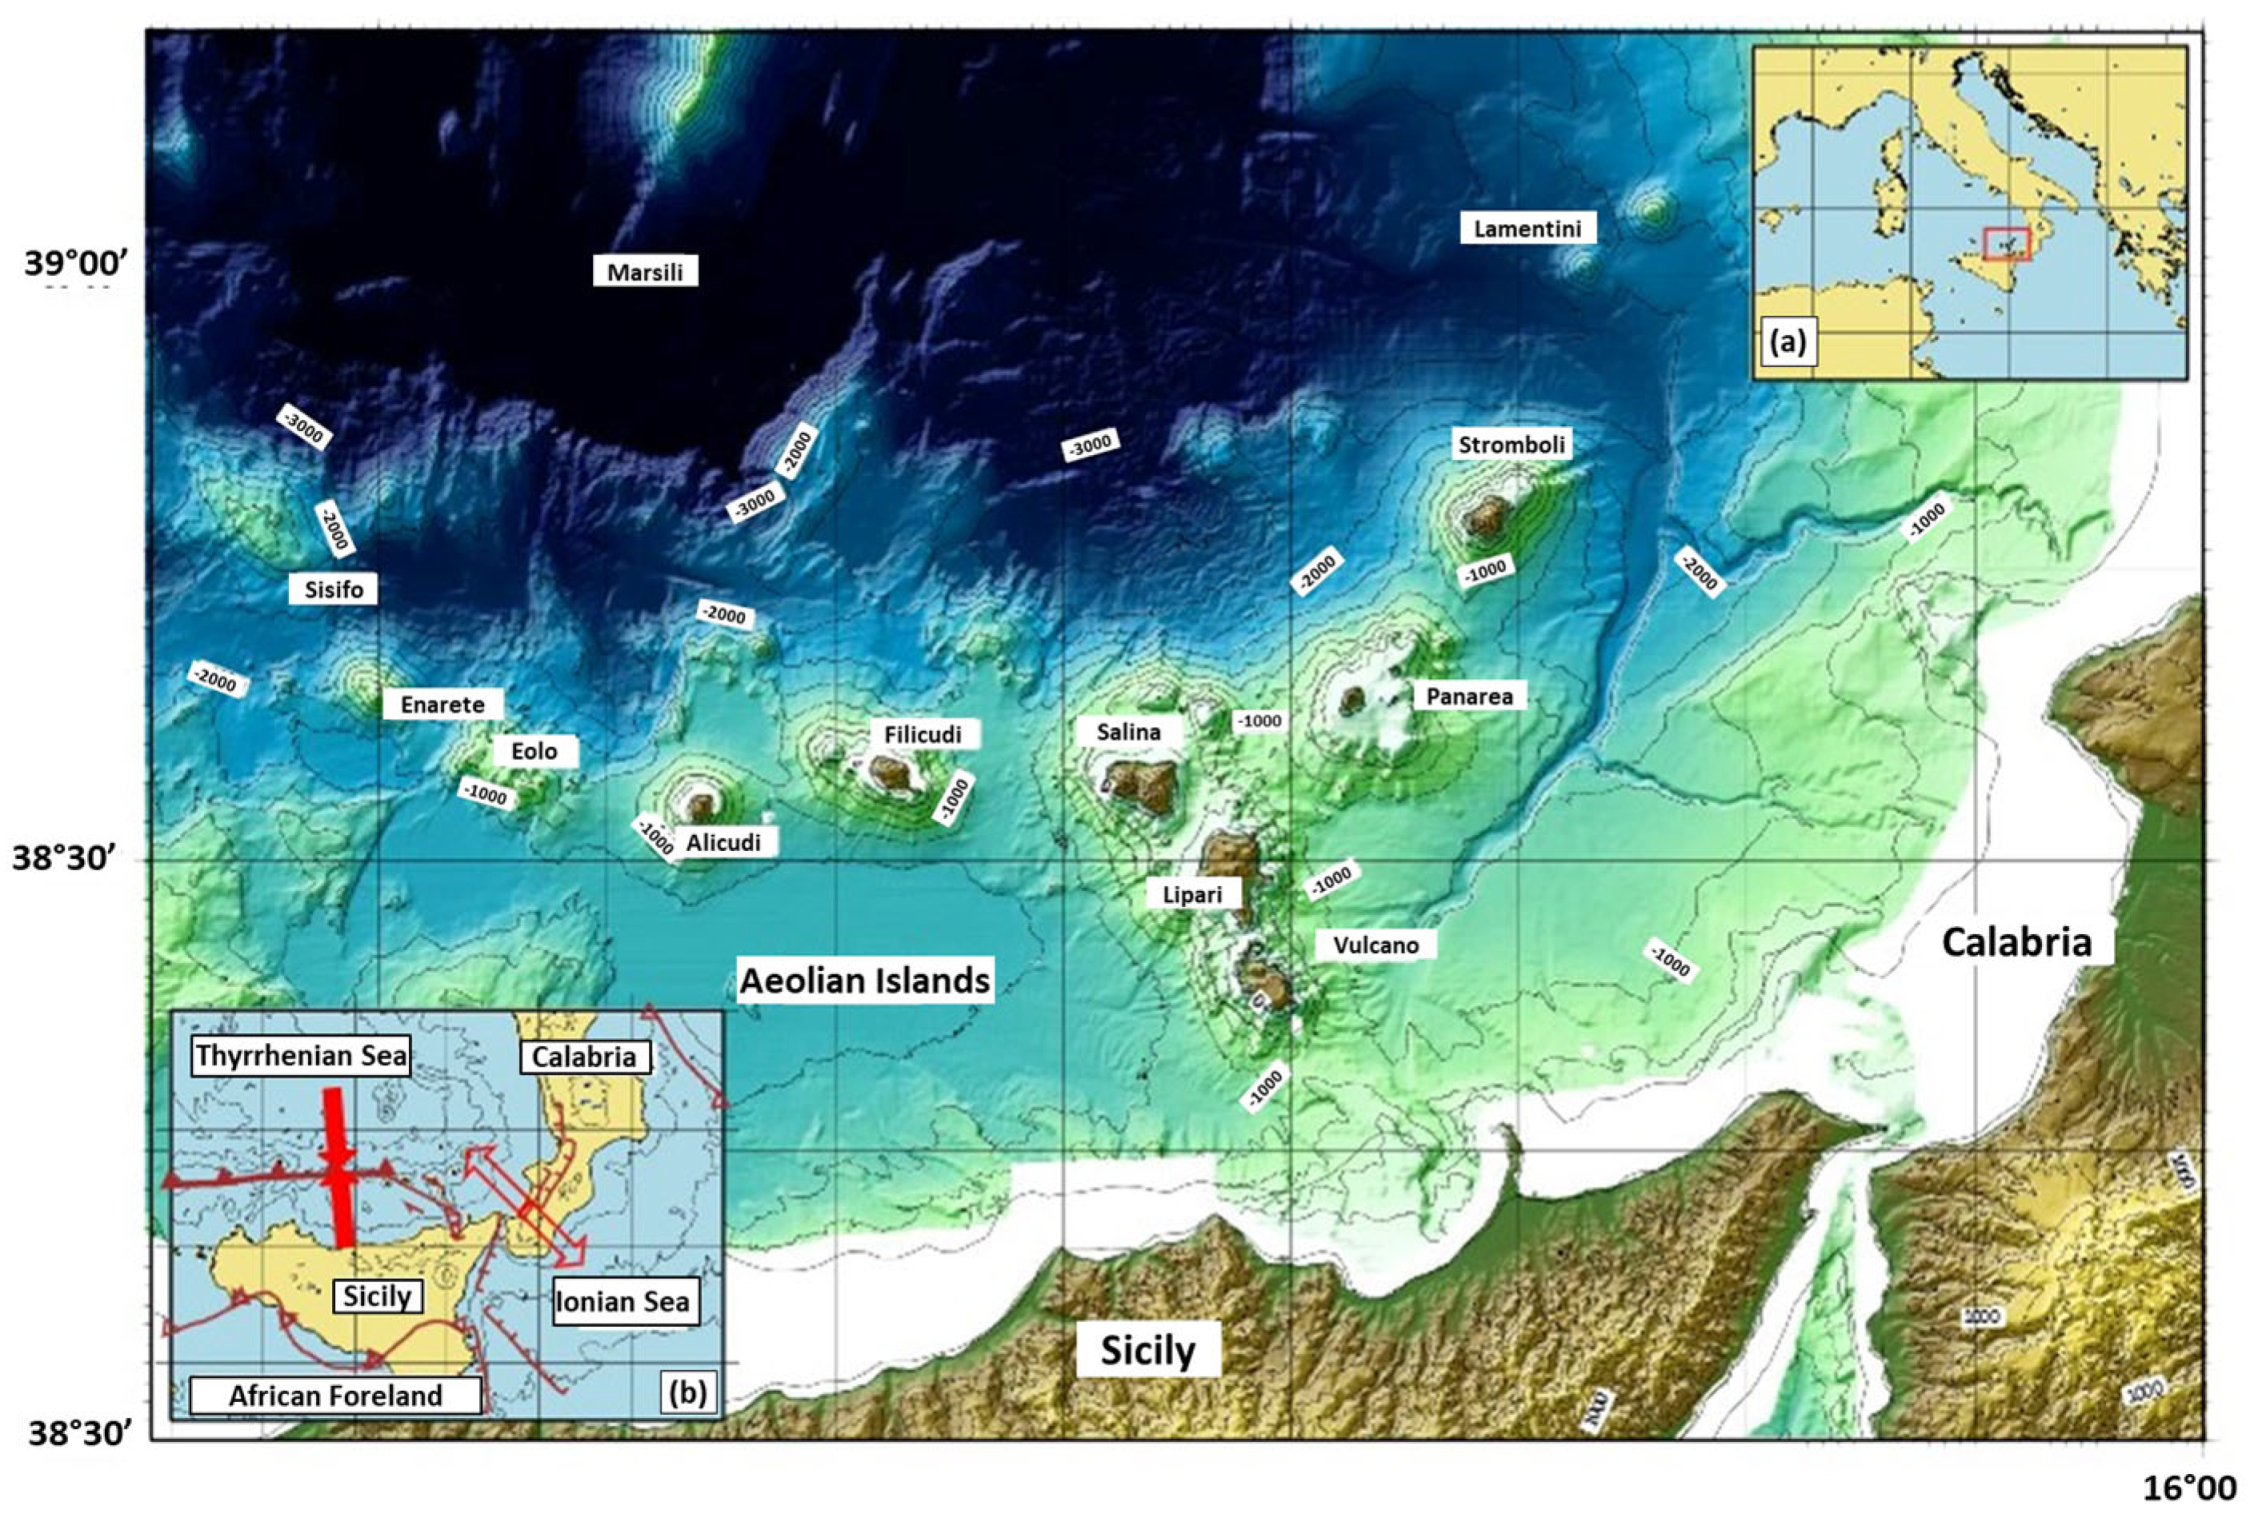
2. Materials and Methods
3. Results
3.1. Bathymetric Investigations
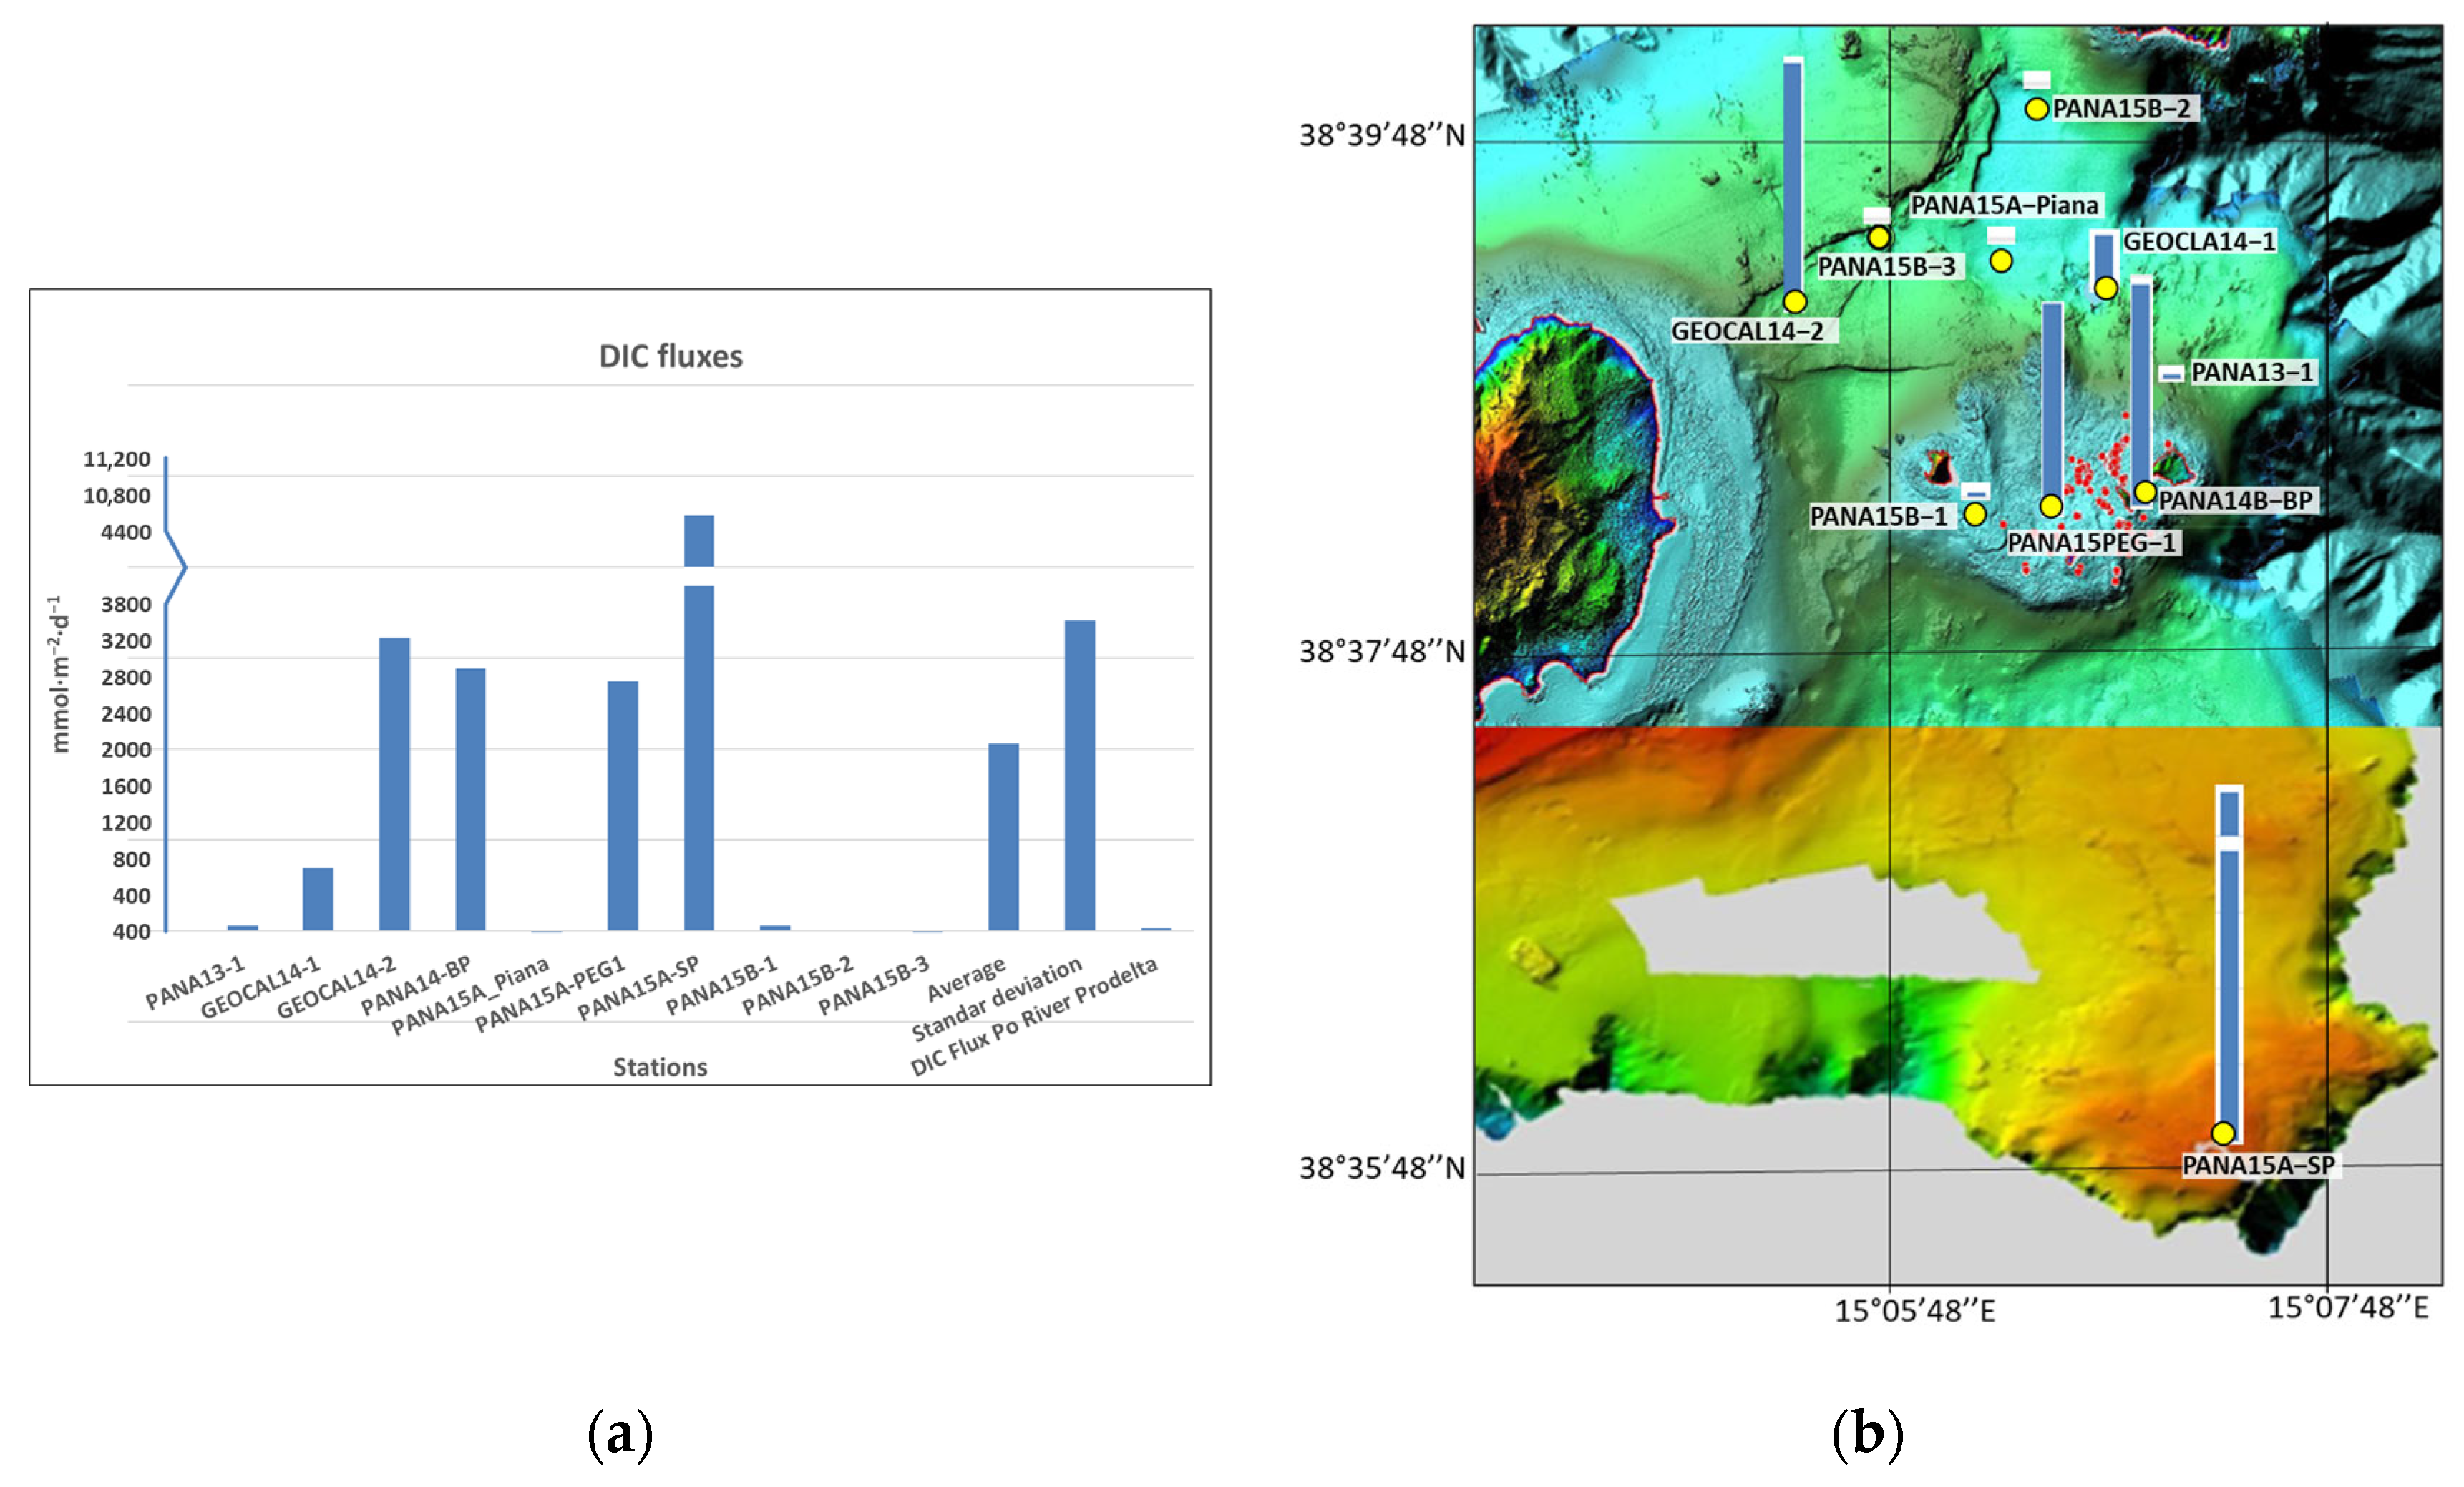
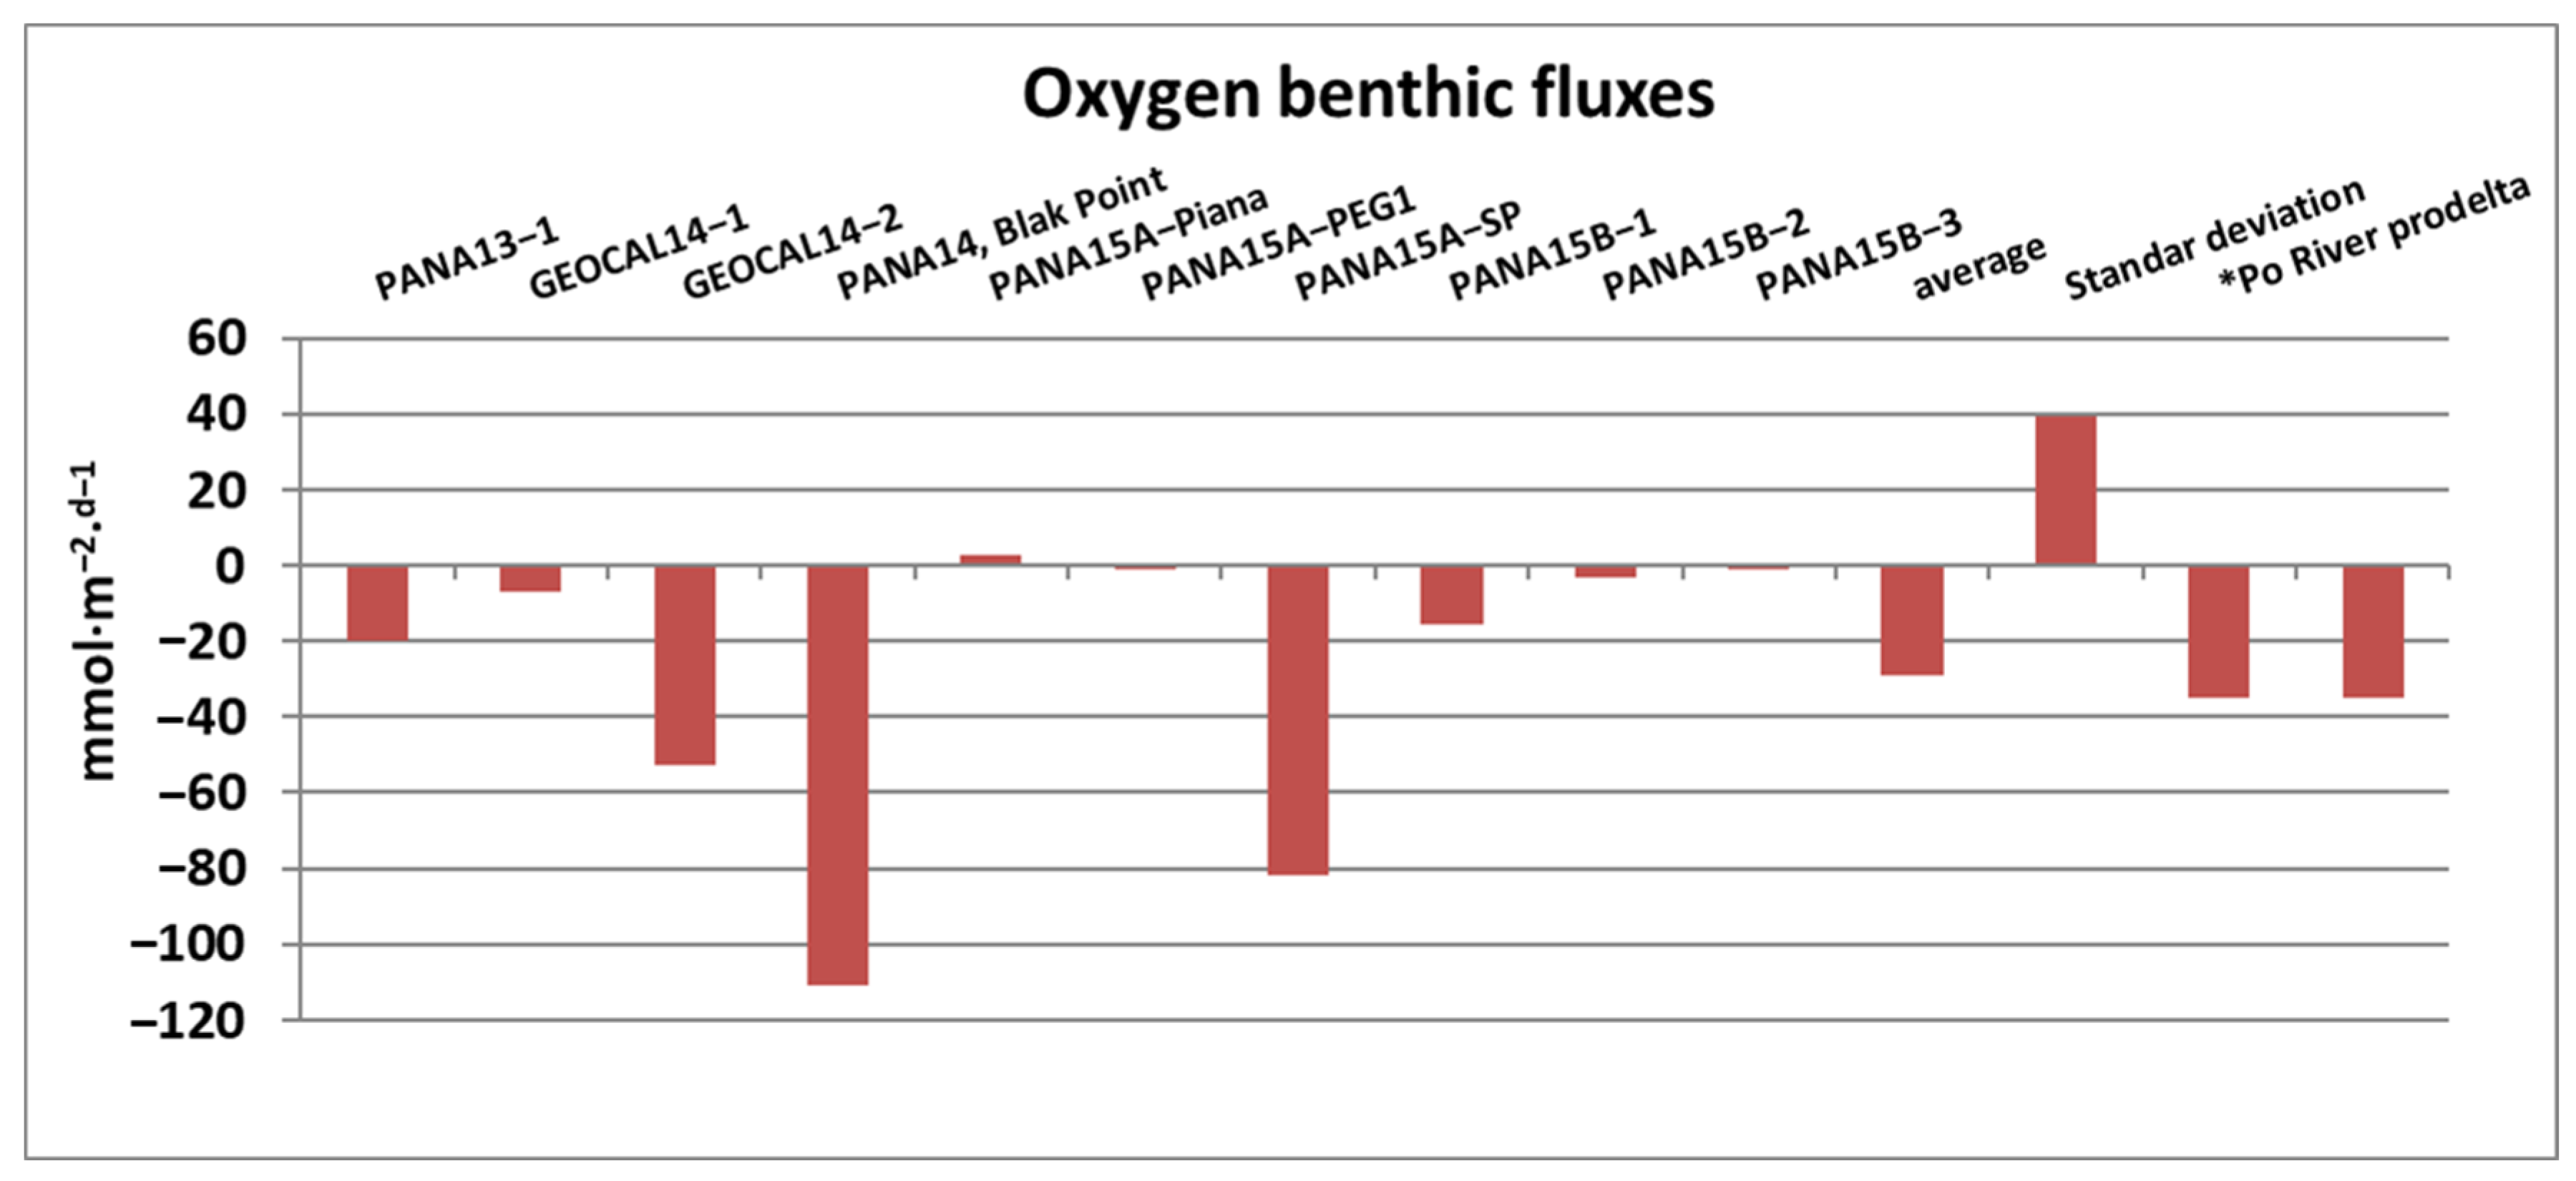
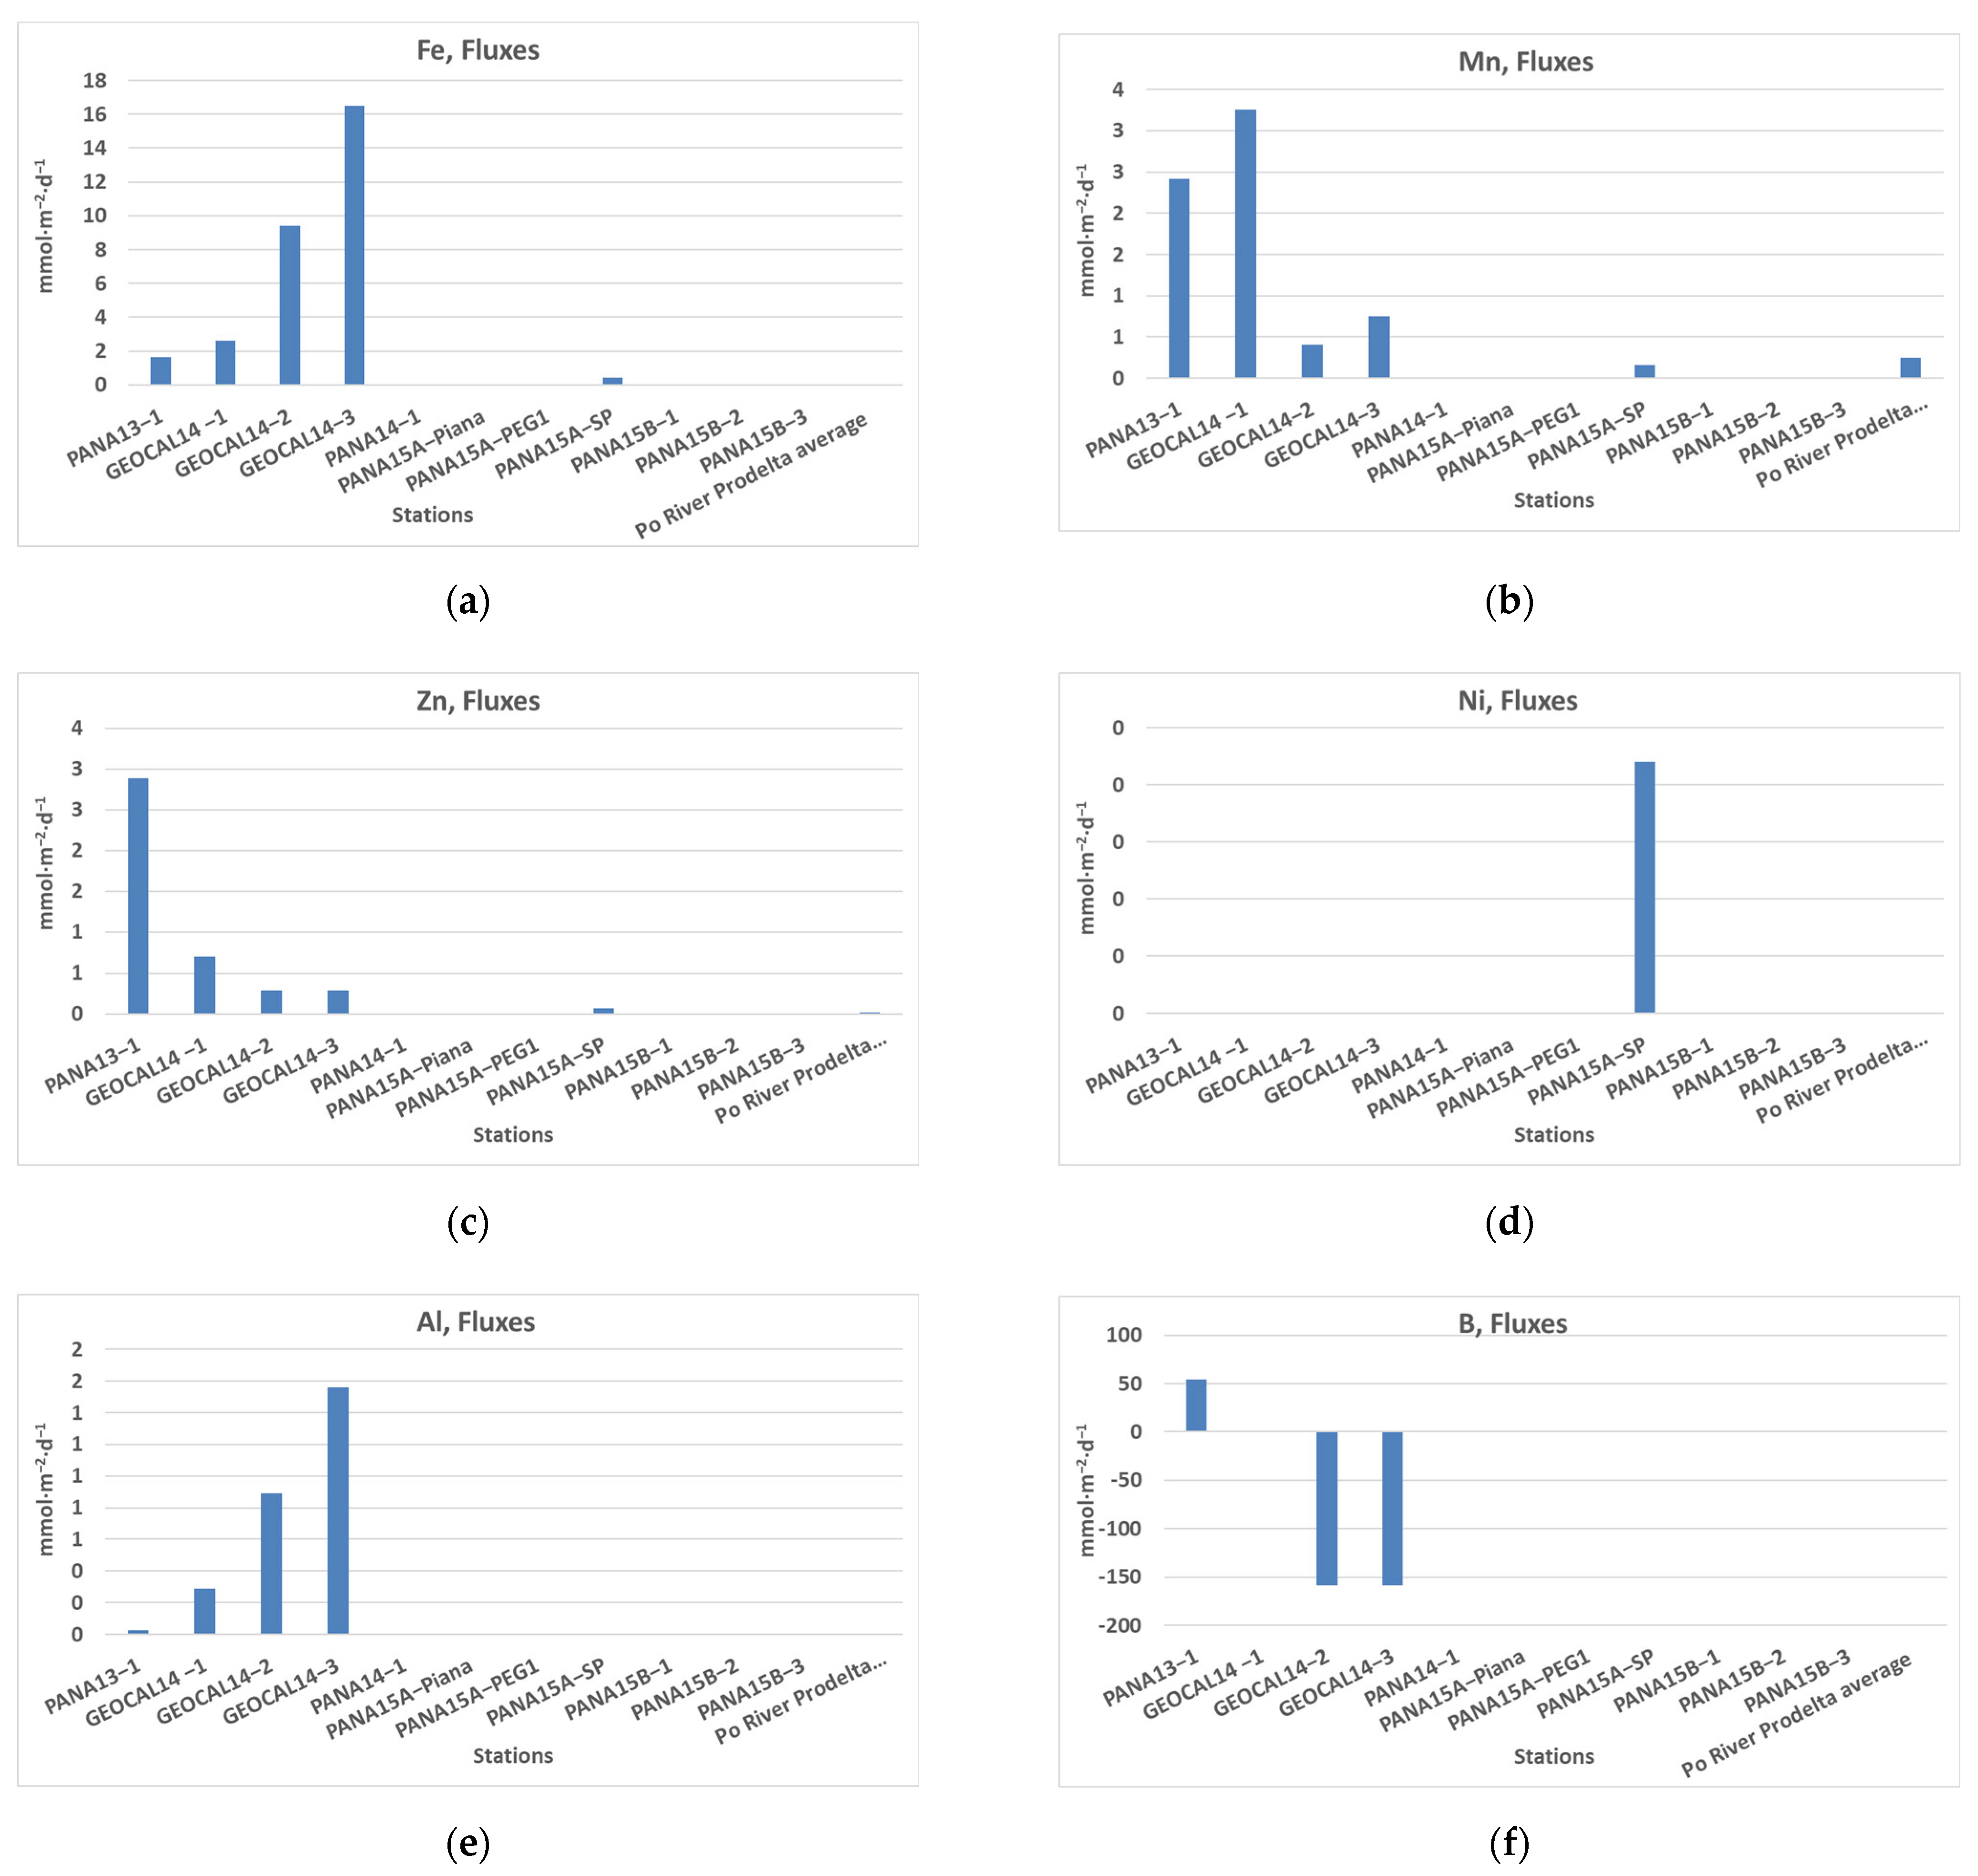
3.2. Flux Estimation and Oceanographic Data
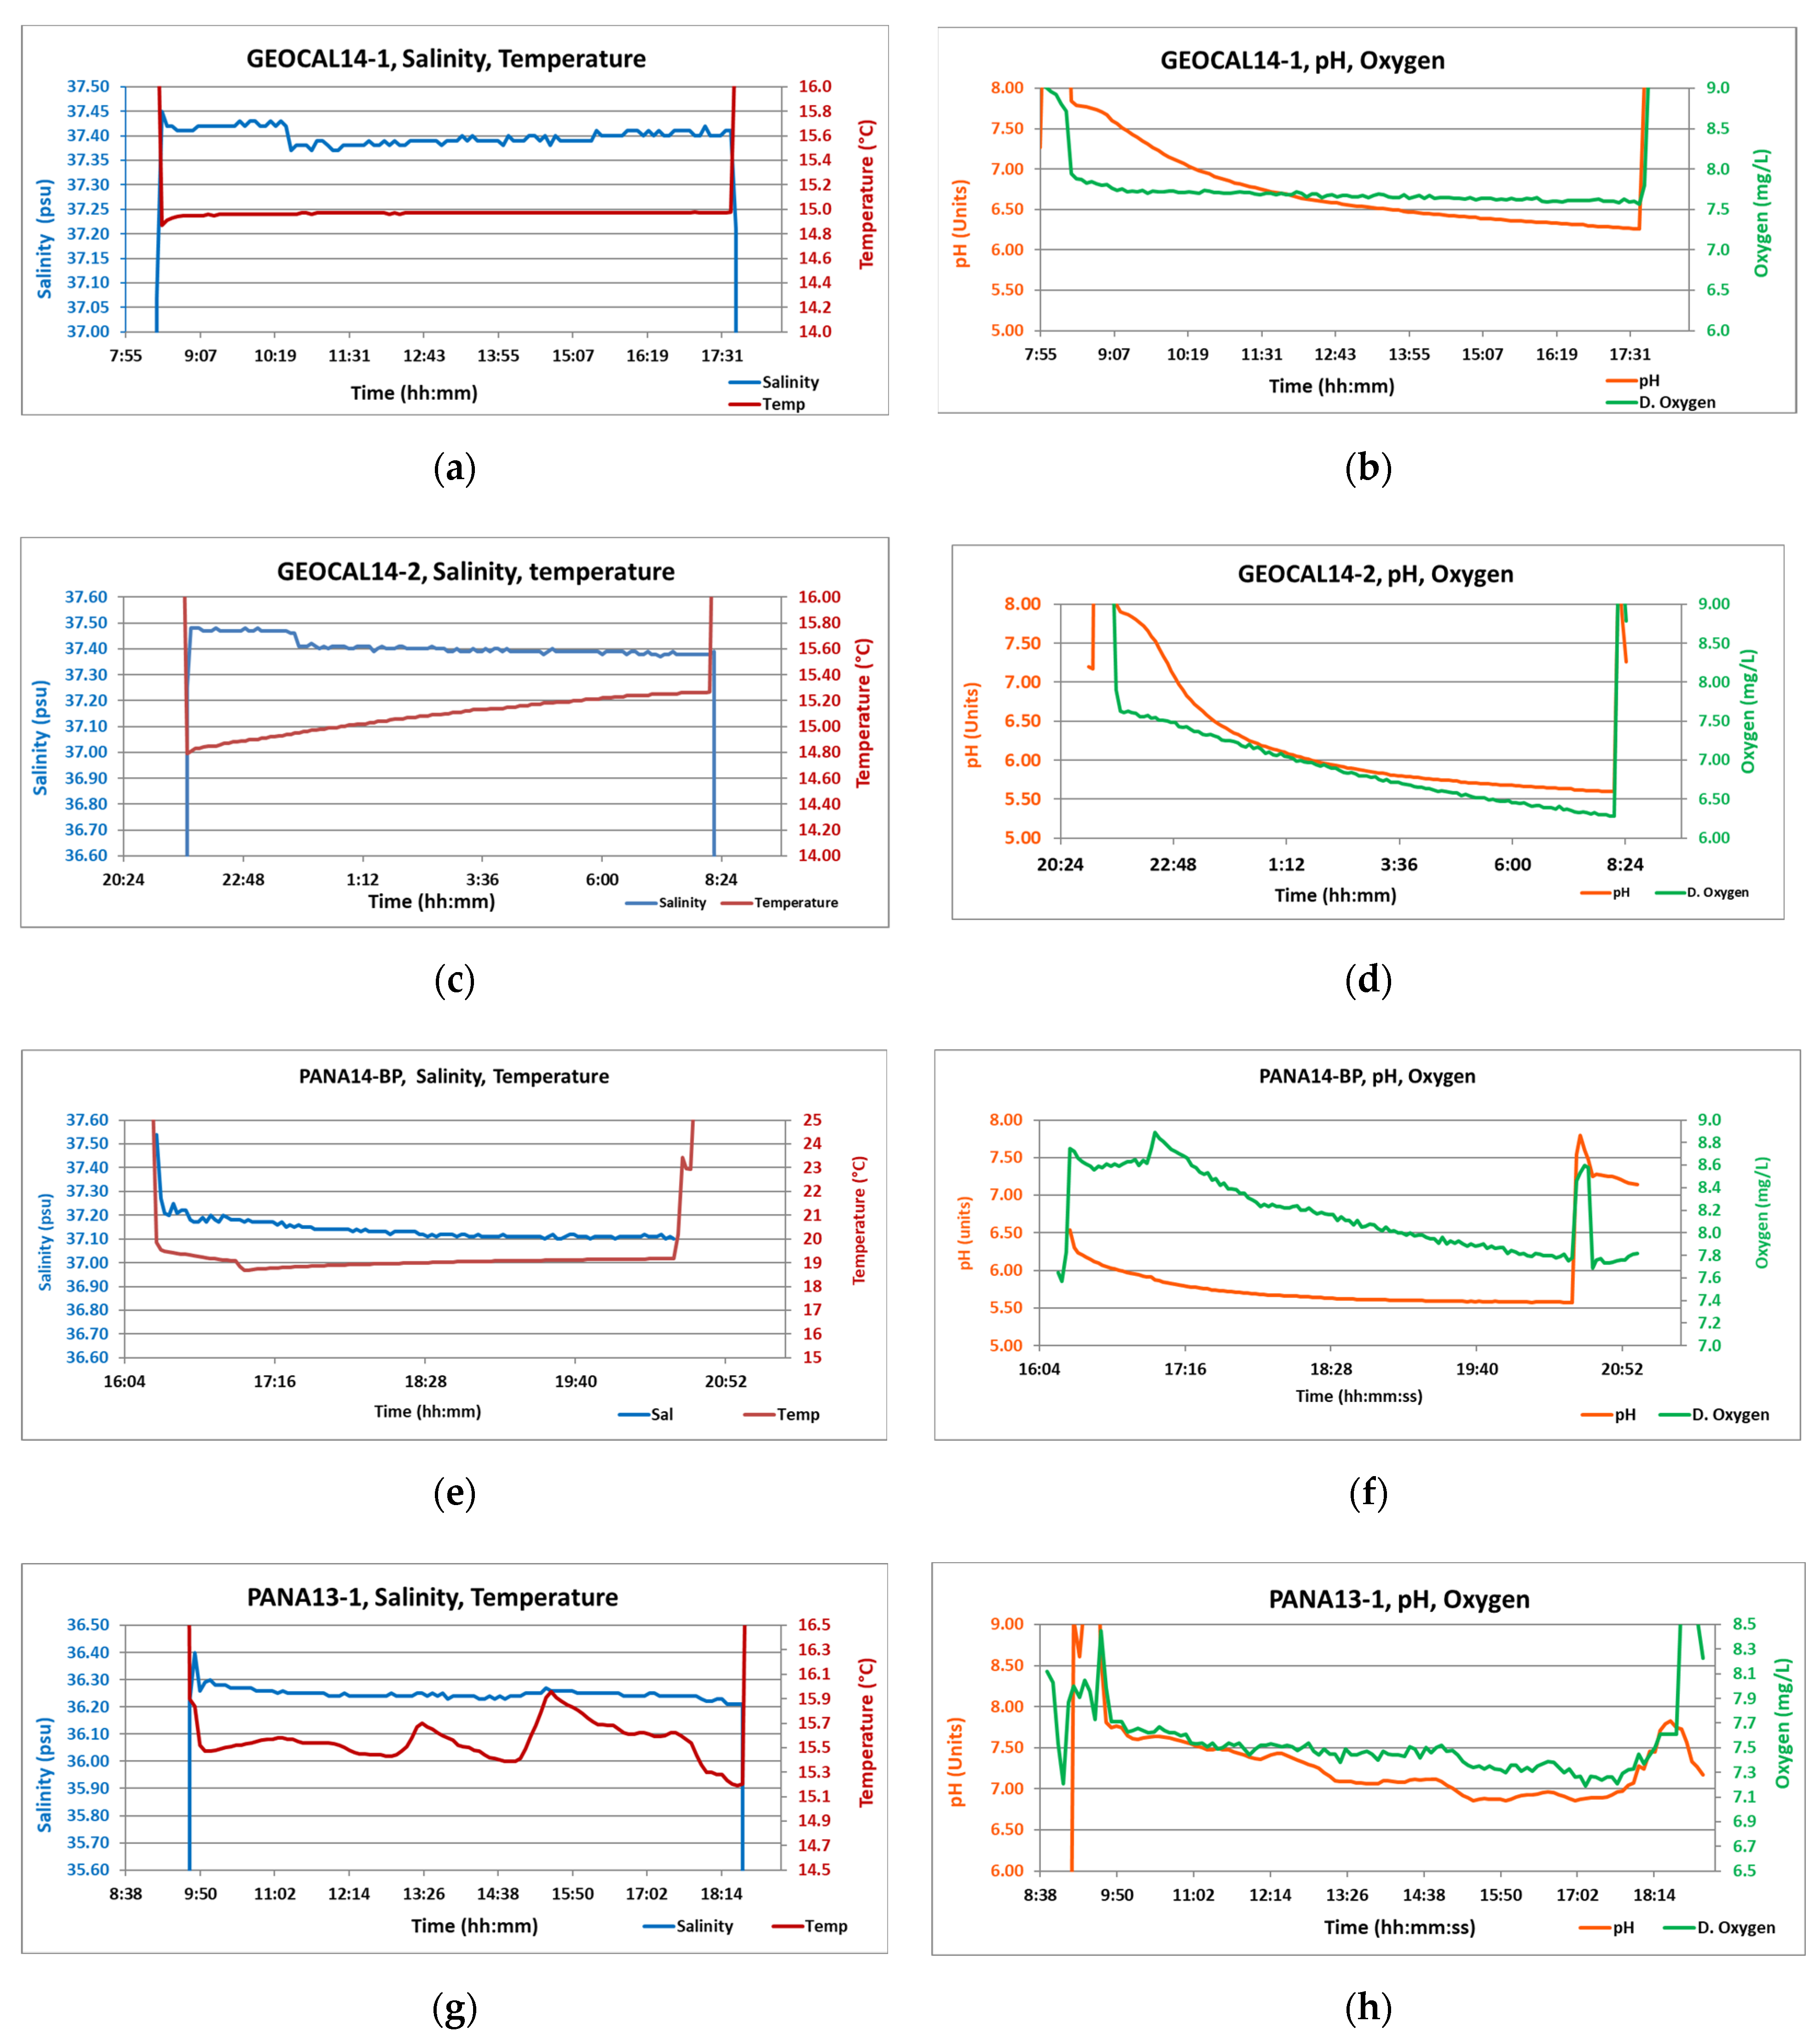
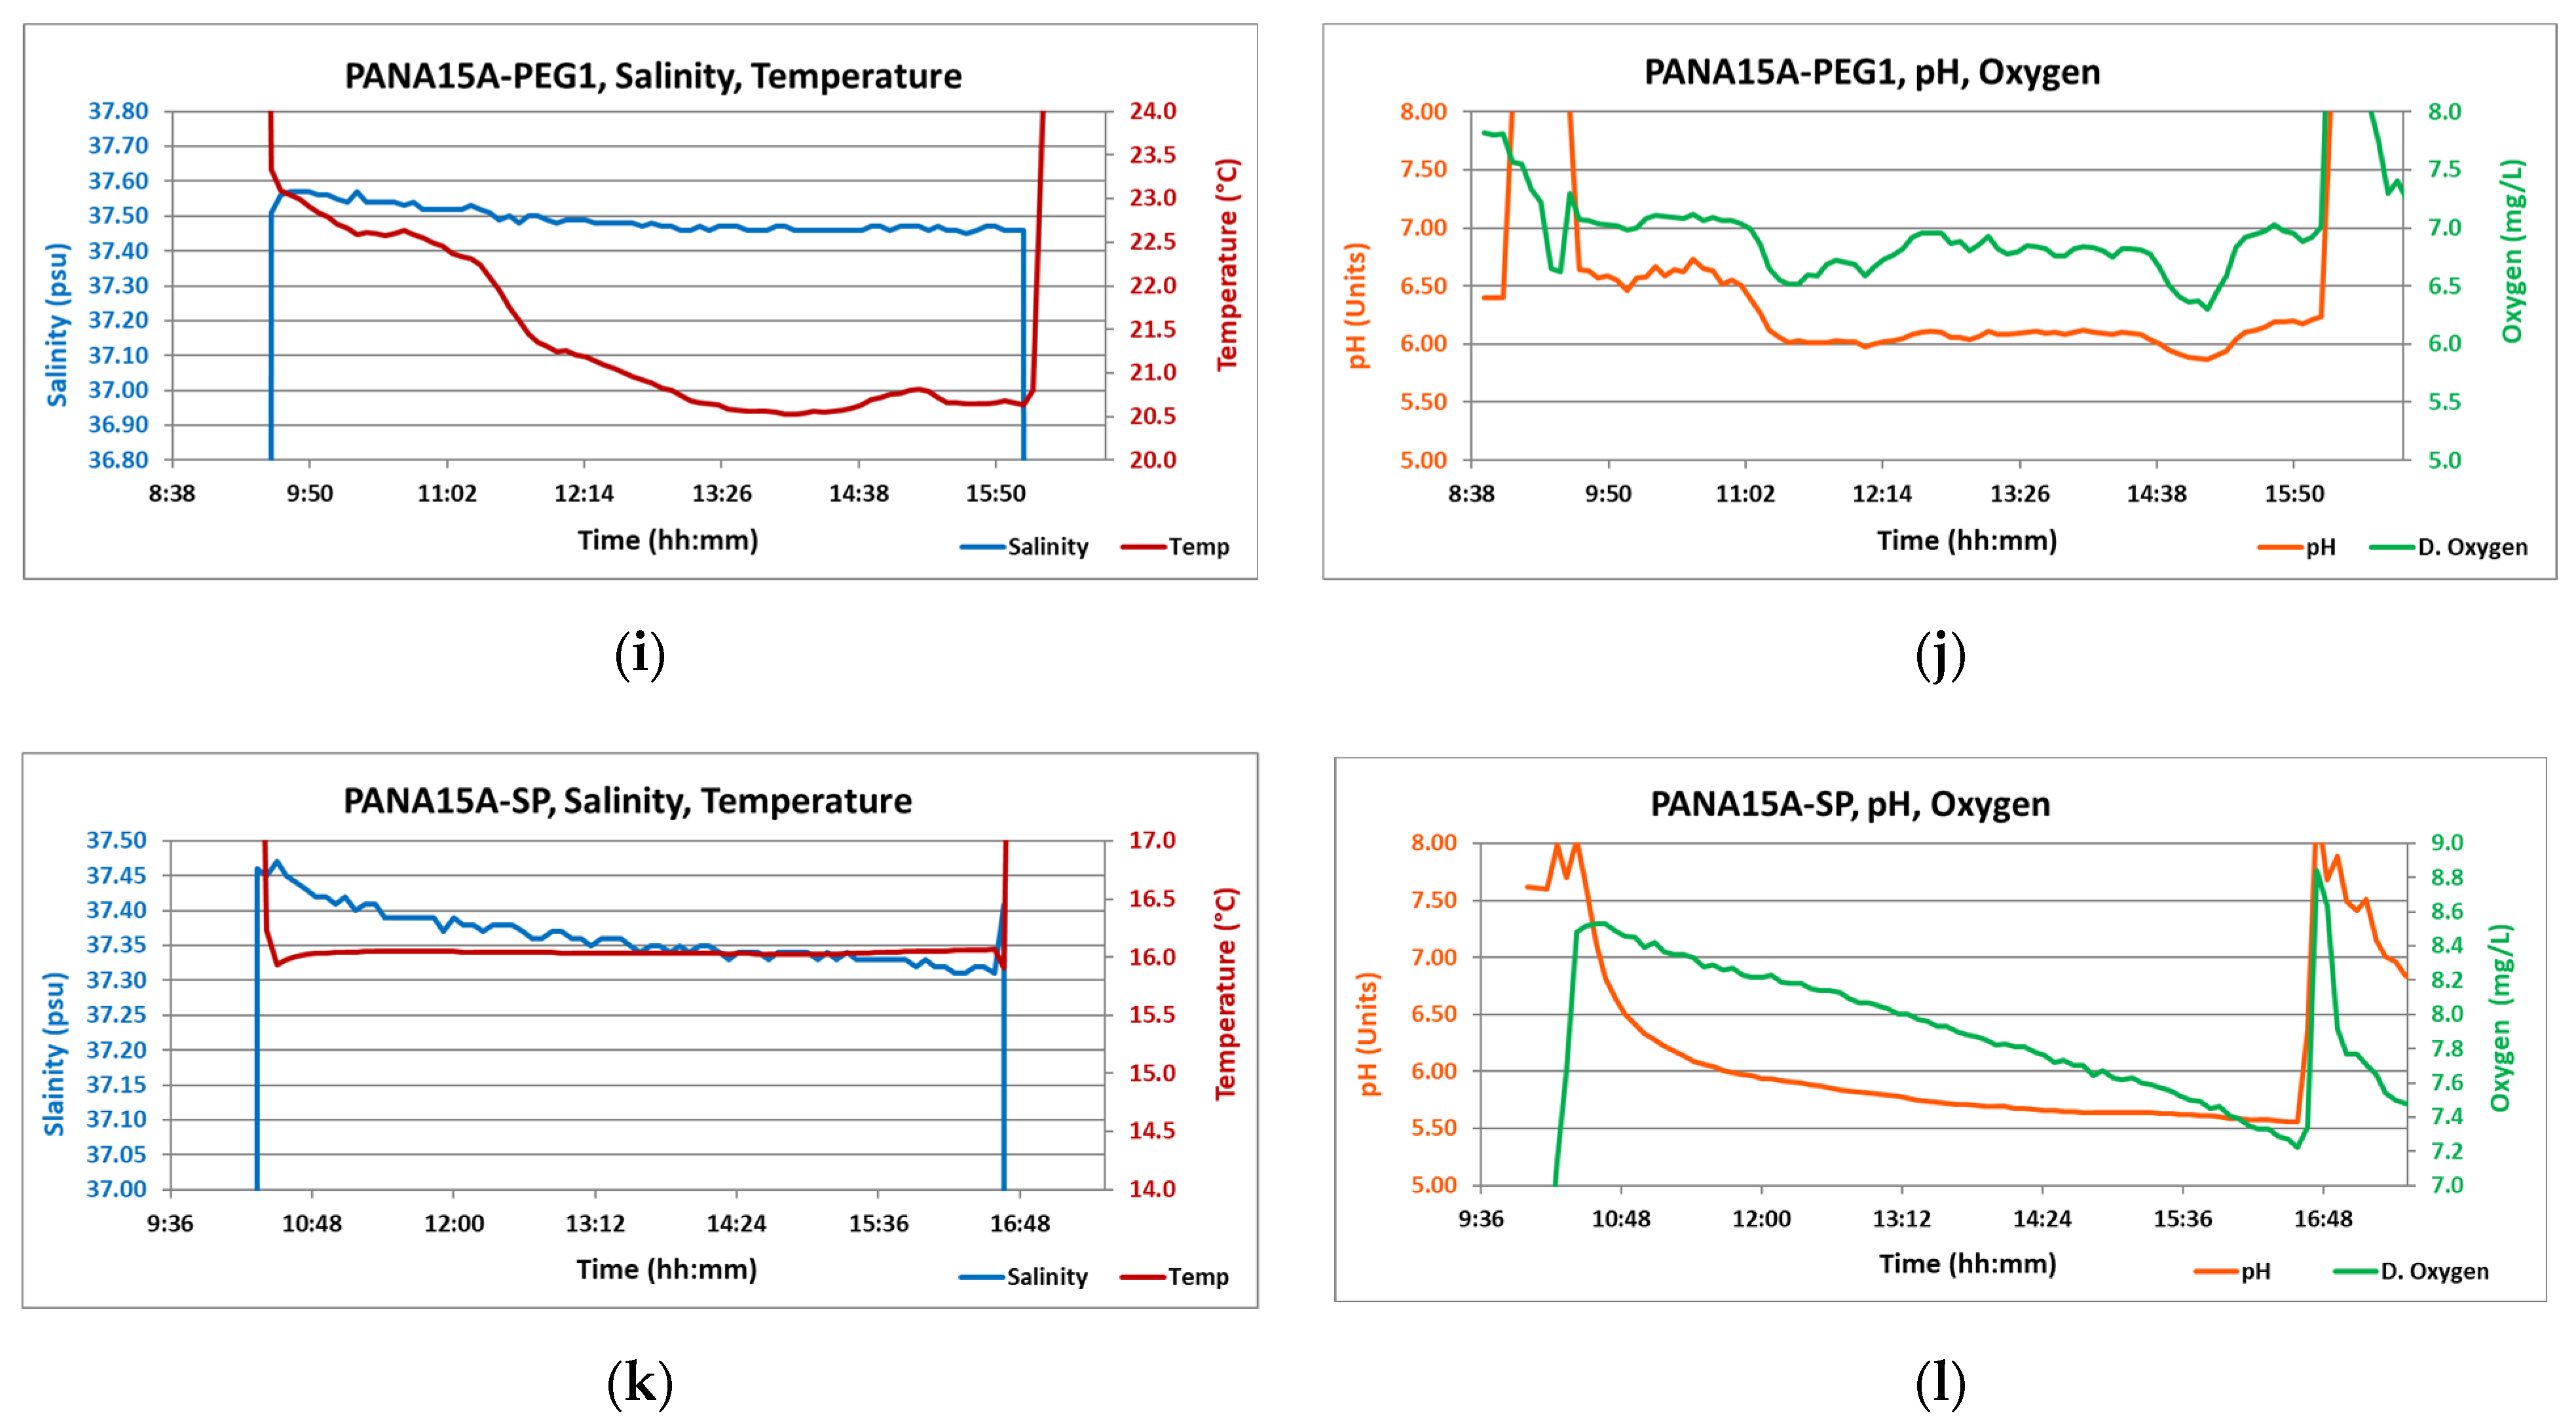
3.2.1. Physicochemical Parameters Measured in the AdaN Benthic Chamber
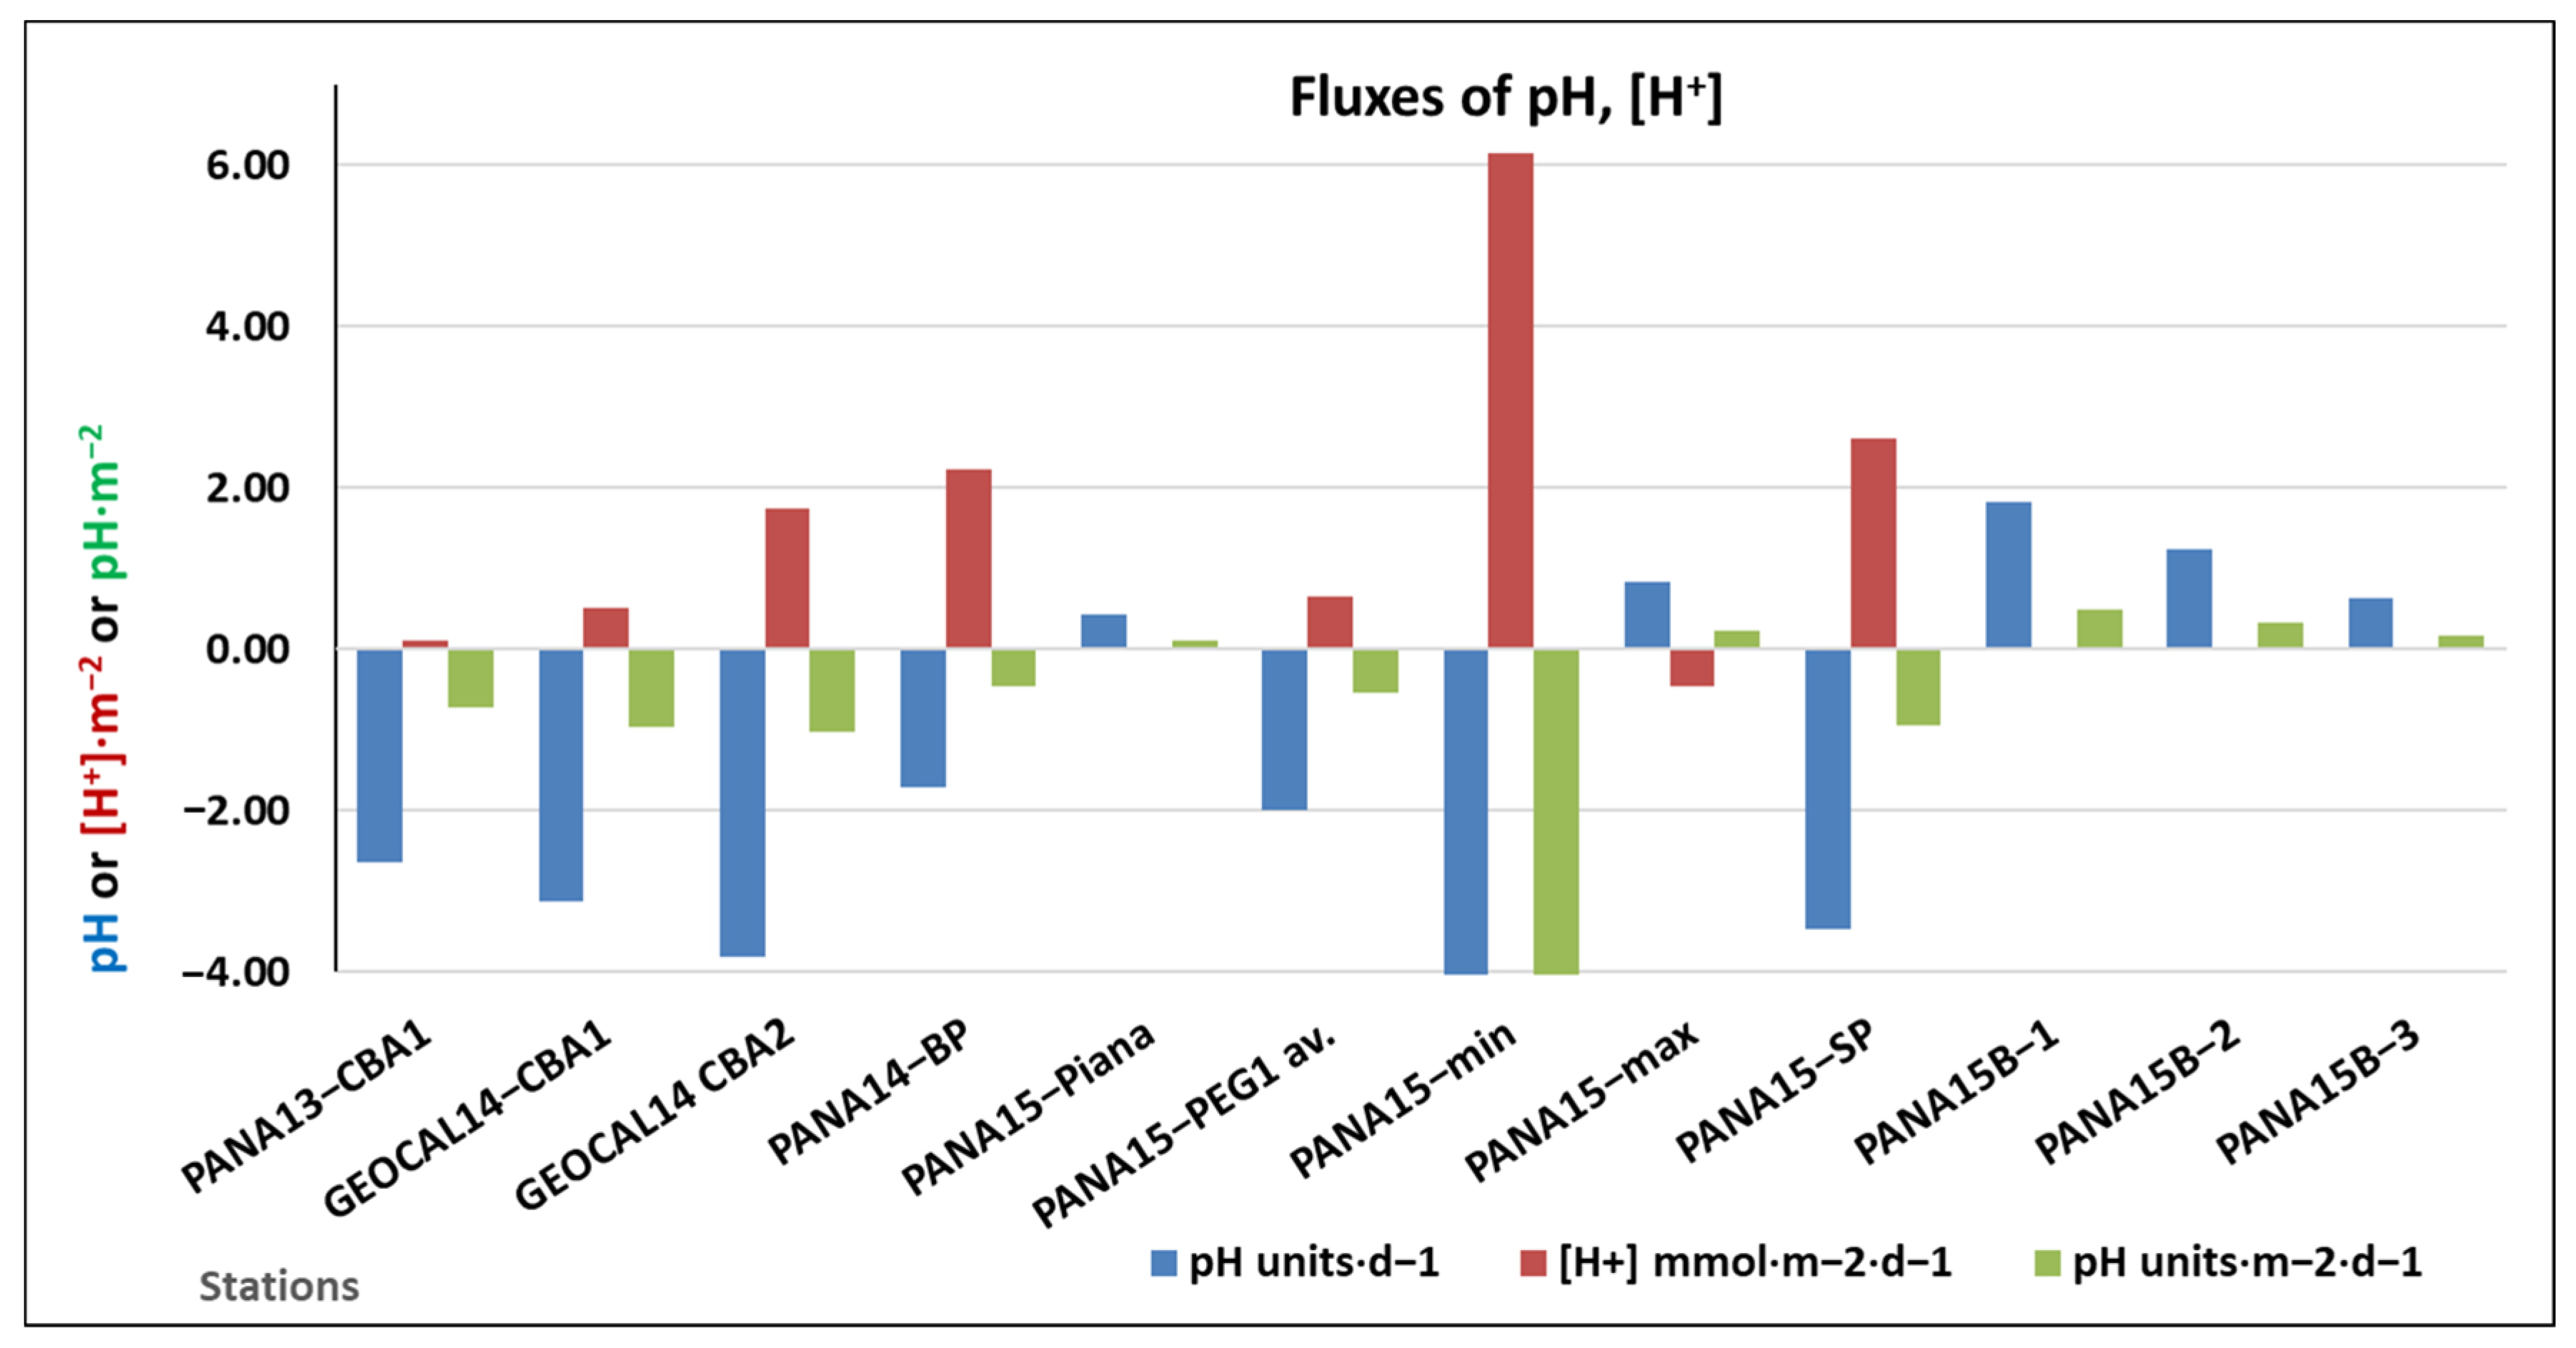
3.2.2. Dissolved Fluxes at the Sediment–Water Interface Measured by AdaN
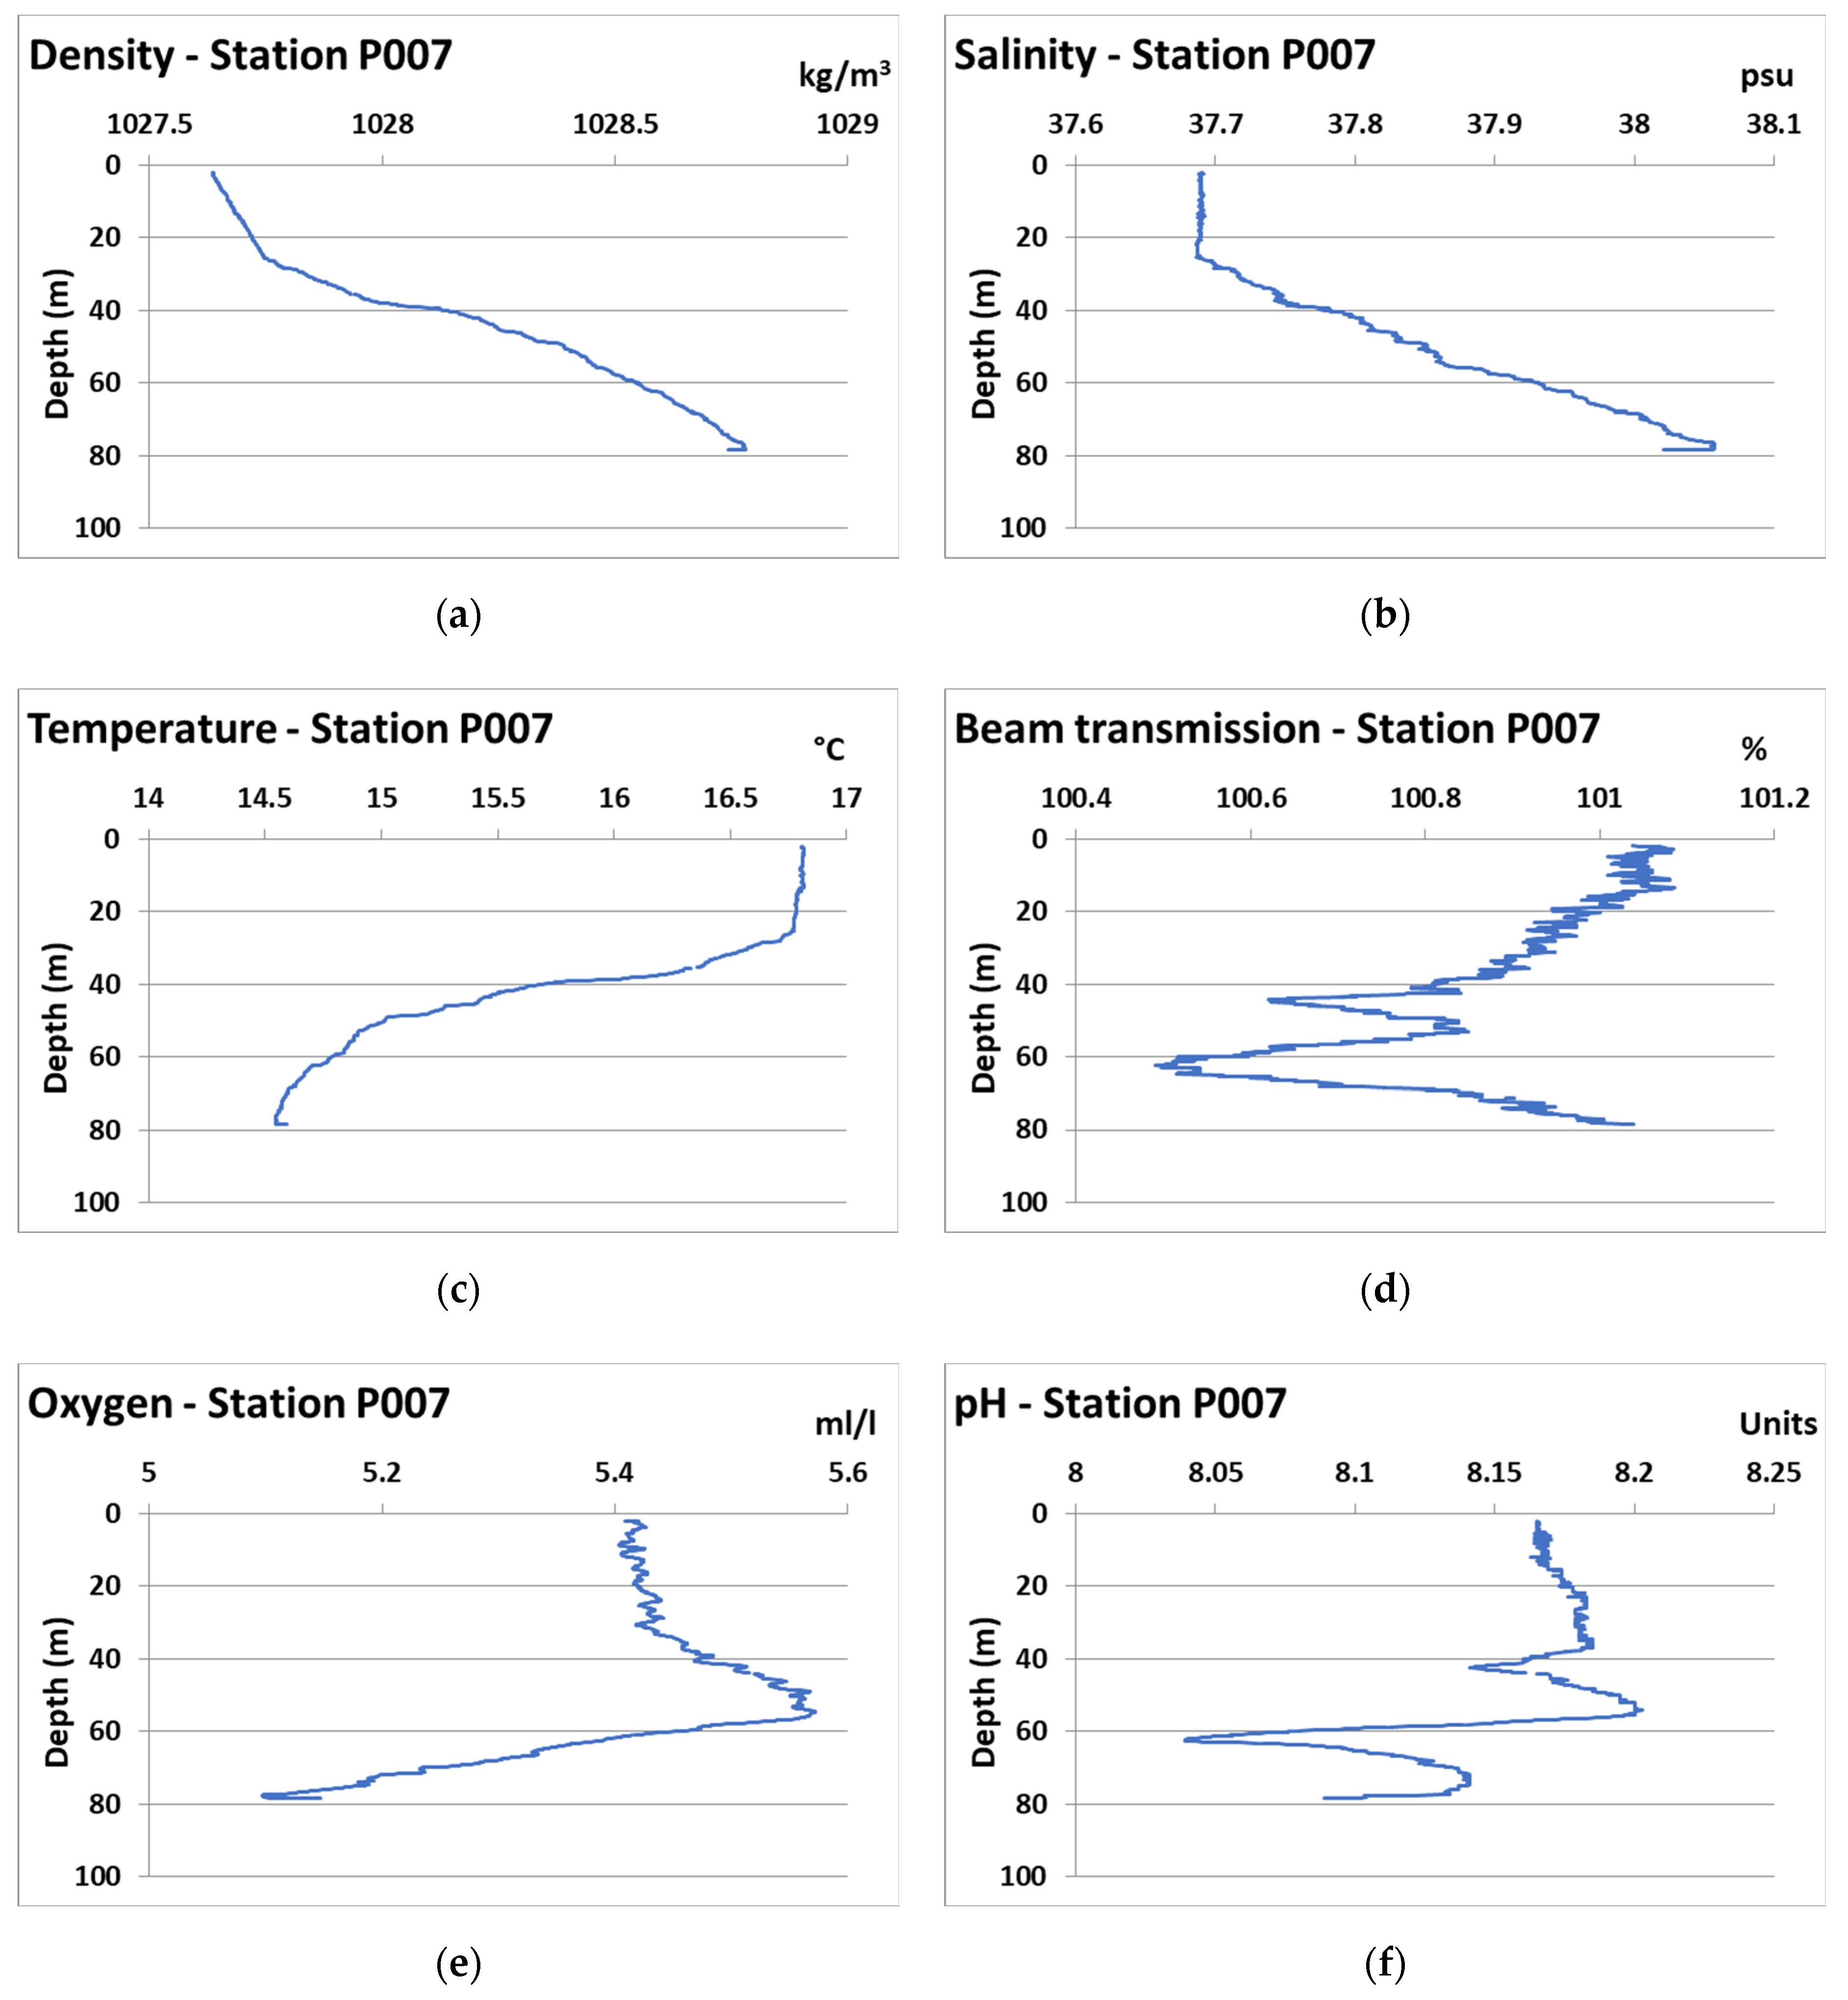
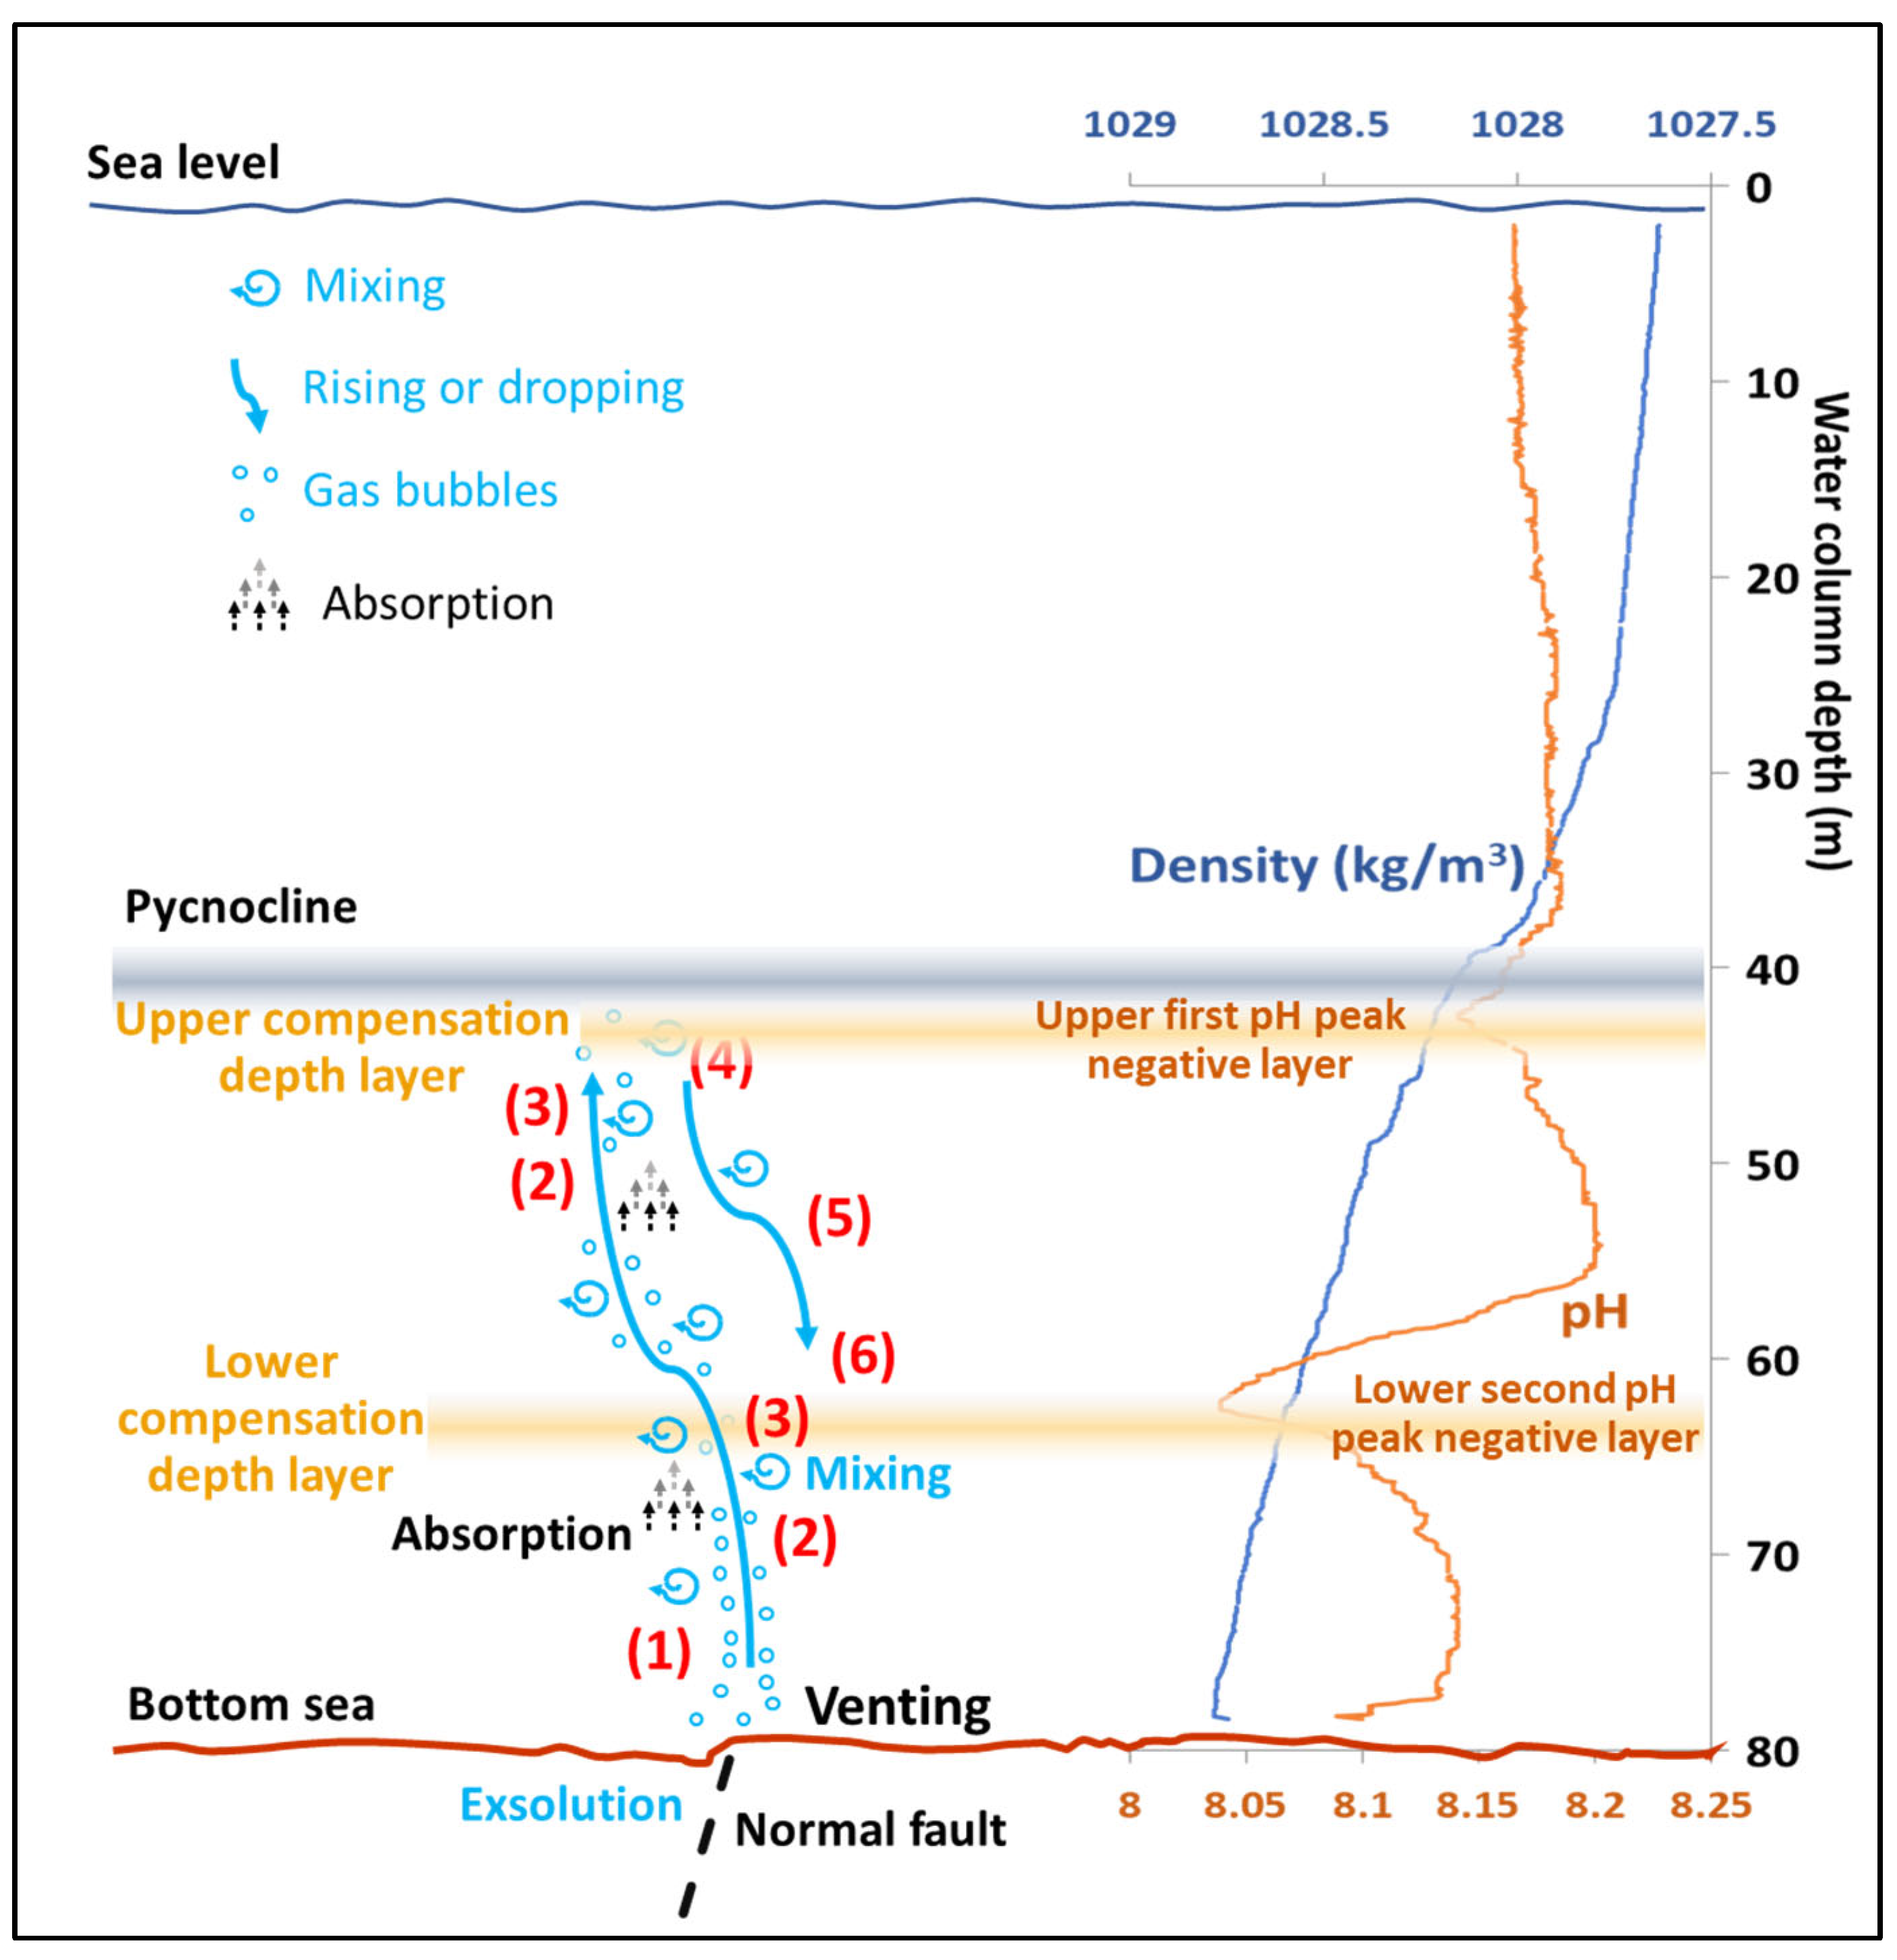
3.3. Water Column Data
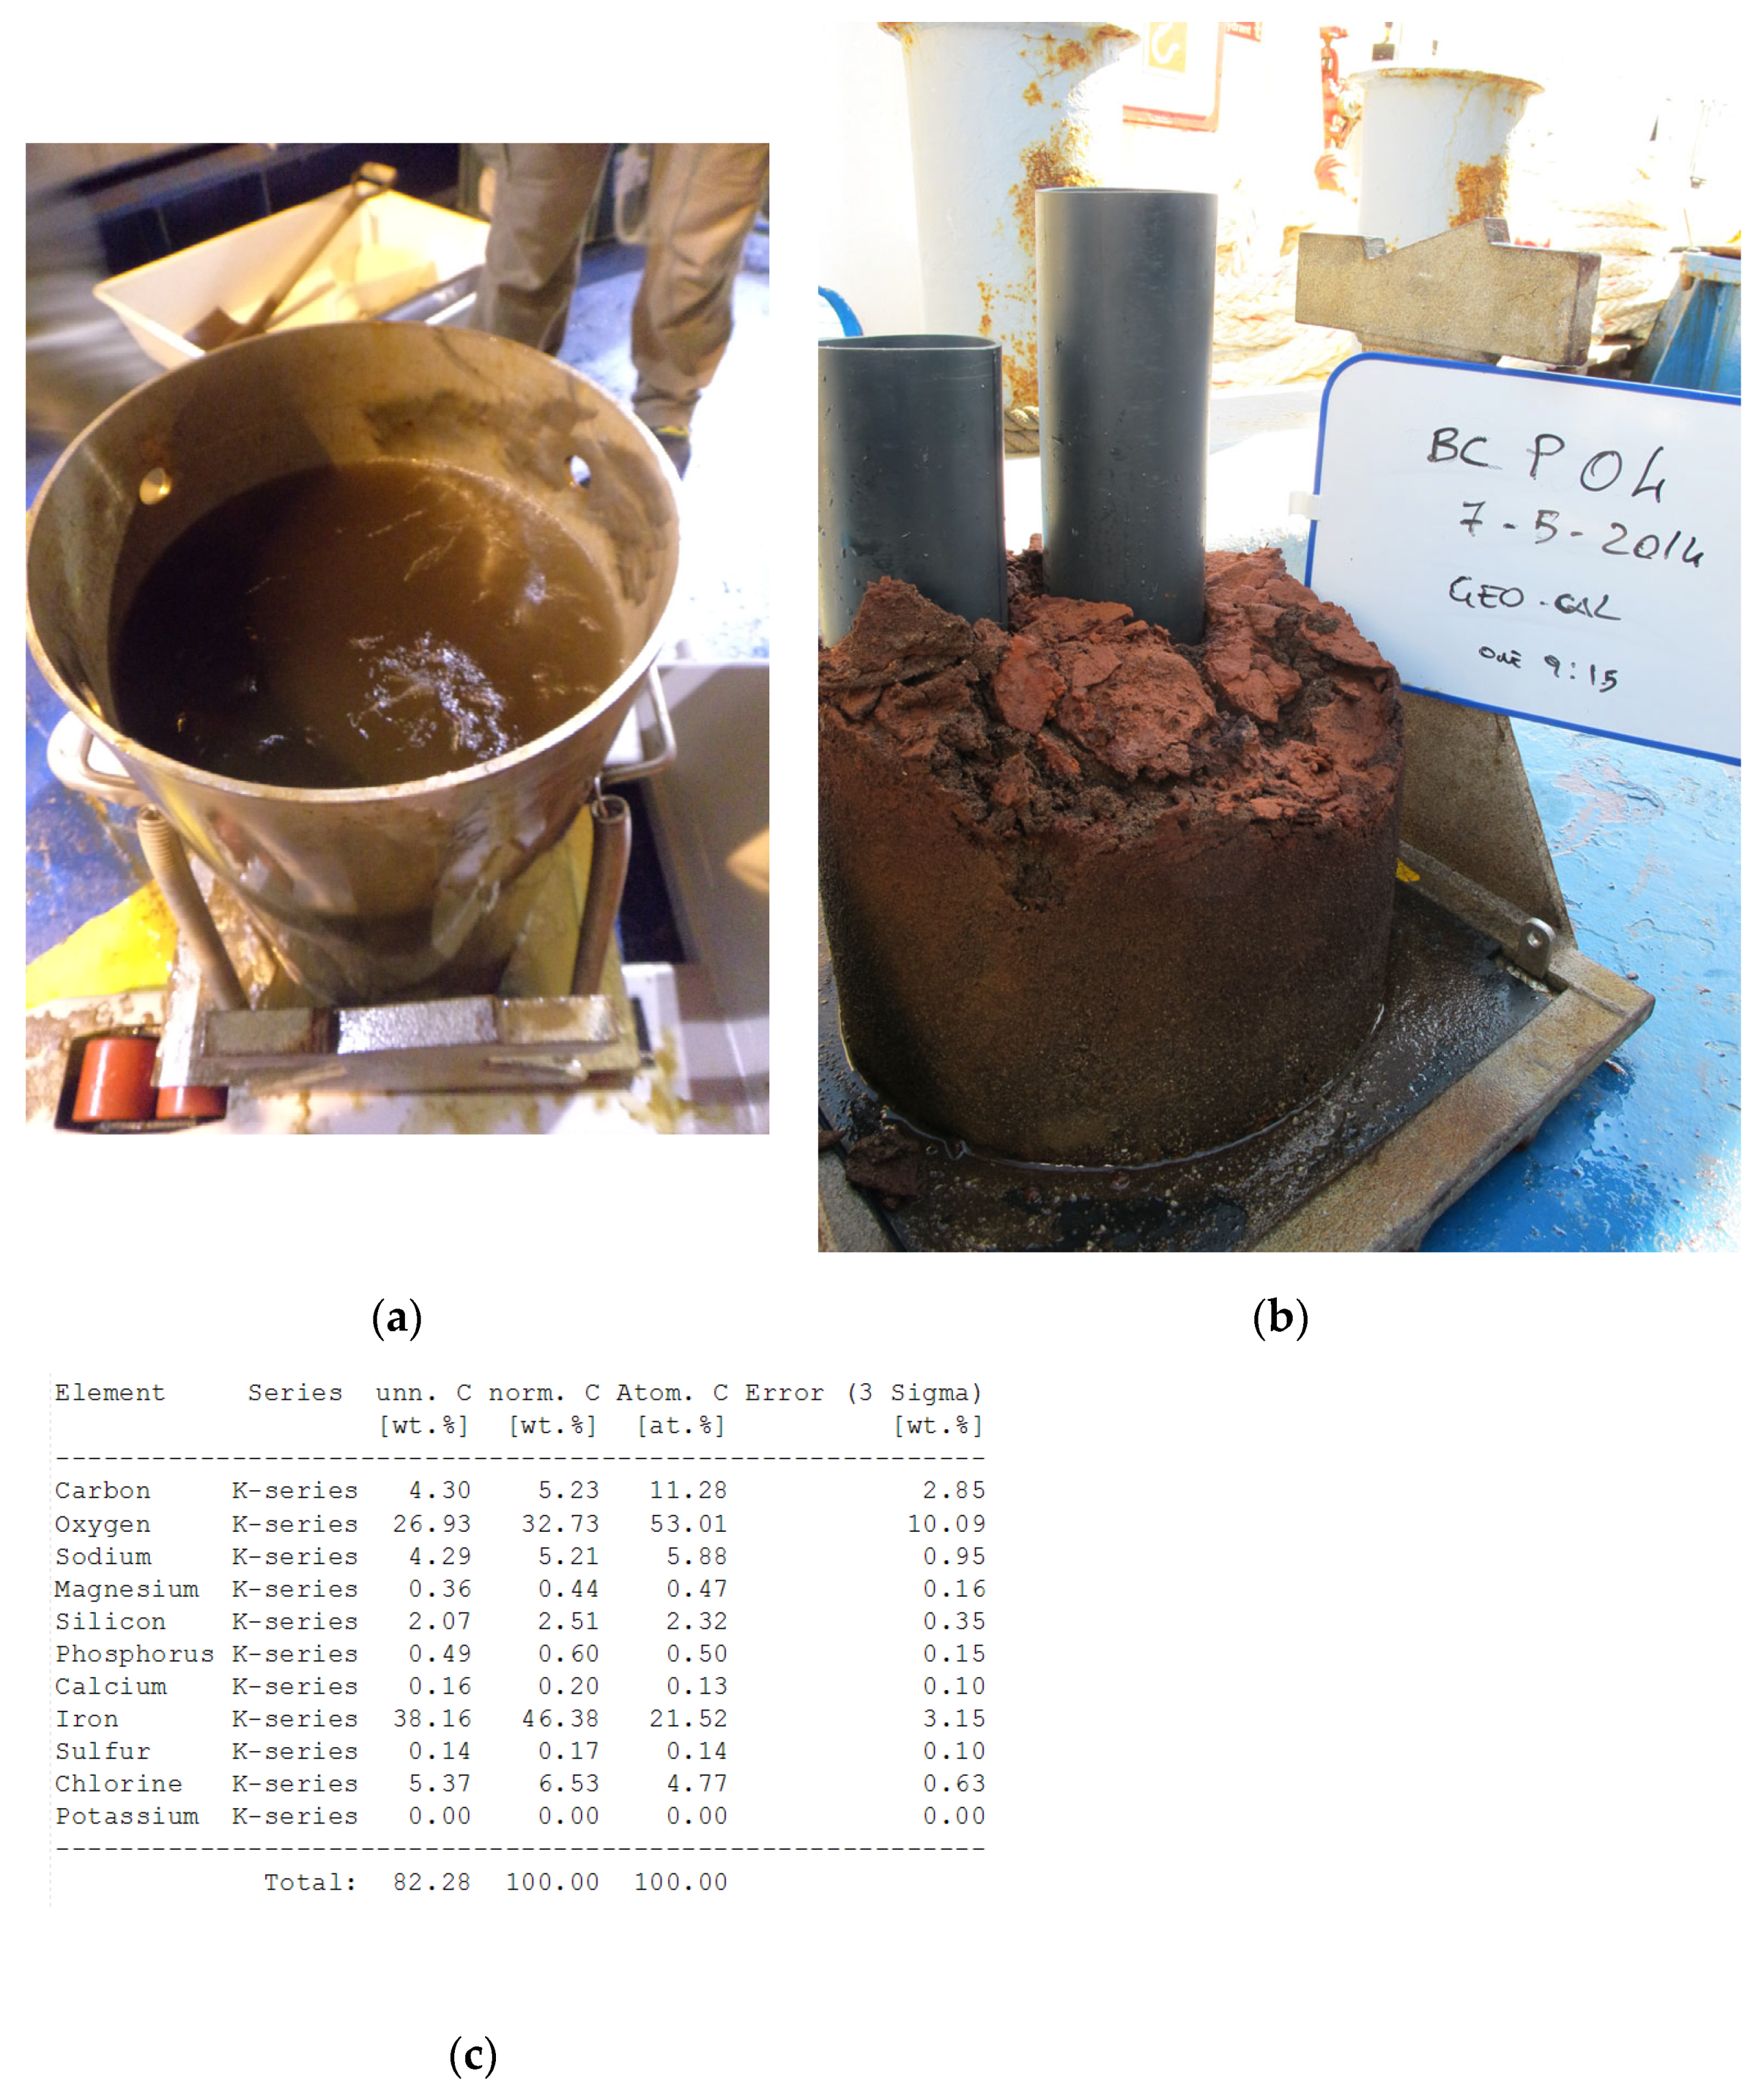
3.4. Deposit and Crust
4. Discussion
5. Conclusions
Author Contributions
Funding
Data Availability Statement
Acknowledgments
Conflicts of Interest
References
- Billi, A.; Barberi, G.; Faccenna, C.; Neri, G.; Pepe, F.; Sulli, A. Tectonics and seismicity of the Tindari Fault System, southern Italy: Crustal deformations at the transition between ongoing contractional and extensional domains located above the edge of a subducting slab. Tectonics 2006, 25, TC2006. [Google Scholar] [CrossRef]
- Marani, M.P.; Gamberi, F.; Savelli, C. Shallow-water polymetallic sulfide deposits in the Aeolian island arc. Geology 1997, 25, 815–818. [Google Scholar] [CrossRef]
- Savelli, C.; Marani, M.; Gamberi, F. Geochemistry of metalliferous, hydrothermal deposits in the Aeolian Arc (Tyrrhenian Sea). J. Volcanol. Geotherm. Res. 1999, 88, 305–323. [Google Scholar] [CrossRef]
- Gamberi, F.; Savelli, C.; Marani, M.P.; Ligi, M.; Bortoluzzi, G.; Landuzzi, V.; Costa, M. Contesto morfo-tettonico e depositi idrotermali di solfuri ed ossidi di ferro in una porzione sommersa dell’arco eoliano (in base ad indagini ad alta definizione). Boll. Soc. Geol. Ital. 1998, 117, 55–71. [Google Scholar]
- Boatta, F.; D’Alessandro, W.; Gagliano, A.L.; Liotta, M.; Milazzo, M.; Rodolfo-Metalpa, R.; Hall-Spencer, J.M.; Parello, F. Geochemical survey of Levante Bay, Vulcano Island (Italy), a natural laboratory for the study of ocean acidification. Mar. Pollut. Bull. 2013, 73, 485–494. [Google Scholar] [CrossRef] [PubMed]
- Barberi, F.; Gandino, A.; Gioncada, A.; La Torre, P.; Sbrana, A.; Zenucchini, C. The deep structure of the Eolian arc (Filicudi-Panarea-Vulcano sector) in light of gravity, magnetic and volcanological data. J. Volcanol. Geotherm. Res. 1994, 61, 189–206. [Google Scholar] [CrossRef]
- Argnani, A.; Savelli, C. Cenozoic volcanism and tectonics in the Southern Tyrrhenian Sea: Space time distribution and geodynamic significance. J. Geodyn. 1999, 27, 409–432. [Google Scholar] [CrossRef]
- Argnani, A. The Southern Tyrrhenian Subduction System: Recent Evolution and Neotectonic Implications. Ann. Geophys. 2000, 43, 585–607. [Google Scholar] [CrossRef]
- Calanchi, N.; Peccerillo, A.; Tranne, C.; Lucchini, F.; Rossi, P.L.; Kempton, P.; Barbieri, W.; Woo, T.W. Petrology and geochemistry of volcanic rocks from the island of Panarea: Implications for mantle evolution beneath the Aeolian island arc (Southern Tyrrhenian sea). J. Volcanol. Geoth. Res. 2002, 115, 367–395. [Google Scholar] [CrossRef]
- De Astis, G.; Ventura, G.; Vilardo, G. Geodynamic significance of the Aeolian volcanism (Southern Tyrrhenian Sea, Italy) in light of structural, seismological, and geochemical data. Tectonics 2003, 22, 1040. [Google Scholar] [CrossRef]
- Dekov, V.M.; Savelli, C. Hydrothermal activity in the SE Tyrrhenian Sea: An overview of 30 years of research. Mar. Geol. 2004, 204, 161–185. [Google Scholar] [CrossRef]
- Lucchi, F.; Tranne, C.A.; Calanchi, N.; Rossi, P. Late Quaternary deformation history of the volcanic edifice of Panarea, Aeolian Arc. Bull. Volcanol. 2007, 69, 239–257. [Google Scholar] [CrossRef]
- Frezzotti, M.L.; Peccerillo, A.; Panza, G. Earth’s CO2 degassing in Italy. J. Virtual Explor. 2010, 36, 21. [Google Scholar] [CrossRef]
- Argnani, A.; Serpelloni, E.; Bonazzi, C. Pattern of deformation around the central Aeolian Island: Evidence from multichannel seismics and GPS data. Terra Nova 2007, 19, 317–323. [Google Scholar] [CrossRef]
- Gabbianelli, G.; Gillot, P.Y.; Lanzafame, G.; Romagnoli, C.; Rossi, P.L. Tectonic and volcanic evolution of Panarea (Aeolian islands, Italy). Mar. Geol. 1990, 92, 313–326. [Google Scholar] [CrossRef]
- Gamberi, F.; Marani, M.; Savelli, C. Tectonic, volcanic and hydrothermal features of a submarine portion of the Aeolian arc (Tyrrhenian Sea). Mar. Geol. 1997, 140, 167–181. [Google Scholar] [CrossRef]
- Romagnoli, C. Characteristics and morphological evolution of the Aeolian volcanoes from the study of submarine portions. Geological Society, London. Memoirs 2013, 37, 13–26. [Google Scholar] [CrossRef]
- Esposito, A.; Giordano, G.; Anzidei, M. The 2002–2003 submarine gas eruption at Panarea volcano Aeolian Islands, Italy: Volcanology of the seafloor and implications for the hazard scenario. Mar. Geol. 2006, 227, 119–134. [Google Scholar] [CrossRef]
- Italiano, F.; Nuccio, P.M. Geochemical investigations of submarine exhalations to the east of Panarea, Aeolian Islands, Italy. J. Volcanol. Geoth. Res. 1991, 46, 125–141. [Google Scholar] [CrossRef]
- Aliani, L.S.; Bortoluzzi, G.; Caramanna, G.; Raffa, F. Seawater dynamics and environmental settings after November 2002 gas eruption off Bottaro (Panarea, Aeolian Islands, Mediterranean Sea). Cont. Shelf Res. 2010, 30, 1338–1348. [Google Scholar] [CrossRef]
- Anzidei, M.; Esposito, A.; Bortoluzzi, G.; Degiosa, F. The high resolution map of the exhalative area of Panarea (Aeolian Is., Italy). Ann. Geophys. 2005, 48, 899–921. [Google Scholar]
- Esposito, V.; Andaloro, F.; Canese, S.; Bortoluzzi, G.; Bo, M.; Di Bella, M.; Italiano, F.; Sabatino, G.; Battaglia, P.; Consoli, P.; et al. Exceptional discovery of a shallow-water hydrothermal site in the SW area of Basiluzzo islet (Aeolian archipelago, South Tyrrhenian Sea): An environment to preserve. PLoS ONE 2018, 13, e0190710. [Google Scholar] [CrossRef] [PubMed]
- Dekov, V.; Kamenov, G.; Abrasheva, M.; Capaccioni, B.; Munnik, F. Mineralogical and geochemical investigation of seafloor massive sulfides from Panarea Platform (Aeolian Arc, Tyrrhenian Sea). Chem. Geol. 2013, 335, 136–148. [Google Scholar] [CrossRef]
- Peters, M.; Strauss, H.; Petersen, S.; Kummer, N.-A.; Thomazo, C. Hydrothermalism in the Tyrrhenian Sea: Inorganic anc microbial sulfur cycling as revealed by geochemical and multiple Sulphur isotope data. Chem. Geol. 2011, 280, 217–231. [Google Scholar] [CrossRef]
- Price, R.E.; La Rowe, D.E.; Italiano, F.; Savov, I.; Pichler, T.; Amend, J.P. Subsurface hydrothermal processes and the bioenergetics of chemolithoautotrophy at the shallow-sea vents off Panarea Island (Italy). Chem. Geol. 2015, 407, 21–45. [Google Scholar] [CrossRef]
- Bortoluzzi, G.; Aliani, A.; D’Oriano, F.; Ligi, M.; Riminucci, F.; Carmisciano, C.; Cocchi, L.; Muccini, F. Multidisciplinary investigations at Panarea (Aeolian Islands) after the exhalative crisis of 2002. In Marine Research at CNR; Brugnoli, E., Cavarretta, G., Mazzola, S., Trincardi, F., Ravaioli, M., Santoleri, R., Eds.; CNR: Rome, Italy, 2010; Volume DTA/06-2011, ISSN 2239-5172. [Google Scholar]
- Tudino, T.; Bortoluzzi, G.; Aliani, S. Shallow-water gaseohydrothermal plume studies after massive eruption at Panarea, Aeolian Islands, Italy. J. Mar. Syst. 2014, 131, 1–9. [Google Scholar] [CrossRef]
- Bortoluzzi, G.; Spagnoli, F.; Aliani, S.; Romeo, T.; Canese, S.; Esposito, V.; Grassi, M.; Masetti, G.; Dialti, L.; Cocchi, L.; et al. New geological, geophysical and biological insights on the hydrothermal system of the Panarea—Basiluzzo Volcanic complex (Aeolian Islands, Tyrrhenian Sea). Rend. Online Della Soc. Geol. Ital. 2014, 31, 403. [Google Scholar]
- Bortoluzzi, G.; Romeo, T.; La Cono, V.; La Spada, G.; Smedile, F.; Esposito, V.; Sabatino, G.; Di Bella, M.; Canese, S.; Scotti, G.; et al. Ferrous iron-and ammonium-rich diffuse vents support habitat-specific communities in a shallow hydrothermal field off the Basiluzzo Islet (Aeolian Volcanic Archipelago). Geobiology 2017, 15, 664–677. [Google Scholar] [CrossRef]
- Spagnoli, F.; Andaloro, F.; Canese, S.; Capaccioni, B.; Esposito, V.; Giordano, P.; Romeo, T.; Bortoluzzi, G. Nuove recenti conoscenze sul sistema idrotermale del complesso vulcanico dell’Isola di Panarea (Arcipelago delle Eolie, Mar Tirreno Meridionale). New recent insights of the hydrothermal system of the Panarea Island (Aeolian Archipelago, South Tyrrhenian Sea). Mem. Descr. Carta Geol. d’It. 2019, 105, 85–90. [Google Scholar]
- Capaccioni, B.; Tassi, F.; Vaselli, D.; Tedesco, D.; Rossi, P.L. The November 2002 degassing event at Panarea Island (Italy): The results of a 5 months geochemical monitoring program. Ann. Geophys. 2005, 48, 755–765. [Google Scholar]
- Capaccioni, B.; Tassi, F.; Vaselli, O.; Tedesco, D.; Poreda, R. Submarine gas burst at Panarea Island (Southern Italy) on 3 November 2002: A magmatic versus hydrothermal episode. J. Geophys. Res. 2007, 112, B05201. [Google Scholar] [CrossRef]
- Chiodini, G.; Caliro, S.; Caramanna, G.; Granieri, D.; Minopoli, C.; Moretti, R.; Perrotta, L.; Ventura, G. Geochemistry of the submarine gaseous emissions of Panarea (Aeolian Islands, Southern Italy): Magmatic vs. hydrothermal origin and implications for volcanic surveillance. Pure Appl. Geophys. 2006, 163, 759–780. [Google Scholar] [CrossRef]
- Monecke, T.; Petersen, S.; Hannington, M.D.; Anzidei, M.; Esposito, A.; Giordano, G.; Garbe-Shonberg, N.A.D.; Melchert, B.; Hoching, M. Explosion craters associated with shallow submarine gas venting off Panarea Island, Italy. Bull. Volcanol. 2012, 74, 1937–1944. [Google Scholar] [CrossRef]
- Gugliandolo, C.; Italiano, F.; Maugeri, T. The submarine hydrothermal system of Panarea (Southern Italy): Biogeochemical processes at the thermal fluids—Sea bottom interface. Ann. Geophys. 2006, 49, 783–792. [Google Scholar] [CrossRef]
- Tassi, F.; Capaccioni, B.; Caramanna, G.; Cinti, D.; Montegrossi, G.; Pizzino, L.; Quattrocchi, F.; Valselli, O. Low-pH waters discharging from submarine vents at Panarea Island (Aeolian Islands, southern Italy) after the 2002 gas blast: Origin of hydrothermal fluids and implications for volcanic surveillance. Appl. Geochem. 2009, 24, 246–254. [Google Scholar] [CrossRef]
- Manini, E.; Luna, G.M.; Corinaldesi, C.; Zeppilli, D.; Bortoluzzi, G.; Caramanna, G.; Raffa, F.; Danovaro, R. Prokaryote diversity and virus abundance in shallow hydrothermal vents of the Mediterranean Sea (Panarea Island) and the Pacific Ocean (North Sulawesi-Indonesia). Microb. Ecol. 2008, 55, 626–639. [Google Scholar] [CrossRef] [PubMed]
- Dialti, L.; De Lucia, A.; Marziani, F.; Niccolini, A.; Zeppetella, A.; di Fava, M.; Guideri, M.; Carmisciano, C.; Cocchi, L.; Muccini, F.; et al. Rapporto sulle attività geofisiche, oceanografiche e di campionamento durante la crociera Panstr12 con Nave Aretusa: Isole Eolie (Stromboli, Panarea, Salina) (2012-06-30–2012-07-14). Rapp. Tec. INGV 2013, 245, 26. [Google Scholar]
- Grassi, M.; Dialti, L.; Masetti, G.; Filippone, M.; Ricci, E.; Pratellesi, M.; Bortoluzzi, G.; Spagnoli, F.; Borgognoni, L.; Aliani, S.; et al. Rapporto Sulle Attività Oceanografiche, Geochimiche, Geologiche, Geofisiche e di Campionamento Durante la Crociera PANA13 con Nave Magnaghi: Panarea, I. Eolie, Tirreno, S. Orientale, 2013-06-02–2013-06-08; Istituto Idrografico della Marina Militare: Genova, Italy, 2013; p. 26. [Google Scholar]
- Bortoluzzi, G.; Carrara, G.; Fabretti, P.; Gamberi, F.; Marani, M.; Penitenti, D.; Stanghellini, G.; Tonani, M.; Zitellini, N.; Bonazzi, C.; et al. Swath Bathymetry and Geophysical Survey of the Tyrrhenian Sea; Report on Bathymetric, Magnetic and Gravimetric Investigations during Cruises TIR96 and TIR99; IGM-CNR: Bologna, Italy, 1999. [Google Scholar]
- Marani, M.P.; Gamberi, F.; Bortoluzzi, G.; Carrara, G.; Ligi, M.; Penitenti, D. Tyrrhenian sea bathymetry. In From Seafloor to Deep Mantle: Architecture of the Tyrrhenian Backarc Basin; Marani, M.P., Gamberi, F., Bonatti, E., Eds.; Memoir Carta Geologica D’Italia: Rome, Italy, 2004. [Google Scholar]
- Bortoluzzi, G.; Ligi, M.; Cuffaro, M.; D’Oriano, F.; Ferrante, V.; Partescano, E.; Redini, F.; Remia, A.; Riminucci, F.; Romagnoli, C.; et al. Rapporto Preliminare Sulle Indagini di Sismica a Riflessione e Rifrazione, Morfobatimetriche e Magnetometriche nel Complesso Dell’isola di PANAREA (Eolie, Tirreno Meridionale); Crociera Pana 07 Con La N/O Urania (01/09-Agosto-2007); ISMAR: Bologna, Italy, 2007. [Google Scholar]
- Loreto, M.F.; Bortoluzzi, G.; Dalpasso, E.; Ferrante, V.; Giordano, P.; Ligi, M.; Spagnoli, F.; Cocchi, L.; Muccini, F.; Canese, S.; et al. GEO-CAL 2014. Geofisica, Geochimica e Geologia al Largo Della Calabria Occidentale; Rapporto Tecnico 2014, 129; ISMAR-CNR: Bologna, Italy, 2014. [Google Scholar]
- Fabris, M.; Baldi, P.; Anzidei, M.; Pesci, A.; Bortoluzzi, G.; Aliani, S. High resolution topographic model of Panarea Island by fusion of photogrammetric, lidar and bathymetric digital terrain models. Photogramm. Rec. 2010, 25, 382–401. [Google Scholar] [CrossRef]
- Heinicke, J.; Italiano, F.; Maugeri, R.; Merkel, B.; Pohl, T.; Schipek, M.; Braun, T. Evidence of tectonic control on active arc volcanism: The Panarea-Stromboli tectonic link inferred by submarine hydrothermal vents monitoring (Aeolian arc, Italy). Geophys. Res. Lett. 2009, 36, L04301. [Google Scholar] [CrossRef]
- Acocella, V.; Neri, M.; Walter, T.R. Structural features of Panarea volcano in the frame of the Aeolian Arc (Italy): Implications for the 2002–2003 unrest. J. Eodyn. 2009, 47, 288–292. [Google Scholar] [CrossRef]
- Walter, T.R.; Wang, R.; Acocella, V.; Neri, M.; Grosser, H.; Zschau, J. Simultaneous magma and gas eruptions at three volcanoes in southern Italy: An earthquake trigger? Geology 2009, 37, 251–254. [Google Scholar] [CrossRef]
- Caliro, S.; Caracausi, A.; Chiodini, G.; Ditta, M.; Italiano, F.; Longo, M.; Minopoli, C.; Nuccio, P.M.; Paonita, A.; Rizzo, A. Evidence of a recent input of magmatic gases into the quiescent volcanic edifice of Panarea, Aeolian Islands, Italy. Geophys. Res. Lett. 2004, 31, L07619. [Google Scholar] [CrossRef]
- Caracausi, A.; Ditta, M.; Italiano, F.; Longo, M.; Nuccio, P.M.; Paonita, A.; Rizzo, A. Changes in fluid geochemistry and physico-chemical conditions of geothermal systems caused by magmatic input: The recent abrupt outgassing off the island of Panarea (Aeolian Islands, Italy). Geochim. Cosmochim. Acta 2005, 69, 3045–3059. [Google Scholar] [CrossRef]
- Spagnoli, F.; Penna, P.; Giuliani, G.; Masini, L.; Martinotti, V. The AMERIGO Lander and the Automatic Benthic Chamber (CBA): Two New Instruments to Measure Benthic Fluxes of Dissolved Chemical Species. Sensors 2019, 19, 2632. [Google Scholar] [CrossRef] [PubMed]
- Spagnoli, F.; Giuliani, G.; Martinotti, V.; Masini, L.; Penna, P. AMERIGO and CBA: A new lander and a new automatic benthic chamber for dissolved benthic flux measurements. In Proceedings of the 2018 IEEE International Workshop on Metrology for the Sea (MetroSea 2018), Bari, Italy, 8–10 October 2018; pp. 206–211. [Google Scholar] [CrossRef]
- Spagnoli, F. Device for Extracting Total Dissolved Inorganic Carbon from an Aqueous Solution and Analysis System Comprising This Device. Patent n. 102016000048914, 3 December 2018. [Google Scholar]
- Konno, U.; Tsunogai, U.; Nakagawa, F.; Nakaseama, M.; Ishibashi, J.I.; Nunoura, T.; Nakamura, K.I. Liquid CO2 venting on the seafloor: Yonaguni Knoll IV hydrothermal system, Okinawa Trough. Geophys. Res. Lett. 2006, 33, L16607. [Google Scholar] [CrossRef]
- Frascari, F.; Spagnoli, F.; Marcaccio, M.; Giordano, P. Anomalous Po river flood event effects on sediments and water column of the Northwestern Adriatic Sea. Clim. Res. 2006, 31, 151–165. [Google Scholar] [CrossRef]
- Spagnoli, F.; Dell’Anno, A.; De Marco, A.; Dinelli, E.; Fabiano, M.; Gadaleta, M.V.; Ianni, C.; Loiacono, F.; Manini, E.; Marini, M.; et al. Biogeochemistry, grain size and mineralogy of the central and southern Adriatic Sea sediments: A review. Chem. Ecol. 2010, 26, 19–44. [Google Scholar] [CrossRef]
- Gilchrist, J.T.; Jellinek, A.M.; Hooft, E.E.E.; Wanket, S. Submarine terraced deposits linked to periodic collapse of caldera-forming eruption columns. Nat. Geosci. 2023, 16, 446–453. [Google Scholar] [CrossRef]
- Yuen, D.A.; Scruggs, M.A.; Spera, F.J.; Zheng, Y.; Hu, H.; McNutt, S.R.; Thompson, G.; Mandli, K.; Keller, B.R.; Wei, S.S.; et al. Under the surface: Pressure-induced planetary-scale waves, volcanic lightning, and gaseous clouds caused by the submarine eruption of Hunga Tonga-Hunga Ha’apai volcano. Earthq. Res. Adv. 2022, 2, 100134. [Google Scholar] [CrossRef]
- Zorn, E.U.; Orynbaikyzy, A.; Plank, S.; Babeyko, A.; Darmawan, H.; Robbany, I.F.; Walter, T.R. Identification and ranking of subaerial volcanic tsunami hazard sources in Southeast Asia. Nat. Hazards Earth Syst. Sci. 2022, 22, 3083–3104. [Google Scholar]
- Lynett, P.; McCann, M.; Zhou, Z.; Renteria, W.; Borrero, J.; Greer, D.; Fa’anunu, O.; Bosserelle, C.; Jaffe, B.; La Selle, S.P.; et al. Diverse tsunamigenesis triggered by the Hunga Tonga-Hunga Ha’apai eruption. Nature 2022, 609, 728–733. [Google Scholar] [CrossRef] [PubMed]
- Ariza, A.; Kaartvedt, S.; Røstad, A.; Garijo, J.C.; Arístegui, J.; Fraile-Nuez, E.; Hernández-León, S. The Submarine Volcano Eruption off El Hierro Island: Effects on the Scattering Migrant Biota and the Evolution of the Pelagic Communities. PLoS ONE 2014, 9, e102354. [Google Scholar] [CrossRef] [PubMed]
- Sotomayor-García, A.; Rueda, J.L.; Sánchez-Guillamón, O.; Urra, J.; Vázquez, J.T.; Palomino, D.; Fernández-Salas, L.M.; López-González, N.; González-Porto, M.; Santana-Casiano, J.M.; et al. First macro-colonizers and survivors around tagoro submarine Volcano, Canary Islands, Spain. Geosciences 2019, 9, 52. [Google Scholar] [CrossRef]
- Caramanna, G.; Sievert, S.M.; Bühring, S.I. Submarine Shallow-Water Fluid Emissions and Their Geomicrobiological Imprint: A Global Overview. Front. Mar. Sci. 2021, 8, 727199. [Google Scholar] [CrossRef]
- Siddall, M.; Rohling, E.J.; Almogi-Labin, A.; Hemleben, C.; Meischner, D.; Schmelzer, I.; Smeed, D.A. Sea-level fluctuations during the last glacial cycle. Nature 2003, 423, 853–858. [Google Scholar] [CrossRef] [PubMed]
- Romano, D.; Gattuso, A.; Longo, M.; Caruso, C.; Lazzaro, G.; Corbo, A.; Italiano, F. Hazard scenarios related to submarine volcanic-hydrothermal activity and advanced monitoring strategies: A study case from the Panarea volcanic group (aeolian islands, Italy). Geofluids 2019, 2019, 8728720. [Google Scholar] [CrossRef]
- Santana-Casiano, J.M.; Fraile-Nuez, E.; González-Dávila, M.; Baker, E.T.; Resing, J.A.; Walker, S.L. Significant discharge of CO2 from hydrothermalism associated with the submarine volcano of El Hierro Island. Sci. Rep. 2016, 6, 25686. [Google Scholar] [CrossRef]
- Nardelli, B.B.; Budillon, F.; Watteaux, R.; Ciccone, F.; Conforti, A.; De Falco, G.; Di Martino, G.; Innagi, S.; Tonielli, R.; Iudicone, D. Pockmark morphology and turbulent buoyant plumes at a submarine spring. Cont. Shelf Res. 2017, 148, 19–36. [Google Scholar] [CrossRef]
- Coltelli, M.; Cavallaro, D.; D’Anna, G.; D’Alessandro, A.; Grassa, F.; Mangano, G.; Patanè, D.; Gresta, S. Exploring the submarine graham bank in the Sicily Channel. Ann. Geophys. 2016, 59, S0208. [Google Scholar] [CrossRef]


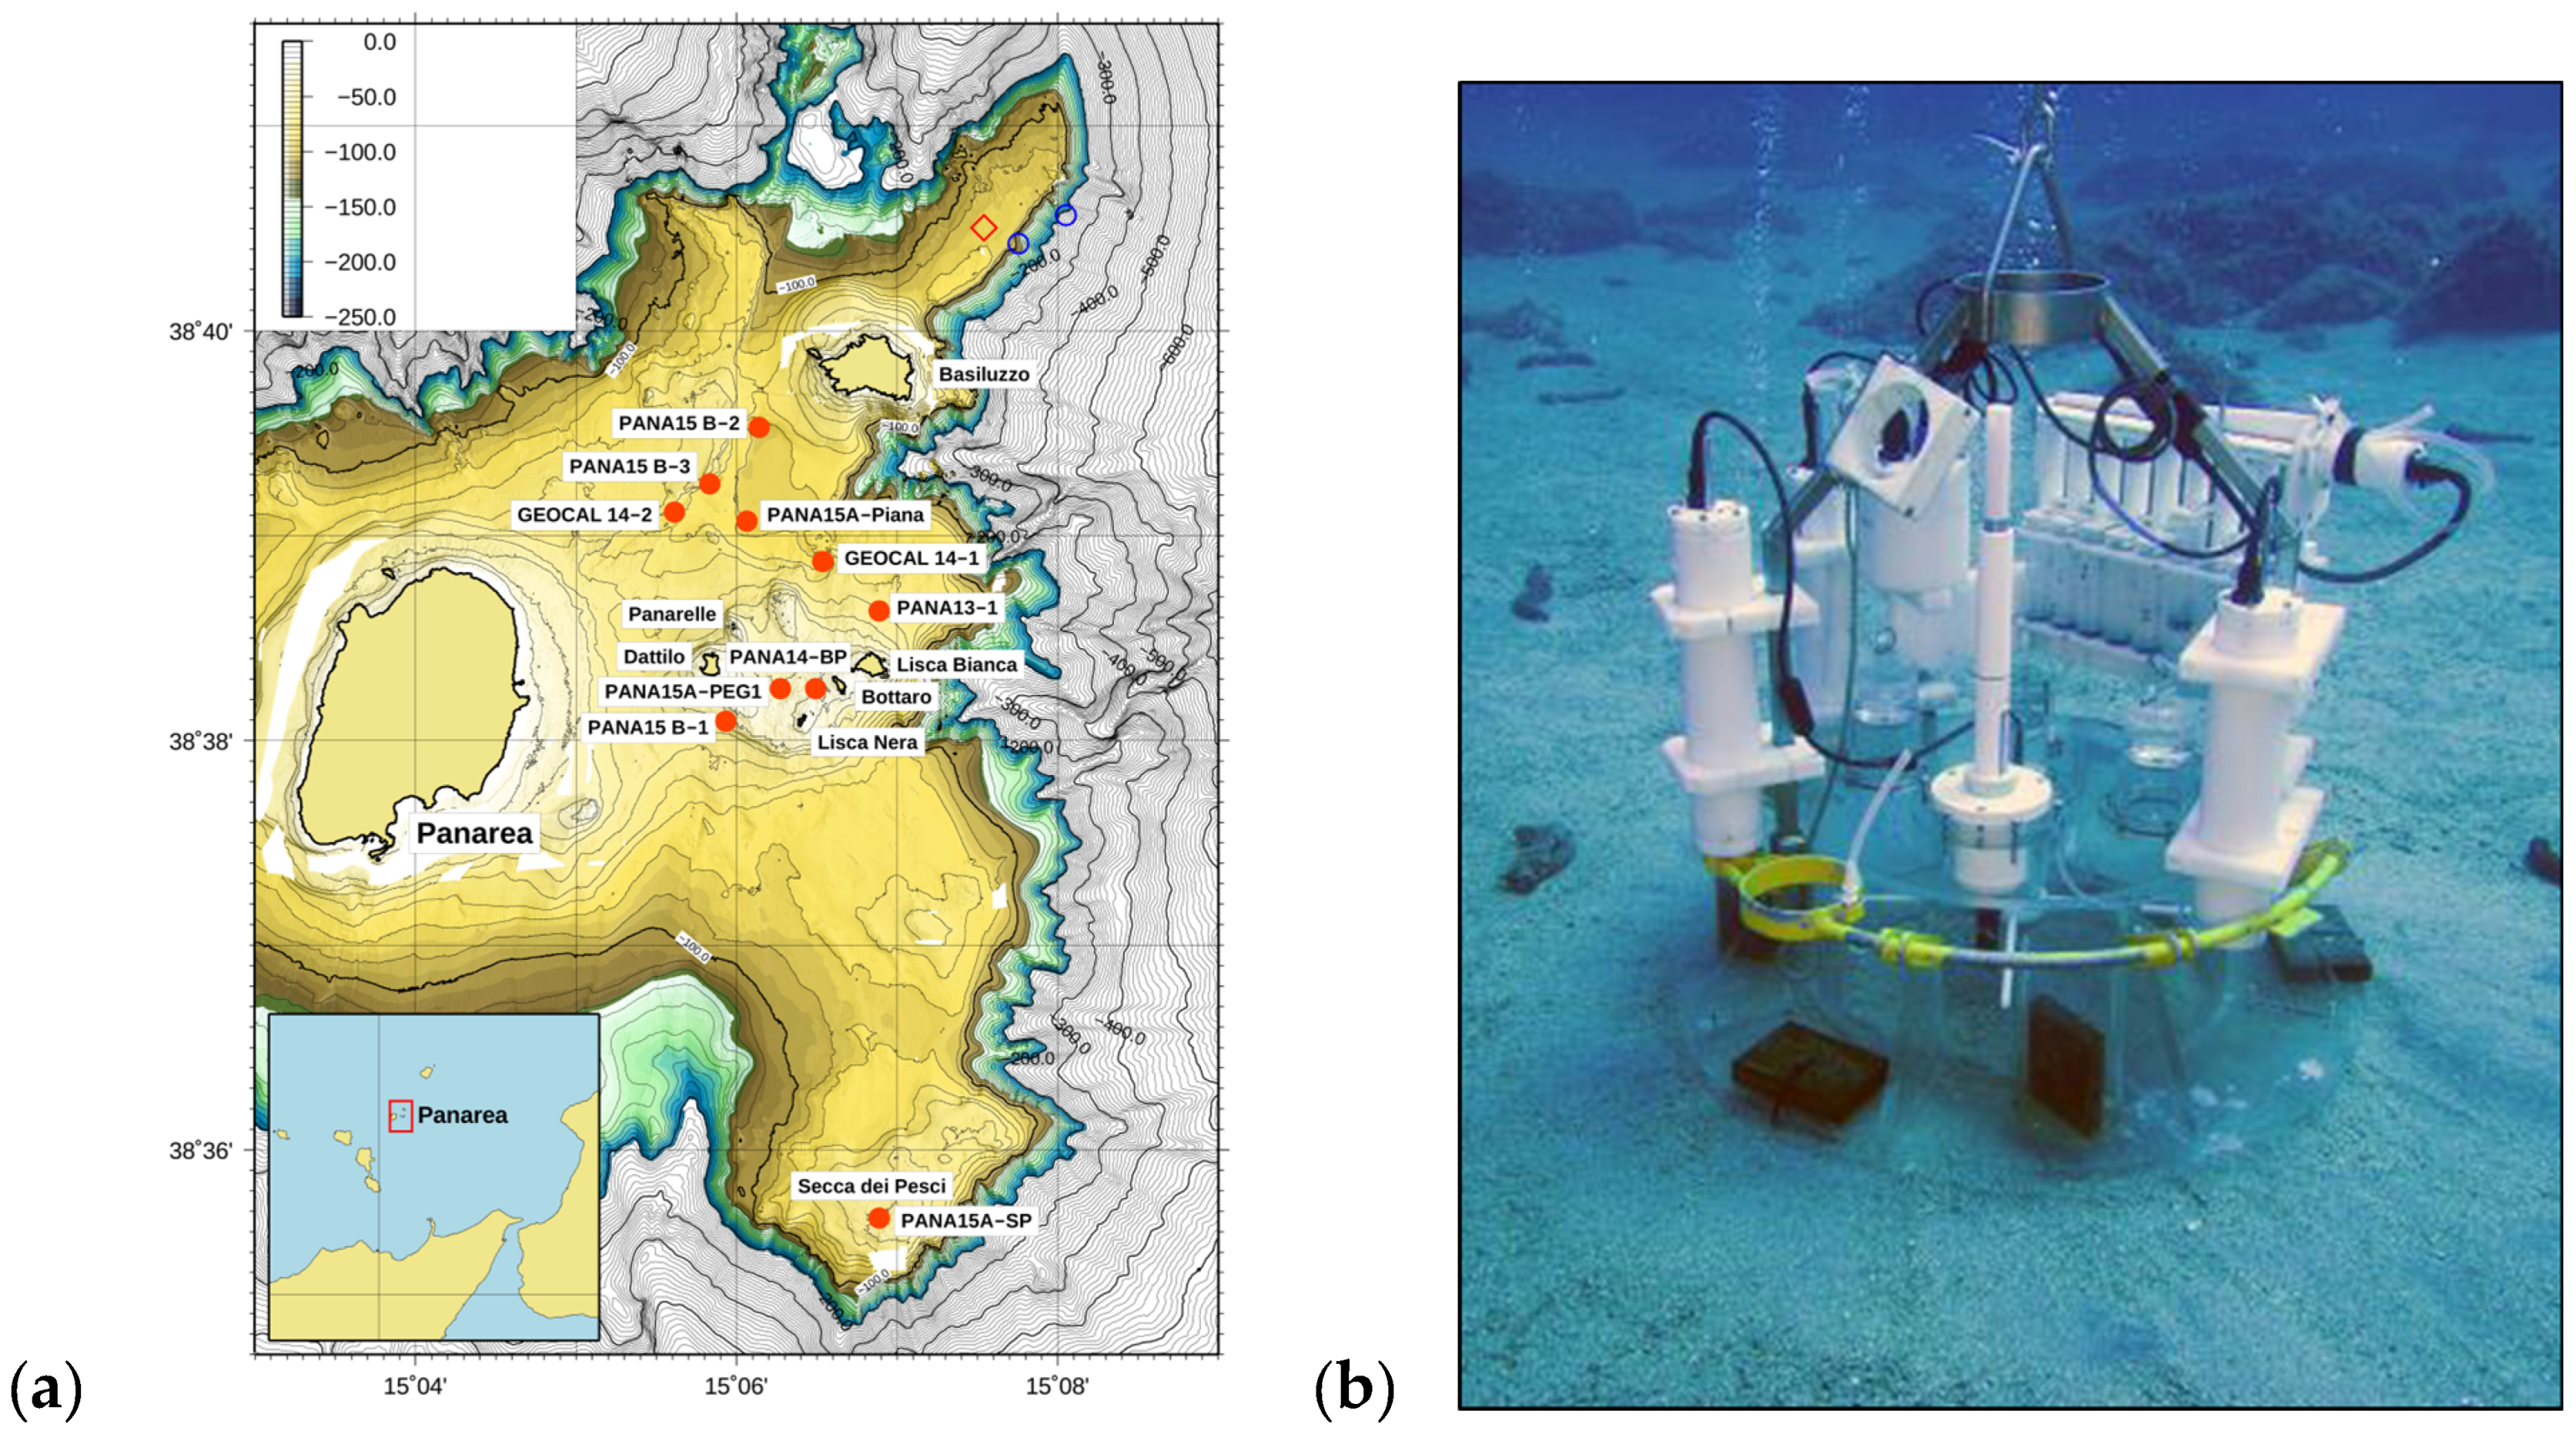
| Cruises | Stations | Date | Longitude | Latitude | Incubation Time (h) | Max Depth (m) | Min Depth (m) | Average (cm) | a (m) | b (m) |
|---|---|---|---|---|---|---|---|---|---|---|
| PANA13 | PANA13-1 | 5 June 2013 | 38°38.592′ | 15°06.901′ | 8.25 | 40.3 | 40.12 | 40.20 | 0.18 | 0.06 |
| GEOCAL14 | GEOCAL14-1 | 6 May 2014 | 38°38.930′ | 15°06.501′ | 9.17 | 80.4 | 80.28 | 80.35 | 0.12 | 0.02 |
| GEOCAL14 | GEOCAL14-2 | 6 May 2014 | 38°39.098′ | 15°05.596′ | 10.58 | 76.03 | 75.84 | 75.95 | 0.19 | 0.03 |
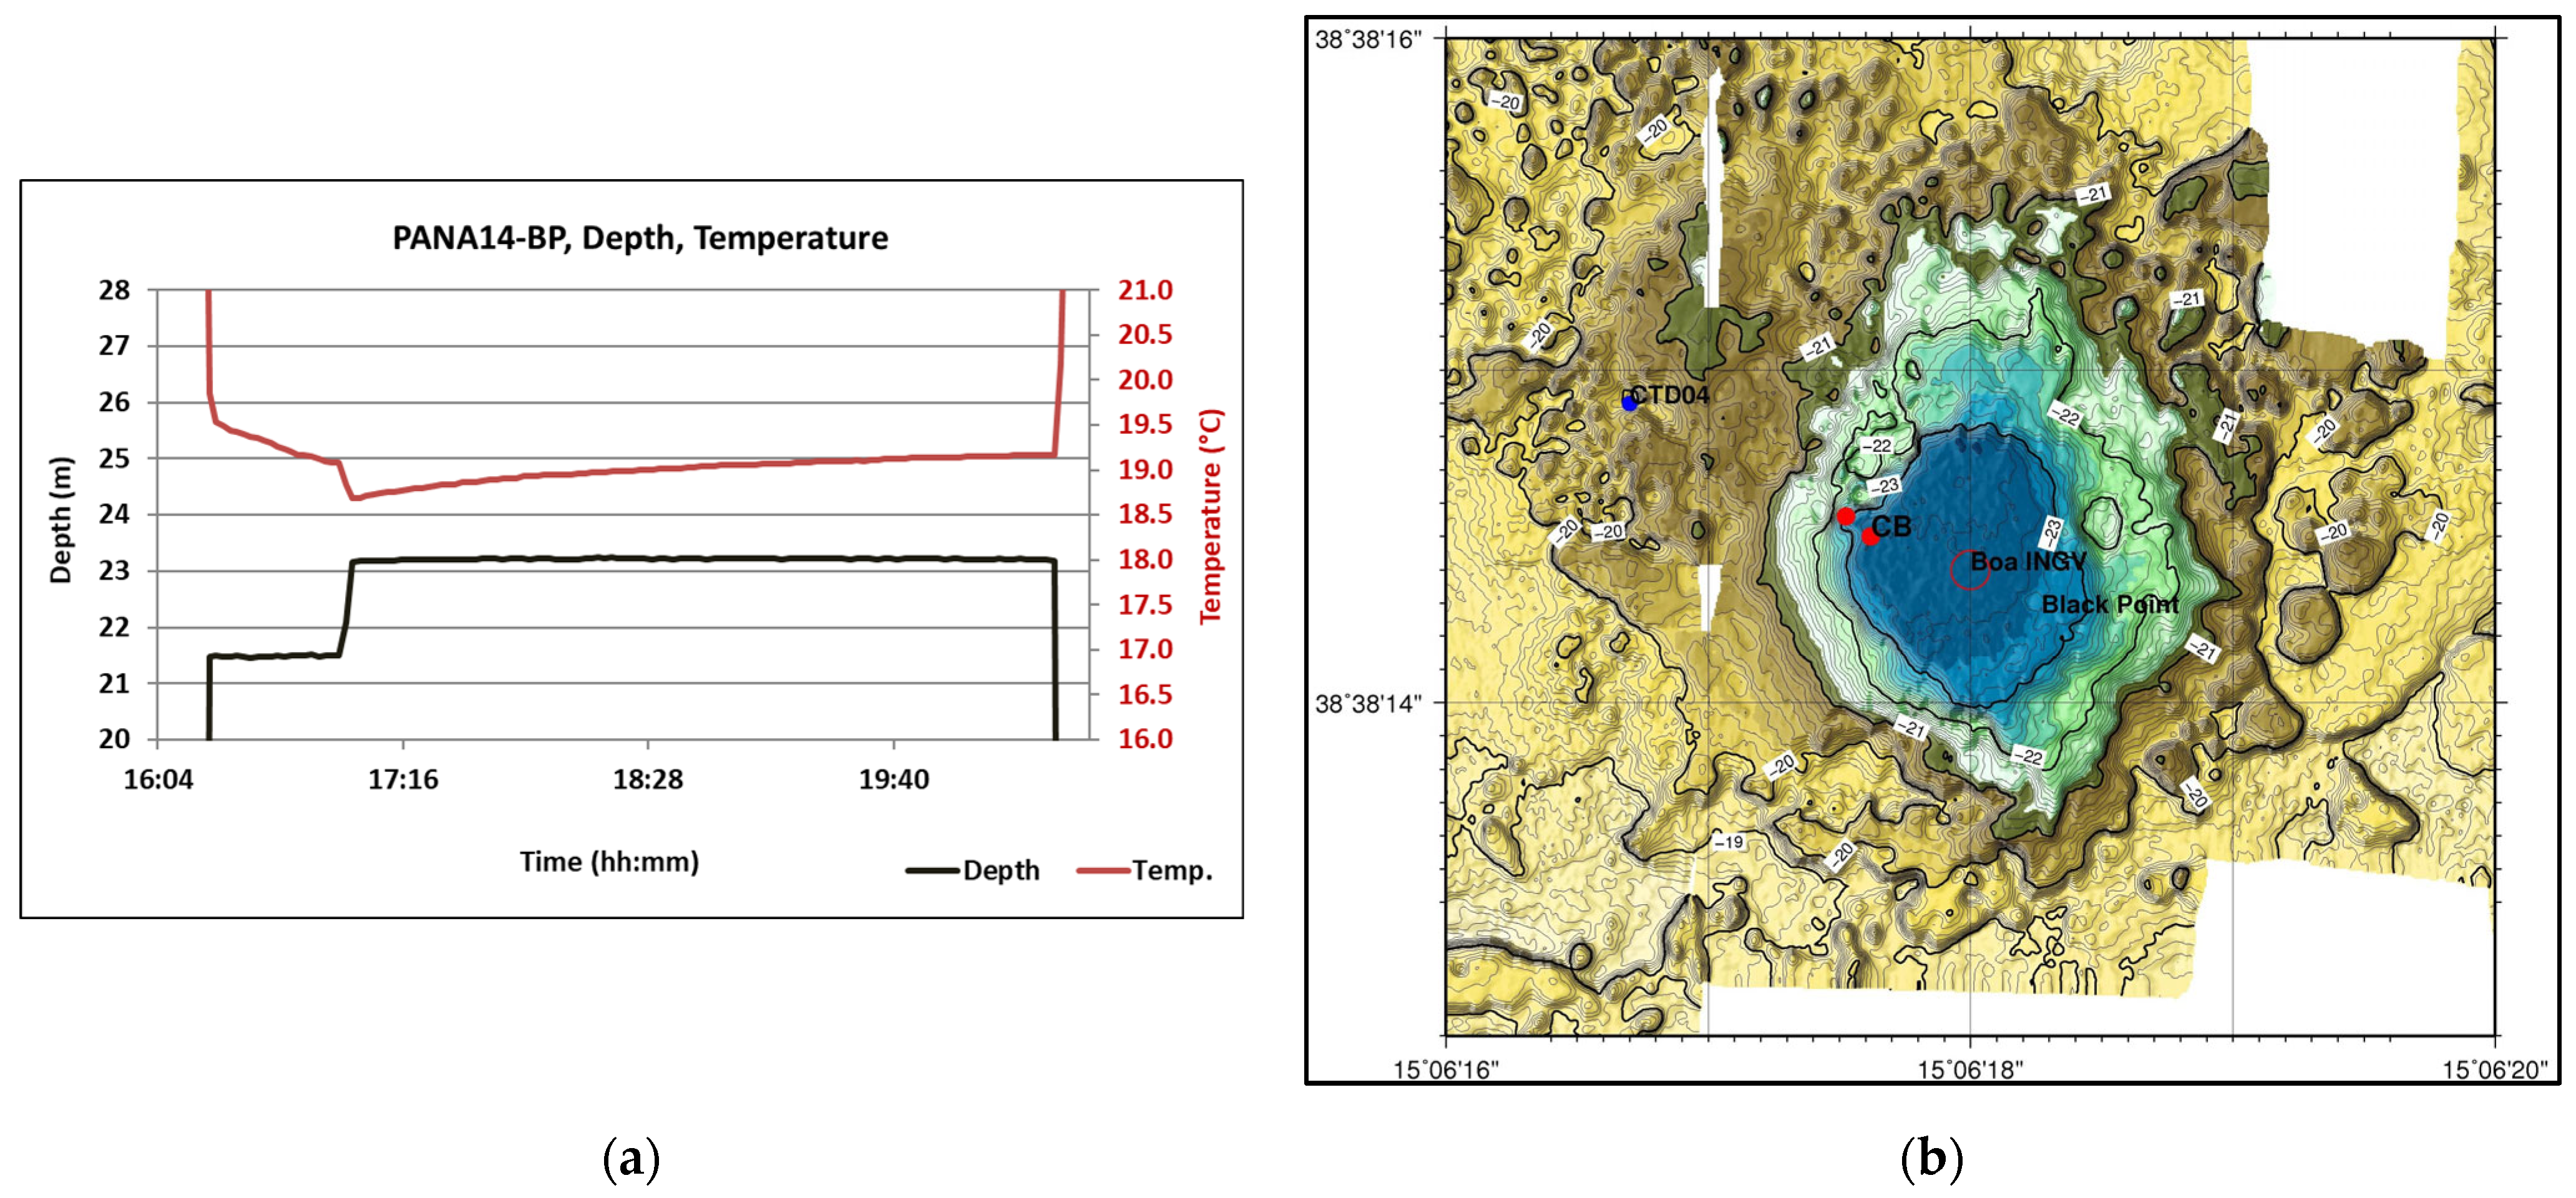
| PANA14 | PANA14-BP | 7 July 2014 | 38°38.243′ | 15°06.292′ | 4.13 | 23.24 | 23.17 | 23.21 | 0.07 | 1.09 |
| PANA15A | PANA15A-Piana | 10 June 2015 | 38°39.088′ | 15°06.124′ | 6.33 | 82.18 | 82.05 | 82.09 | 0.13 | 0.03 |
| PANA15A | PANA15A-PEG1 | 9 June 2015 | 38°38.246′ | 15°06.564′ | 6.25 | 11.63 | 11.43 | 11.54 | 0.20 | 0.04 |
| PANA15A | PANA15A-SP | 8 June 2015 | 38°35.668′ | 15°06.930′ | 9.51 | 38.46 | 38.29 | 38.40 | 0.17 | 0.02 |
| PANA15B | PANA15B-1 | 26 June 2015 | 38°38.163′ | 15°05.927′ | 6.33 | 59.5 | 59.39 | 59.47 | 0.11 | 0.02 |
| PANA15B | PANA15B-2 | 28 June 2015 | 38°39.538′ | 15°06.146′ | 5.50 | 84.44 | 84.34 | 84.38 | 0.10 | 0.02 |
| PANA15B | PANA15B-3 | 29 June 2015 | 38°39.265′ | 15°05.911′ | 4.95 | 71.72 | 71.64 | 71.68 | 0.08 | 0.34 |
| # | Cruises | Stations | Flux (mmol·m−2·d−1) | R2 |
|---|---|---|---|---|
| 1 | PANA13 | PANA13−1 | 60.60 | 1 |
| 2 | GEOCAL14 | GEOCAL14−1 | 689.30 | 0.9872 |
| 3 | GEOCAL14 | GEOCAL14−2 | 3223.90 | 0.9514 |
| 4 | PANA14 | PANA14−BP | 2888.9 | 0.9857 |
| 5 | PANA15A | PANA15A−Piana | −17.988 | 0.0219 |
| 6 | PANA15A | PANA15A−PEG1 | 2750.60 | 0.9203 |
| 7 | PANA15A | PANA15A−SP | 10,978.00 | 0.9573 |
| 8 | PANA15B | PANA15B−1 | 61.54 | 0.8165 |
| 9 | PANA15B | PANA15B−2 | −4.4149 | 0.0014 |
| 10 | PANA15B | PANA15B−3 | −19.29 | 0.0237 |
| Average | 2950.41 | 0.67 | ||
| Standard deviation | 3794.07 | 0.45 | ||
| Po River Prodelta average | 29.00 |
| # | Stations | pH | R² | [H+] | R² | pH | R² |
|---|---|---|---|---|---|---|---|
| units·d−1 | mmol·m−2·d−1 | units·m−2·d−1 | |||||
| 1 | PANA13−1 | −2.6314 | 0.8882 | 0.106 | 0.9021 | −0.7105 | 0.8882 |
| 2 | GEOCAL14−1 | −3.1246 | 0.8494 | 0.505 | 0.9968 | −0.9531 | 0.8401 |
| 3 | GEOCAL14−2 | −3.8024 | 0.7331 | 1.754 | 0.9902 | −1.0267 | 0.7331 |
| 4 | PANA14−BP | −1.6992 | 0.8174 | 2.237 | 0.8695 | −0.4588 | 0.8174 |
| 5 | PANA15A−Piana | 0.44 | 0.8043 | −0.0019355 | 0.7838 | 0.118 | 0.8043 |
| 6 | PANA15A−PEG1 average | −1.9987 | 0.4405 | 0.651 | 0.3816 | −0.5397 | 0.4405 |
| 7 | PANA15A−SP | −3.4737 | 0.7069 | 2.624 | 0.9581 | −0.9379 | 0.7069 |
| 8 | PANA15B−1 | 1.82 | 0.9620 | −0.01543 | 0.9148 | 0.493 | 0.9620 |
| 9 | PANA15B−2 | 1.25 | 0.6781 | −0.00238 | 0.5510 | 0.337 | 0.6781 |
| 10 | PANA15B−3 | 0.63 | 0.9677 | −0.00114 | 0.9527 | 0.171 | 0.9677 |
| Average | 1.04 | 1.313 | 0.280 | ||||
| Standard deviation | 0.63 | 1.031 | 0.170 |
| # | Cruise Stations | Flux (mmol·m−2·d−1) | R2 |
|---|---|---|---|
| 1 | PANA13−1 | −19.97 | 0.8192 |
| 2 | GEOCAL14−1 | −7.12 | 0.8968 |
| 3 | GEOCAL14−2 | −52.92 | 0.9796 |
| 4 | PANA14−BP | −110.80 | 0.9175 |
| 5 | PANA15A−Piana av | 2.93 | 0.4493 |
| 6 | PANA15A−PEG1 av | −0.99 | 0.1474 |
| 7 | PANA15A−PEG1 min | −34.07 | 0.9542 |
| 8 | PANA15A−PEG1 max | −1.70 | 0.4564 |
| 9 | PANA15A−SP | −81.73 | 0.9951 |
| 10 | PANA15B−1 | −15.37 | 0.9116 |
| 11 | PANA15B−2 | −2.97 | 0.7456 |
| 12 | PANA15B 3 | −0.77 | 0.0357 |
| average | −27.12 | ||
| Standar deviation | 36.68 | ||
| Po River prodelta | 35.00 |
| # | Stations | Fe | R2 | Mn | R2 | Zn | R2 | Ni | R2 | Al | R2 | B | R2 |
|---|---|---|---|---|---|---|---|---|---|---|---|---|---|
| 1 | PANA13−1 | 1.66 | 1 | 2.41 | 1 | 2.88 | 1 | ND | − | 0.02 | 1 | 54.11 | 1 |
| 2 | GEOCAL14−1 | 2.64 | 0.84 | 3.26 | 1.00 | 0.70 | 0.55 | ND | − | 0.29 | 0.76 | ND | − |
| 3 | GEOCAL14−2 | 9.41 | 0.41 | 0.38 | 0.29 | 0.89 | ND | − | 0.89 | 0.37 | −158.99 | 0.73 | |
| 4 | PANA14−BP | ND | − | ND | − | ND | − | ND | − | ND | − | ND | − |
| 5 | PANA15A−Piana | ND/0 | − | ND/0 | − | ND/0 | − | ND/0 | − | ND/0 | − | ND/0 | − |
| 6 | PANA15A−PEG1 | ND | − | ND | − | ND | − | ND | − | ND | − | ND | − |
| 7 | PANA15A−SP | 0.42 | 0.16 | 0.48 | 0.06 | 0.35 | 0.02 | 0.53 | ND | − | ND/0 | − | |
| 8 | PANA15B−1 | 0.01 | 0.02 | −0.0057 | 0.25 | ND | − | ND | − | ND | − | ND | − |
| 9 | PANA15B−2 | ND/0 | − | ND/0 | − | ND/0 | − | ND/0 | − | ND/0 | − | ND/0 | − |
| 10 | PANA15B−3 | ND/0 | − | ND/0 | − | ND/0 | − | ND/0 | − | ND/0 | − | ND/0 | − |
| Average | 2.83 | 1.56 | 0.98 | 0.02 | 0.40 | -52.44 | |||||||
| Standard deviation | 3.82 | 1.52 | 1.29 | 0.44 | 150.69 | ||||||||
| Po River Prodelta | 0.02 | 0.25 | 0.012 |
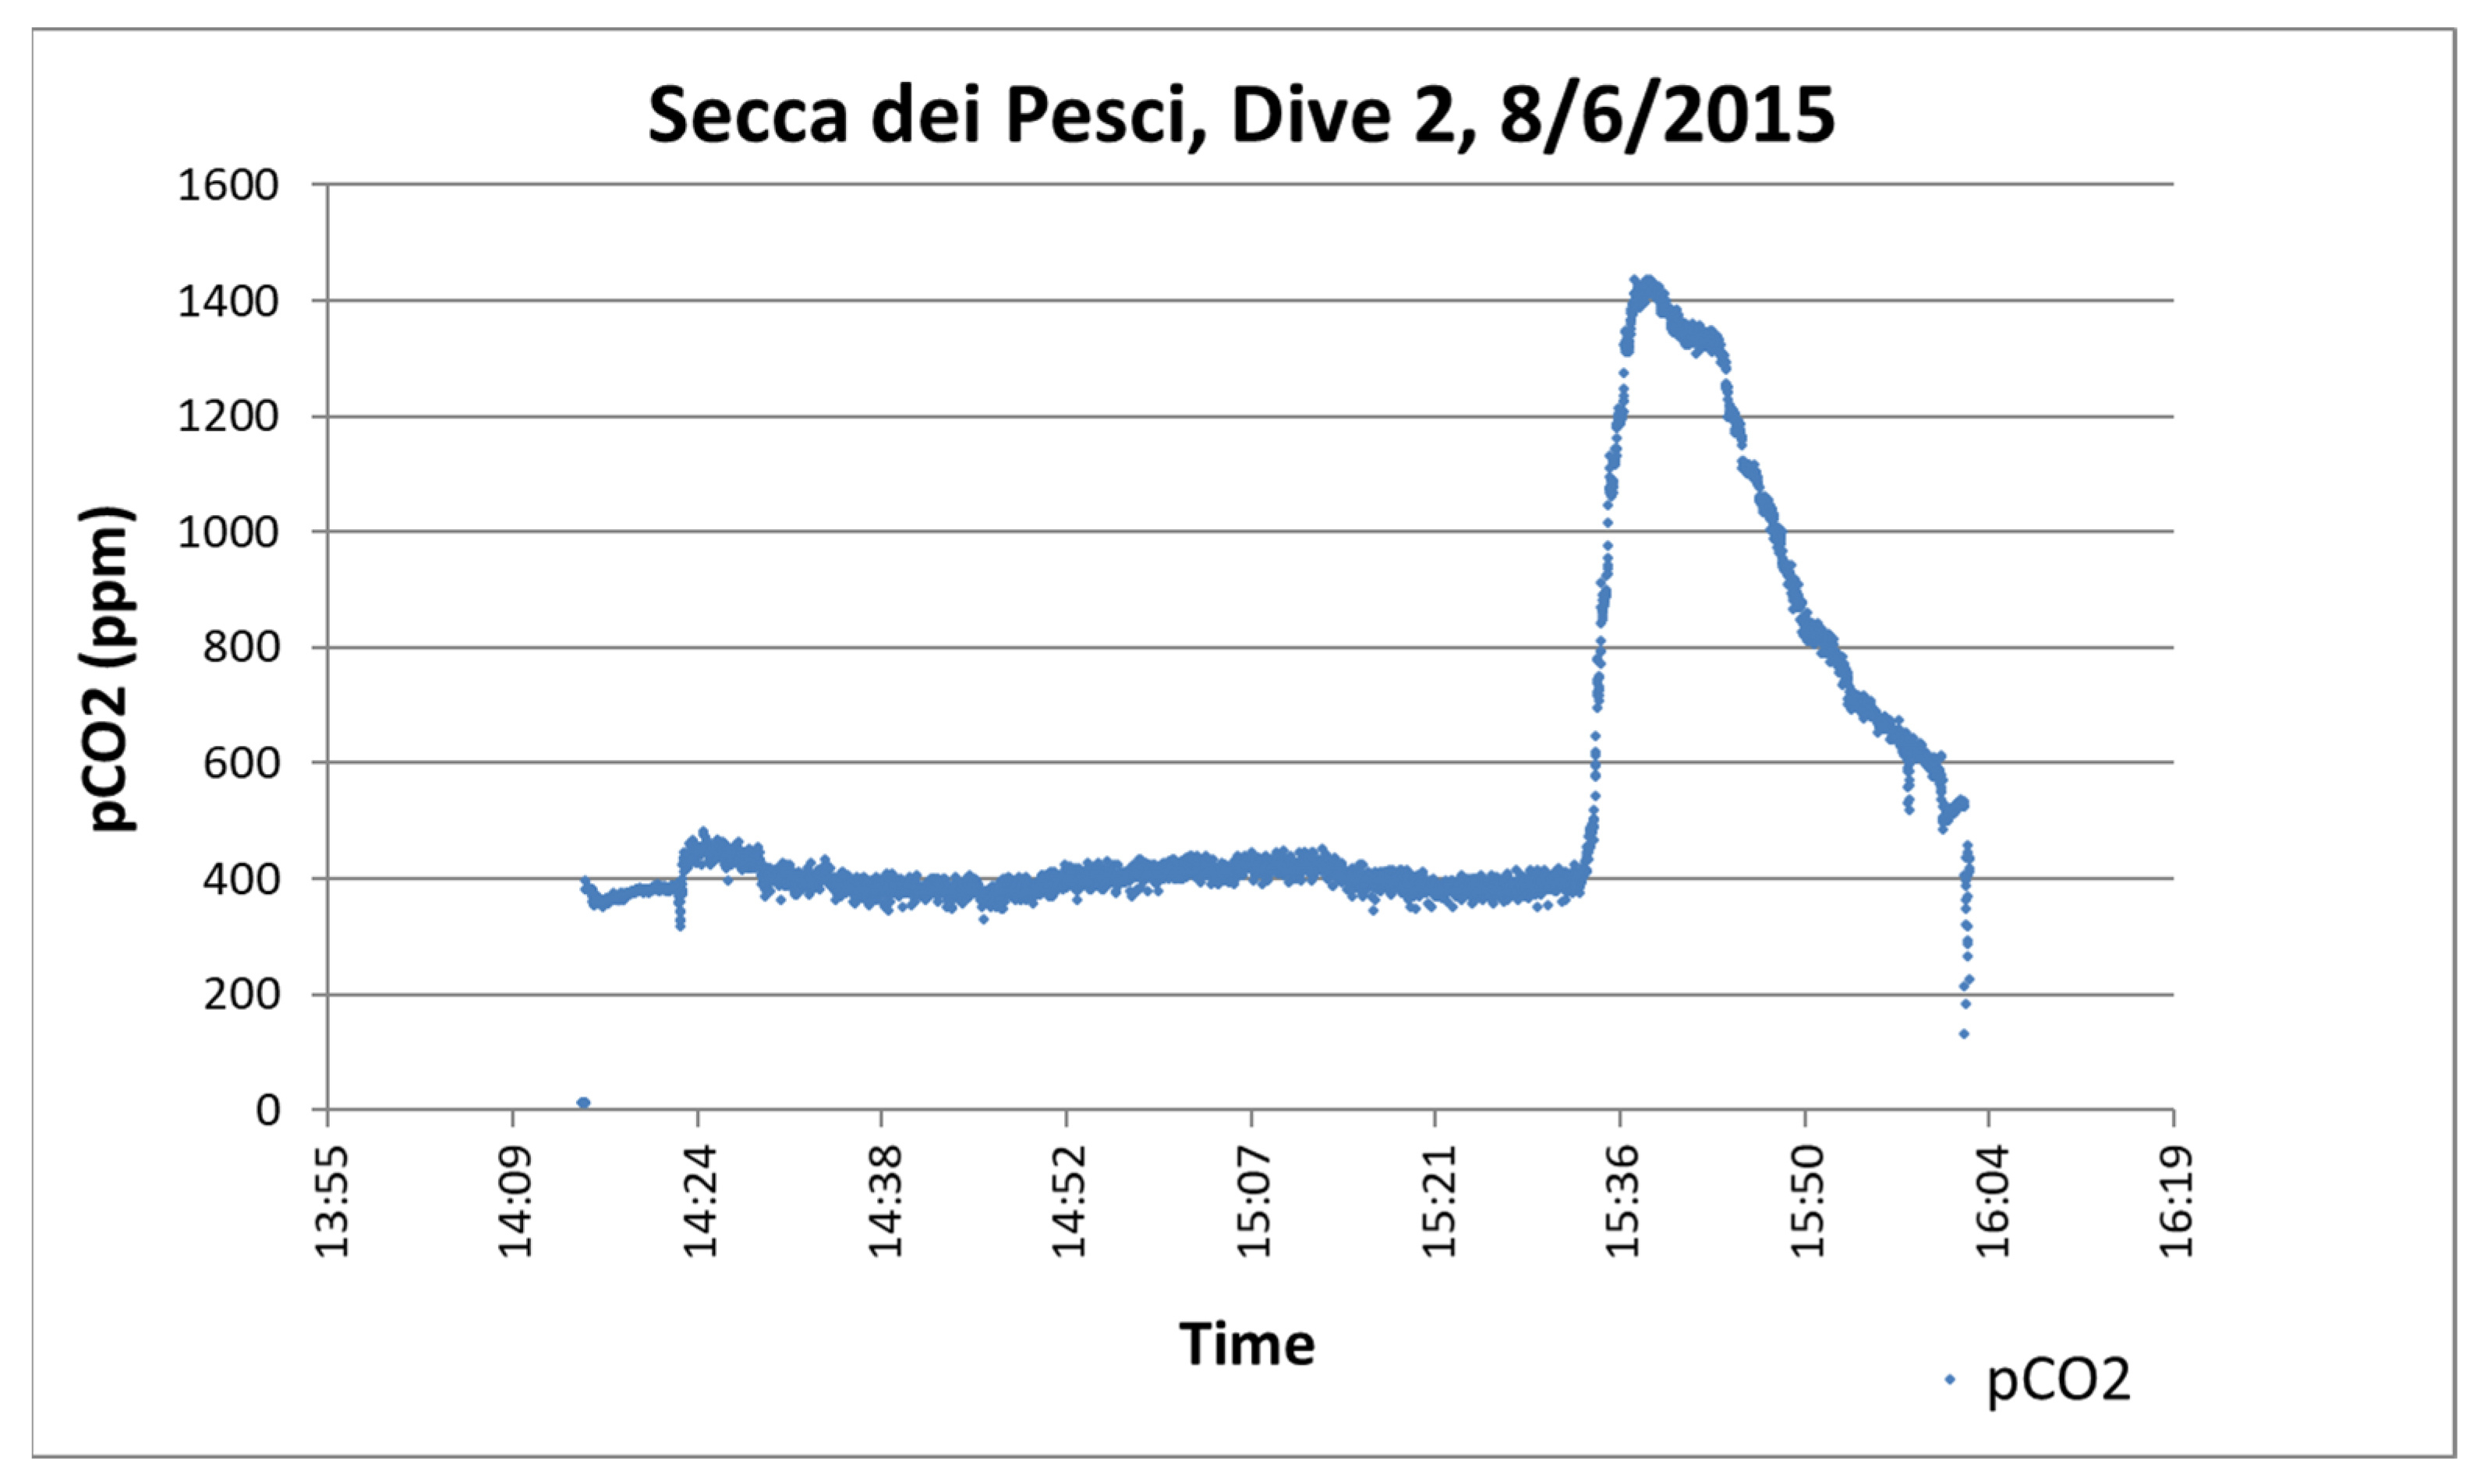
| Dives | Maximum pCO2 (ppm) | Maximum Depth (m) | Date |
|---|---|---|---|
| Secca dei Pesci (dive 1) | 1827.51 | 65 | 26 June 2015 |
| Secca dei Pesci (dive 1) | 1438.29 | 65 | 26 June 2015 |
| Secca dei Pesci (dive 1) | 626.61 | 65 | 26 June 2015 |
| Secca dei Pesci (dive 2) | 2009.40 | 70 | 26 June 2015 |
| Smoking Land (dive 3) | 2009.40 | 206 | 27 June 2015 |
| SW Basiluzzo (dive 4) | 2009.40 | 85 | 28 June 2015 |
| SW Basiluzzo (dive 5) | 1185.98 | 85 | 28 June 2015 |
| SW Basiluzzo (dive 6) | 1109.71 | 85 | 28 June 2015 |
| SW Basiluzzo (dive 7) | 831.97 | 85 | 28 June 2015 |
| SW Basiluzzo (dive 8) | 2009.40 | 85 | 29 June 2015 |
| SW Basiluzzo (dive 9) | 751.78 | 70 | 29 June 2015 |
| SW Basiluzzo (dive 10) | 1029.51 | 70 | 29 June 2015 |
| Secca del Capo (dive 12) | 984.53 | 230 | 30 June 2015 |
| Secca del Capo (dive 11) | 671.59 | 70 | 30 June 2015 |
| Average | 1321.08 | ||
| Standard deviation | 547.30 |
Disclaimer/Publisher’s Note: The statements, opinions and data contained in all publications are solely those of the individual author(s) and contributor(s) and not of MDPI and/or the editor(s). MDPI and/or the editor(s) disclaim responsibility for any injury to people or property resulting from any ideas, methods, instructions or products referred to in the content. |
© 2024 by the authors. Licensee MDPI, Basel, Switzerland. This article is an open access article distributed under the terms and conditions of the Creative Commons Attribution (CC BY) license (https://creativecommons.org/licenses/by/4.0/).
Share and Cite
Spagnoli, F.; Romeo, T.; Andaloro, F.; Canese, S.; Esposito, V.; Grassi, M.; Biscotti, E.D.; Giordano, P.; Bortoluzzi, G. Seeps and Tectonic Structure of the Hydrothermal System of the Panarea Volcanic Complex (Aeolian Islands, Tyrrhenian Sea). Geosciences 2024, 14, 60. https://doi.org/10.3390/geosciences14030060
Spagnoli F, Romeo T, Andaloro F, Canese S, Esposito V, Grassi M, Biscotti ED, Giordano P, Bortoluzzi G. Seeps and Tectonic Structure of the Hydrothermal System of the Panarea Volcanic Complex (Aeolian Islands, Tyrrhenian Sea). Geosciences. 2024; 14(3):60. https://doi.org/10.3390/geosciences14030060
Chicago/Turabian StyleSpagnoli, Federico, Teresa Romeo, Franco Andaloro, Simonepietro Canese, Valentina Esposito, Marco Grassi, Erik Delos Biscotti, Patrizia Giordano, and Giovanni Bortoluzzi. 2024. "Seeps and Tectonic Structure of the Hydrothermal System of the Panarea Volcanic Complex (Aeolian Islands, Tyrrhenian Sea)" Geosciences 14, no. 3: 60. https://doi.org/10.3390/geosciences14030060
APA StyleSpagnoli, F., Romeo, T., Andaloro, F., Canese, S., Esposito, V., Grassi, M., Biscotti, E. D., Giordano, P., & Bortoluzzi, G. (2024). Seeps and Tectonic Structure of the Hydrothermal System of the Panarea Volcanic Complex (Aeolian Islands, Tyrrhenian Sea). Geosciences, 14(3), 60. https://doi.org/10.3390/geosciences14030060