Article

Geotechnical and Geophysical Assessment of the 2021 Tamban Chimbo Landslide, Northern Andes of Ecuador

by
Isela Salinas
1,*,
Abelardo Paucar
2,
María Quiñónez-Macías
3,4,
Francisco Grau
1,5,
Marysabel Barragán-Taco
2,
Theofilos Toulkeridis
6 and
Kervin Chunga
7
1
Faculty of Engineering in Earth Sciences FICT, ESPOL Polytechnic University, Km 30.5 Vía Perimetral, P.O. Box 09-01-5863, Guayaquil 090102, Ecuador
2
Department of Disaster Risk Engineering, Faculty of Health and Human Sciences, Bolívar State University, Guaranda 020150, Ecuador
3
Secretariat of Risk Management (SGR), Integrated Security Center Building, Samborondón 092301, Ecuador
4
Department of Civil Engineering, University of Alicante, P.O. Box 99, 03080 Alicante, Spain
5
Geocimientos S.A., Mapasingue Oeste, Km. 5.5 Vía a Daule, Guayaquil 090604, Ecuador
6
Department of Earth and Construction Sciences, University of the Armed Forces ESPE, Sangolquí 171103, Ecuador
7
Faculty of Engineering and Applied Sciences, Technical University of Manabí UTM, Av. José María Urbina, Portoviejo 130111, Ecuador
*
Author to whom correspondence should be addressed.
Geosciences 2024, 14(4), 104; https://doi.org/10.3390/geosciences14040104
Submission received: 13 February 2024 / Revised: 3 April 2024 / Accepted: 3 April 2024 / Published: 16 April 2024
(This article belongs to the Special Issue Landslide Monitoring and Mapping II)

Abstract

:
The recent landslide at the Tamban site, on 21 December 2021 (23:30 local time), provides relevant information on the trigger mechanisms and their relationship with geological factors. Therefore, the predominant aims of the current study were to identify the lithological units in the rocky substrate and subsoil from geophysical surveys, delineating the thickness of the tuff- and lapilli-supported fall layers. Additionally, we evaluated the deformation dynamics from probabilistic and deterministic analysis, where a plane with well-differentiated discontinuities of normal-type geological fault was evidenced. This deformation feature was associated with a planar-type landslide that reached a debris flow up to 330 m distance, with varied thicknesses. Furthermore, we conducted a probabilistic analysis, which started from the characteristics of the post-slide material analyzed through triaxial trials that were conducted to a retro-analysis in order to obtain the parameters of the moment the event occurred. With the base parameters to perform the landslide analysis and determine its safety factors in compliance with current regulations, a reinforced earth configuration was applied using the Maccaferri’s Terramesh method. Hence, it was possible to provide an analysis methodology for further geological scenarios of landslides that occurred in the province of Bolívar, the northern Andes of Ecuador.

1. Introduction

Worldwide, massive mass movements such as landslides or rock falls and avalanches are predominantly the result of the combined action of the earth’s internal and external forces, environmental factors, and inadequate human engineering activities [1,2,3,4,5,6,7,8]. Similar to other equivalent orogenic settings throughout the globe, in the northern Andes of Ecuador, landslides are the most recurrent natural phenomena in mountainous areas, where lithological, seismic, and geomorphological as well as climatic factors play an important role in their dimension and classification, whether they are coherent, disruptive, or lateral spreads [9,10,11,12].
One of the Ecuadorian Andean provinces with the largest records of historical landslides and little studied from a geotechnical engineering point of view is the province of Bolívar, where there are documents of multiple collapses of damage to road infrastructures and houses settled on the vicinity of unstable areas of slopes of hills and mountains [13,14,15,16]. There, the main physical triggers are associated with moderate and high precipitation in the winter months (December to April) and also for many days, but with low precipitation, such as the event on 21 December 2021 (at 23:30 local time), which had continuous precipitation for eleven consecutive days [17].
Another trigger and with a greater recurrence interval are moderate earthquakes from superficial geological faults, with a range of magnitudes between 6 and 7 degrees (Mw) (see Figure 1). The geological causes are associated largely due to three different circumstances. The first cause is due to weathered and low-strength volcanic deposits on unstable slopes. The second cause occurs in well-jointed rock masses where the combinations of planes are unfavorable to the directions of the slopes, where, in many cases, they are able to generate planar- and/or wedge-type landslides. Finally, the third cause occurs also in permeable and then saturated materials that contrast with the stiffness of the listric planes of geological faults, which are able to accelerate the displacement rate. The latter natural cause is associated in its trigger to the study site of the Tamban landslide, within the San José de Chimbo canton, in the Bolívar province (see Figure 1 and Figure 2).
In a more regional context, other morphotectonic causes in the Andean mountains are associated with old, normal geological faults, attributed to triangular facet features with the tectonic subsidence of one block with respect to the footwall, as well as displacement zones of inactive faults where it may reach ten meters wide (fault width). In these shear zones appears instability and the detachment of blocks on the slopes. The most notorious human causes in populated areas of the Andes are the continuous irrigation in agricultural activities that saturate the soil. Besides this cause, one may add to the breakage of sewage pipes that accelerate the level of saturation of the materials, unstable fill materials and poor compaction for construction, and informal mining areas that excavate materials for construction, reducing resistance at the base of slopes. All these physical, geological, geomorphological and anthropogenic causes are relatively common in the province of Bolívar.
In the current study, the surveys of geological features in the terrain allowed us to obtain an initial analysis of the outcrop stratigraphy such as cut slopes in the landslide escarpments, identifying the granular and cohesive materials. This was followed by the spatial distribution of the landslide, which allowed us to define the main head scarp surface, overlapping area and debris accumulation zone in the area affected by the landslide. Subsequently, the physical parameters of the terrain must be known in depth, as yielded from direct (SPT) and indirect methods (seismic geophysics and electrical tomography). The geological, geotechnical, and geophysical procedures generated the models of lithological units and their layers with geotechnical parameters and the dynamic conditions of the soil or geomechanics of the rocks. The main parameters of geotechnical tests provided cohesion values, friction angles, and specific weights. Later, different types of numerical analyzes proposed engineering solutions of slope stability including the ordinary method of slices, Morgenstern–Price method of slices, kinematic analysis, and limit equilibrium analysis [18,19,20,21,22,23].
There are certainly further examples of integrations between different approaches, methods, and techniques in obtaining data, such as studies of the evolution of shallow landslides affected by rainfall, which are compared with the observations realized in situ by means of a statistical analysis of meteorological variables with those obtained in the laboratory [1,24,25]. Furthermore, a combination of geophysical methods have been used for the characterization of a rockslide area, where the results have been calibrated by comparing the geophysical responses with the geological evidence derived from boreholes and with the movements recorded using an inclinometric probe [25]. Finally, the internal moisture dynamics of a railway earthwork embankment has been analyzed using 2D and 3D resistivity monitoring. This has led to the visualization of the data as 2D sections, 3D tomograms, and time-series plots for different zones of the embankment, which has enabled the development of seasonal wetting fronts within the embankment to be monitored at a high-spatial resolution and the respective distributions of moisture in the embankment to be assessed. Although the dike considered was at no immediate risk of failure, the approach developed for this particular study is equally applicable to other more high-risk earthworks and natural slopes [25].
The main objectives of the present study are to identify the lithological units in the rocky substratum and subsoil from geophysical surveys such as electric tomography and Vs30, defined as the average seismic shear wave velocity from the surface to a depth of 30 m. Additionally, we attempt to delineate the thickness of transported material, lithological contacts, and depth of more resistant layers, considering technical specifications of the Ecuadorian Construction Standard named NEC-11 of 2015 [26], in order to define the type of geotechnical soil. Furthermore, we intend to ascertain the geological causes due to the susceptibility of the materials, their combinations of discontinuity planes unfavorable to the direction of the slope, and where the saturated material was displaced through an old geological fault plane. Subsequently, a geological model is built from a topographic photogrammetry survey with a drone and RTK, outlining the lithological units, where shear strength tests allow us to determine geotechnical parameters. This is combined with geophysical prospecting in order to obtain a series of slope stability analyzes. Finally, we make assessments to provide an analysis methodology for further geological scenarios of landslides that occurred historically and recently in the province of Bolívar.

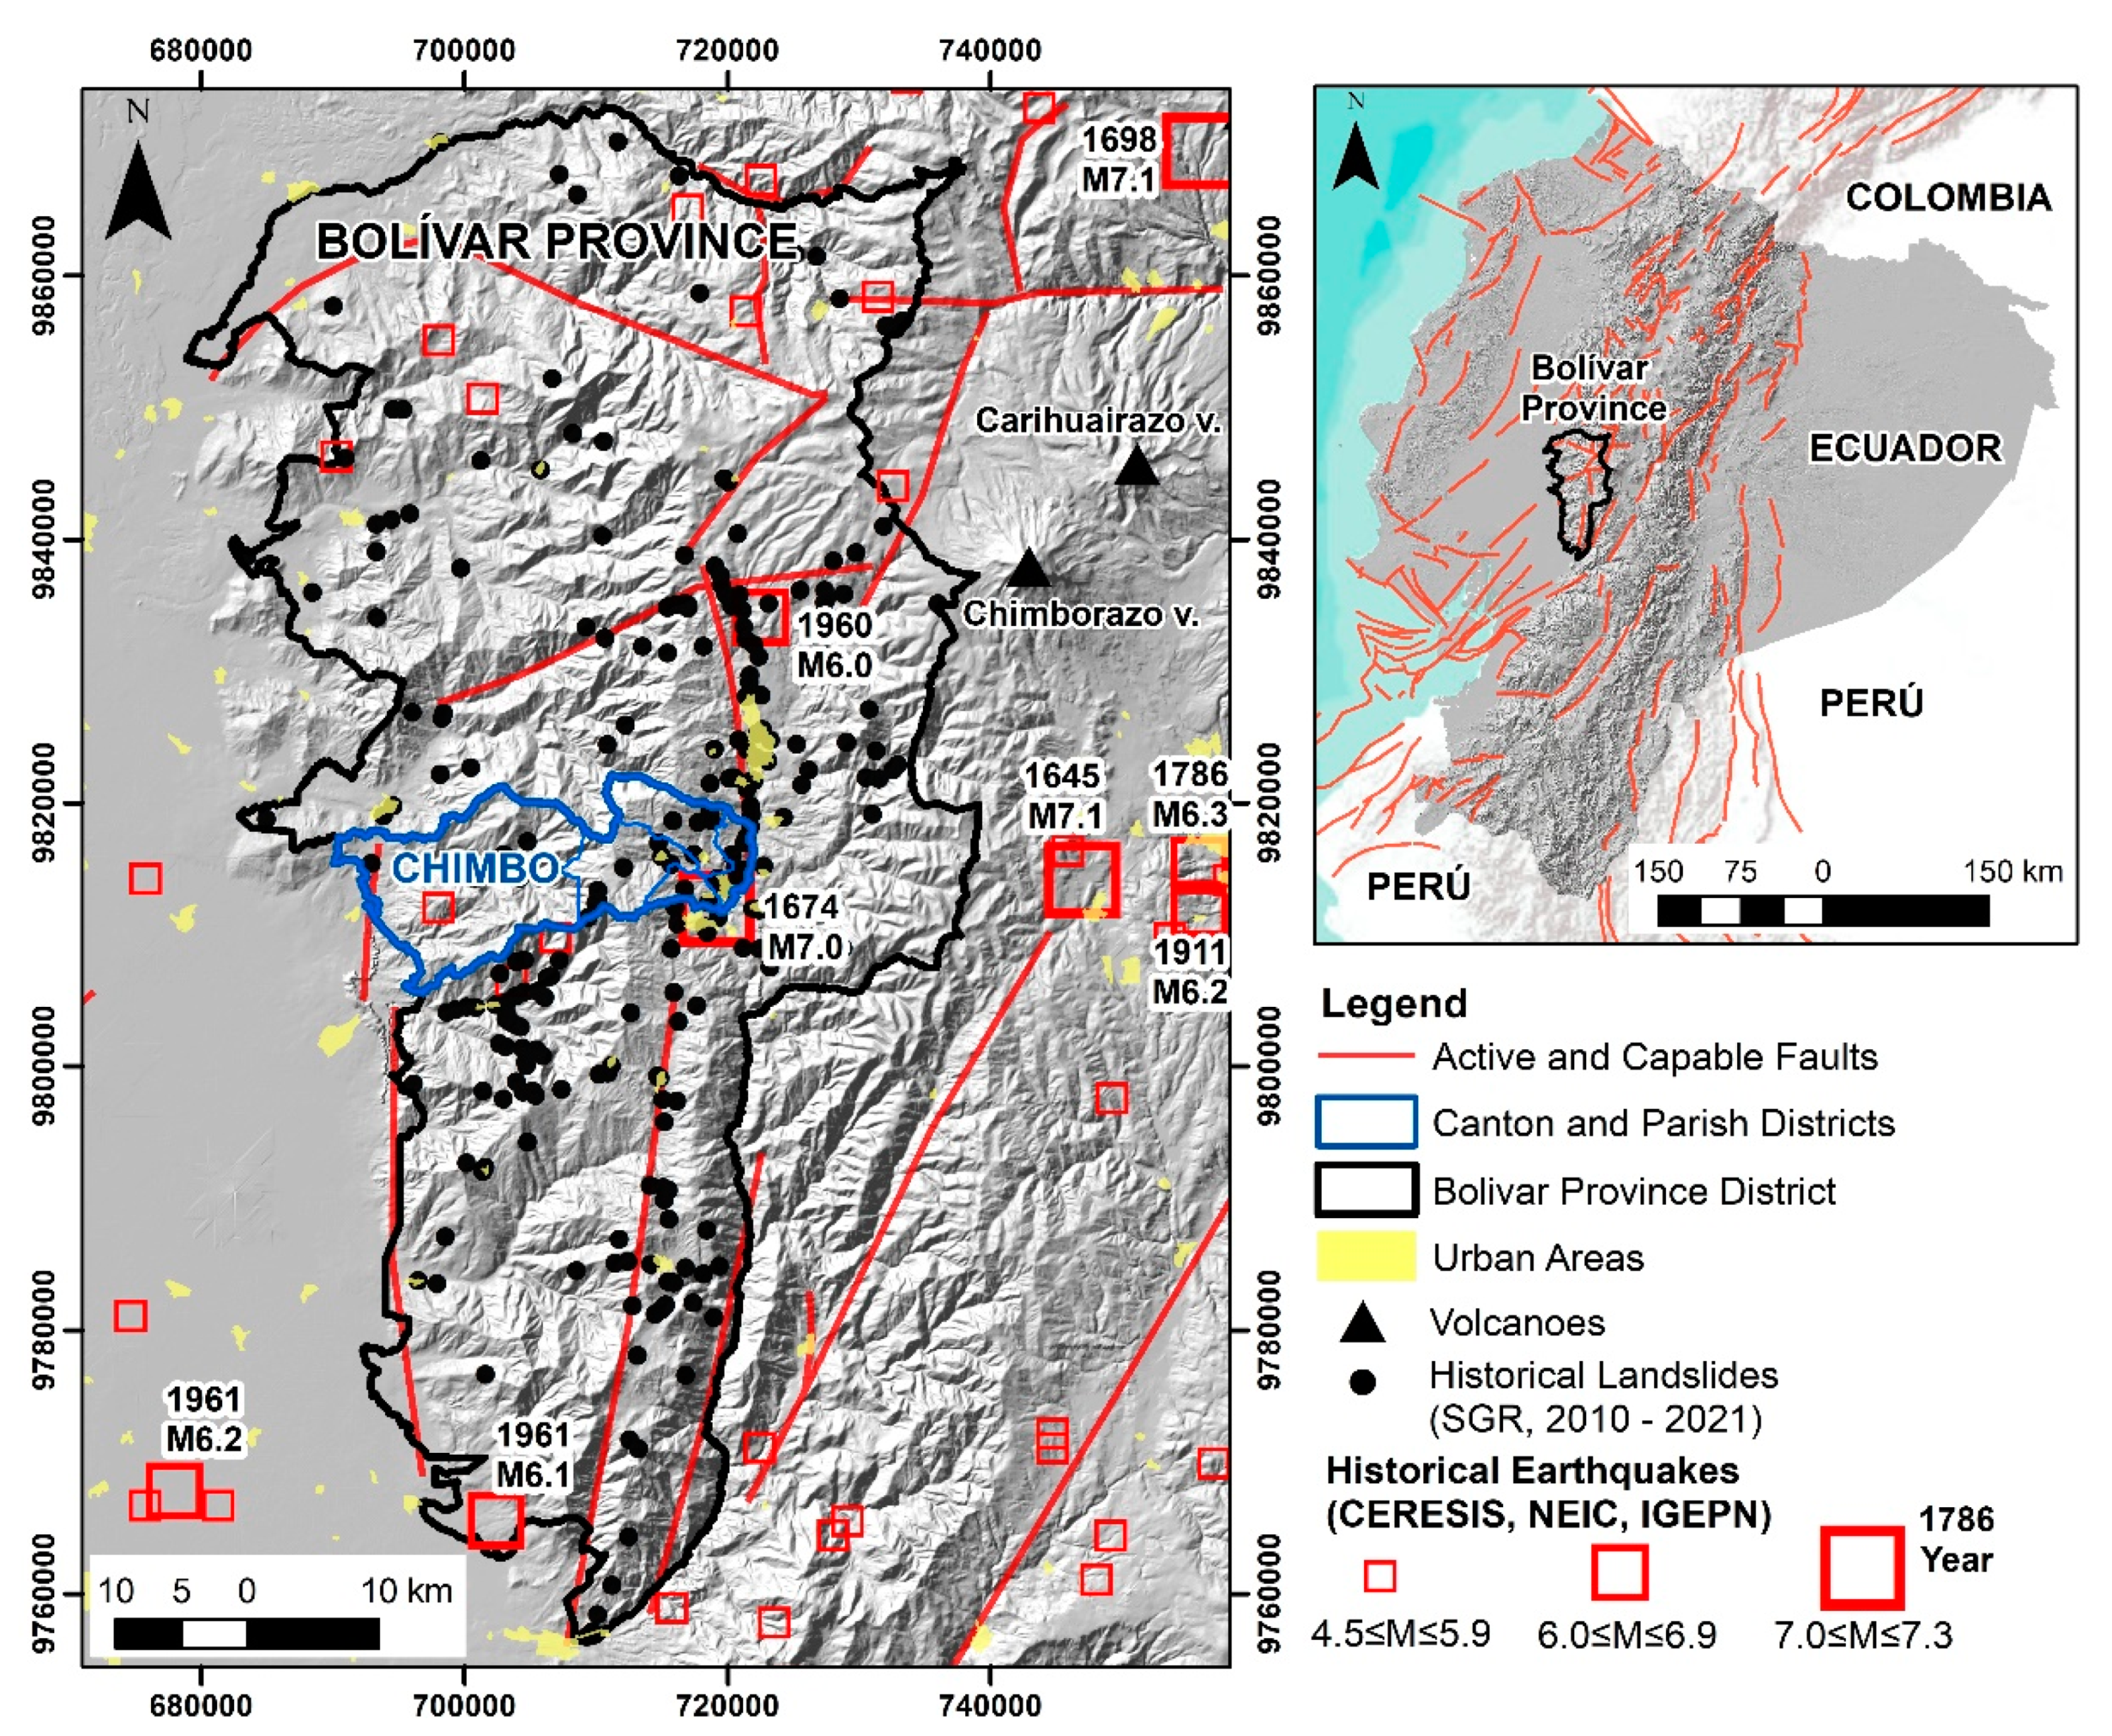
2. Description of the Study Area

2.1. Physiography of the Study Area

One of the regions with frequent evidence of historical landslides in the northern Andes is the province of Bolívar, and it is one of the 24 provinces that make up the Republic of Ecuador, with an extension of 4148 km2. The mountainous reliefs reach altitudes between 2300 and 4350 m above sea level (m a.s.l.), while hilly elevations that border the Ecuadorian coast have altitudes between 100 and 1600 m a.s.l. The Chimbo canton belonging to the province of Bolívar, with 15,000 inhabitants, represents 9% of the total population [27].
The urban capital is the city of Chimbo with 4400 inhabitants, located at an altitude of 2450 m above sea level, and has alluvial terraces that contrast with mountainous reliefs of steep slopes and volcanic and granitic lithology of felsic composition, as well as, to a lesser extent, soils derived from volcanic ash, with a high content of pyroclastic materials and with an apparent density of 0.9 to 1.3 g/cc [28,29]. The area is characterized by a large dendritic drainage network that includes several important rivers that flow into the lower area (Figure 2).
In these Andean elevations of the province of Bolívar, a frequent occurrence of 395 landslides has been documented in the time period between September 2010 and December 2022 [30]. Several of these geological hazards are associated with physical triggers such as prolonged rains from high and/or modest precipitation rates in the winter months or during El Niño Southern Oscillation (ENSO) phenomena. However, the seismic risk from the activation of crustal geological faults, which may have a greater dimension, of multiple landslides in the territory in confrontation with rainfall events should not be underestimated [31,32,33]. Historically, landslides associated with seismic triggers are infrequent and have been generated by moderate earthquakes of local geological faults, where certainly the dimensions of displaced material would be much greater with macroseismic intensities in the order of VIII ≤ Io ≤ X [34] (see Figure 1).
The current study analyzes the recent landslide triggered by prolonged rains, which occurred on 21 December 2021 at the Tamban site, San José de Chimbo canton. There, part of the road infrastructure between Chimbo and the close-by El Cristal, as well as the upper part of the slope, a cobbled street, together with a church, a sports field, a communal house called “the acoustic shell”, and several more houses were covered and/or destroyed by this landslide. The description and interpretation of the landslide include technical criteria, which will define the deformation dynamics, its main geological causes, and the anthropogenic activities of the population, which have resulted in the studied mass movement event.

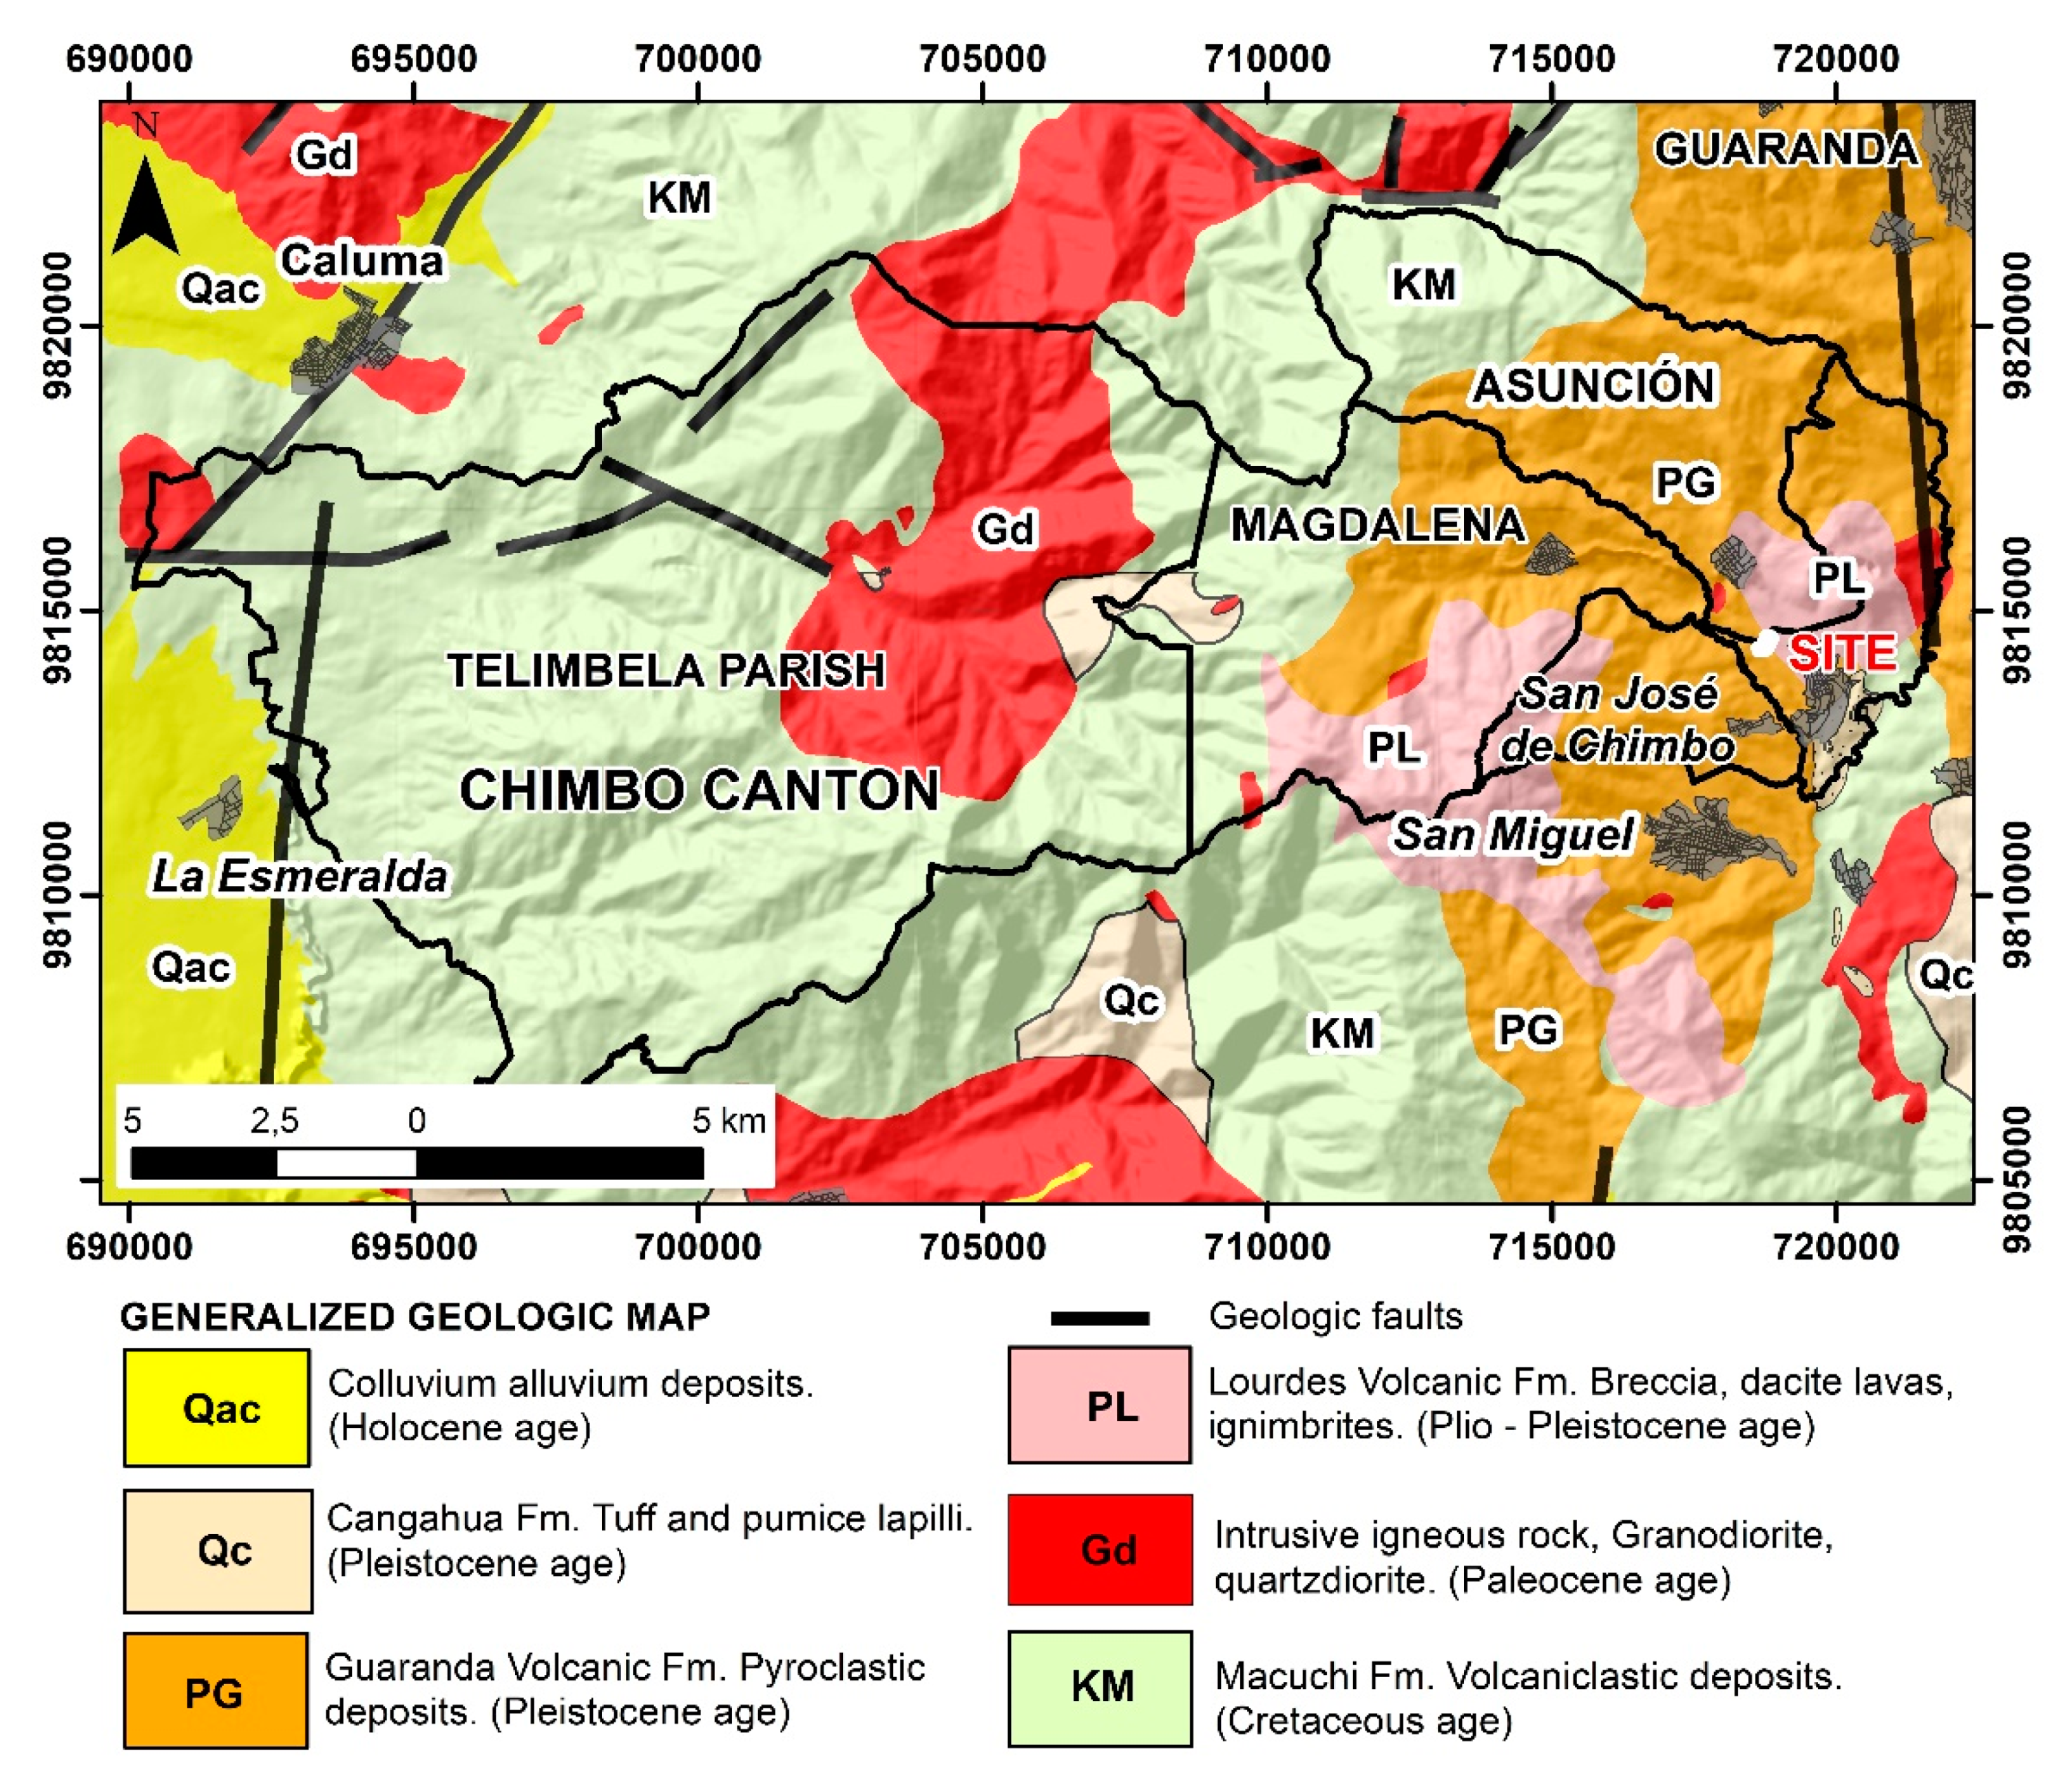
2.2. Geological Formation of the Study Area

The Chimbo canton has four well-differentiated geological formations in its territory. Here, the oldest unit in the canton is the Macuchi formation within the cretaceous basement, where suites of basaltic and volcano-sedimentary lavas outcrop in the entire parish of Telimbela and part of Magdalena and Asunción [35,36,37,38,39]. In the study area, the most representative lithology of volcanic origin corresponds to the Arrayanes formation of the Plio-Pleistocene age (see Figure 2). This formation has been also mentioned on local scale maps as Lourdes Volcanics, being composed of ash-coated lapilli and accretionary lapilli interspersed with lapilli tuffs and andesitic as well as rhyolite lavas [38,39]. These volcanoclastic lithologic units are cut by tonalite intrusives, probably from the Paleocene. Granodiorite intrusives older than the units described are not very outcropping in the Chimbo canton. All these Tertiary lithological units are covered by the Guaranda volcanic unit of the Quaternary age, which includes fall-out tuffs, breccias, agglomerates, and Pleistocene andesitic lavas from older volcanic centers such as Chimborazo and Carihuayrazo. Holocene volcanic sediments cover the preceding lithologies, with material from secondary volcanic lahars, poorly consolidated pomaceous volcanic deposits, debris flows, and fragments of minor lavas from younger centers such as Cotopaxi and Tungurahua volcanoes [39].
Figure 2. Generalized geologic map of Chimbo canton [39,40].
Geosciences 14 00104 g002
Lithological and geomorphological factors define the classes of landslides that can be coherent (rockfall, overturns), disruptive (translational and rotational), and lateral spread landslides (unconsolidated soils of recent sedimentary deposition). Numerous case studies have been conducted all over the world, investigating geological (lithology, hillslope geometry) and seismological (macroseismic intensity, horizontal PGA-h peak ground acceleration, Rrup distance) factors, with the aim of evaluating the dynamics and kinematics of landslides and may prevent disasters in densely populated urban areas or industrial sectors in development and also in other potentially vulnerable areas [4,34,40].

2.3. Rainfall Characteristics

Based on the Koppen climate classification [41,42], the studied region is characterized by different sub-climates ranging from semi-humid to dry mesothermal, which are the most frequent climates in the inter-Andean region. These are characterized by irregular temperatures, being highest in the months of March and September, while the months of June to July coincide with the lowest averages, where the soils lack sufficient moisture for plant growth [43]. The temperature in the Chimbo canton is varied, with changes according to the area that range from 12 °C to 18 °C. The predominant vegetation is premontane and lower montane humid forest, where the native forest has decreased by 4.6% in relation to the year 2000, due to the felling trees to sow temporary crops and pastures [29].
The populated area has increased proportionally in the zones where the areas of shrubby and herbaceous vegetation have been exploited [29]. These anthropic activities without the corresponding technical knowledge have occurred in some areas, where soil oversaturation due to irrigation from agricultural activities has generated smaller dimensioned but nonetheless multiple landslides in the area (see Figure 3).
The rainy seasons yield less than 500 mm annually, which occur between December to April (Table 1), with the exception of the Telimbela parish, which is a very humid subtropical bioclimatic region with an average annual rainfall of 2000 to 3000 mm. For the Tamban site in the city of San José de Chimbo, there was a rainfall record in 2020 of 624 mm. However, by 2021, rainfall reached an increase of some 202% in this particular sector. The advancing conditions of the ENSO, by the end of 2023, will increase three times the average precipitation recorded in Tamban in the province of Bolívar.

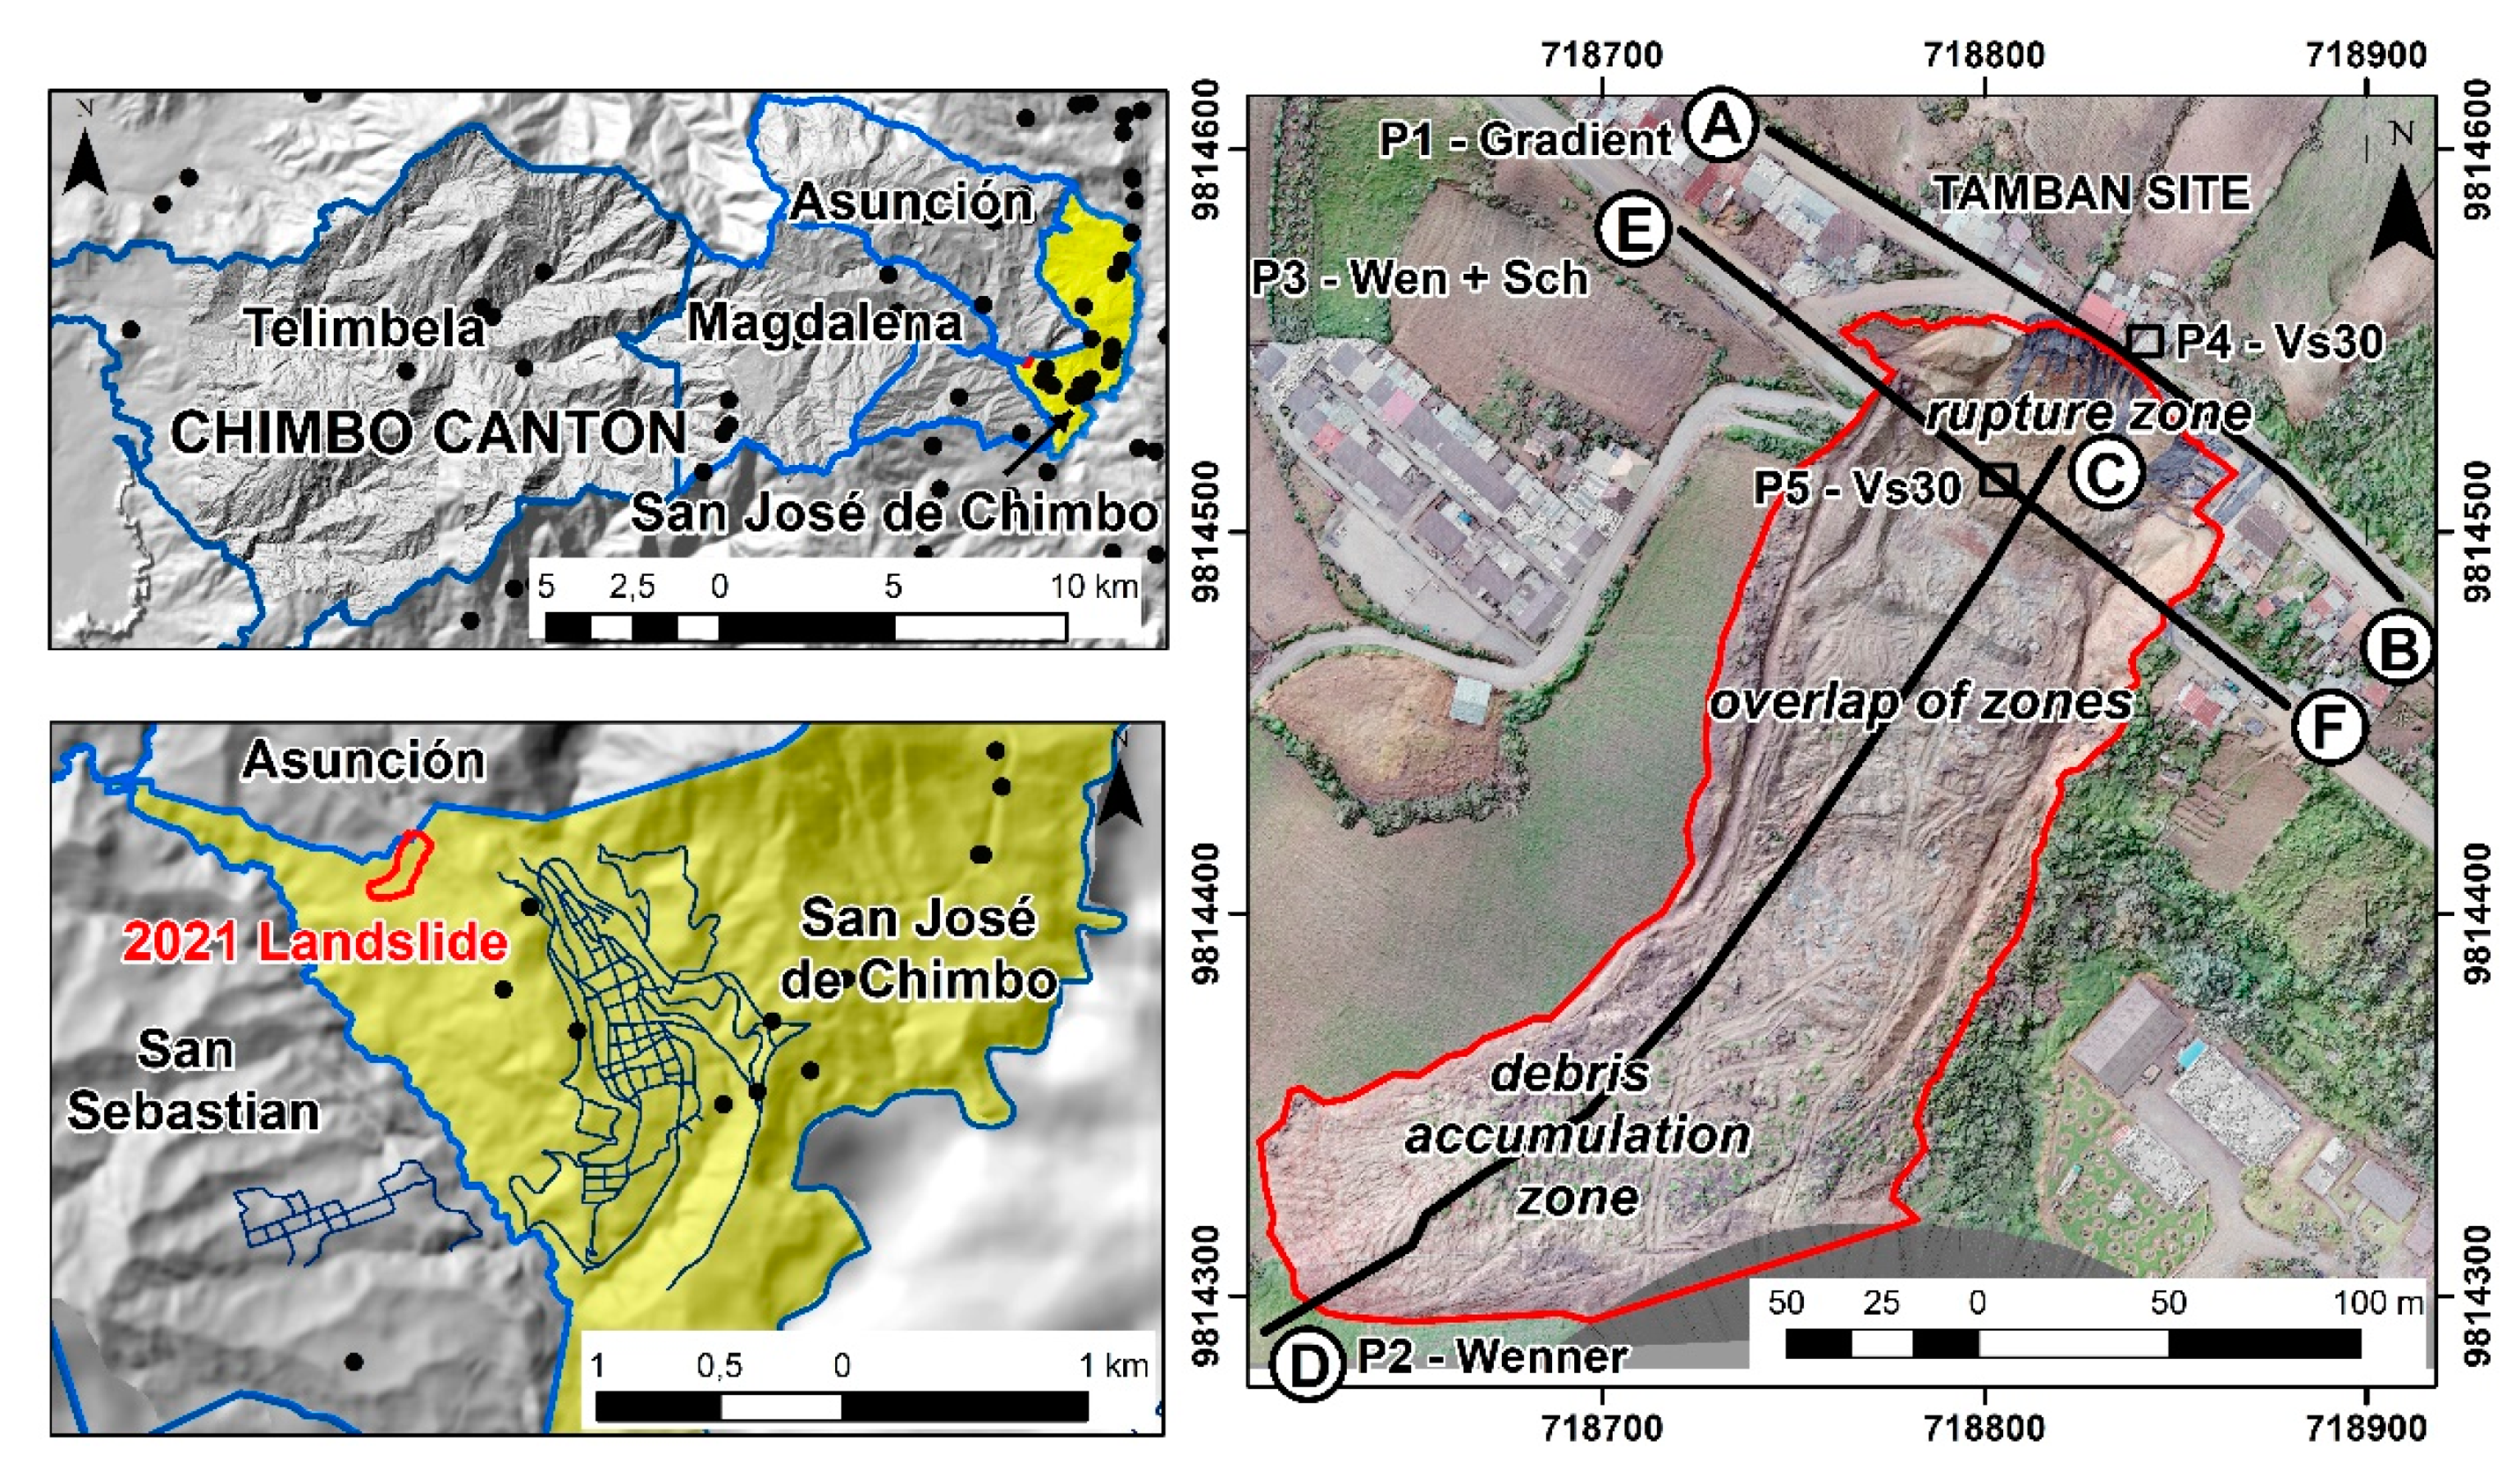
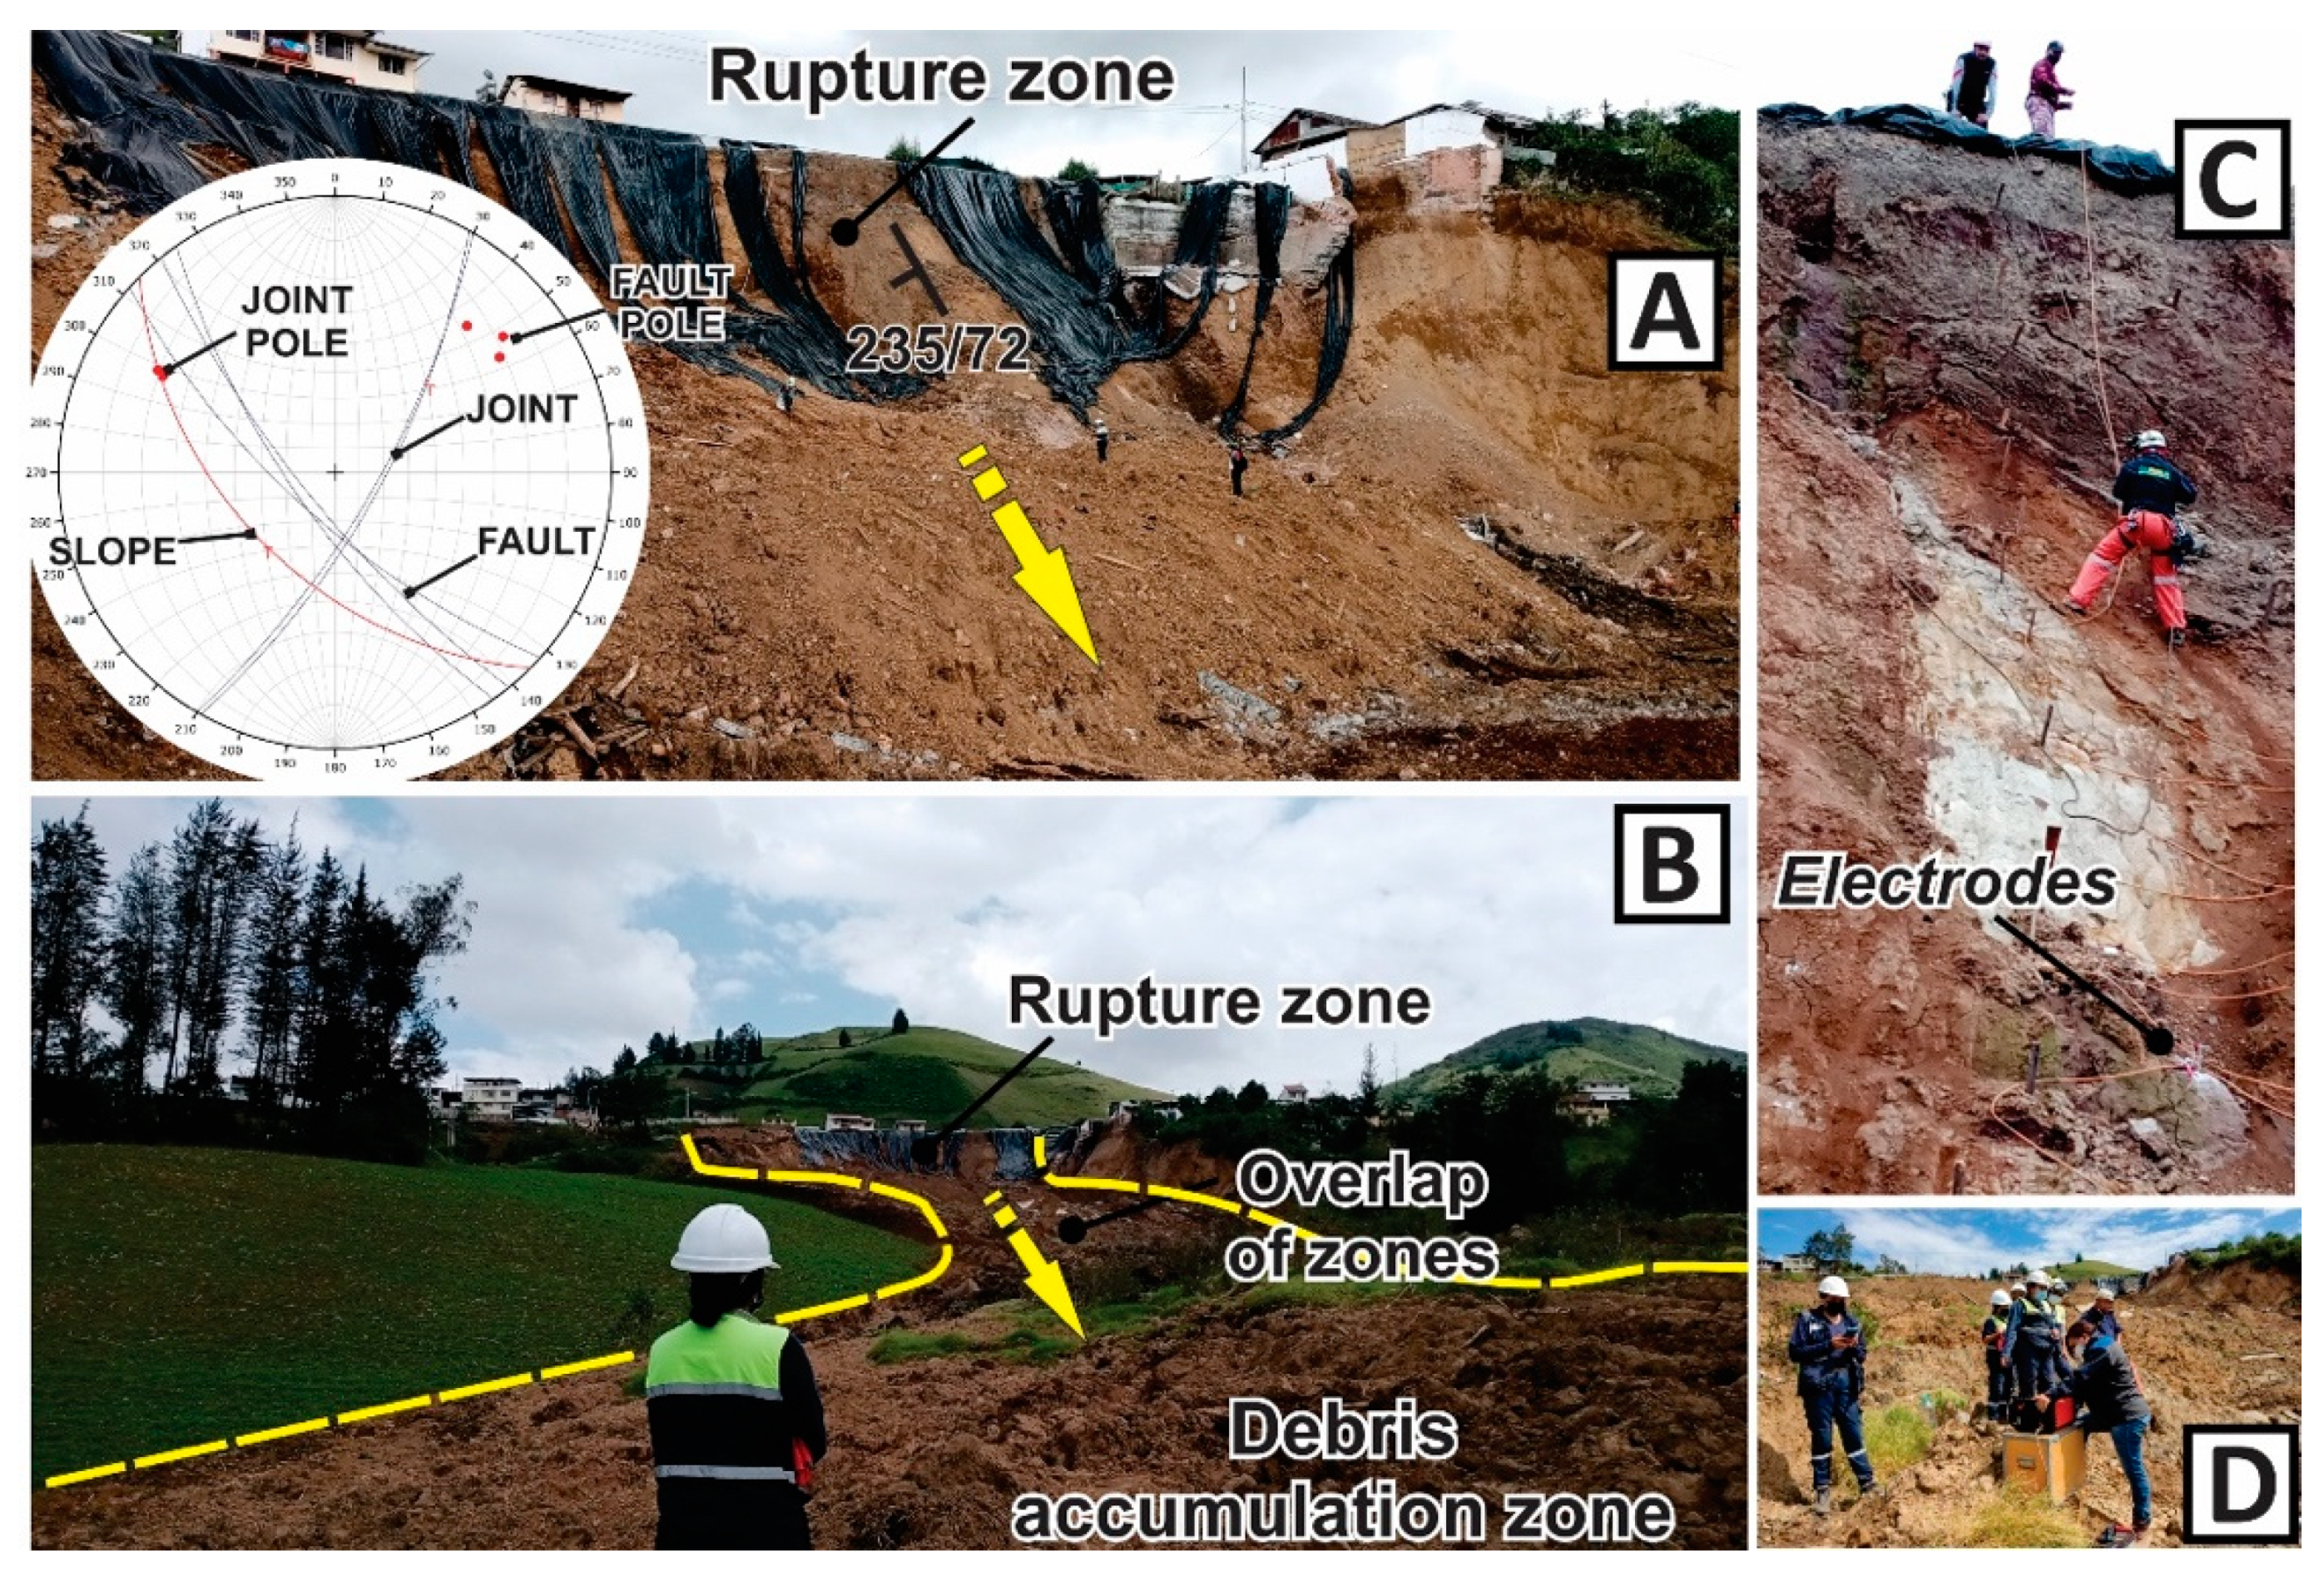
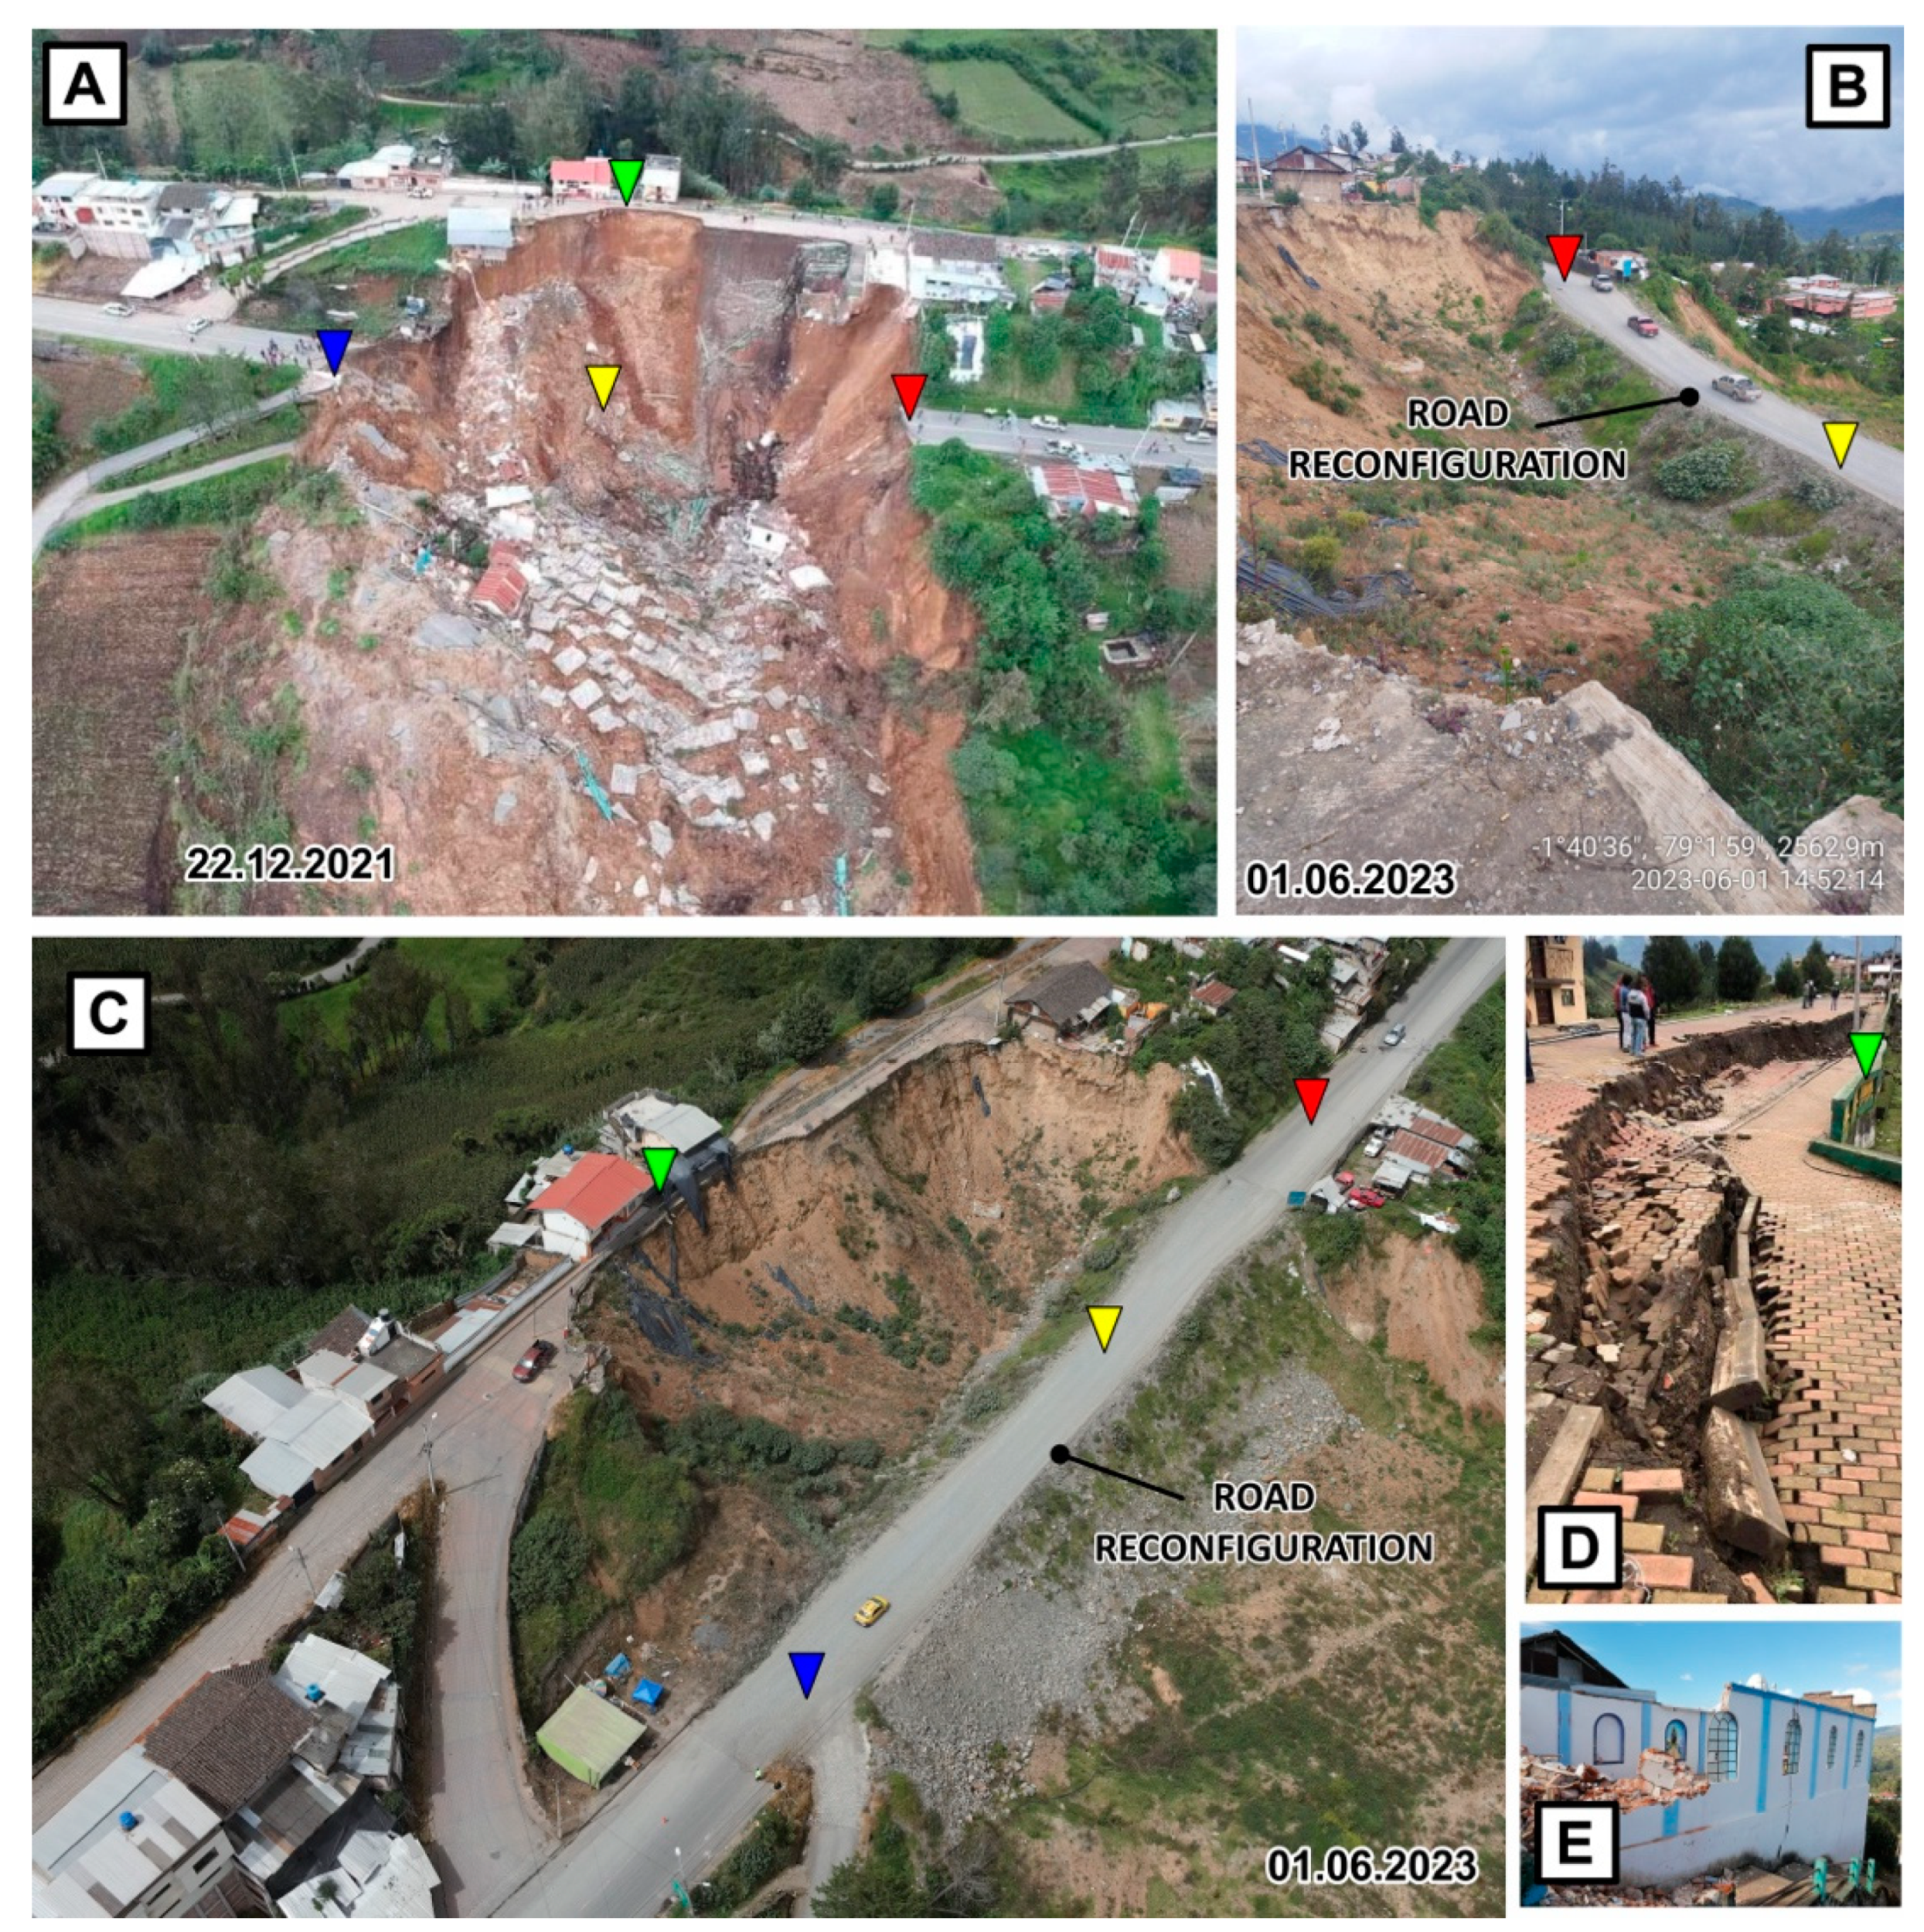
3. The Tamban Landslide of 2021

3.1. Extent of the Occurred Disaster

On 21 December 2021, at 23:30 local time, low-precipitation rains, which were prolonged for eleven days, caused saturation levels in highly altered volcanic materials. These moved through a listric plane of an old geological fault, affecting several homes, a neighboring road and a main inter-cantonal highway of the Guaranda road. Evidence of deformation in the terrain and its dimension of the detachment and accumulation zone is illustrated in Figure 4 and Figure 5. Meteorological stations belonging to the National Institute of Meteorology and Hydrology (INAHMI) monitoring network did not record rainfall data on those days as they were not in operation. The San José de Chimbo parish, particularly the Barrio Tamban site, was the most affected by the landslide, where the inhabitants had to abandon their homes, situated close to the landslide escarpment, which represents the beginning of the landslide zone. Likewise, the sewage system, water supply, and electrical networks remained out of regular operation. The total collapse of the entire structure of the main road inhibited traffic for five months. Later, a fill material without technical specifications allowed partial circulation. Nonetheless, such outcomes were most likely affected by the next winter months that began in December.
According to the classification of Varnes [12,44], and the reconnaissance in the field during the geological and geophysical prospecting phase, the landslide in the Tamban area in the detachment zone is translational, and the materials were transported and deposited in the accumulation zone at a distance of 330 m as debris flow with rubble materials from collapsed houses and highways (see Figure 4 and Figure 5).

3.2. Main Causes of the Landslides

The main causes of landslides can be derived into two categories being predisposing factors (lithology, slope, topography) and triggering factors (rainfall or earthquakes). The Chimbo canton has higher events of landslides triggered by prolonged rains, while landslides with seismic triggers have much longer recurrences. Lithologically, the dominant granular and cohesive materials in San Jose de Chimbo are associated with lapilli-supported fall layers, high mineral weathering, and loss of soil resistance, presenting a plastic lithological aspect, which are delineated in blocks by planes of discontinuities in the saprolites. In this type of volcanic material, with the combination of the planes of the discontinuities, the landslides are classified as coherent with listric planes of translational and rotational displacements that end as flows in the accumulation zone of a landslide.
Based on the given data, the stratigraphy for the Tamban site comprises mainly two lithological units, evidenced in the slope cut formed after the landslide, an upper unit of poorly permeable material where the massive lapilli tuff rich in fine and medium ash matrixes and abraded lapilli was highly saturated, and below a unit of cohesive material with characteristics corresponding to high-plasticity silt, probably formed from the alteration of a volcanic tuff. The saturation of this lithology is the main triggering factor, where the low-precipitation rains that began in the early morning of 12 December 2021 lasted up to eleven days, with the generation of the landslide at the Tamban site [17].
The geotechnical effects on the surface were already documented as cracks in the upper part of the slope and displacement of street sidewalks and at the pavement level. The houses indicated differential settlements on the ground, where the soil mass experienced eventual sudden changes such as a decrease in shear resistance, resulting in the landslide of 21 December 2021. Indeed, months before the main event, the Tamban area already registered specific and isolated saturation of the ground due to some breaks in sewage pipes, where the seepage and saturation of the soil decreased the shear resistance of the soil. This punctual saturation feature is evidenced up to ten meters deep and confirmed by electrical tomography geophysical tests performed in previous studies [45,46,47]. Positive pore water pressures developed within the soils, which lowered the effective stress and consequently reduced the shear strength of the soil.

4. Methods and Field Investigation

This research work has been planned in two phases. In the first phase of field geology and geophysical prospecting, the dynamics of ground deformation was analyzed from the stratigraphy of lithological units, measurements of discontinuities in saprolite material, and delineation of saturated material evidenced in the slope cut of the escarpment of glide. The array configurations used to obtain data were dipole, gradient, Schlumberger, and Wenner, which were processed with the software RES2DINV, where geophysical surveys of three electrical tomography sections, P1 (profile A-B) with gradient measurements and 205 m in length, P2 (profile C-D) with Wenner–Schlumberger measurements and 315 m in length, and L3 (profile E-F) with Wenner measurements with a length of 200 m (see location of the geoelectric lines in Figure 3). The measurement error was 6.9 and 9.3%, being evidently below the allowed limit of 10%, which indicates high quality in the data processing results.
The electrical method was based on the electrical resistivity tomography (ERT) and consisted of establishing the curves of resistivity variations with the depth of the ground through measurements on the surface [46,47,48]. These measurements were performed with a subsoil resistivity meter ABEM Terrameter LS 3000, where up to 63 electrodes with a spacing between 4 to 5 m were used. Subsequently, we injected a maximum current intensity of ± 600 V and 2500 mA, which allowed the identification of electrical resistivity anomalies in different subsoil materials (see Figure 6). Electrical tomography is a multi-electrodic resistivity method, based on 2D modeling of the soil resistivity through the use of finite element or finite difference numerical techniques, allowing for electrical tomography to have a high potential as a tool for the study and exploration of the subsoil [47].
A second indirect test of seismic surveys of shear wave velocity (Vs30 m/s) reached 30 m in depth. These tests have abbreviations P4-Vs30 and P5-Vs30 profiles (see Figure 3). The seismic laying had a lineal configuration of 24 geophones and spacing every 5 m between them, and with these aspects, it was possible to conduct a laying of 120 m in length on the surface of the ground, where the model of seismic speeds of the cutting wave (Vs) was obtained through a process of mathematical inversion for seismic data and whose RMS error associated with the inversion process was 2.4%. To determine the speed of the seismic shear waves (Vs), the data obtained from the MASW and MAM techniques were integrated, outlining possible lithological contacts in the volcanic sequence of the Tamban site [49,50,51]. Finally, the results of indirect geophysical tests, which delimited the geoelectric (measurements in Ω.m) and geoseismic (measurements in m/s, Vs30) units, were compared with the lithological units recognized on the ground.
Preliminary data from excavations through pits up to three meters deep indicate that the lithological materials that make up the upper part of the slope are classified as silt with low to high plasticity with sand and medium to high compressibility (liquid limit between 39 to 60, as well as plasticity index between 1 to 16). After the 2021 landslide event, and evidencing the lithological units in the slope cut of the main scarp, in this study, a total of four undisturbed samples were taken (Shelby tubes) from lapilli-supported fall layers and volcanic tuffs for laboratory analysis (see Figure 7 and Table 2). The results of these tests and field observations were used to assign the soil resistance parameters necessary for numerical modeling (see Table 2).
In the second phase of the slope analysis and numerical modeling, the kinematic and dynamic analysis of the unstable slope was considered. The kinematic analysis considered the combination of the discontinuities with respect to the direction of the slope, identifying a main planar-type sliding deformation mechanism. The main discontinuity was attributed to planes of an old geological fault with a favorable direction to the slope (222/71, dip direction/dip). A second finite element analysis was performed to investigate the failure mechanism and safety factor of the slope that failed during the 2021 landslides investigated herein. In order to analyze slope stability, deterministic or probabilistic methods are used, such as geotechnical models [20,22,52]. It has been also necessary to calculate a safety factor that represents the potential failure [23], based on a geotechnical model of the studied site. Furthermore, we analyzed also its physical–mechanical parameters such as topography, arrangement of soil strata, parameters of shear resistance, and groundwater level [21]. Through in situ observations and measurements, a planar slip of cohesive materials was identified, caused by a discontinuity that exceeded the friction angle. According to Hungr et al. (2014); this type of slip occurs when there is a weak layer that creates a deep tension crack without an active wedge, which triggers a slow or fast movement. Like other landslides in overconsolidated shales or clays, the fault surface follows a pre-shear discontinuity of residual friction, which can be caused by tectonism or be progressive [53].
A complete statistical base is expensive to prepare [21,22]; therefore, all uncertainties can be specified based on available information, field observations, professional judgement, and even post-event laboratory analysis, from which a useful data interval or fuzzy set is obtained of the necessary parameters in the modeling [23], which can be considered uncertain such as the groundwater level, cohesion, friction angle, and unit weight.
The geological properties, and especially the mechanical properties of both soil and rock slopes, vary from one place to another and can change over time. Furthermore, their characterization is based on the results of laboratory tests, where real ground conditions are difficult to reproduce [54]. This leads to uncertainties when assigning the geomechanical properties of the subsoil, and with deterministic methods, these uncertainties are considered in the design safety factors [55,56]. Therefore, deterministic methods are gradually being replaced by more practical approaches such as probabilistic methods.

5. Results and Discussion

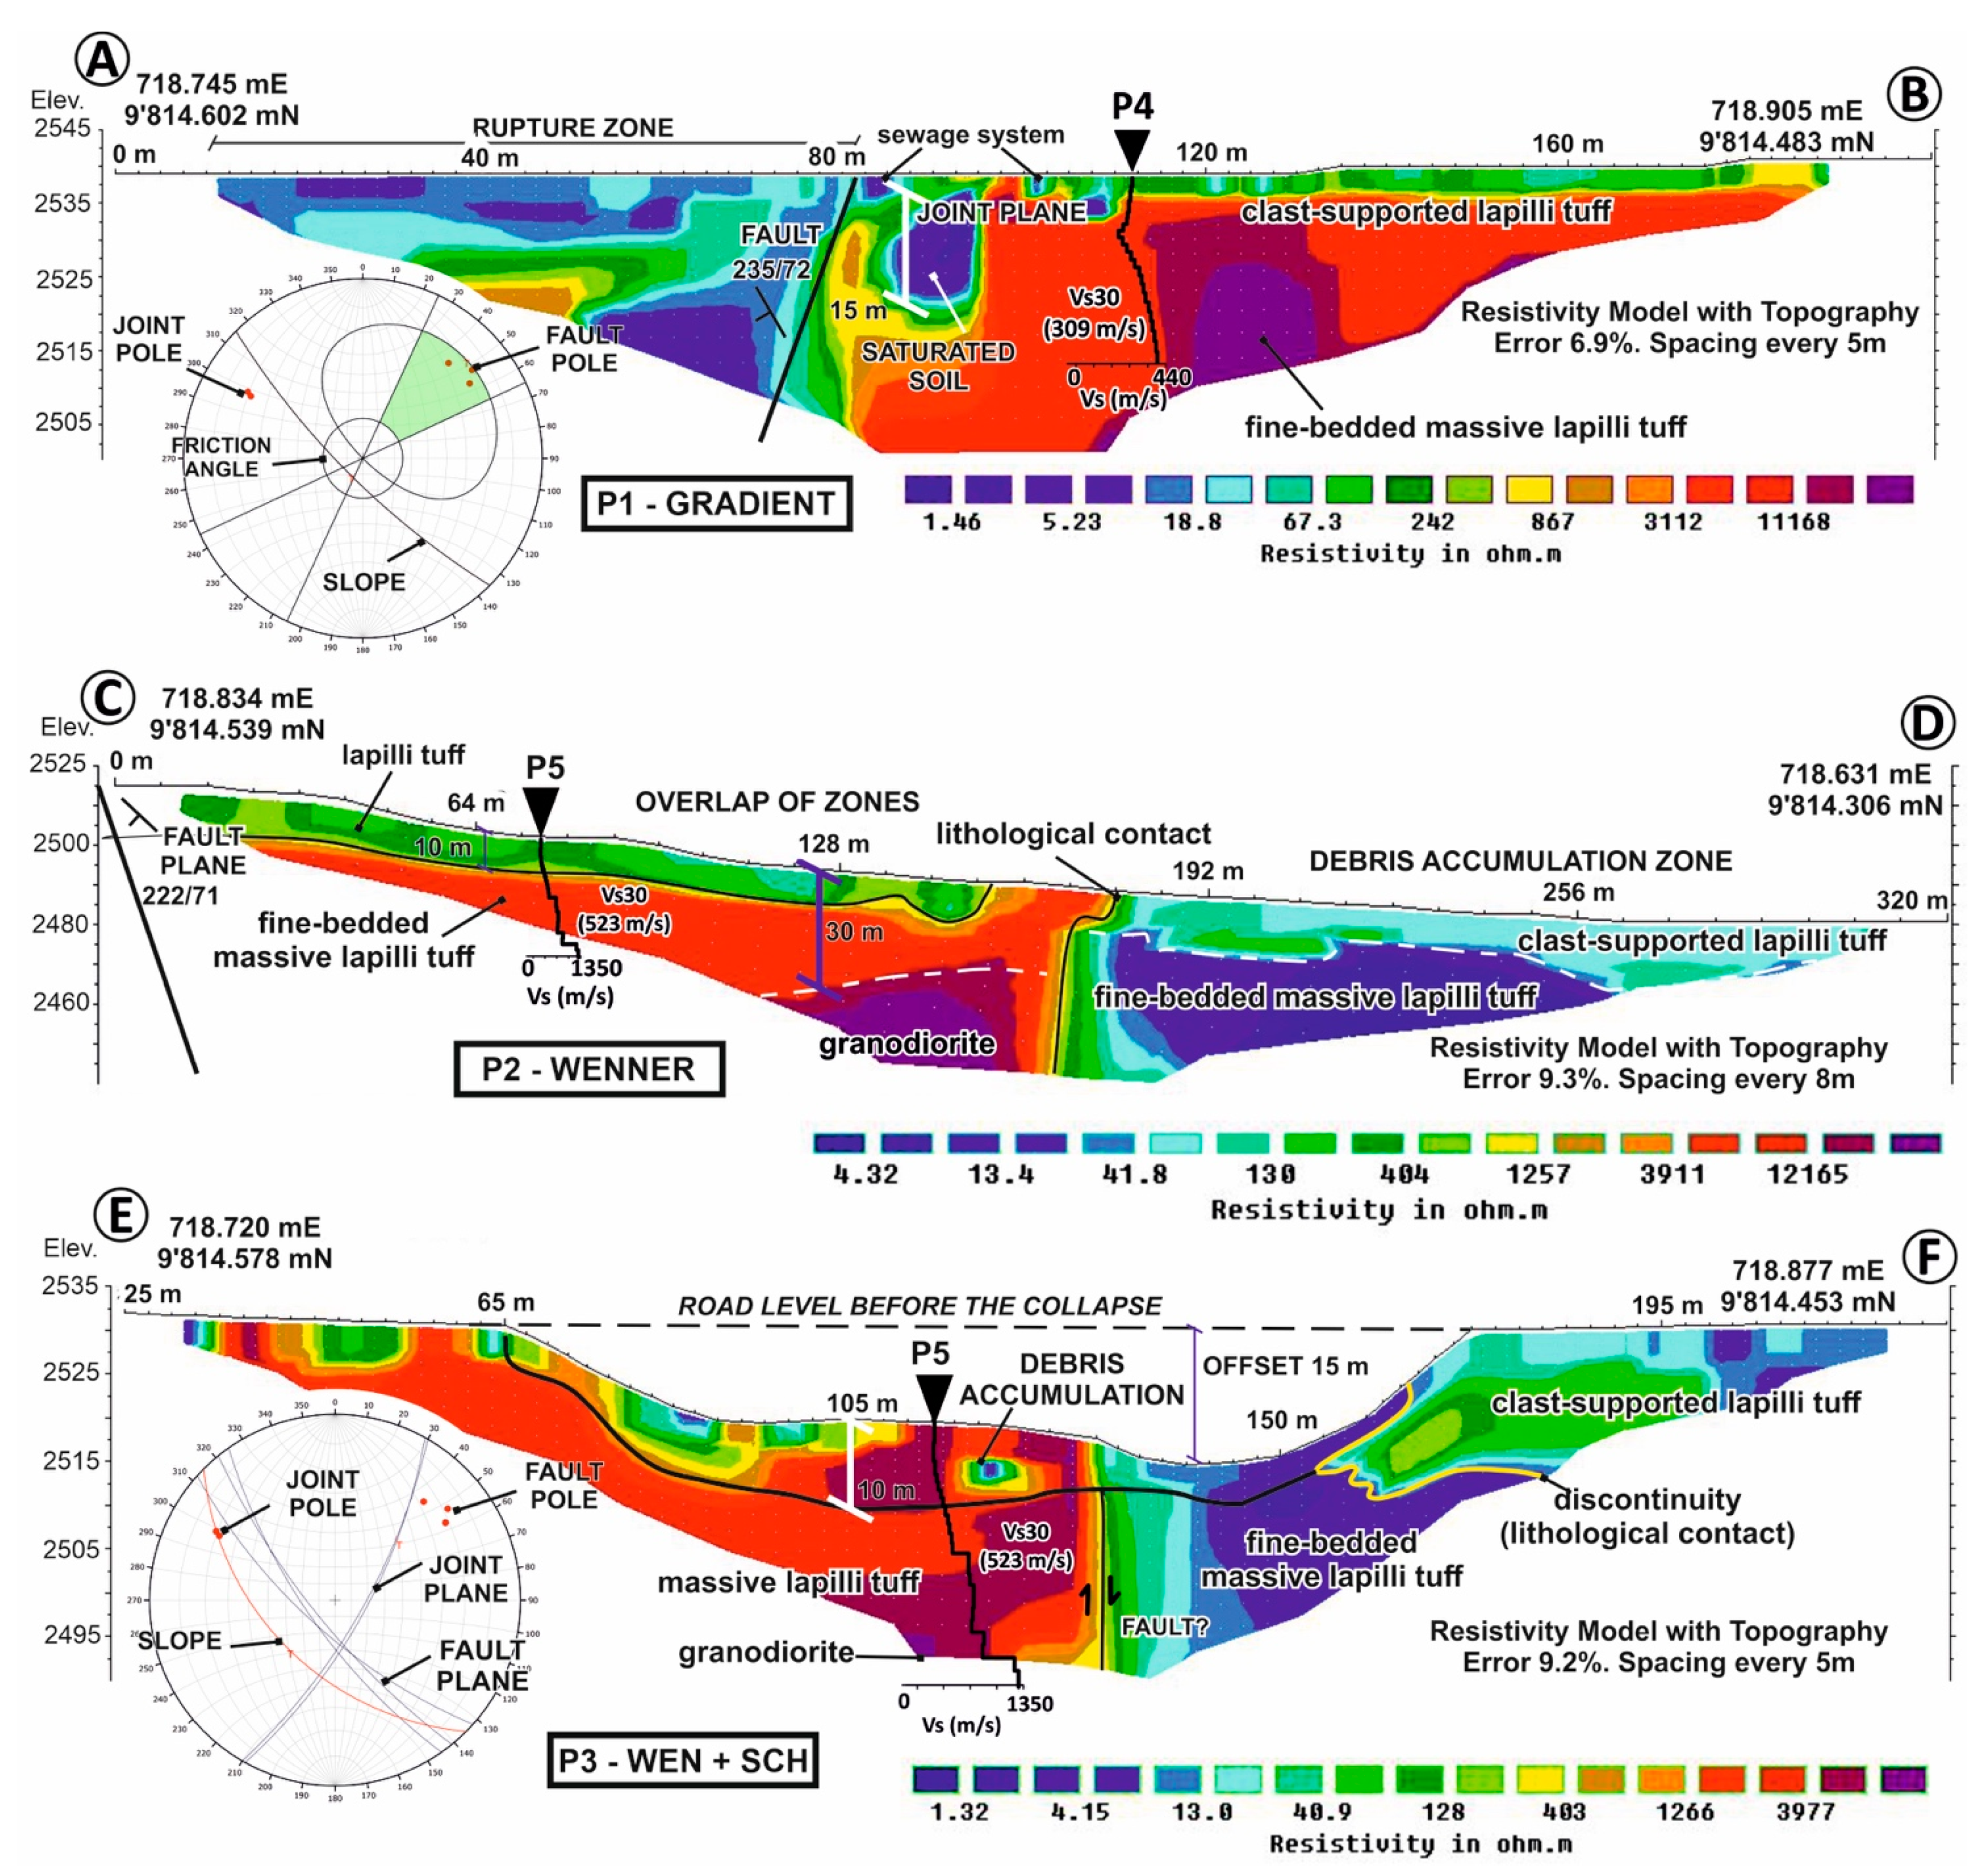
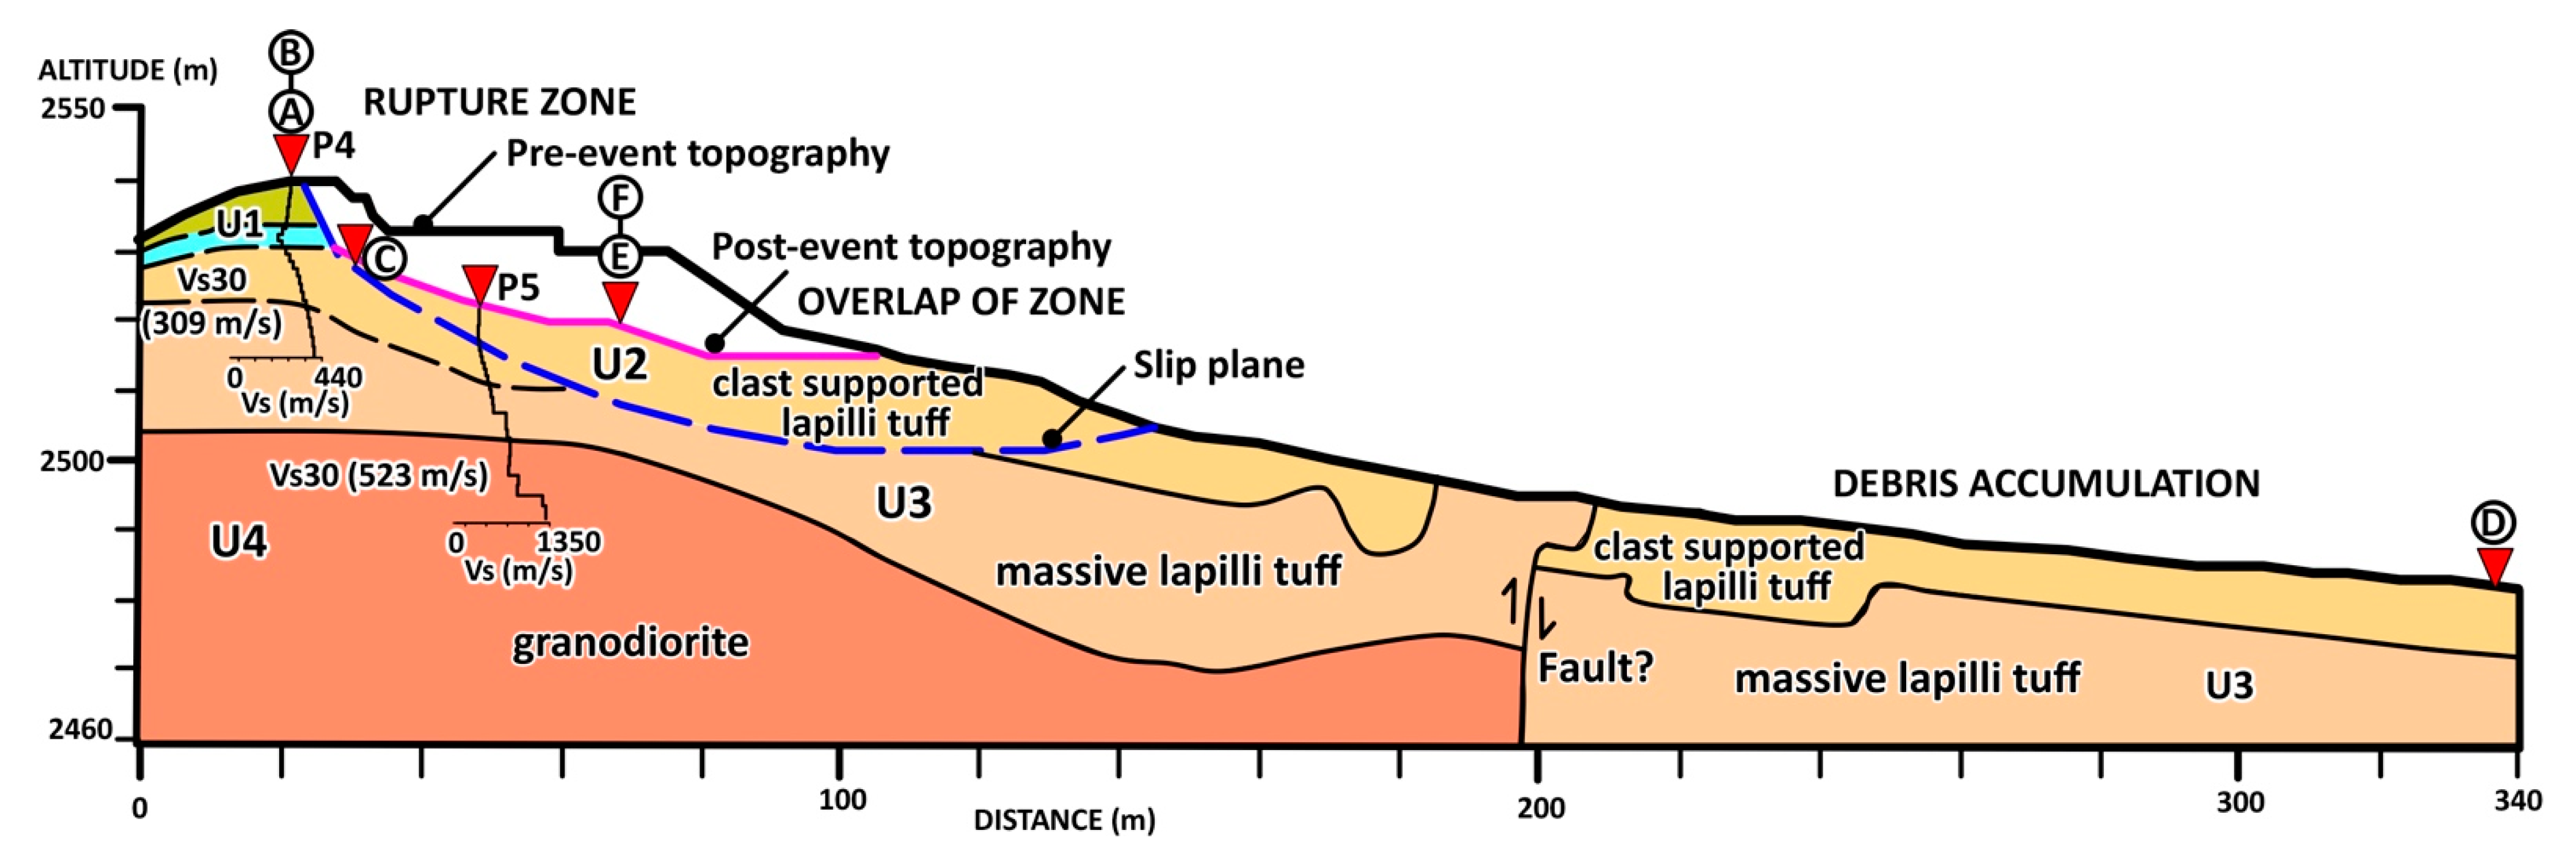
5.1. Data and Numerical Modeling

In the current research, the stability of the slope located in the Tamban area was calculated using a landslide model [56]. To develop this model, we used GeoStudio 2018 R2 version 9.1.1.16749 software and employed finite element modeling in order to calculate the factor of safety towards sliding below different soil conditions. This modelling program enabled us to analyze the stability of slopes graphically with the geomechanical parameters of the study site. Considering that the fault surface observed with geophysical methods and graphically corroborated with the projection of the exposed slope face that reached the upper limit of a highly altered lapilli-supported fall layer and defining the site stratification with the same methods, the original topography was taken to start the slope stability analysis. For the level where the failure surface occurred, by means of a back analysis using the Morgenstern–Price method and starting from the index parameters for each stratum [22], the soil resistance data were obtained at the moment of collapse. This, on reaching a factor of safety (FS) equal to 1, indicates the state of equilibrium of the slope in the static case. Furthermore, the Mohr–Coulomb constitutive model was used, wherein the failure surface occurs when the soil loses its strength and on which the maximum shear stress and normal stress act.
It is also considered, according to the NEC-15 standard, that once the stability analyses have been performed in the corresponding software, the minimum safety factors to be reached must be 1.50 in the static case and 1.05 for the pseudo-static case [26,56]. Furthermore, according to the seismic design map of this standard, the Tamban site is located in a zone with a value of 0.35 g of seismic acceleration, and it needs to be considered that the seismic demand for pseudo-static analysis is 60% of the peak ground acceleration, which is analyzed in the software with a value of 0.21 g for this given case.

5.2. Geotechnical and Geophysical Characterization of the Subsoil

Geophysical prospecting from electrical tomography (measured in Ω.m) allowed us to differentiate lithological units up to 40 m deep. In the rupture zone or main landslide scarp, there are isolated zones of saturated material that reach a depth of up to 15 m, probably associated with ruptures in sewerage system pipes. Here, the resistivity values are 1.46 Ω.m (see Profile P1 in Figure 6). The seepage and isolated saturation of the materials since the rupture of the sewage system has not been the trigger for the landslide that occurred on 21 December 2021. However, the combination of other natural causes such as geological and geomorphological, such as some unconsolidated sediments or weathered and jointed material or adversely oriented structural discontinuity, contrast in permeability and in stiffness, suggesting the presence of dense material over plastic materials.
The first lithological unit that included medium-to-fine-bedded massive lapilli tuff units, with low plasticity, had resistivity values in the order of 900 to 3500 Ω.m. The geotechnical parameters obtained from the laboratory for this unit indicated values of ϒm between 14 and 15 kN/m3, φ between 23 and 42°, and cohesion between 15 and 28 kPa [57]. Recognition on the ground allowed the evaluation of the deformation dynamics of the landslide, and a plane with well-differentiated striations of a normal-type geological fault with rake −90° and structural data of 222/71 (dip direction/dip) was evidenced. The width of the fault was three meters thick and may be associated with an inactive regional fault. With these facts described, the saturated material corresponding to the lapilli tuffs unit moved through a lower geological fault plane. This deformation feature is associated with a planar landslide that, due to its size and transport, reached a distance of 300 m as debris flow (see accumulation of debris in Figure 4).
The second lithological unit corresponds to very fine-bedded massive lapilli tuff, with a high plasticity index. Through the Unified Soil Classification System (USCS), it was determined that for the landslide body, the material corresponded to a silt of high plasticity (MH) and high compressibility (liquid limit between 64 and 67, plasticity index of 27). By executing an unconsolidated undrained triaxial, a cohesion of 85.35 KPa and a friction angle of 18.26° were obtained. For the exposed face, we obtained a silt of high plasticity (MH) of high compressibility (liquid limit between 91 and 96, plasticity index between 42 and 46), with a cohesion of 89.27 KPa and a friction angle of 12.90°. These shear resistance parameters will be the basis for developing an inverse analysis and knowing the geomechanical values corresponding to the moment of collapse, necessary for numerical modeling. From these samples, it was also known that the material of the sliding body had an average void ratio of 1.19, a specific weight of 17.11 kN/m3, a moisture content of 38.72%, and an average degree of saturation of 87.9%. For the exposed face, there were average values of 2.33 for the void ratio, a specific weight of 14.19 kN/m3, a moisture content of 75.10%, and an average degree of saturation of 87.01%.

5.3. Assessing Landslide Susceptibility, Hazard, and Risk

In reference to the effects of damage to the ground during the landslide, which occurred on 21 December 2021, at the Tamban site, three deformation zones are well differentiated. The first is the rupture zone or detachment zone from the escarpment main, which has a slope height of 26 m. The second is the overlap zone or tilted blocks, which have listric planes of secondary escarpments which are well differentiated on the surface and reach a depth of 10 m. The third is the debris accumulation zone that has displaced material covering a horizontal distance of 300 m, with thicknesses of 10 m near the secondary scarps and from 2 to 4 m in the final zone of the flow (see Figure 6). The electrical tomography tests delineate the thickness of the rubble material, under a layer of lithic lapilli tuffs of volcanic composition where the thickness is in the order of 15 to 20 m. Deeper, there is the most resistant stratum with seismic velocities of 500 ≤ Vs(m/s) ≤ 1300, which corresponds to sandstones of dense to very dense volcanic composition.

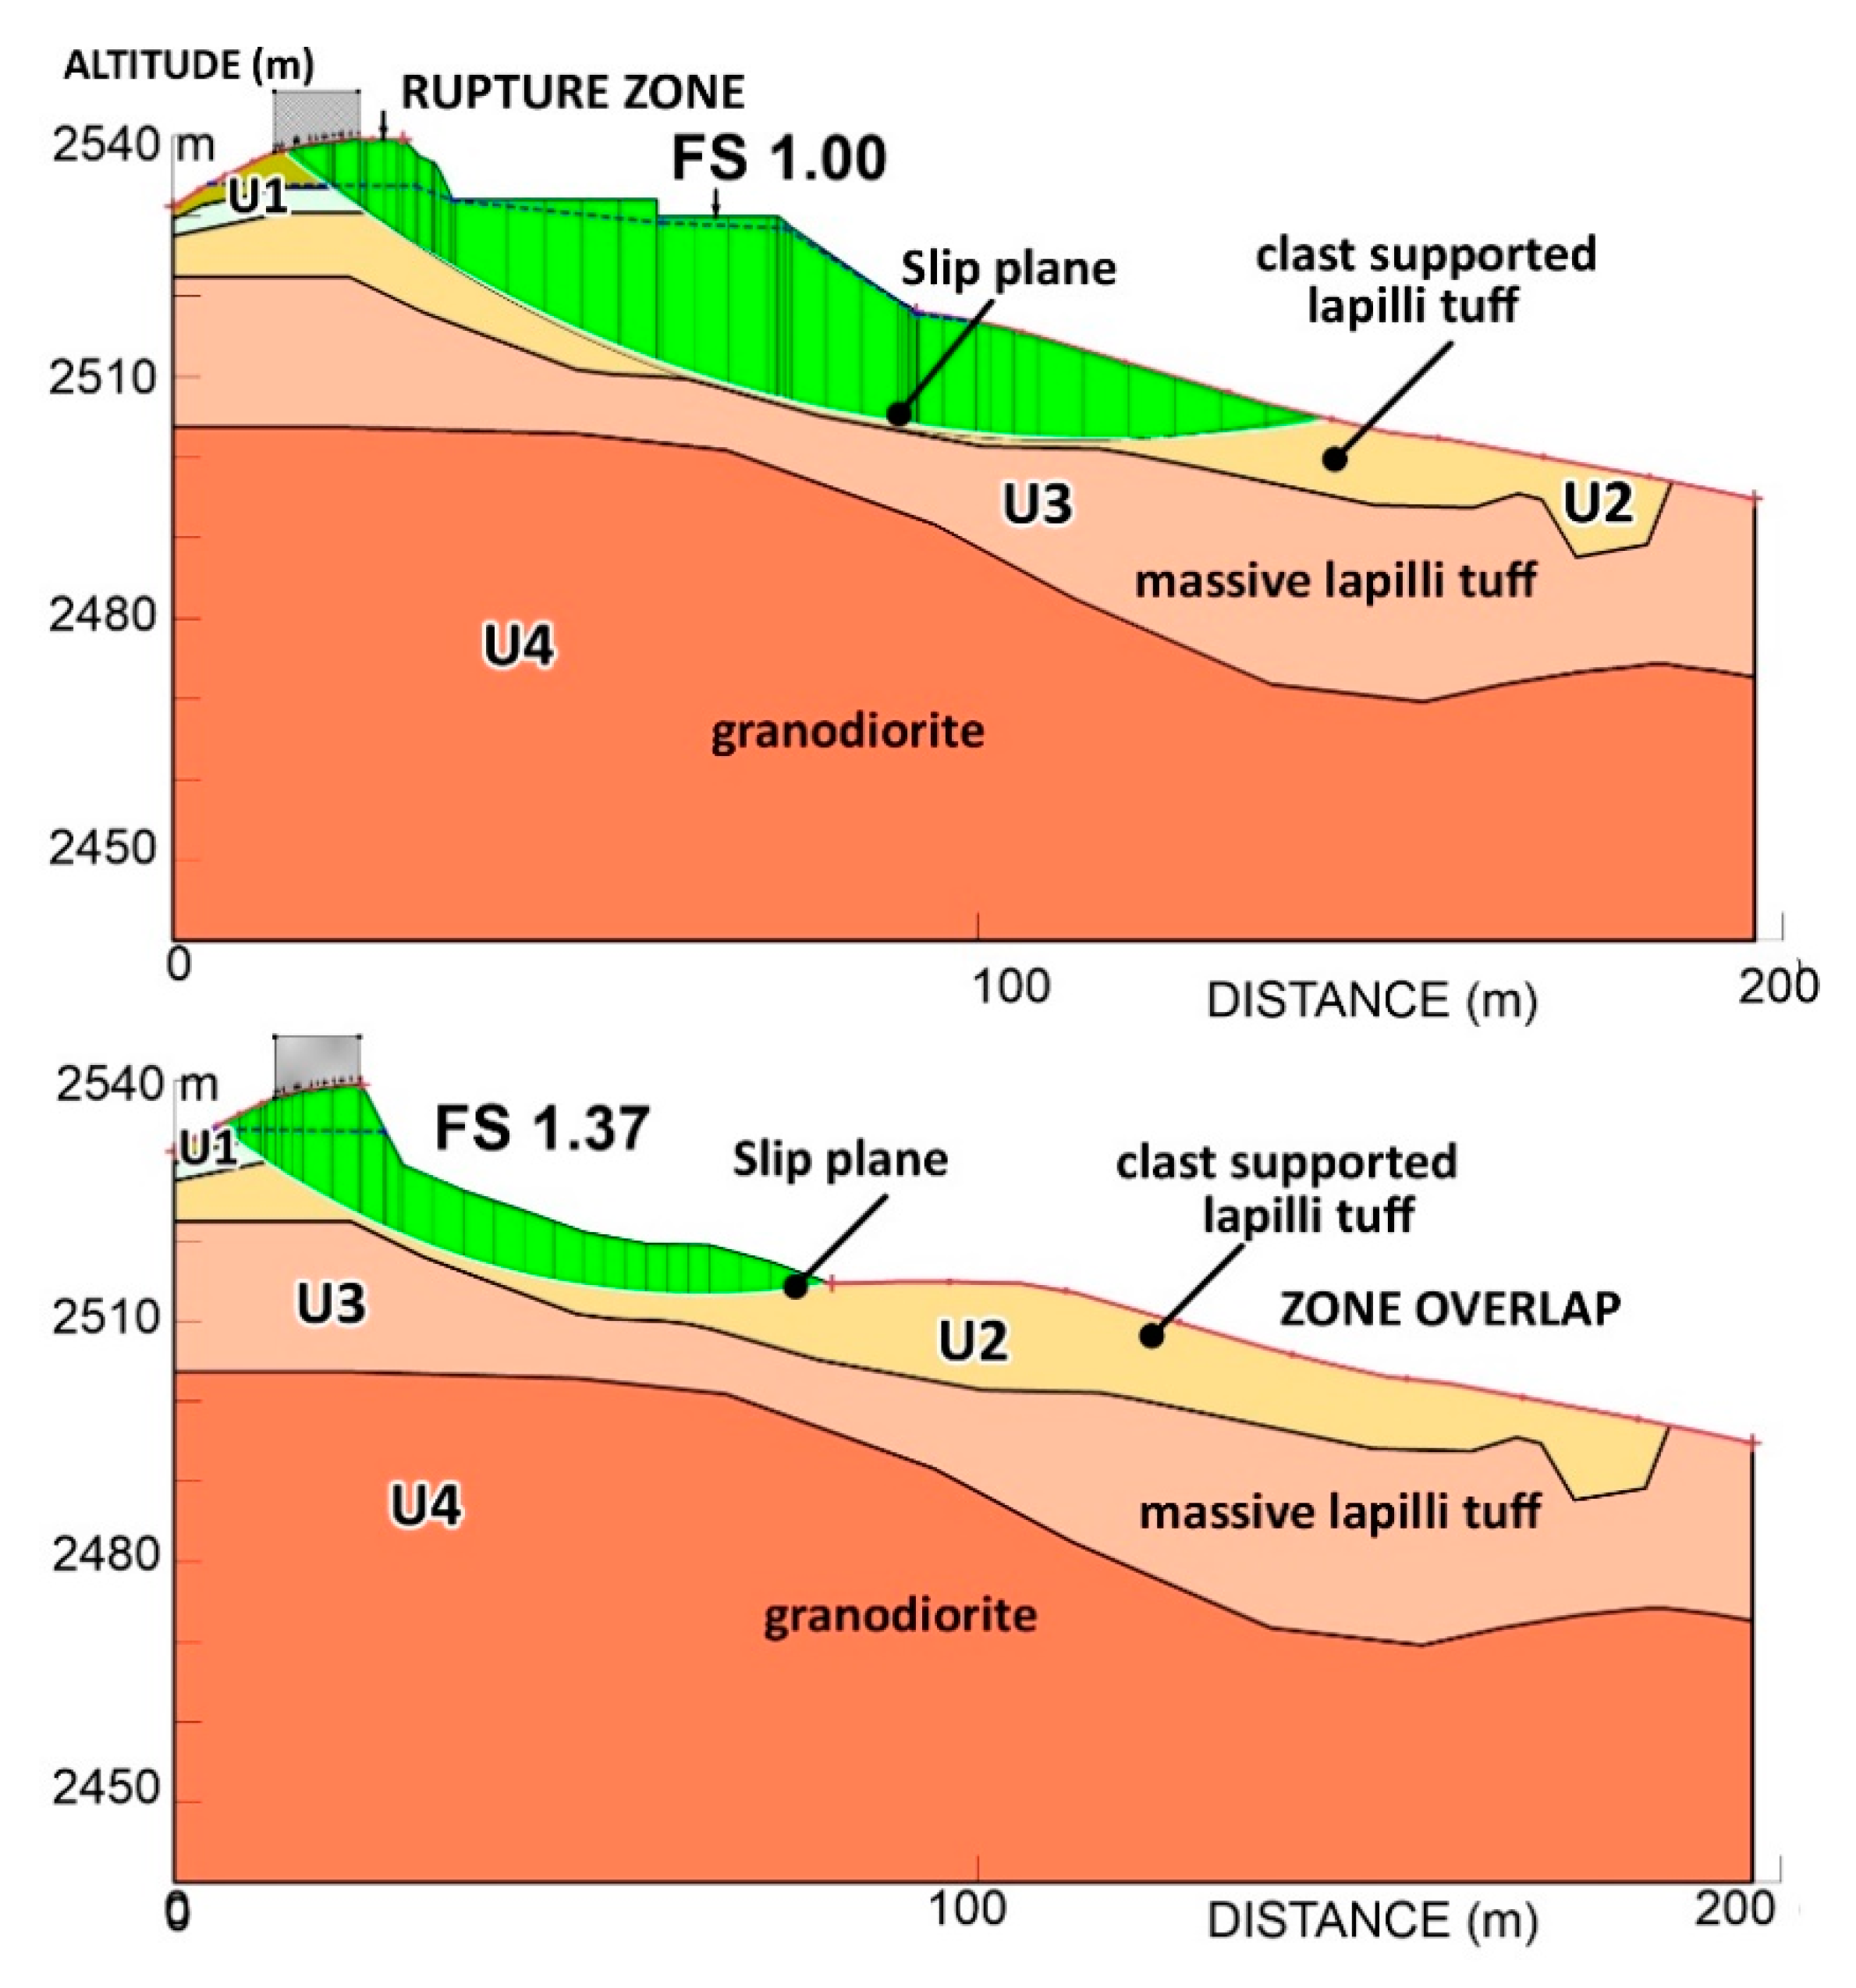
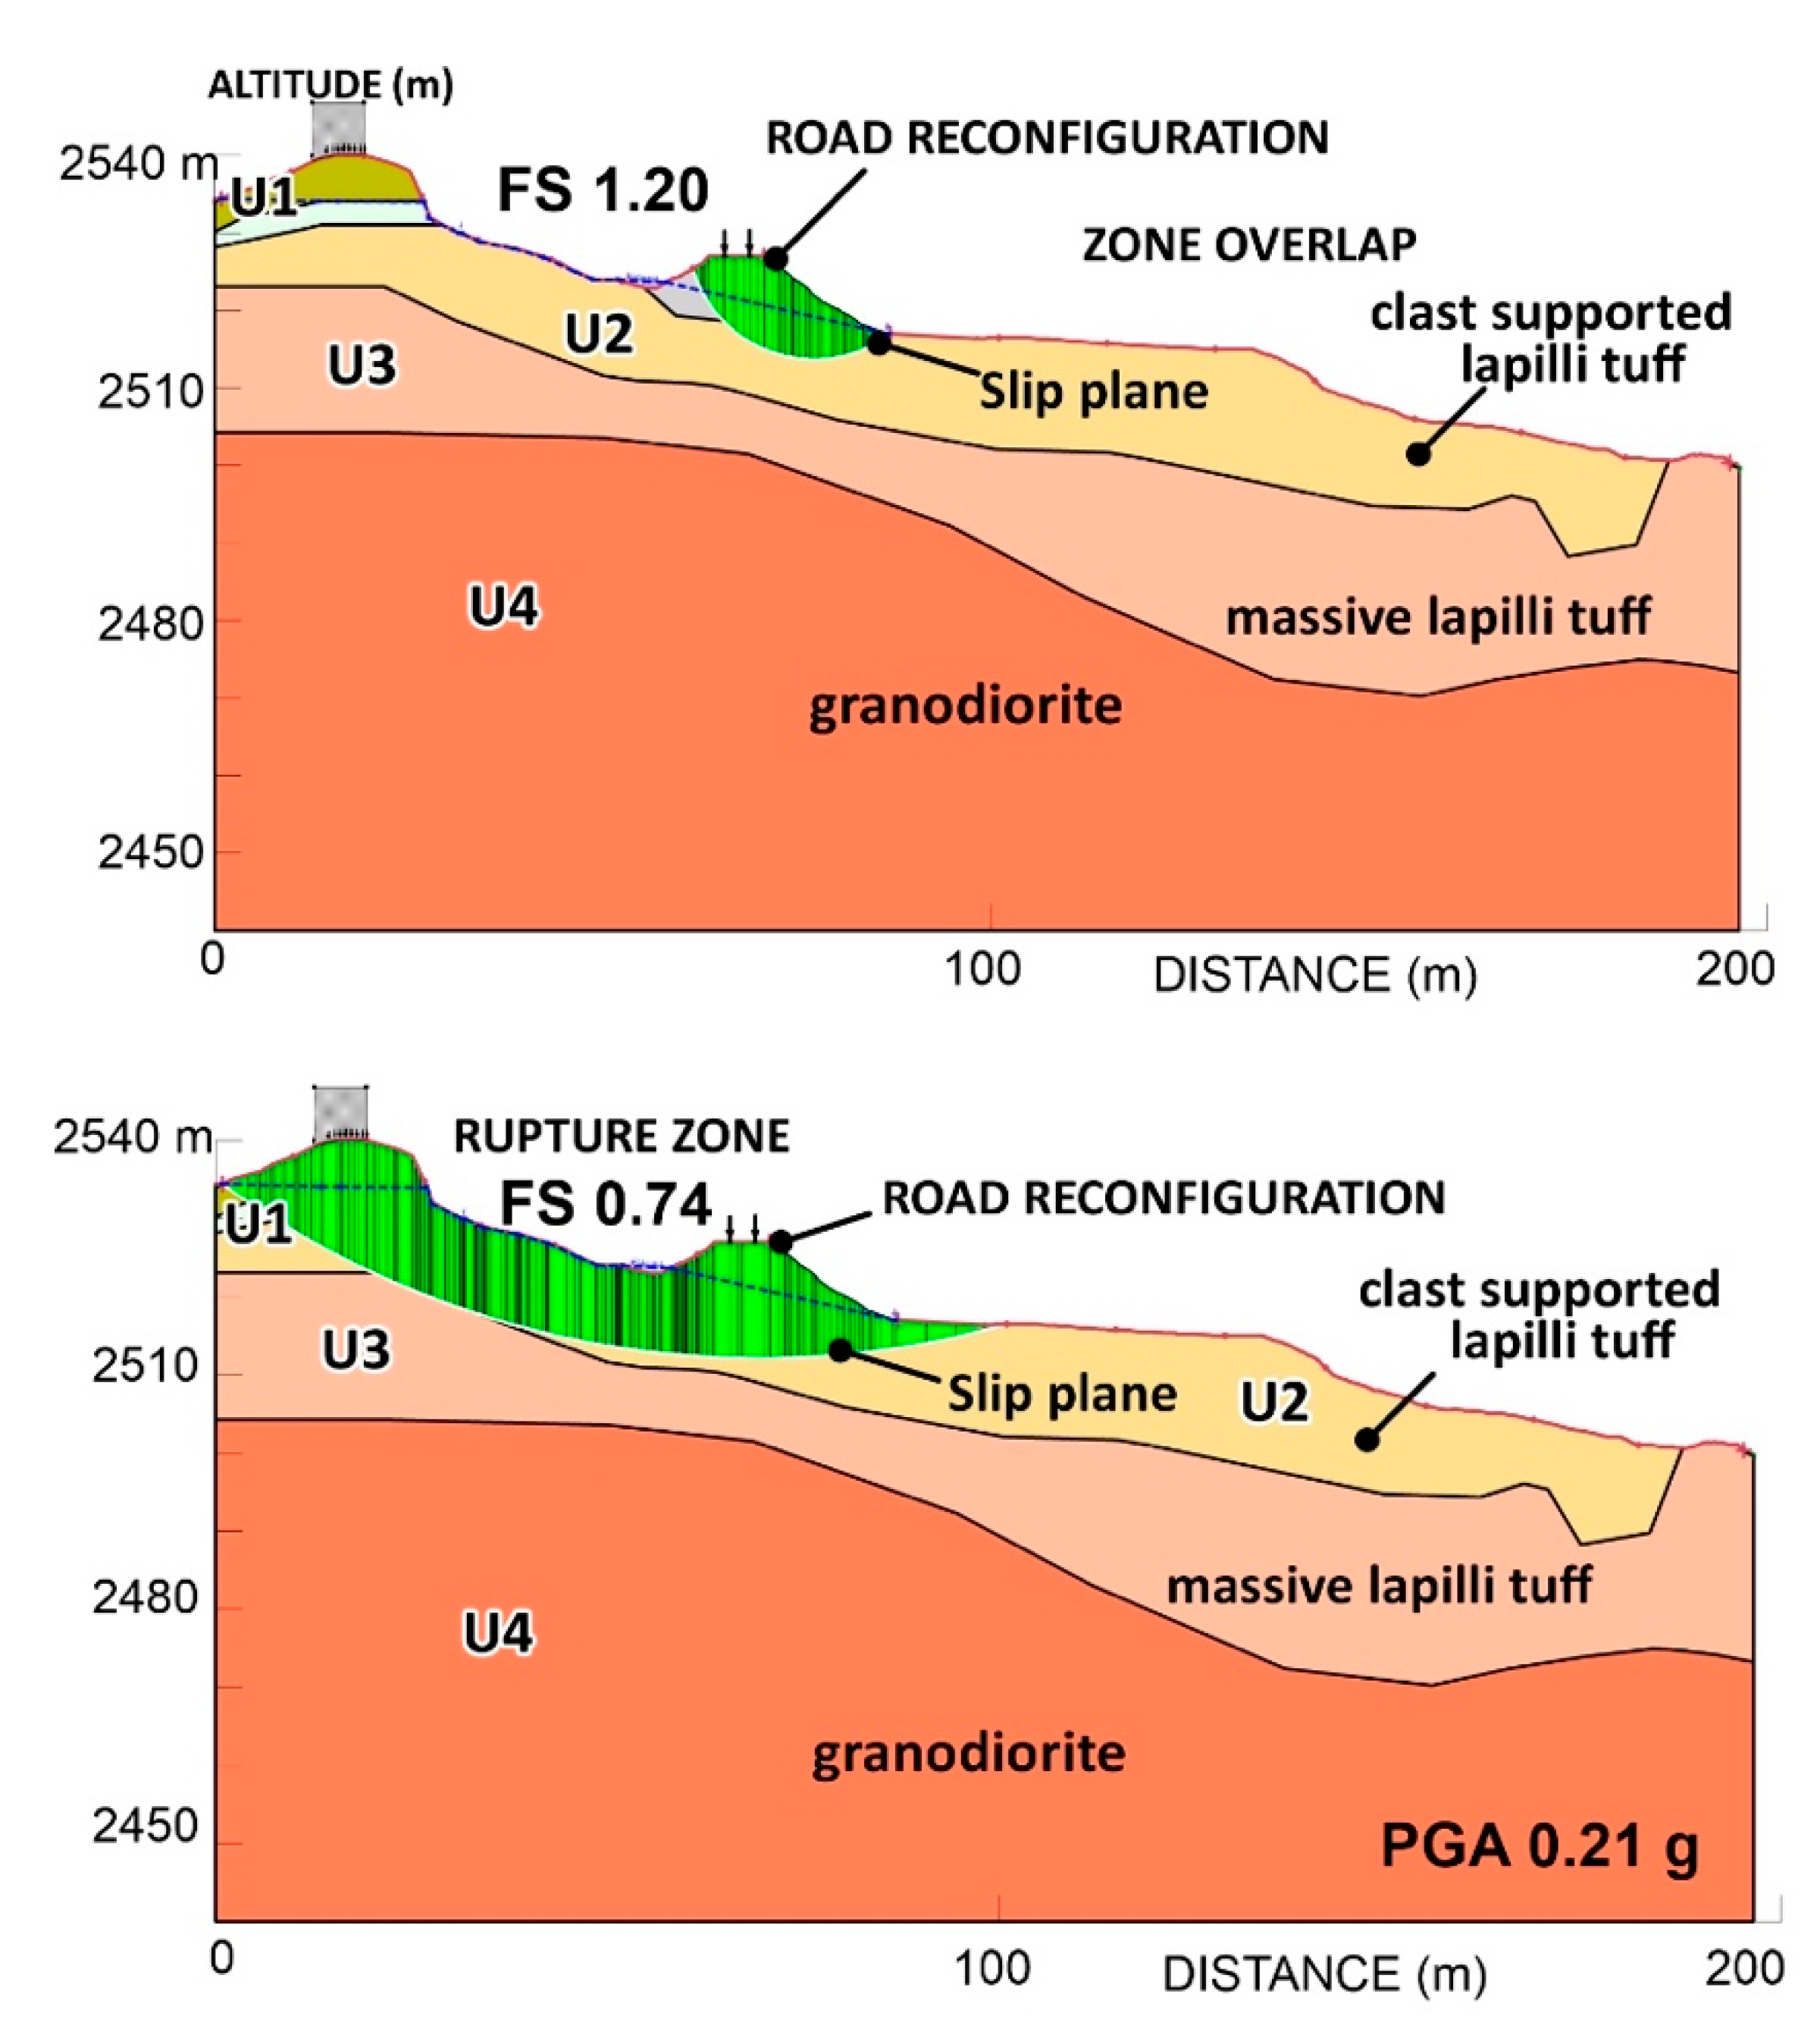
5.4. Slope Stability Analysis

With the current topography of the terrain, the graphic projection of the failure surface that is displayed on the site, the internal arrangement of the strata obtained by geophysical prospecting, the resulting geotechnical parameters in the laboratory, and considerations of the loads that act on the site are assessed. Through retro-analysis, the configuration is executed so that the system reaches a state of equilibrium with a safety factor equal to 1, which then allows a stability analysis of the post-landslide situation to be performed.
Figure 8 illustrates the topographic changes between the initial and final condition of the slid mass, where, although in the post-slide analysis, a safety factor of 1.37 is obtained under normal conditions, it does not indicate the stability of the slope. This occurs as it does not yet comply with the parameters established in the NEC-15, and onsite, the vulnerable situation of the homes located at the crown of the slope is evident, which progressively demonstrates cracking in their structure.
The local authorities conducted an emergency rehabilitation of the road with material of different granulometry and composition. This includes rounded and angular pebbles that exceed 25 cm in diameter. This is crushed quarry material and cohesive volcano-sedimentary material similar to that encountered on the site, arranged in layers without any type of reinforcing or waterproof material such as geosynthetics that would provide resistance to the new road slope. This intervention has not reshaped the slope to the level of the houses in the crown, so the deterioration of their foundations and instability problems continue.
To achieve a stability design that meets the conditions of safety factors according to NEC-15, the stability of the current configuration was analyzed, so the photogrammetric survey was performed to obtain the topographic profile with the morphology of the area. Together with the geomechanical parameters obtained in the retro-analysis, a new evaluation was realized.
As illustrated in Figure 9, the safety factors resulting from the analyzes with the new road slope do not comply with the minimum indices indicated by the NEC-15, since for the static case, a value of 1.20 is obtained, which is even lower than the one obtained just after the slide. This indicates that the load of the material with which the reconstitution of the track was performed and the movement of earth near the exposed face affect the shear resistance of the ground. For the pseudo-static case, a safety factor of 0.74 was obtained, which is well below what the standard indicates, and in the event of a seismic movement, the mass of the slope is prone to collapse.

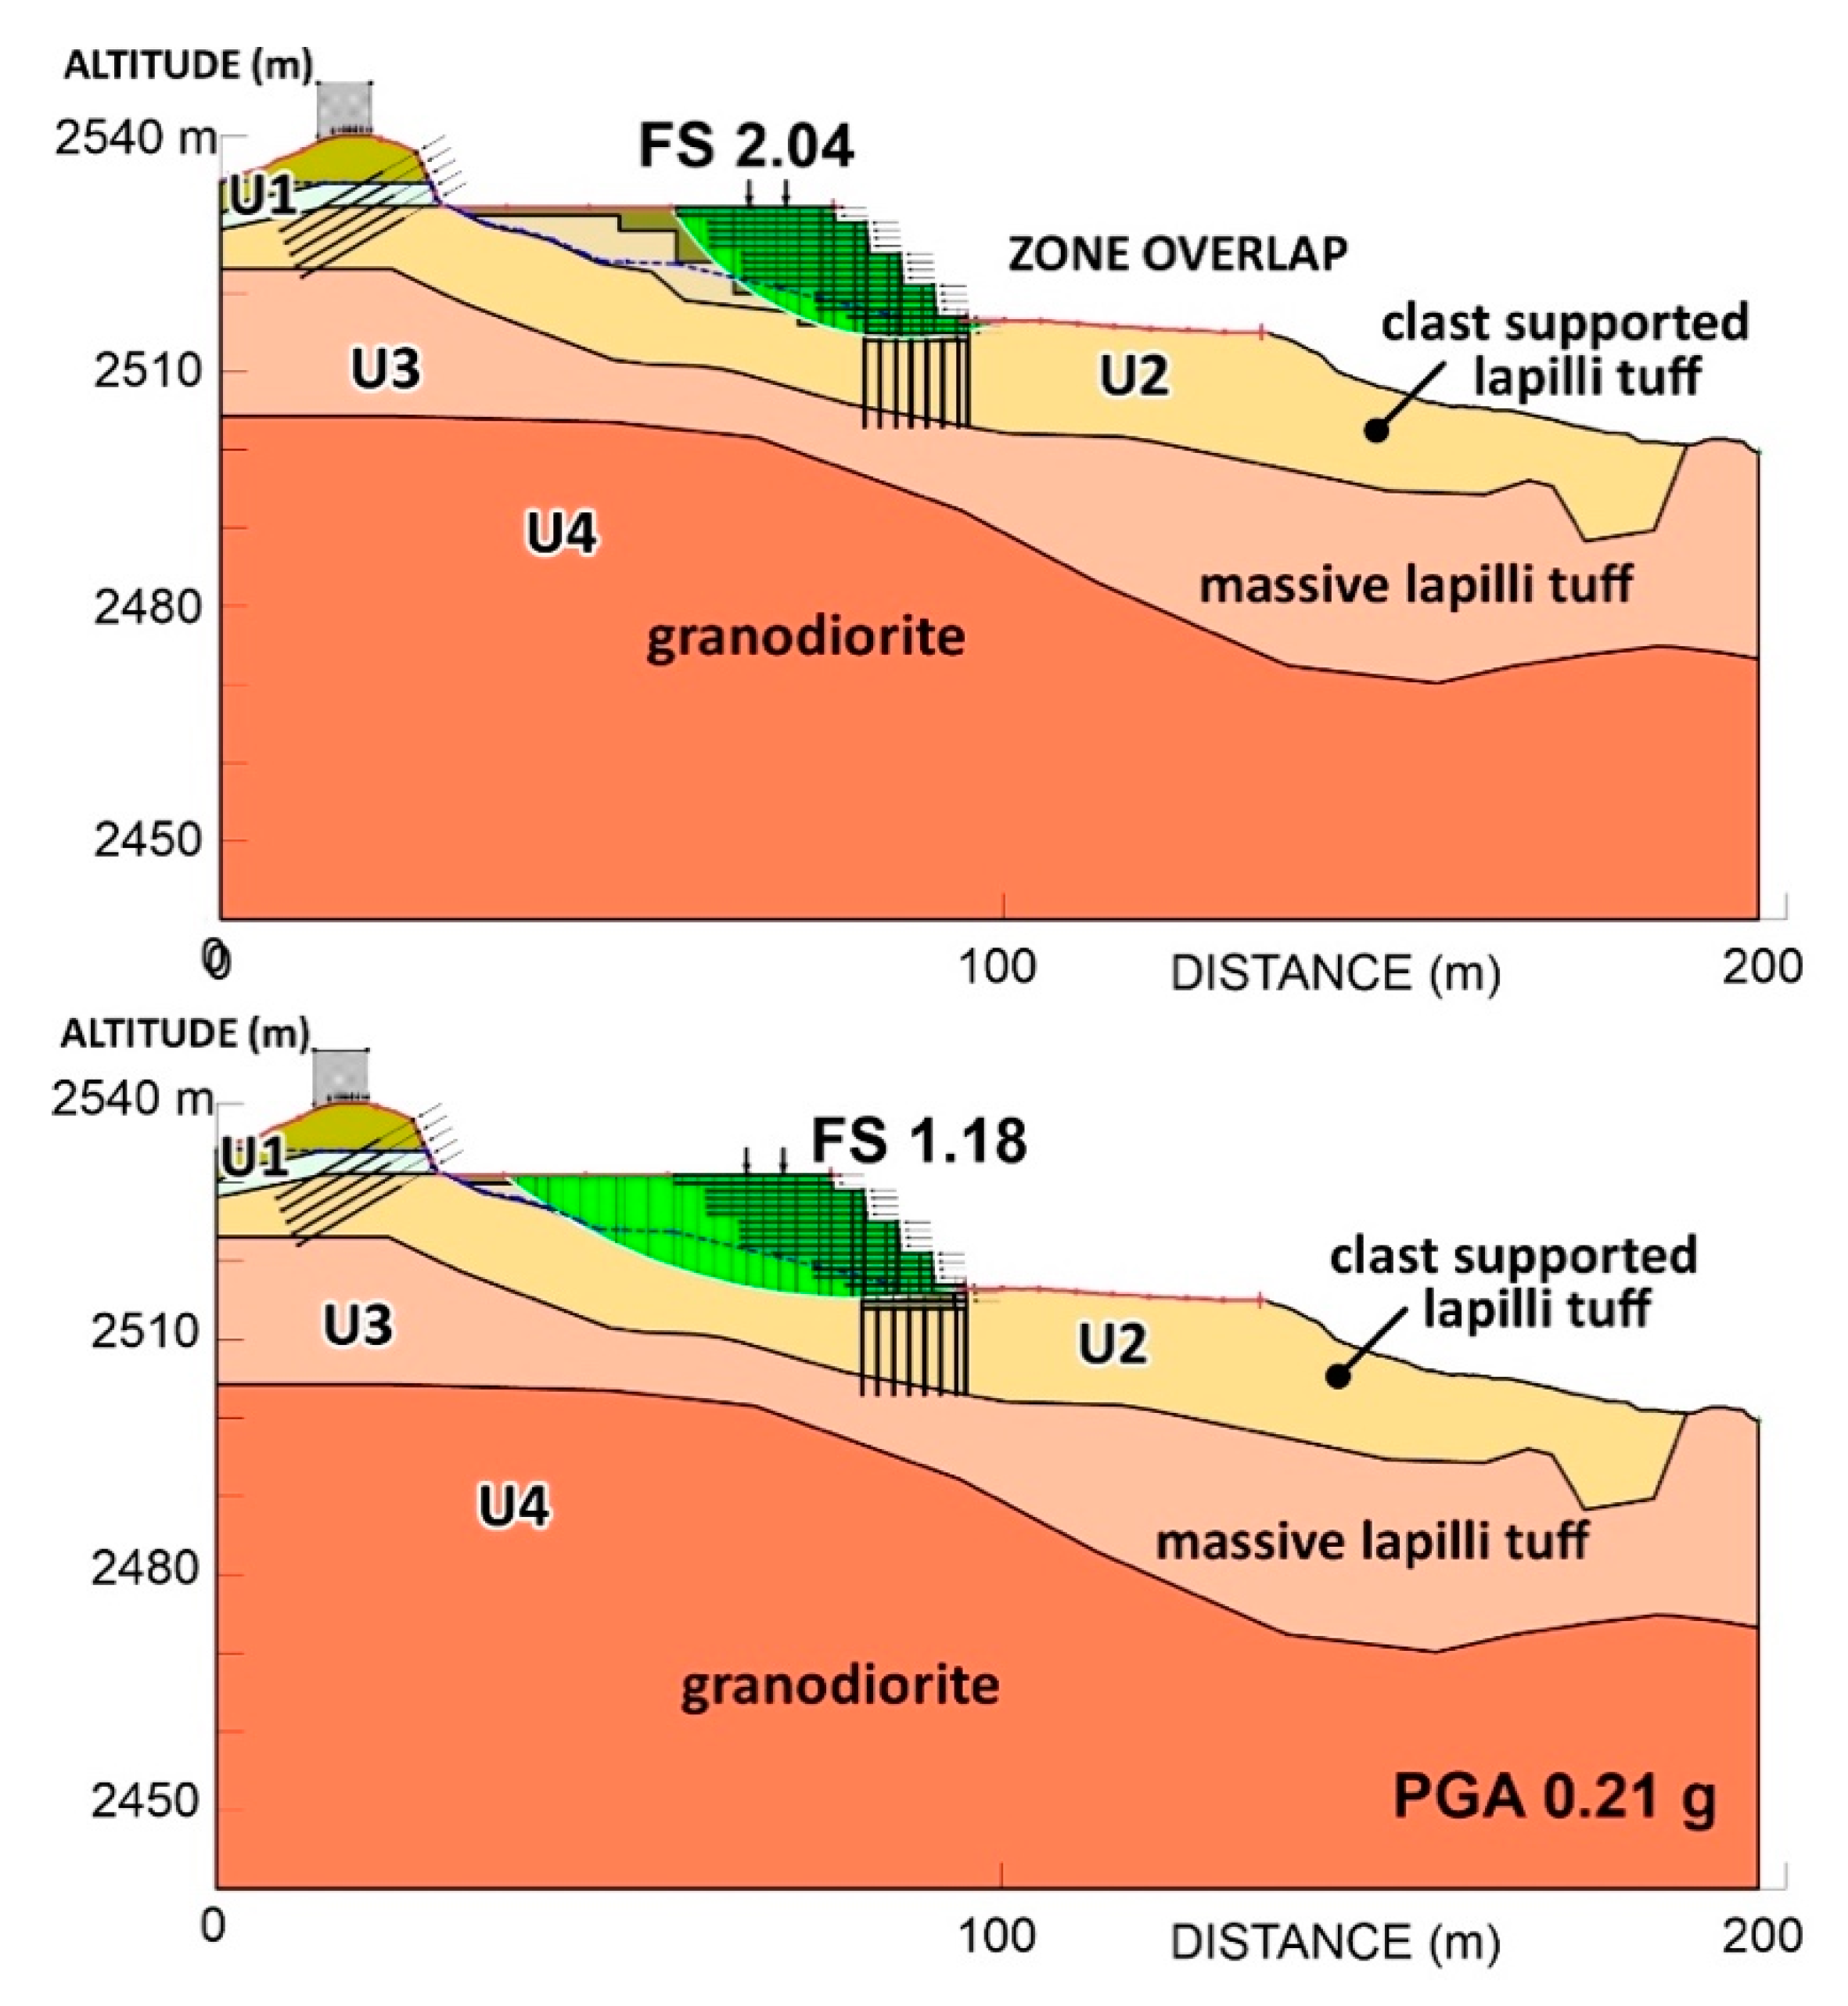
5.5. Remedial Measures for Landslide Prevention

Considering that once the slope is reshaped, it must have the necessary drainage conditions so that precipitation and infiltration water is evacuated effectively and does not cause a saturation of the system. While additionally counting on the existence of an adequate sewage system, a slope can be modeled where the water table does not affect the soil layers. To model the new slope, it was decided to reconstitute the body of the slope using a system of reinforced or mechanically stabilized earth using one of Maccaferri’s methods such as Terramesh. The Terramesh consists of a pre-assembled double twist metal mesh (type 8 × 10) with geogrid reinforcement that has a tensile capacity of 301 kN/m (see Figure 10). In addition, a gabion wall facade will be installed, making the whole a modular system. The slipped mass is composed of fine materials of high plasticity, which, with appropriate treatment such as chemical stabilization by adding cementing compounds such as lime, can be used for this construction system as it increases its performance. Material from surrounding areas and any material found up to the resistant stratum in the landslide zone that can be excavated and used according to its geotechnical properties may also be used. Due to the high compressibility characteristics of the material existing at the foot of the slope, the design includes a system of micropiles being 11 m long, arranged with a separation of 2 m between them, reaching herein the most resistant stratum to transmit the loads.
For the upper area where there are homes in vulnerable situations, it was proposed to reshape the slope up to the crown. However, because the self-weight of the reinforced earth system provided a destabilizing load, a series of passive anchors were designed in the current crown with its respective shotcrete wall. Therefore, the anchors were 20 m long, with an inclination of 30° to the horizontal and arranged with a separation of 1.50 m. Additionally, a series of designs with reinforced earth were developed in order to find the most stable solution to be implemented, verifying that the results in static and pseudo-static conditions comply with the safety factors indicated by the NEC-15 standard [58].

6. Conclusions

The Tamban landslide is planar and its deformation is due to the saturation of weathered material, being medium-to-fine-bedded massive lapilli tuff layers, with resistivity values in the order of 900 to 3500 Ω.m. This saturated lithological unit, due to density, moved along a discontinuity plane of an ancient geological fault, with direction 235/72. The anthropogenic causes are specific and associated with pipe breaks that saturated material up to 15 m deep. However, the main trigger for the complete saturation of the lithological material is associated with the eleven days of moderate rainfall that triggered the landslide on 21 December 2021.
In reference to the effects of damage to the terrain during the landslide, which occurred on 21 December 2021, at the Tamban site, there are three well-differentiated deformation zones: (i) the rupture zone or detachment zone from the main scarp that has a slope height of 26 m, (ii) the area of secondary scarps or inclined blocks, which have listric planes of secondary scarps, which are well differentiated on the surface and reach 10 m in thickness, and (iii) the accumulation zone that has displaced material traveling a horizontal distance of 330 m, with a thicknesses of 10 m near the secondary scarps and 2 to 4 m in the final zone of the flow. Electrical tomography tests outline the thickness of the rubble material beneath a layer of lithic lapilli tuffs composition where the thickness is in the order of 15 to 20 m. Deeper in, the most resistant layer is found with seismic velocities of 500 ≤ Vs(m/s) ≤ 1300, which corresponds to denser granodiorite.
For feasibility studies and civil works design for deep foundations, it is recommended to consider the positions of the lithological units, particularly those with greater resistance that are 20 m deep from the current surface of the ground. The safety factors from the stability analyzes reach a safety factor of 2.04 for the static case and 1.18 for the pseudo-static case, where the stress zones occur on the reinforced earth slope with the design safety factor being higher than the stability criteria dictated by the (national) standard.

Supplementary Materials

The DTM used for analysis is the NASA SRTM 3.0 global model, 1 arc second resolution: https://lpdaac.usgs.gov/news/nasa-shuttle-radar-topography-mission-srtm-version-30-srtm-plus-product-release/ (accessed on 30 November 2023). Some of the figures were realized using Qgis and Arcmap® software.

Author Contributions

Conceptualization, I.S. and T.T.; methodology, I.S. and K.C.; software, I.S. and M.Q.-M.; validation, T.T., F.G. and K.C.; formal analysis, K.C., M.Q.-M. and A.P.; investigation, I.S., K.C. and M.B.-T.; resources, I.S. and M.Q.-M.; data curation, K.C. and A.P.; writing—original draft preparation, K.C. and T.T.; writing—review and editing, T.T.; visualization, K.C.; supervision, K.C. and F.G.; project administration, K.C. and F.G.; funding acquisition, K.C. All authors have read and agreed to the published version of the manuscript.

Funding

This research received no external funding.

Data Availability Statement

Data are contained within the article and Supplementary Materials.

Acknowledgments

The present study was supported by the Seismic Geology Research Group of the Technical University of Manabí, with the cooperation of the Municipal GAD of San José de Chimbo and the State University of Bolívar due to the involvement of Paul Sanchez and Roberto Arellano. The geophysical prospecting was performed by the Risk Management Secretariat, which integrated the geological, geophysical and topographic data due to the cooperation of Darwin Yánez, Leonardo Alvarado, and Diana Centeno. This work is dedicated to the geologist Rafael Torres Constante.

Conflicts of Interest

The authors wish to confirm that there are no known conflicts of interests associated with this publication. This research did not receive any specific grant from funding agencies in the public, commercial, or not-for-profit sectors.

References

  1. Panzeri, L.; Mondani, M.; Taddia, G.; Papini, M.; Longoni, L. Analysis of Snowmelt as a Triggering Factor for Shallow Land-slide. Int. Multidiscip. Sci. Geoconf. SGEM 2022, 22, 77–83. [Google Scholar] [CrossRef]
  2. Cui, P.; Chen, X.Q.; Zhu, Y.Y.; Su, F.H.; Wei, F.Q.; Han, Y.S.; Liu, H.-J.; Zhuang, J.Q. The Wenchuan earthquake (May 12, 2008), Sichuan province, China, and resulting geohazards. Nat. Hazards 2011, 56, 19–36. [Google Scholar] [CrossRef]
  3. Béjar-Pizarro, M.; Álvarez Gómez, J.A.; Staller, A.; Luna, M.P.; Pérez-López, R.; Monserrat, O.; Chunga, K.; Lima, A.; Galve, J.P.; Martínez Díaz, J.J.; et al. InSAR-Based Mapping to Support Decision-Making after an Earthquake. Remote Sens. 2018, 10, 899. [Google Scholar] [CrossRef]
  4. Serey, A.; Piñero-Feliciangeli, L.; Sepúlveda, S.A.; Iveda, F.; Poblete, D.; Petley, I.; Murphy, W. Landslides induced by the 2010 Chile megathrust earthquake: A comprehensive inventory and correlations with geological and seismic factors. Landslides 2019, 16, 1153. [Google Scholar] [CrossRef]
  5. Islam, M.A.; Islam, M.S.; Jeet, A.A. A Geotechnical Investigation of 2017 Chattogram Landslides. Geosciences 2021, 11, 337. [Google Scholar] [CrossRef]
  6. Suriñach, E.; Flores-Márquez, E.L. A template to obtain information on gravitational mass movements from the spectrograms of the seismic signals generated. Earth Surf. Dyn. Discuss. 2022, 1–34. [Google Scholar] [CrossRef]
  7. Salcedo, D.; Padilla Almeida, O.; Morales, B.; Toulkeridis, T. Smart City Planning Based on Landslide Susceptibility Mapping Using Fuzzy Logic and Multi-criteria Evaluation Techniques in the City of Quito, Ecuador. In Doctoral Symposium on Information and Communication Technologies-DSICT; Springer International Publishing: Cham, Switzerland, 2022; pp. 89–103. [Google Scholar]
  8. Asadi, A.; Baise, L.G.; Koch, M.; Moaveni, B.; Chatterjee, S.; Aimaiti, Y. Pixel-based classification method for earthquake-induced landslide mapping using remotely sensed imagery, geospatial data and temporal change information. Nat. Hazards 2024, 1–38. [Google Scholar]
  9. Borja Bernal, C.; Laín, R.; Jordá, L.; Cano, M.; Riquelme, A.; Tomás, R. Stability Assessment of Rock Slopes Using the Q-Slope Classification System: A Reliability Analysis Employing Case Studies in Ecuador. Appl. Sci. 2023, 13, 7399. [Google Scholar] [CrossRef]
  10. Jordá-Bordehore, L.; Albán, L.G.; Valenzuela, R.C.; Bravo, G.; Menoscal-Menoscal, M.; Larreta, E.; Garces, D.; Mulas, M. An Analysis of Slope Stability in the Penipe–Baños Road by Applying Empirical Methods, Kinematic Analysis and Remote Photogrammetry Techniques. Geosciences 2023, 13, 366. [Google Scholar] [CrossRef]
  11. Cando Jácome, M.; Martínez-Graña, A. Numerical Modeling of Flow Patterns Applied to Analysis of Susceptibility to Movements of the Ground. Geosciences 2018, 8, 340. [Google Scholar] [CrossRef]
  12. Hungr, O.; Leroueil, S.; Picarelli, L. The Varnes Classification of Landslide Types, an Update. Landslides 2014, 11, 167–194. [Google Scholar] [CrossRef]
  13. Macías, L.; Quiñonez-Macías, M.; Toulkeridis, T.; Pastor, J.L. Characterization and geophysical evaluation of the recent 2023 Alausí landslide in the northern Andes of Ecuador. Landslides 2024, 21, 529–540. [Google Scholar] [CrossRef]
  14. Soto, J.; Galve, J.P.; Palenzuela, J.A.; Azañón, J.M.; Tamay, J.; Irigaray, C. A multi-method approach for the characterization of landslides in an intramontane basin in the Andes (Loja, Ecuador). Landslides 2017, 14, 1929–1947. [Google Scholar] [CrossRef]
  15. Wilcke, W.; Valladarez, H.; Stoyan, R.; Yasin, S.; Valarezo, C.; Zech, W. Soil properties on a chronosequence of landslides in montane rain forest, Ecuador. Catena 2003, 53, 79–95. [Google Scholar] [CrossRef]
  16. Bravo-López, E.; Fernández Del Castillo, T.; Sellers, C.; Delgado-García, J. Landslide Susceptibility Mapping of Landslides with Artificial Neural Networks: Multi-Approach Analysis of Backpropagation Algorithm Applying the Neuralnet Package in Cuenca, Ecuador. Remote Sens. 2022, 14, 3495. [Google Scholar] [CrossRef]
  17. POWER Data Access Viewer. Available online: https://power.larc.nasa.gov/data-access-viewer/ (accessed on 15 June 2023).
  18. Juang, C.H.; Jhi, Y.Y.; Lee, D.H. Stability analysis of existing slopes considering uncertainty. Eng. Geol. 1998, 49, 111–122. [Google Scholar] [CrossRef]
  19. Medinaceli Tórres, R.; Medinaceli Ortiz, R. Aplicación de la simulación de Montecarlo a la evaluación probabilistica de la estabilidad de taludes en roca. Rev. Medio Ambiente Min. Minería 2021, 6, 33–48. Available online: http://www.scielo.org.bo/scielo.php?script=sci_arttext&pid=S2519-53522021000100004&lang=es (accessed on 2 October 2023).
  20. Mora, R.; Granados, R. Análisis de estabilidad de taludes considerando la incertidumbre de los datos: Caso comunidad de Mansiones de Montes de Oca, San José, Costa Rica. Rev. Geológica América Cent. 2012, 47, 133–141. [Google Scholar] [CrossRef]
  21. Mora, R.; Rojas, E. The Effect of Saturation on the Slope Sliding in the San Juan de Grijalva Community, Chiapas. Ing. Investig. Tecnol. 2012, 13, 55–68. [Google Scholar]
  22. Morgenstern, N.R. Evaluation of slope stability—A 25 year perspective: Morgenstern, N R Proc Conference Stability and Performance of Slopes and Embankments II, Berkeley, 29 June–1 July 1992V1, P1–26. Publ New York: ASCE, 1992 (ASCE Special Geotechnical Publication No 31). Int. J. Rock Mech. Min. Sci. Geomech. 1993, 30, A195. [Google Scholar] [CrossRef]
  23. Sanhueza, C.; Rodríguez, L. Análisis comparativo de métodos de cálculo de estabilidad de taludes finitos aplicados a laderas naturales. Rev. Constr. 2013, 12, 17–29. [Google Scholar] [CrossRef]
  24. Carrara, A.; Guzzetti, F.; Cardinali, M.; Reichenbach, P. Use of GIS technology in the prediction and monitoring of landslide hazard. Nat. Hazards 1999, 20, 117–135. [Google Scholar] [CrossRef]
  25. Godio, A.; Strobbia, C.; De Bacco, G. Geophysical characterization of a rockslide in an alpine region. Eng. Geol. 2006, 83, 273–286. [Google Scholar] [CrossRef]
  26. NEC-11. Norma Ecuatoriana de la Construcción. Registro Oficial No. 413 del 10 de Enero, 2015. Available online: http://www.normaconstruccion.ec/ (accessed on 11 December 2022).
  27. INEC Base de Datos—Censo de Población y Vivienda del Ecuador, 2010. Available online: http://www.ecuadorencifras.gob.ec/base-de-datos-censo-de-poblacion-y-vivienda/ (accessed on 15 January 2024).
  28. Echeverría-Puertas, J.; Echeverría, M.; Cargua, F.; Toulkeridis, T. Spatial Dynamics of the Shore Coverage within the Zone of Influence of the Chambo River, Central Ecuador. Land 2023, 12, 180. [Google Scholar] [CrossRef]
  29. Gad Chimbo. Plan de Desarrollo y Ordenamiento Territorial del cantón Chimbo, Provincia de Bolívar. Secretaría Nacional de Planificación y Desarrollo, 2019. Available online: https://app.sni.gob.ec/ (accessed on 22 June 2023).
  30. SGR. Secretaría de Gestión de Riesgos de Ecuador: Base de Datos de Susceptibilidad por Movimientos en Masa, 2022. Available online: https://informacion.gestionderiesgos.gob.ec:8443/centrodedescarga/contenidos/contenidoMovimientosMasa.php (accessed on 11 October 2023).
  31. Avilés-Campoverde, D.; Chunga, K.; Ortiz-Hernández, E.; Vivas-Espinoza, E.; Toulkeridis, T.; Morales-Delgado, A.; Delgado-Toala, D. Seismically induced soil liquefaction and geological conditions in the city of Jama due to the M7. 8 Pedernales Earthquake in 2016, NW Ecuador. Geosciences 2020, 11, 20. [Google Scholar] [CrossRef]
  32. Chunga, K.; Livio, F.; Mulas, M.; Ochoa-Cornejo, F.; Besenzon, D.; Ferrario, M.F.; Michetti, A.M. Earthquake Ground Effects and Intensity of the 16 April 2016 Mw 7.8 Pedernales, Ecuador, Earthquake: Implications for the Source Characterization of Large Subduction EarthquakesEarthquake Ground Effects and Intensity of the 16 April 2016 Pedernales, Ecuador, Earthquake. Bull. Seismol. Soc. Am. 2018, 108, 3384–3397. [Google Scholar]
  33. Chunga, K.; Ochoa-Cornejo, F.; Mulas, M.; Toulkeridis, T.; Menéndez, E. Characterization of seismogenic crustal faults in the Gulf of Guayaquil, Ecuador. Andean Geol. 2019, 46, 66–81. [Google Scholar] [CrossRef]
  34. Chunga, K.; Livio, F.A.; Martillo, C.; Lara-Saavedra, H.; Ferrario, M.F.; Zevallos, I.; Michetti, A.M. Landslides Triggered by the 2016 Mw 7.8 Pedernales, Ecuador Earthquake: Correlations with ESI-07 Intensity, Lithology, Slope and PGA-h. Geosciences 2019, 9, 371. [Google Scholar] [CrossRef]
  35. Aguirre, L.; Atherton, M.P. Low-grade metamorphism and geotectonic setting of the Macuchi Formation, Western Cordillera of Ecuador. J. Metamorph. Geol. 1987, 5, 473–494. [Google Scholar] [CrossRef]
  36. Henderson, W.G. The volcanic Macuchi Formation, Andes of Northern Ecuador. Newsl. Stratigr. 1981, 9, 157–168. [Google Scholar] [CrossRef]
  37. Baldock, J.W. Mapa Geológico Nacional de la República del Ecuador; Dirección General de Geología y Minas: Instituto Geográfico Militar: Quito, Ecuador, 1982. [Google Scholar]
  38. IIGE. Mapa Geológico de Guaranda 1: 100.000; Dirección General de Geología y Minas, Ministerio de Energia y Minas: Instituto Geográfico Militar: Quito, Ecuador, 1977. [Google Scholar]
  39. IIGE. Mapa Geológico de San Miguel 1: 100.000; Dirección General de Geología y Minas, Ministerio de Energia y Minas: Instituto Geográfico Militar: Quito, Ecuador, 1976. [Google Scholar]
  40. Tibaldi, A.; Ferrari, L.; Pasquarè, G. Landslides triggered by earthquakes and their relations with faults and mountain slope geometry: An example from Ecuador. Geomorphology 1995, 11, 215–226. [Google Scholar] [CrossRef]
  41. Pourrut, P. Los Climas del Ecuador: Fundamentos Explicativos. In Los Climas del Ecuador; CEDIG: Quito, Ecuador; Institut de Recherche pour le Développement: Marseille, France, 1983; pp. 7–41. [Google Scholar]
  42. Pourrut, P.; Róvere, O.; Romo, I.; Villacrés, H. Clima del Ecuador. In El Agua en el Ecuador: Clima, Precipitaciones, Escorrentía; Institut de Recherche pour le Développement: Marseille, France, 1995; pp. 13–26. [Google Scholar]
  43. Kottek, M.; Grieser, J.; Beck, C.; Rudolf, B.; Rubel, F. World map of the Köppen-Geiger climate classification updated. Meteorol. Z. 2006, 15, 259–263. [Google Scholar] [CrossRef] [PubMed]
  44. Varnes, D.J. Slope movement types and processes. In Landslides—Analysis and Control, 1st ed.; Special Report, 176, Schuster, R.L., Krizek, R.J., Eds.; National Research Council, Transportation Research Board: Washington, DC, USA, 1978; pp. 11–33. [Google Scholar]
  45. Huayllazo, Y.; Infa, R.; Soto, J.; Lazarte, K.; Huanca, J.; Alvarez, Y.; Teixidó, T. Using Electrical Resistivity Tomography Method to Determine the Inner 3D Geometry and the Main Runoff Directions of the Large Active Landslide of Pie de Cuesta in the Vítor Valley (Peru). Geosciences 2023, 13, 342. [Google Scholar] [CrossRef]
  46. Pazzi, V.; Morelli, S.; Fanti, R.A. Review of the Advantages and Limitations of Geophysical Investigations in Landslide Studies. Int. J. Geophys. 2019, 2019, 2983087. [Google Scholar] [CrossRef]
  47. Perrone, A.; Lapena, V.; Piscitelli, S. Electrical resistivity tomography technique for landslide investigation: A review. Earth-Sci. Rev. 2014, 135, 65–82. [Google Scholar] [CrossRef]
  48. Lesmes, D.; Friedman, S. Relationships between the Electrical and Hydrogeological Properties of Rocks and Soils. In Hydrogeo Physics; Springer: Berlin/Heidelberg, Germany, 2005. [Google Scholar]
  49. McCann, D.M.; Forster, A. Reconnaissance geophysical methods in landslide investigations. Eng. Geol. 1990, 29, 59–78. [Google Scholar] [CrossRef]
  50. Bruno, F.; Marillier, F. Test of high-resolution seismic reflection and other geophysical techniques on the Boup landslide in the Swiss Alps. Surv. Geophys. 2000, 21, 333–348. [Google Scholar] [CrossRef]
  51. Bichler, A.; Bobrowsky, P.; Best, M.; Douma, M.; Hunter, J.; Calvert, T.; Burns, R. Three-dimensional mapping of a landslide using a multi-geophysical approach: The Quesnel Forks landslide. Landslides 2004, 1, 29–40. [Google Scholar] [CrossRef]
  52. Chambers, J.E.; Gunn, D.A.; Wilkinson, P.B.; Meldrum, P.I.; Haslam, E.; Holyoake, S.; Wragg, J. 4D electrical resistivity tomography monitoring of soil moisture dynamics in an operational railway embankment. Near Surf. Geophys. 2014, 12, 61–72. [Google Scholar] [CrossRef]
  53. Orejuela, I.P.; Toulkeridis, T. Evaluation of the susceptibility to landslides through diffuse logic and analytical hierarchy process (AHP) between Macas and Riobamba in Central Ecuador. In Proceedings of the 2020 Seventh International Conference on eDemocracy & eGovernment (ICEDEG), Buenos Aires, Argentina, 22–24 April 2020. [Google Scholar] [CrossRef]
  54. Pasierb, B.; Grodecki, M.; Gwó´zd´z, R. Geophysical and Geotechnical Approach to a Landslide Stability Assessment: A Case Study. Acta Geophys. 2019, 67, 1823–1834. [Google Scholar] [CrossRef]
  55. Vásconez, F. Análisis de la Peligrosidad de Grandes Deslizamientos en la República del Ecuador Con el Caso-Ejemplo Guarumales; Johannes Gutenberg University of Mainz: Mainz, Germany, 2000. [Google Scholar]
  56. GeoStudio, Tutorial Manual. GEO-SLOPE International Ltd., 2004. Available online: www.geo-slope.com (accessed on 28 October 2023).
  57. Córdova, J.; Choez, D. Estudio y Diseño para Estabilizar los Deslizamientos en el Barrio Tambán, Cantón Chimbo. Escuela Superior Politécnica del Litoral. Thesis of engineer degree, 2021; pp. 1–266. Available online: https://www.dspace.espol.edu.ec/handle/123456789/52186 (accessed on 30 March 2023).
  58. NEC-15. Norma Ecuatoriana de la Construcción. Registro Oficial No. 413 del 10 de Enero, 2015. Available online: https://www.habitatyvivienda.gob.ec/documentos-normativos-nec-norma-ecuatoriana-de-la-construccion/ (accessed on 11 December 2022).
Figure 1. Seismotectonic location maps of the Bolívar province and San José de Chimbo canton.
Geosciences 14 00104 g001
Figure 3. Location maps of the landslide on 21 December 2021, at the Tamban site, Bolívar province, northern Andes of Ecuador. The black dots represent the locations of historical landslides as documented by the Secretary of Risk Management (SGR) [30].
Geosciences 14 00104 g003
Figure 4. Evidence from the Tamban slide on 21 December 2021. (A) Zone of rupture and displacement through a plane of an inactive geological fault, with structural measurement of 235/72. (B) Final area of debris accumulation with a distance of 335 m from the main slope scarp. (C) Technical personnel from the GAD of Sam José de Chimbo, SGR, and the State University of Bolívar, placing the electrodes in a vertical position for the geophysical prospecting of electrical tomography. (D) Acquisition of resistivity data in the P2—Wenner profile.
Geosciences 14 00104 g004
Figure 5. Landslide of Tamban on 21 December 2021 (23:30 local time). (A) Deformation dynamics of the landslide affecting the Pan-American Highway. (B) Road reconfiguration and risk of damming by runoff water. (C) Panoramic view of the main landslide scarp 18 months later. (D) Tamban area and formation of the main escarpment affecting the access road in the Tamban site. (E) Tamban Church collapsed.
Geosciences 14 00104 g005
Figure 6. Electrical tomography profiles delineating lithological units in the area of the 21 December 2021 landslide at the Tamban site (see location in Figure 3).
Geosciences 14 00104 g006
Figure 7. Geological profile based on the electrical tomography survey and shear conphas velocities (Vs30), delineating the lithological units in the rock substrate.
Geosciences 14 00104 g007
Figure 8. Stability analysis diagram of the landslide on 21 December 2021. Above: situation at the time of the collapse (back analysis). Below: ground surface after collapse.
Geosciences 14 00104 g008
Figure 9. Emergent reconstitution stability analysis diagram. Above: static condition. Below: pseudo-static condition.
Geosciences 14 00104 g009
Figure 10. Stability analysis diagram of reconstitution with reinforced earth system. Above: static condition. Below: pseudo-static condition.
Geosciences 14 00104 g010
Table 1. Monthly precipitation values recorded in San José de Chimbo between 2020 and 2023 for the station “Tamban” (at latitude −1.6772, longitude −79.033; NASA 2023) [17].
Year202020212022Average
(2020–2022)
2023
December136.83175.1295.41135.79 814.69
January114.26315.39106.5178.72139.72
February107.25156.91126.24130.13114.59
March77.87180.7250.6169.72219.86
April187.93186.7165.6179.85259.90
Sum624.141014.13744.35794.211548.76
Values in millimeters.
Table 2. Technical parameters of the lithological units from unconsolidated undrained triaxial trials.
LayerDescriptionγ
(kN/m3)
Vs
(m/s)
Post LandslideCollapse
(Retro-Analysis)
c
(kPa)
ϕ
(°)
c
(kPa)
ϕ
(°)
U1Volcanic lahar, high-plasticity silts14.19291–26789.2712.918.150.13
U2Clast-supported lapilli tuff 17.11268–36085.3518.2633.687.42
U3Fine-bedded massive lapilli tuff16.9366–55034193419
U4Granodiorite20>560120031120031
Disclaimer/Publisher’s Note: The statements, opinions and data contained in all publications are solely those of the individual author(s) and contributor(s) and not of MDPI and/or the editor(s). MDPI and/or the editor(s) disclaim responsibility for any injury to people or property resulting from any ideas, methods, instructions or products referred to in the content.

