Article

Absolute Dating of Fault-Gouge Material Using Isothermal Thermoluminescence: An Example from the Nojima Fault Zone, SW Japan

1
Department of Geophysics, Division of Earth and Planetary Sciences, Graduate School of Science, Kyoto University, Kyoto 606-8502, Japan
2
Laboratory of Luminescence Dating, Institute of Nanoscience and Nanotechnology, National Centre for Scientific Research, NCSR Demokritos, Aghia Paraskevi, 153 10 Athens, Greece
*
Author to whom correspondence should be addressed.
Geosciences 2024, 14(4), 99; https://doi.org/10.3390/geosciences14040099
Submission received: 4 February 2024 / Revised: 20 March 2024 / Accepted: 1 April 2024 / Published: 4 April 2024
(This article belongs to the Special Issue Geochronology and Chemostratigraphy of Quaternary Environment)

Abstract

:
Establishing the absolute age of palaeoearthquakes is of great significance for the assessment of the seismicity and seismic hazards of a region. As such, several different geochronological techniques to date earthquake-related material have been developed to provide answers on the time of past earthquakes. The present study is part of a wider palaeoseismic research project conducted in the Nojima Fault Zone (NFZ), where the 1995 Mw 6.9 Kobe (Japan) earthquake was triggered, to assess the suitability of the isothermal thermoluminescence (ITL) dating technique on fine-grained quartz and medium-grained feldspar and to provide a sequence of ages for fault-rock samples separated from a drilled core that was retrieved from a depth of ~506 m. Our analysis reveals that ITL can produce consistent dating results and can be considered a reliable luminescence technique for the absolute dating of fault-gouge material. The produced ITL ages signified the existence of repeated seismic events within the NFZ that took place through the late Pleistocene period, with gouge ages spanning from 78.6 ± 4.2 to 13.4 ± 1.4 ka; however, overestimation of the produced ITL dating results may be apparent. Nonetheless, even though some degree of overestimation is considered, ITL dating results denote the oldest possible age boundary of formation (or luminescence signal resetting) of the collected fault-gouge layers.

1. Introduction

Luminescence dating of fault-related material is built on the principle of signal resetting as a result of a past fault slip event, which might “strain” quartz and feldspar grains to such a degree that their luminescence signal resets (partially or even completely). Subsequently, the luminescence signal begins to develop again, permitting the calculation of the age since a past fault slip event.
Up until now, the estimation of an equivalent dose (DE) using the thermoluminescence (TL) signal is performed mainly by multiple-aliquot additive dose (MAAD) protocols. However, the MAAD approach shows numerous disadvantages, which are mainly associated with the large quantity of the datable material needed to obtain a DE estimate, the lack of validation tests (e.g., dose recovery tests [1]), and complications in appropriately extrapolating a derived TL growth curve to the dose axis, as well as the difficulty of reproducing the derived TL signals of a given laboratory dose.
A similar approach to TL that has been proposed to compensate for such problems is the isothermal thermoluminescence (ITL) method. In ITL, stimulation is by heat, where a sample is kept under an elevated temperature, and the light emitted is measured. Studies on the defect centres and the reset and stability of the ITL signals have been conducted using a number of ITL measurement temperatures (e.g., [2,3,4]), and several dating protocols have been proposed (e.g., [5,6]), with reliable results produced at 310 or 320 °C.
ITL dating of fault gouges may be proposed using the assumption of a full resetting of defect centres during fault ruptures, with the natural ionizing radiation after the seismic faulting event providing the age of the fault rupture. The main obstacle in luminescence dating is the assurance of complete zeroing (e.g., [7]). Only a small number of TL dating studies on fault-related materials exist (e.g., [8,9,10,11,12,13,14]); in some cases, these provided evidence of TL trap resetting (e.g., [11,13,14]). Furthermore, although there are a few studies using ITL on quartz and feldspar, to the best of our knowledge, there is, as yet, no published ITL study on fault-gouge material.
A palaeoseismicity research project, “Drilling into Active Fault Damage Zone” (DAFD), managed by Kyoto University, commenced in 2015, aimed at assessing the recent past activity of faults. During the project, a number of boreholes were drilled at the Nojima Fault Zone (NFZ), penetrating the main fault-damage zone at various depths from ~260 m to ~900 m, from which cataclastic rock material such as cataclasite, breccia, and fault gouge have been obtained [15,16]. Intrinsically, geochronological research on these cataclastic rocks, which are directly linked to past faulting events, have been introduced [15,16]. To this end, luminescence dating results using the optically stimulated luminescence (OSL) technique on the fault-gouge layers of the NFZ have recently been published [16], indicating that the NFZ at a depth of ~506 m developed from recurring seismic faulting events during the past 62.8 ± 4.3 ka to 18.5 ± 1.3 ka, with ages signifying the upper age boundary of formation (or OSL signal resetting) of the individual gouge layers. In the present study, fault-gouge ages are obtained using the ITL dating technique on the same set of fault-gouge samples acquired from the NFZ drill core at a depth of ~506 m, and the dating results are cross-checked for consistency with the recently published SAR-OSL dating results by Tsakalos et al. (2020) [16]. In this regard, this study provides additional insights into the effectiveness of the different absolute dating techniques, as comparative dating studies on fault-gouge material remain scarce in the literature to date.

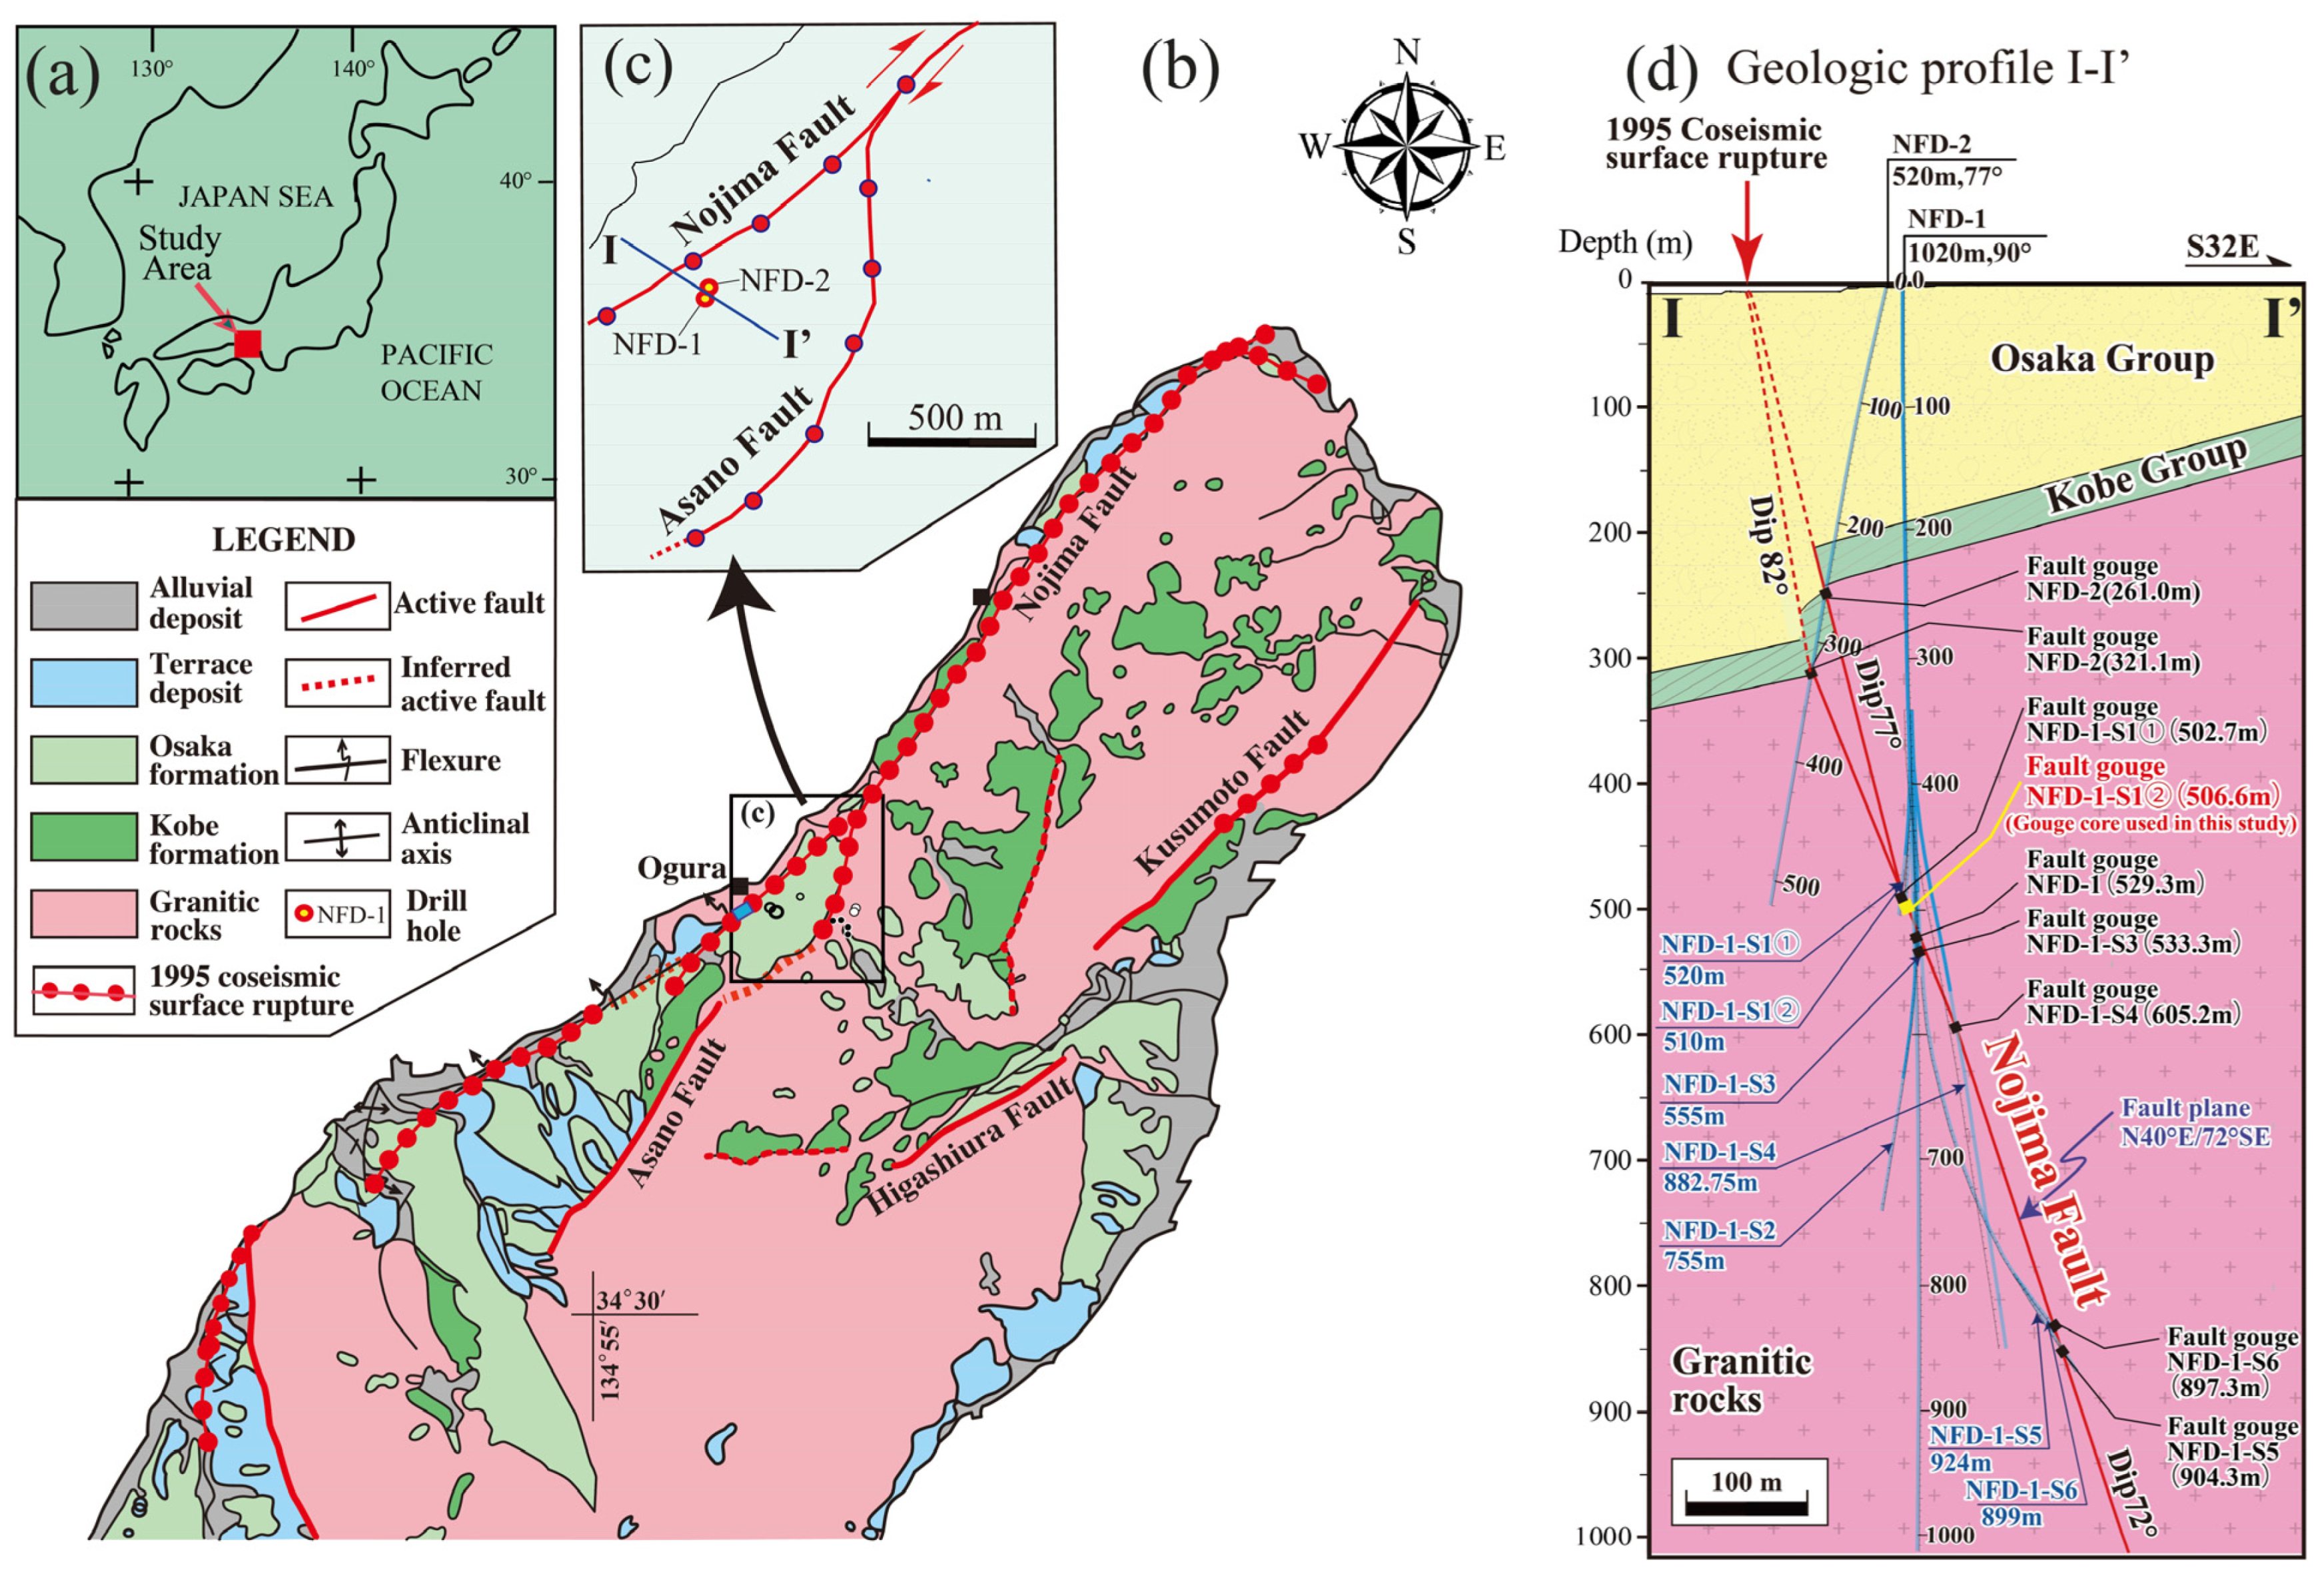
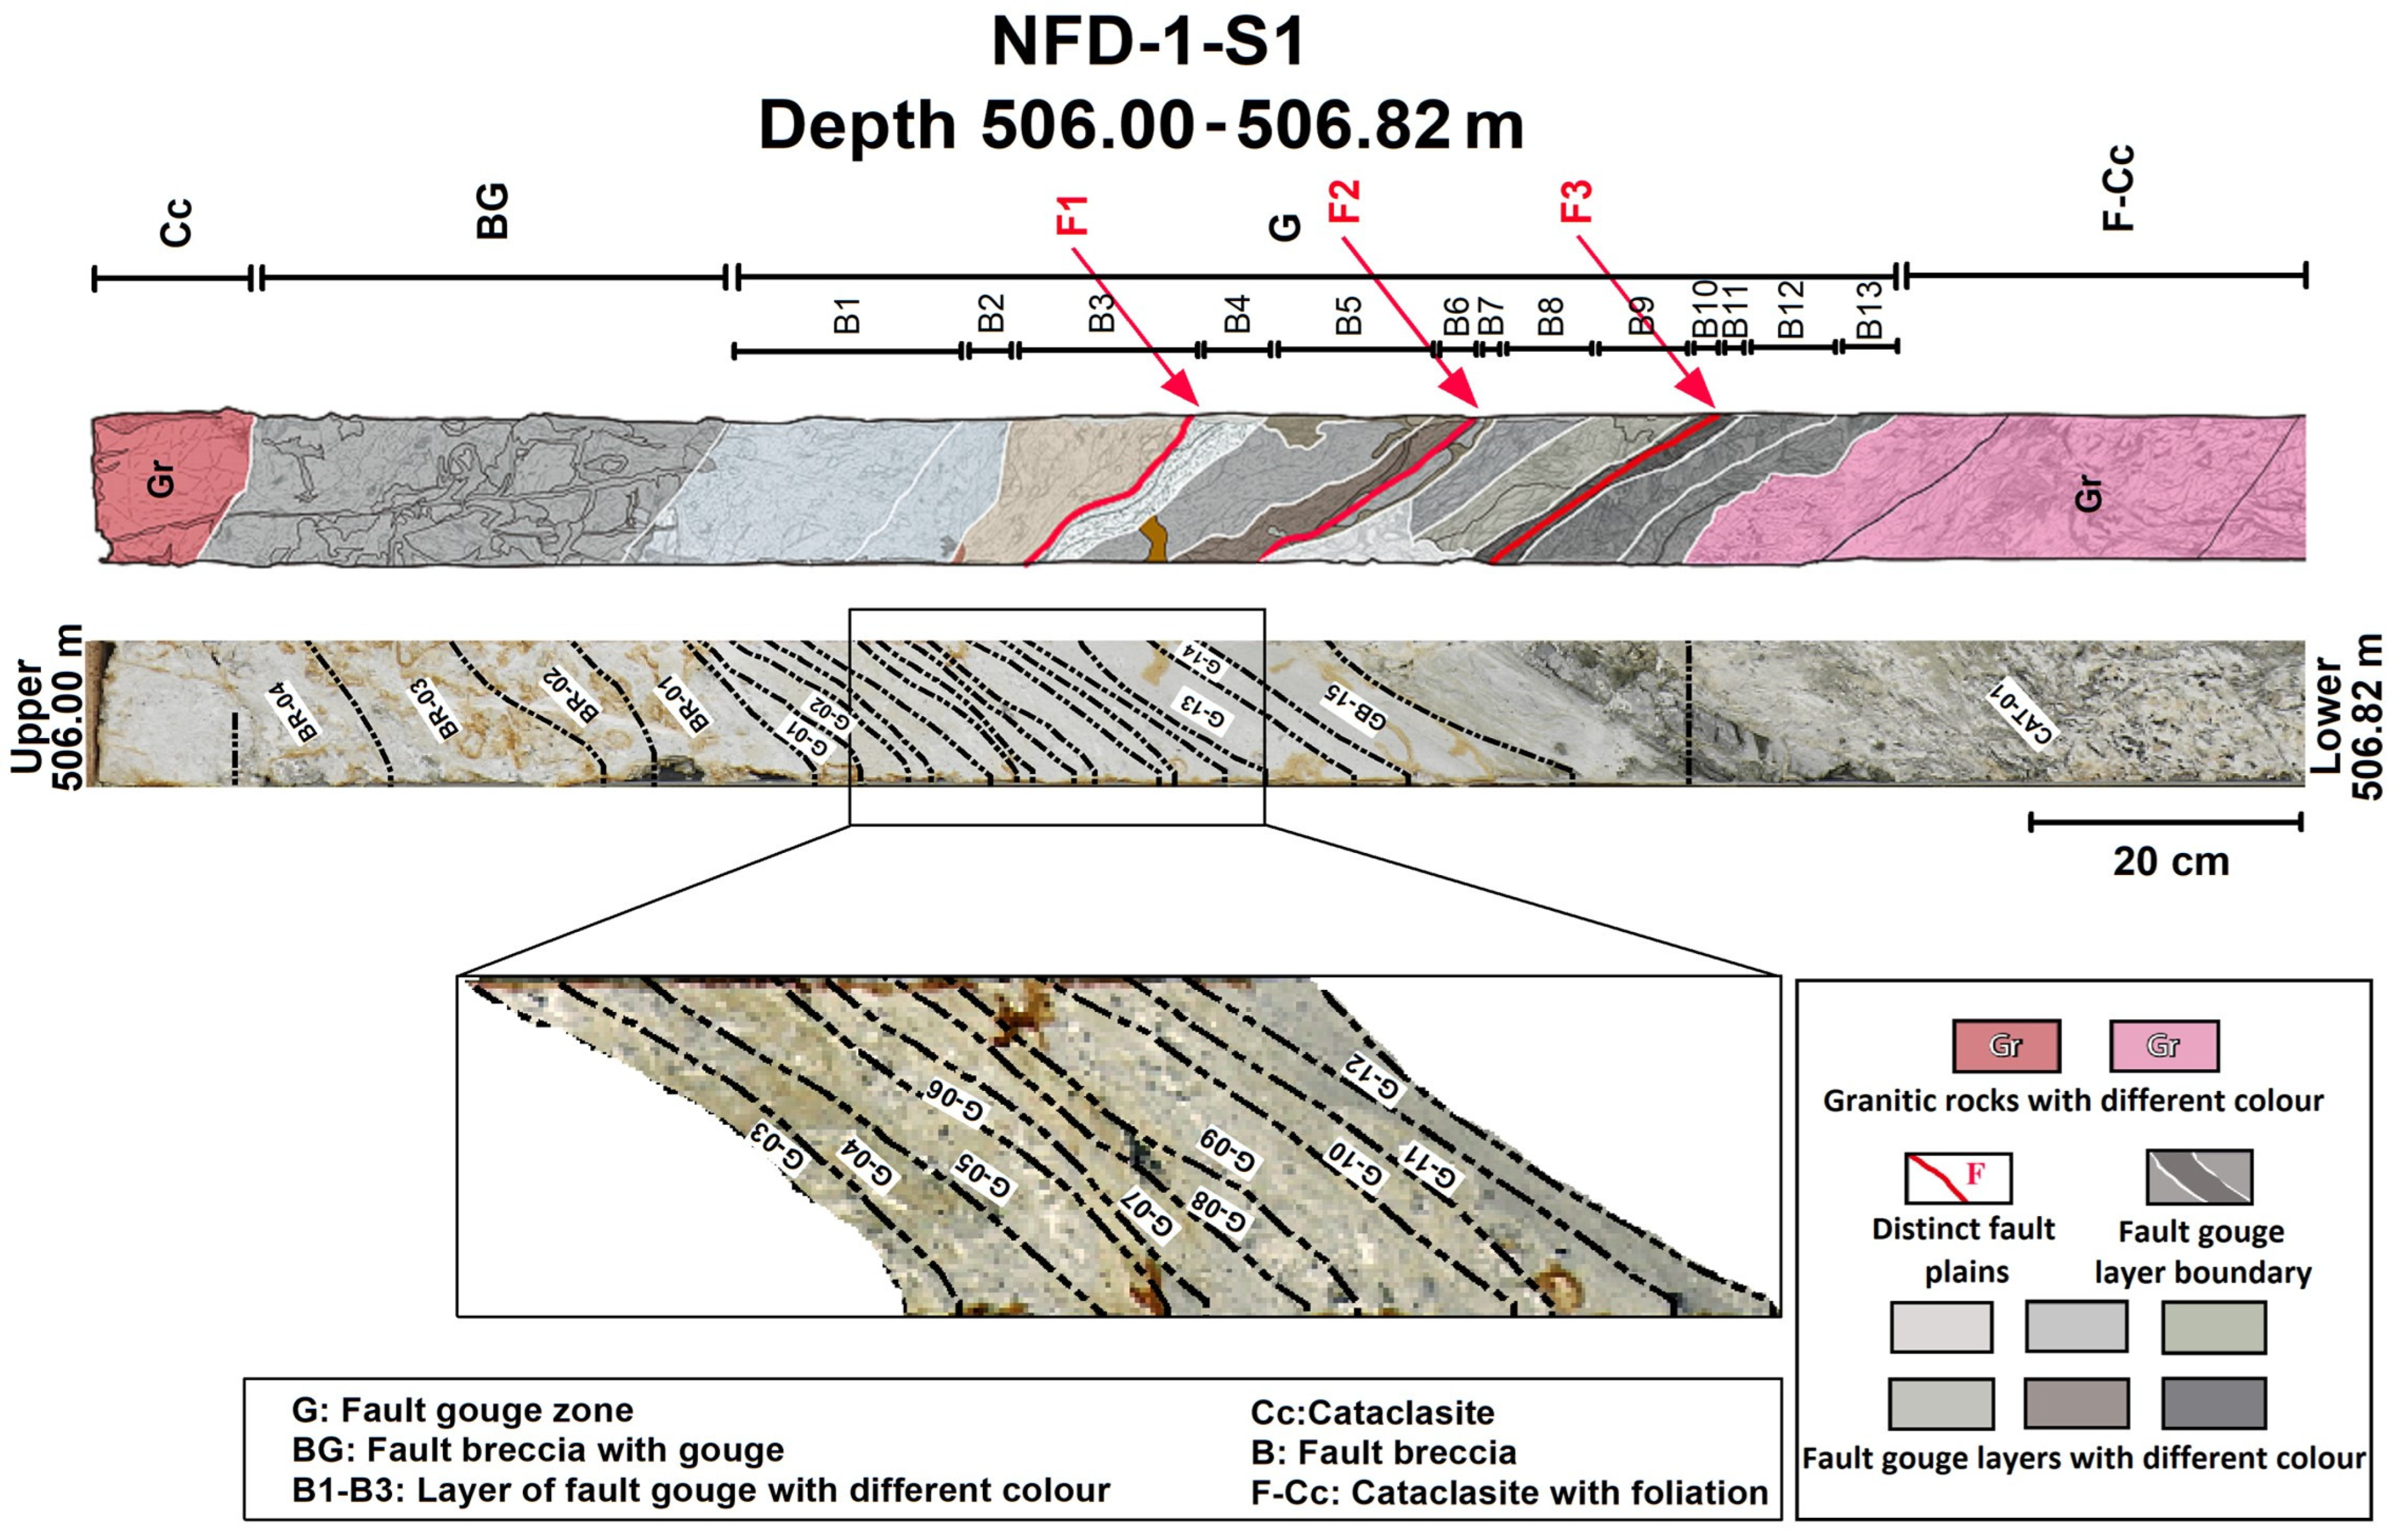
2. Geologic Setting and Collection of Samples

Awaji Island (southwest Japan) is considered one of the most seismogenic areas in Japan, hosting four main active faults in its northeastern part: the Nojima and the Asano faults, which form the NFZ, as well as the Kusumoto and the Higashiura faults. They cut the Kobe and Osaka groups of the Miocene–Pleistocene age as well as the alluvial deposits of the Quaternary age [17]. The 1995, an Mw 6.9 Kobe earthquake caused the development of an ~18 km coseismic surface-rupture zone along the pre-existing NFZ and a ~2 km zone along the Kusumoto fault (Figure 1b; [18]). Recent studies have shown that before the Mw 6.9 Kobe earthquake, a large seismic fault-rupture event also took place in ~AD 1000, while assessment of the fault gouges from the retrieved cores revealed that fault ruptures occurred repeatedly on the NFZ during the late Pleistocene period [15,16]. Furthermore, in the NFZ, an average recurrence interval of ~900 yr has been proposed for high-magnitude earthquakes [19].
The samples used in this study were collected from a drilled core of the Nojima Fault Zone (NFZ) at the site of Ogura (Figure 1). Nine drilling holes penetrated the Nojima fault at different spots from ~260 down to 900 m in depth, and a core was retrieved from 506–507 m (NFD-1-S1-② borehole), where a fault-gouge zone was found at ca. 506 m in depth, which was selected for collecting fault-gouge material for ITL dating (Figure 2). Meso- and microstructural analyses reveal that the particular fault-gouge zone is made up of 11–20 thin layers, showing various colours from light grey to dark grey and brownish grey, with each of the individual coloured layers most likely representing at least one fault-rupture event [15]. Therefore, to evaluate the age of the fault-gouge material, each individual coloured gouge layer was separated according to macroscopic observations of the differences in texture and colour (Figure 2). In order to cross-check for age consistency, the gouge layers selected for dating in this study are exactly the same as those selected for dating previously in the study by Tsakalos et al. [16] using the SAR-OSL technique.

3. Materials and Methods

3.1. Sample Preparation and Measurement Facilities

Quartz and feldspar grains are usually the desirable minerals in luminescence dating; however, principally, quartz grains are used in ITL (e.g., [21]). Furthermore, Takeuchi et al. [22] have shown that full TL signal resetting may not be possible in medium- and coarse-grained gouge material. To this end, it was considered appropriate to use fine- to medium-grain-sized fault-gouge material for dating; thus, ITL measurements were performed on fine-grained (4–11 μm) quartz and medium-grained (80–125 μm) feldspar. The grain size (fine or medium) and mineral type (quartz or feldspar) chosen for dating were based on the availability of the remaining mineral grains after chemical treatment.
The isolation of quartz and feldspar grains was achieved by chemical treatment of the selected gouge samples with 10% hydrochloric acid and 10% hydrogen peroxide. For feldspar, grains in the range of 80–125 µm were isolated by sieving, which were then treated with 10% hydrofluoric acid. K-feldspar was further separated from quartz using heavy-liquid separation, (sodium polytungstate, δ = 2.58 g cm−3). Grains in the range of 4–11 µm were separated by settling using Stokes’ law and treated with 40% fluorosilicic acid for 9 days, with the aim of obtaining pure quartz.
A Risø TL/OSL DA-15 reader fitted with a Thorn EMI photo-multiplier tube was used for conducting ITL measurements. For ITL measurements of quartz, a Hoya U-340 filter was used, while for feldspar, a Schott BG39 and a Corning 7–59 filter pack was used.

3.2. Luminescence Measurements

The single-aliquot regenerative (SAR) protocol (e.g., [23]) is commonly used for ITL measurements. However, the use of the SAR-ITL protocol may be problematic [23,24], as sensitivity changes may take place during the measurement of the natural signal, which cannot be accurately corrected by the subsequent laboratory-given test dose. It has also been suggested that since this problem is associated with the first heating of the sample, it is likely that quartz grains, which have already experienced high heat (at least 350 °C) in the past, may suffer less from sensitivity changes [25]. To overcome this problem, Buylaert et al. [23] suggested the employment of a single-aliquot regenerative and additive dose (SARA) procedure, where measurements are performed on single aliquots, containing only the natural dose, as well as on aliquots in which different radiation doses are administered in addition to the natural dose. To check for initial changes in luminescence sensitivity, a dose-recovery test was performed on quartz and feldspar samples using both the SAR-ITL protocol and the SARA-ITL procedure.
Quartz and feldspar ITL measurements (using both the SAR-ITL protocol and the SARA-ITL procedure) were conducted at 310 °C for 300 s; the ITL protocol used is provided in Table 1. A heating rate of 2 °C per second was used, along with a constant test dose. We did not pre-heat the aliquots, as heating at 310 °C is applied right before the ITL measurement; thus, it may be assumed that any undesirable traps were emptied during this stage. The first 5 s of the resulted ITL intensity was used for the calculations, less the background ITL signal from the last 20 s of the ITL measurement. Irradiation of the samples was from a calibrated 90Sr/90Y beta (β) source. The protocol has the following steps: a known laboratory dose is given, and the resultant ITL signal is measured at 310 °C for 300 s. A fixed laboratory test dose is then administered, and the ITL signal is re-measured. The initial 5 and the last 20 s of the ITL signal-decay curve are then used to perform the calculations. For the SARA-ITL procedure, different doses are given to aliquots containing their natural dose. ITL measurements are performed to obtain DE values for the natural and beta-irradiated aliquots.

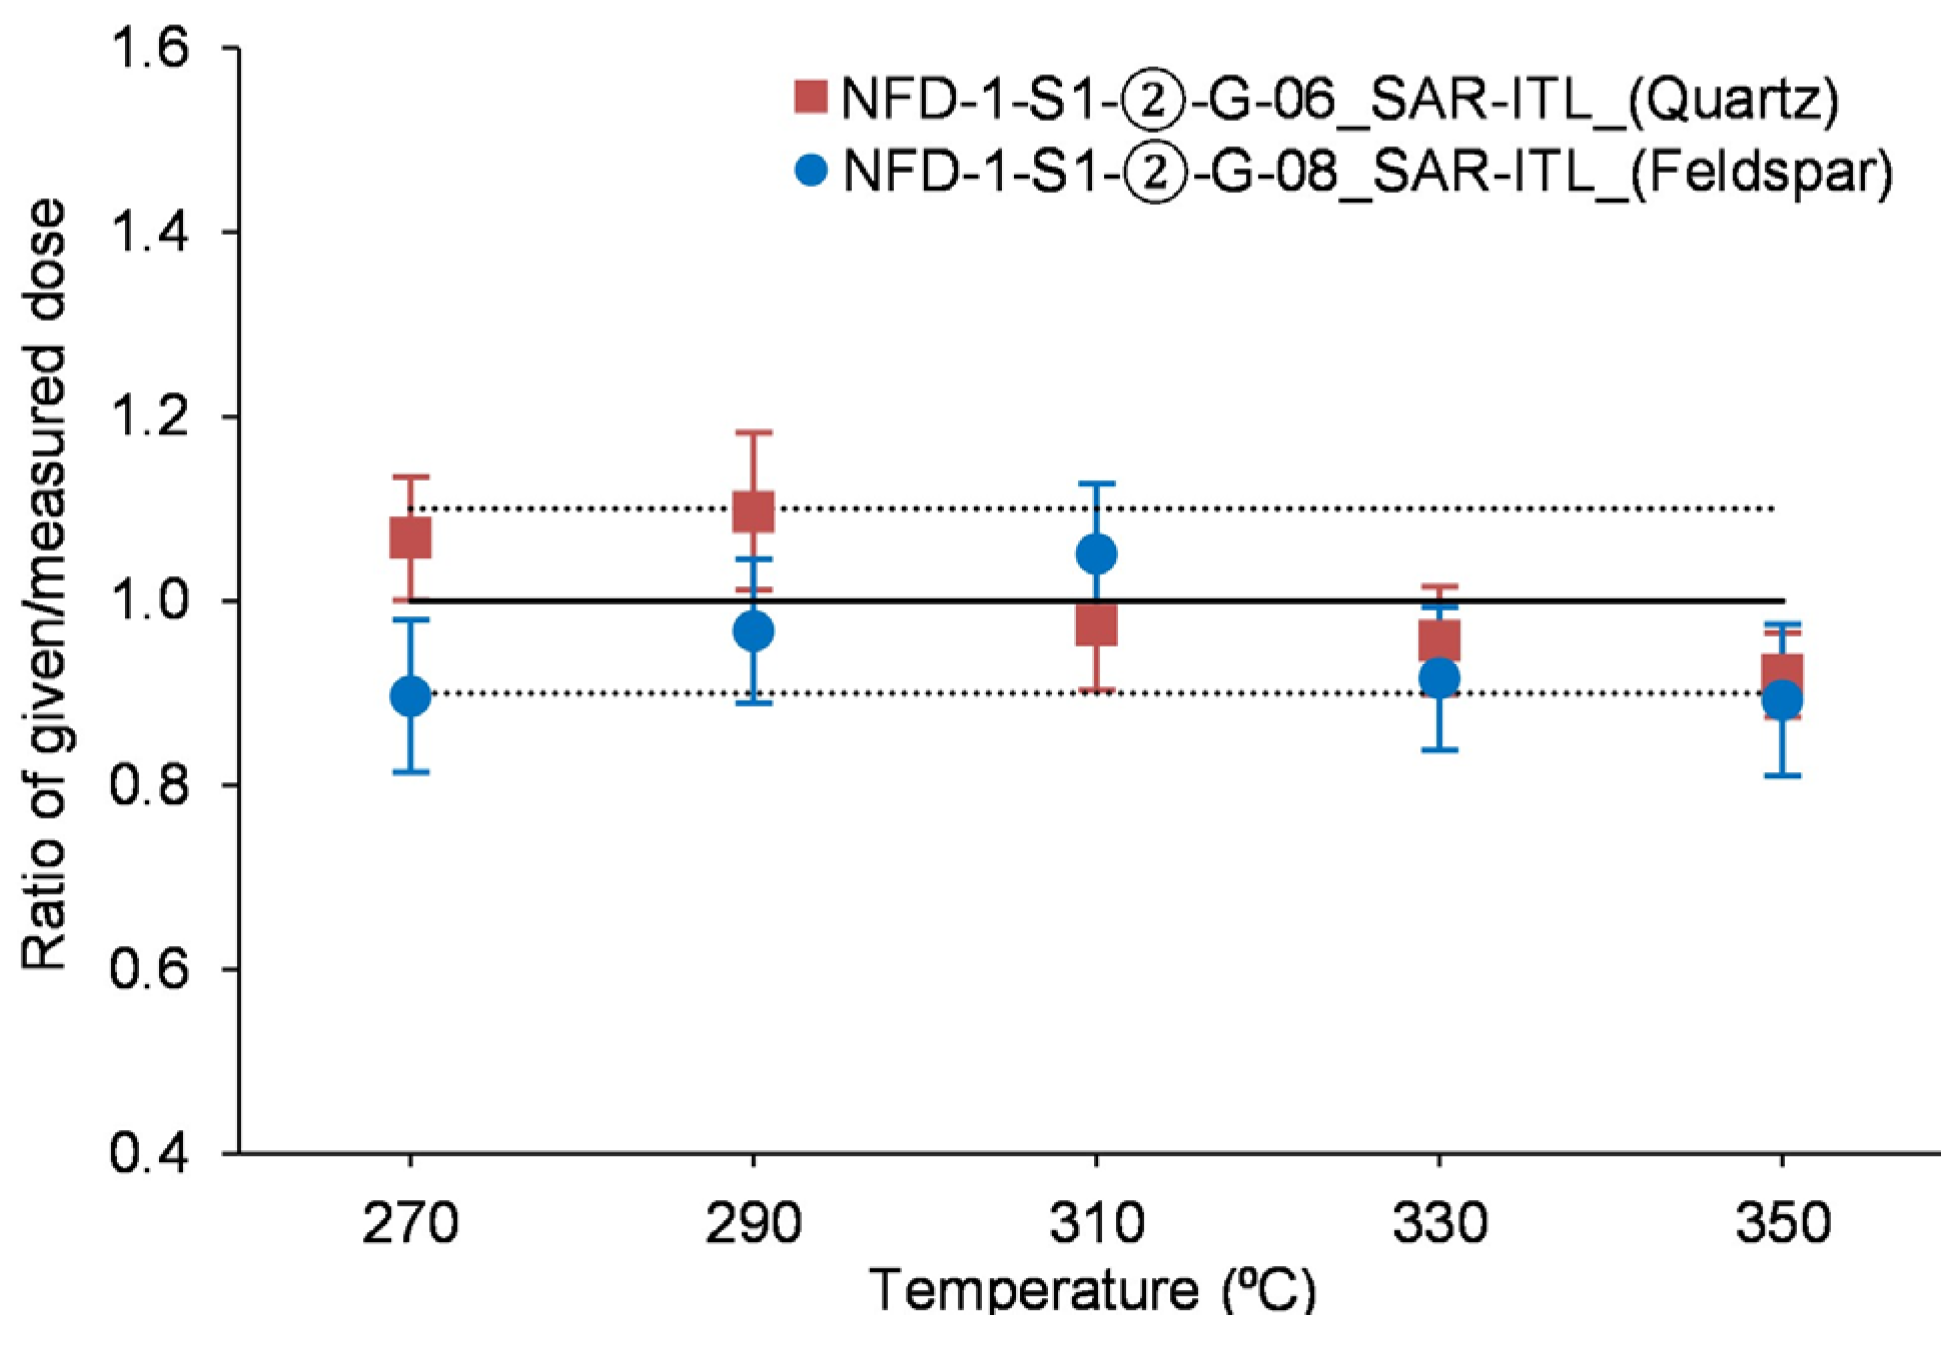
3.2.1. Measurement Temperature

First, the effect of the heating temperature during measurement was examined (Figure 3, could also be found at supplementary materials). During this test, different temperatures are used to calculate the equivalent DE values of a sample. The temperature chosen for subsequent measurements should be one that produces DE values in a plateau area.
Here, this test was combined with a dose-recovery test, allowing the influence of measurement temperature on the DE values to be assessed independently of variations due to partial/heterogeneous bleaching.
The natural quartz (sample NFD-1-S1-②-G-06) and feldspar (sample NFD-1-S1-②-G-08) ITL signal (five aliquots from each sample) was zeroed by heat (450 °C for 1 h), and a fixed beta dose of 200 Gy was subsequently given. ITL measurements were then conducted at different temperatures (from 270 to 350 °C, in 20 °C steps). For both quartz and feldspar, the given/measured dose ratio, using temperatures between 270 °C to 310 °C, was close to unity (the measured dose is nearly identical to the given dose; Figure 3), and a measurement temperature at 310 °C was selected for the following ITL measurements. Furthermore, recycling ratios of the measured aliquots were systematically in the range of 0.89 to 1.1, and recuperation was below 5%. From these tests, it could be suggested that the SAR-ITL protocol can produce reliable known laboratory doses for both quartz and feldspar within a range of measurement temperatures.
Additionally, this preheat/dose recovery test allowed for checking if a residual signal is left after thermal treatment (450 °C for 1 h), which would overestimate the calculated dose. The test provided evidence that, in the range of 270 °C to 310 °C, both quartz and feldspar samples do not suffer from significant residual signals, and that thermal treatment sufficiently bleaches the ITL luminescence signal.

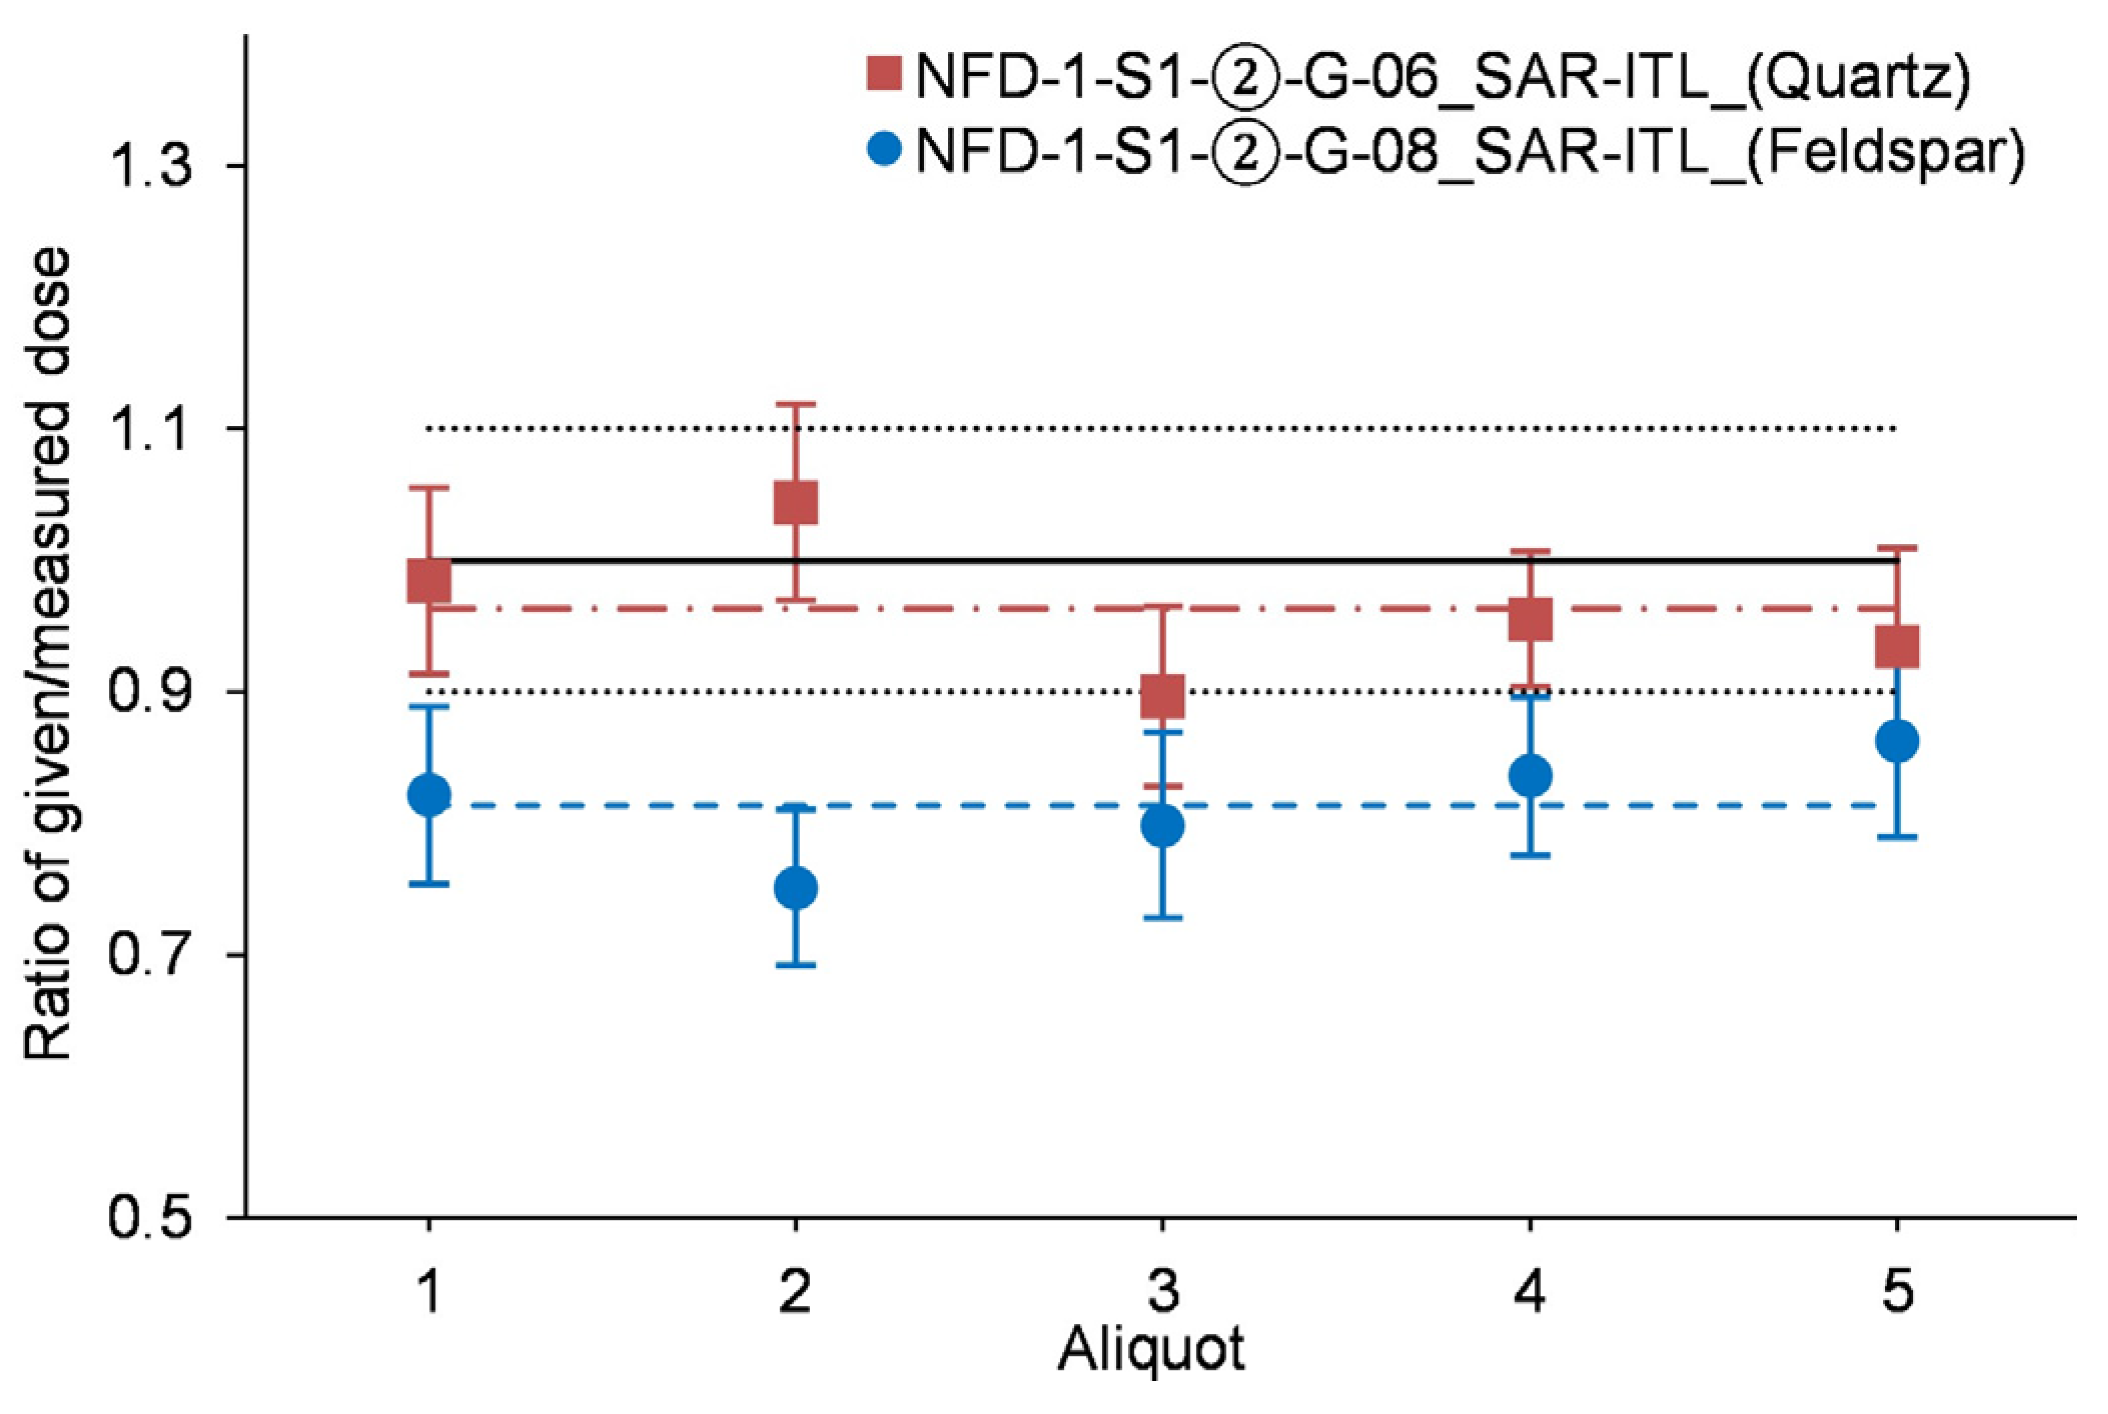
3.2.2. Dose-Recovery Test

For any dating procedure to be reliable, it is essential that the selected dating protocol can accurately replicate a known dose before subjecting the sample to any treatment that does not occur naturally (such as significant heating). Two ITL studies have indicated that sensitivity changes that take place during the first heating of a sample (step 2 of the SAR-ITL protocol) cannot be corrected by the subsequent (first) test dose [23,24]. However, sensitivity changes were sufficiently corrected by the test doses in the following cycles. To check if sensitivity changes are apparent (using the SAR-ITL protocol), Buylaert et al. [23] suggested that a dose-recovery test should be conducted on aliquots that have been bleached by light, as heating (which is commonly used in ITL dose-recovery test) may mask any sensitivity changes that take place in step 2 of the SAR-ITL protocol.
Aliquots of both quartz and feldspar of two samples (five aliquots for each sample) were first bleached for 4 h in the sun, and a laboratory dose of 200 Gy was given; then, the aliquots were measured using the SAR-ITL protocol.
The test for the fine-grained quartz (Figure 4) generated DE values close to unity, indicating that, using the SAR-ITL protocol, fine-grained quartz does not experience sensitivity changes or residual doses and thus can generate reliable results. In contrast, for feldspar, the test produced given/measured dose ratios that deviate significantly from unity, with measured DE values being higher than the given doses (Figure 4), something that may signify that sensitivity changes take place during the measurement of the natural signal—an observation that is consistent with Huot et al. [24] and Buylaert et al. [23]’s results on quartz—or that a residual signal remains after sunlight exposure.
Buylaert et al. [23] and Mejdahl and BZtter-Jensen [26] proposed employing the SARA-ITL procedure to address and resolve issues related to initial changes in luminescence sensitivity. As such, the inaccuracy in the dose-recovery experiment of feldspar was further investigated by performing a dose-recovery test using the SARA-ITL procedure. To perform the SARA-ITL dose-recovery test, 15 additional aliquots (three groups of 5 aliquots of sample NFD-1-S1-②-G-08) were first bleached for 4 h in sunlight, and a 50 Gy dose was given, which was considered the natural group (N). Then, to each group containing the natural (50 Gy) dose, different laboratory doses (N + 0, N + 50, and N + 100 Gy) were added. The five feldspar DE values obtained using the SAR-ITL dose-recovery test above were also used as the N + 150 dose group, to assist in the calculation of the DE values using the SARA-ITL dose-recovery test. Then, five groups were made, each containing one aliquot with a different added dose (N + 0, N + 50, N + 100, and N+ 150 Gy), and the SAR-ITL protocol was used to provide a DE value for each aliquot. The SAR-ITL DE values of each group were then plotted against the added doses (Figure 5).
Using the SARA-ITL procedure, feldspar DE recovered values were improved significantly, falling within the accepted limits of 0.9 to 0.1 (Figure 6). On average, it was observed that feldspar DE estimates using the SAR-ITL are about 20% overestimated compared with those obtained using the SARA-ITL procedure.
Taking into account the observations of the preheat/dose recovery and dose-recovery tests, it could be suggested that (a) high heat at 450 °C for 1 h can sufficiently reset the natural signal of both quartz and feldspar, (b) sunlight exposure for 4 h sufficiently resets the ITL signal of quartz, and that (c) using the SAR-ITL protocol and the SARA-ITL procedure on sunlight-bleached feldspar grains leads to overestimated DE values being obtained as a result of sensitivity changes that take place during the first heat of the sample, although the SARA-ITL can compensate for sensitivity changes. Since the sensitivity changes in the SAR-ITL signal for feldspar appeared to be associated with the first heating of the sample, a similar problem should b expected also for quartz. However, this is not the case, as quartz does not suffer from sensitivity changes. Taking into account the assumption that gouge samples (containing both quartz and feldspar) were already heated to a high temperature during a fault-rupture event, it could be proposed that the observed sensitivity changes in the feldspar ITL signal may signify that (a) the ITL signal of feldspar is less thermosensitive than that of quartz, and/or that (b) the heat transfer in fine grains is more efficient than in medium-sized grains. Consequently, the SAR-ITL protocol was used for measuring the fine-grained quartz, and the SARA-ITL procedure for medium-grained feldspar samples.

3.3. Dose-Rate Determination

For all fault-gouge samples, the environmental (external) dose rates were determined based on the concentration of U, Th, K, and Rb (in each sample) using inductively coupled plasma mass spectrometry (ICP-MS). The internal dose rate may contribute significantly to the total dose rate in K-feldspar samples; however, due to the small gouge samples, only a minimal quantity of K-feldspar grains was obtained from each sample. Furthermore, feldspar fractions are commonly contaminated by other minerals, particularly quartz, as the density-separation method is not completely mineral-specific. Consequently, it has become common practice the use of literature-reported radioactive elements concentrations of K-feldspars. The internal beta dose rate of K-feldspar samples was determined based on a presumed K concentration of 12.5 ± 0.5% and an internal Rb content of 400 ± 100 ppm [27,28,29,30]. A minor internal alpha dose rate of 0.10 ± 0.05 Gy/ka from internal U and Th was also assumed [31,32,33].
Dose rates were obtained using the DRc software developed by Tsakalos et al. [34]. The relative alpha efficiency (a-value) of fine-grained quartz was set to 0.04 ± 0.02 (e.g., [35,36], while that of K-rich feldspar was set to 0.15 ± 0.05, as assumed by Balescu et al. [37].
The moisture content for each sample was based on “as-found values”, with an error of ± 5%, which was regarded as unchanged over time. The final dose rates were calculated by correcting for the particular grain size of each sample. The total dose rate adds together the contributions from the α-, β-, and γ-radiation affecting a particular mineral. The dose rates are provided in Table 2.
It should be stated here that a possible (dis)equilibrium of uranium may affect the calculated dose rates (e.g., [38,39]). Radium loss may occur during the faulting and crushing of minerals. Further, radium can easily dissolve in water, and additional radium may accumulate in the fault gouge. Thus, there still exists some uncertainties about the disequilibrium of radioactive elements. Nevertheless, using K-feldspars (for some samples) may, to some degree, compensate for the effect of uranium disequilibrium, as the internal potassium contributes substantially to the total dose rate [30].

4. Results and Discussion

The ITL age (with a 1σ uncertainty) of each gouge layer was obtained from the ratio of the DE value (received natural irradiation dose) accumulated in fine quartz and medium feldspar grains since the last annealing event (affecting the particular gouge layer) to the environmental/natural calculated dose rate (Table 3). The DE value of each fault-gouge sample was calculated using the Central Age Model (CAM) by Galbraith et al. (1999) [40]. Representative decay and growth curves of the ITL quartz and feldspar signals are shown in Figure 7. ITL dose-response growth curves can be described by a saturating exponential function. Regarding the SARA-ITL feldspar ages, the employment of the additive-dose procedure appeared to have some limitations. Reliable DE estimates require that the extrapolated intercept comes from a linear growth curve, something that may not be possible for samples close to saturation. Unfortunately, for sample NFD-1-S1-②-G-06, a linear growth curve could not be produced, and thus its DE value was estimated using the SAR-ITL protocol. However, as the dose-recovery tests suggested, feldspar DE values using the SAR-ITL protocol may be overestimated by ~20%; thus, it may be appropriate to consider the produced feldspar SAR-ITL DE value and the associated age as being overestimated. For all the aliquots used, the recycling ratios were within the accepted limits, and recuperation never exceeded 5%. Additionally, the 2D0 values are within the accepted range suggested in the literature (e.g., [41]). Therefore, the use of the ITL demonstrates that this methodology is appropriate for recovering DE values and that the fault-gouge samples may display favourable ITL characteristics for dating. However, when ITL dating is to be undertaken, a dose-recovery test (on light-bleached samples) should always be performed, and, where necessary, the SARA-ITL procedure should be employed to compensate for signal-sensitivity changes.
Our ITL dating results signify that seismic activity at the sampled gouge zone occurred during the late Pleistocene period, with gouge ages spanning from 78.6 ± 4.2 ka to 13.4 ± 1.4 ka. ITL gouge ages appear significantly younger than the age of the Cretaceous host granitic rock, thus signifying ITL signal resetting (or partial resetting) of the host granitic rock as a result of the intense deformation and development of gouge material during different faulting events. Therefore, it may be assumed that the Nojima fault-gouge layers attained some degree of signal resetting due to stress and/or heat affecting the parent rock during past faulting events. Our dating results, however, depict faulting activity only for the specific sampling spot of the Nojima-fault core zone; if a rupture event occurred at a different spot within the NFZ, it would be impossible to date it using the collected gouge material.
However, our ITL gouge ages did not provide evidence of the 1995 Kobe earthquake or other recent rupture events that took place in the NFZ. The study by Tsakalos et al. [16], where exactly the same gouge layers were dated using the SAR-OSL technique, also provided similar ages, ranging from 62.8 ± 4.3 ka to 18.5 ± 1.3 ka. They suggested that one possible explanation could be that the collected gouge layers might develop during pre-Holocene faulting events, and that the more recent ruptures (including the 1995 Kobe earthquake) might have occurred at a different spot within the NFZ. They also proposed that due to environmental conditions, it might be impossible to achieve full resetting of the ITL signal of old gouge layers or the development of new gouge layers at a particular sampling spot. Moreover, some mixing of individual gouge layers might occur during sampling, leading to the gouge ages representing a mixture of different past fault ruptures. Nevertheless, even in the case of partial zeroing or gouge-layer mixing, ITL dating results signify the maximum gouge age of the last resetting event (fault rupture) affecting a particular gouge layer, with the minimum age being even a very recent (including the 1995 Kobe earthquake) fault-rupture event. In this essence, ITL ages of the fault-gouge zone obtained in this study revealed that several faulting events took place in the past, between 78.6 ± 4.2 to 13.4 ± 1.4 ka (with these ages being the upper age limit).
Even though both ITL (this study) and OSL (by Tsakalos et al. [16]) provided evidence of neotectonic activity on the specific gouge zone of the NFZ during the mid–late Pleistocene period, comparison between ages of the same gouge layers using the two luminescence dating techniques revealed that the ITL ages (using both the SAR protocol and the SARA procedure) are systematically older (except for the quartz sample NFD-1-S1-②-G-12 dated using the SAR-ITL protocol) than the SAR-OSL ages (Figure 8). This is unexpected, since the dose-recovery tests performed in both studies revealed that a given known laboratory dose could be accurately recovered. Apart from SAR-ITL dating on feldspar, where a ~20% overestimation may be expected (as the dose-recovery test revealed), SAR-ITL ages of fine-grained quartz and SARA-ITL ages of medium-grained feldspar would be expected to be in agreement with the SAR-OSL ages of fine-grained quartz provided by Tsakalos et al. [16]. Regarding the SAR-ITL quartz ages, one reason for this inconsistency could be associated with a possible ineffectiveness of the SAR-ITL dose-recovery test on light-bleached fine quartz to detect small signal-sensitivity changes (or residual doses) and, thus, the SAR-ITL measurements may have overestimated the quartz DE values. As for SARA-ITL feldspar ages, the observed small deviation from the SAR-OSL ages may be due to inaccuracies in the linear fitting of the additive doses, different signal-sensitivity changes for the four single-aliquot measurements (e.g., sensitivity changes should be the same, or very similar, independently of the added dose) used to develop the linear growth curve, or/and the relatively small number of aliquots used for calculating the central DE value of a sample. Finally, one plausible explanation for this observation could be due to the internal dose rates used for K-feldspar samples, as they were based on literature-reported radioactive element concentrations, and thus the total dose rate for each K-feldspar sample may differ from the actual.
Nonetheless, even if some overestimation of the ITL ages is apparent, they still remain in the same chronological framework as the OSL ages provided by Tsakalos et al. [16], thus putting additional strain on the effectiveness of the two luminescence techniques in dating fault-gouge material.

5. Conclusions

Our ITL dating results signify that neotectonic activity at the sampled gouge zone of the NFZ occurred during the late Pleistocene period, with fault-gouge ages spanning from 78.6 ± 4.2 to 13.4 ± 1.4 ka. The employment of dose-recovery tests revealed that when using the SAR-ITL protocol, feldspar samples suffer sensitivity changes that lead to overestimated DE values; this is not, however, the case using fine-grained quartz, where given doses were accurately determined using the SAR-ITL protocol. It seems that the problem of sensitivity may be sample-dependent, and thus when ITL dating is to be undertaken, a dose recovery should always be performed (on light-bleached samples), and where necessary, the SARA-ITL procedure must be employed to compensate for such problems.
The ITL ages presented here should be considered with some caution, as the performance and reliability of the SAR-ITL procedure, in its present form, need further refinement. Nonetheless, even if some degree of overestimation may be considered for the produced ITL gouge ages, they still signify the maximum age limit of formation (or resetting) of the fault-gouge layers during past fault ruptures at the NFZ through the late Pleistocene period, with the lower age limit being even a very recent (including the 1995 Kobe earthquake) fault-rupture event.
Although ITL age overestimation may be apparent, a comparison of the produced ITL ages with the SAR-OSL ages in the study by Tsakalos et al. [16] showed that gouge ages remain in the same late Pleistocene chronological framework, and thus, it may be assumed that there is some evidence that both luminescence dating techniques can produce reliable results. However, a more systematic comparison of one against the other, and also against other luminescence dating techniques (e.g., IRSL, TT-OSL), is necessary before any standardised luminescence methodology for fault-gouge dating is proposed.

Supplementary Materials

Author Contributions

E.T., Y.B. and A.L., conceptualization and funding acquisition; E.T., E.F., A.L., T.N., M.K. and Y.B., investigation; E.F., Y.B. and A.L., project administration; E.T., writing—original draft; E.F., Y.B., A.L., T.N. and M.K., writing—review and editing; Y.B., E.F. and A.L., supervision. All authors have read and agreed to the published version of the manuscript.

Funding

This research was funded by the Secretariat of the Nuclear Regulation Authority of Japan and partially funded by the European Union’s Horizon 2020 research and innovation program under the Marie Sklodowska-Curie Grant Agreement No. 743607.

Data Availability Statement

The data sets are publicly accessible via https://doi.org/10.6084/m9.figshare.21947291.v1.

Acknowledgments

We thank M. Miyawaki, J. Uchida, and T. Satsukawa for managing the drilling project and for discussing the scientific aspects of the study. Our thanks are also due to P. Chen and B. Liu for their help during the fault-gouge core sampling and fieldwork, and N. Akiyama for arranging the project.

Conflicts of Interest

The authors declare no conflicts of interest.

References

  1. Richter, D.; Temming, H. Testing Heated Flint Palaeodose Protocols Using Dose Recovery Procedures. Radiat. Meas. 2006, 41, 819–825. [Google Scholar] [CrossRef]
  2. Jain, M.; Bøtter-Jensen, L.; Murray, A.S.; Denby, P.M.; Tsukamoto, S.; Gibling, M.R. Revisiting TL: Dose Measurement beyond the OSL Range Using SAR. Anc. TL 2005, 23, 9–24. [Google Scholar]
  3. Jain, M.; Bøtter-Jensen, L.; Murray, A.S.; Essery, R. A Peak Structure in Isothermal Luminescence Signals in Quartz: Origin and Implications. J. Lumin. 2007, 127, 678–688. [Google Scholar] [CrossRef]
  4. Jain, M.; Duller, G.A.T.; Wintle, A.G. Dose Response, Thermal Stability and Optical Bleaching of the 310 °C Isothermal TL Signal in Quartz. Radiat. Meas. 2007, 42, 1285–1293. [Google Scholar] [CrossRef]
  5. Choi, J.H.; Murray, A.S.; Cheong, C.-S.; Hong, D.G.; Chang, H.W. Estimation of Equivalent Dose Using Quartz Isothermal TL and the SAR Procedure. Quat. Geochronol. 2006, 1, 101–108. [Google Scholar] [CrossRef]
  6. Gibling, M.R.; Tandon, S.K.; Sinha, R.; Jain, M. Discontinuity-Bounded Alluvial Sequences of the Southern Gangetic Plains, India: Aggradation and Degradation in Response to Monsoonal Strength. J. Sediment. Res. 2005, 75, 369–385. [Google Scholar] [CrossRef]
  7. Tsakalos, E.; Dimitriou, E.; Kazantzaki, M.; Anagnostou, C.; Christodoulakis, J.; Filippaki, E. Testing Optically Stimulated Luminescence Dating on Sand-Sized Quartz of Deltaic Deposits from the Sperchios Delta Plain, Central Greece. J. Palaeogeogr. 2018, 7, 130–145. [Google Scholar] [CrossRef]
  8. Singhvi, A.K.; Banerjee, D.; Pande, K.; Gogte, V.; Valdiya, K.S. Luminescence Studies on Neotectonic Events in South-Central Kumaun Himalaya—A Feasibility Study. Quat. Sci. Rev. 1994, 13, 595–600. [Google Scholar] [CrossRef]
  9. Ding, Y.Z.; Lai, K.W. Neotectonic Fault Activity in Hong Kong: Evidence from Seismic Events and Thermoluminescence Dating of Fault Gouge. JGS 1997, 154, 1001–1007. [Google Scholar] [CrossRef]
  10. Banerjee, D.; Singhvi, A.K.; Pande, K.; Gogte, V.D.; Chandra, B.P. Towards a Direct Dating of Fault Gouges Using Luminescence Dating Techniques—Methodological Aspects. Curr. Sci. 1999, 77, 256–268. [Google Scholar]
  11. Mukul, M.; Jaiswal, M.; Singhvi, A.K. Timing of Recent Out-of-Sequence Active Deformation in the Frontal Himalayan Wedge: Insights from the Darjiling Sub-Himalaya, India. Geology 2007, 35, 999. [Google Scholar] [CrossRef]
  12. Spencer, J.Q.G.; Hadizadeh, J.; Gratier, J.-P.; Doan, M.-L. Dating Deep? Luminescence Studies of Fault Gouge from the San Andreas Fault Zone 2.6 km beneath Earth’s Surface. Quat. Geochronol. 2012, 10, 280–284. [Google Scholar] [CrossRef]
  13. Ganzawa, Y.; Takahashi, C.; Miura, K.; Shimizu, S. Dating of Active Fault Gouge Using Optical Stimulated Luminescence and Thermoluminescence. Jour. Geol. Soc. Jpn. 2013, 119, 714–726. [Google Scholar] [CrossRef]
  14. Odlum, M.L.; Rittenour, T.; Ault, A.K.; Nelson, M.; Ramos, E.J. Investigation of Quartz Luminescence Properties in Bedrock Faults: Fault Slip Processes Reduce Trap Depths, Lifetimes, and Sensitivity. Radiat. Meas. 2022, 155, 106784. [Google Scholar] [CrossRef]
  15. Lin, A.; Nishiwaki, T. Repeated Seismic Slipping Events Recorded in a Fault Gouge Zone: Evidence from the Nojima Fault Drill Holes, SW Japan. Geophys. Res. Lett. 2019, 46, 1276–1283. [Google Scholar] [CrossRef]
  16. Tsakalos, E.; Lin, A.; Kazantzaki, M.; Bassiakos, Y.; Nishiwaki, T.; Filippaki, E. Absolute Dating of Past Seismic Events Using the OSL Technique on Fault Gouge Material—A Case Study of the Nojima Fault Zone, SW Japan. JGR Solid Earth 2020, 125, e2019JB019257. [Google Scholar] [CrossRef]
  17. Research Group for Active Faults of Japan (RGAFJ). Active Faults in Japan-Sheet Maps and Inventories (Revised Edition); University of Tokyo Press: Tokyo, Japan, 1991; p. 437. [Google Scholar]
  18. Ian, A.; Uda, S. Morphological Characteristics of the Earthquake Surface Ruptures on Awaji Island, Associated with the 1995 Southern Hyogo Prefecture Earthquake. Isl. Arc. 1996, 5, 1–15. [Google Scholar] [CrossRef]
  19. Lin, A. Late Pleistocene-Holocene Activity and Paleoseismicity of the Nojima Fault in the Northern Awaji Island, Southwest Japan. Tectonophysics 2018, 747–748, 402–415. [Google Scholar] [CrossRef]
  20. Mizuno, K.; Hattori, H.; Sangawa, A.; Takahashi, Y. Geology of the Akashi District; Geological Survey of Japan: Tsukuba, Japan, 1990; 90p. [Google Scholar]
  21. Sawakuchi, A.O.; Mendes, V.R.; Pupim, F.D.N.; Mineli, T.D.; Ribeiro, L.M.A.L.; Zular, A.; Guedes, C.C.F.; Giannini, P.C.F.; Nogueira, L.; Sallun Filho, W.; et al. Optically Stimulated Luminescence and Isothermal Thermoluminescence Dating of High Sensitivity and Well Bleached Quartz from Brazilian Sediments: From Late Holocene to beyond the Quaternary? Braz. J. Geol. 2016, 46, 209–226. [Google Scholar] [CrossRef]
  22. Takeuchi, A.; Nagahama, H.; Hashimoto, T. Surface Resetting of Thermoluminescence in Milled Quartz Grains. Radiat. Meas. 2006, 41, 826–830. [Google Scholar] [CrossRef]
  23. Buylaert, J.P.; Murray, A.S.; Huot, S.; Vriend, M.G.A.; Vandenberghe, D.; De Corte, F.; Van den haute, P. A Comparison of Quartz OSL and Isothermal TL Measurements on Chinese Loess. Radiat. Prot. Dosim. 2006, 119, 474–478. [Google Scholar] [CrossRef] [PubMed]
  24. Huot, S.; Buylaert, J.-P.; Murray, A.S. Isothermal Thermoluminescence Signals from Quartz. Radiat. Meas. 2006, 41, 796–802. [Google Scholar] [CrossRef]
  25. Tribolo, C.; Mercier, N. Toward a SAR-ITL Protocol for the Equivalent Dose Estimate of Burnt Quartzites. Anc. TL 2012, 30, 17–25. [Google Scholar]
  26. Mejdahl, V.; Bøtter-Jensen, L. Luminescence Dating of Archaeological Materials Using a New Technique Based on Single Aliquot Measurements. Quat. Sci. Rev. 1994, 13, 551–554. [Google Scholar] [CrossRef]
  27. Huntley, D.J.; Baril, M.R. The K Content of the K-Feldspars Being Measured in Optical Dating or in Thermoluminescence Dating. Anc. TL 1997, 15, 11–13. [Google Scholar]
  28. Huntley, D.J.; Hancock, R.G.V. The Rb Contents of the K-Feldspars Being Measured in Optical Dating. Anc. TL 2001, 19, 43–46. [Google Scholar]
  29. Zhao, H.; Li, S.-H. Internal Dose Rate to K-Feldspar Grains from Radioactive Elements Other than Potassium. Radiat. Meas. 2005, 40, 84–93. [Google Scholar] [CrossRef]
  30. Li, B.; Li, S.-H.; Wintle, A. Overcoming Environmental Dose Rate Changes in Luminescence Dating of Waterlain Deposits. Geochronometria 2008, 30, 33–40. [Google Scholar] [CrossRef]
  31. Mejdahl, V. Internal Radioactivity in Quartz and Feldspar Grains. Anc. TL 1987, 5, 10–17. [Google Scholar]
  32. Buylaert, J.-P.; Huot, S.; Murray, A.S.; Van Den Haute, P. Infrared Stimulated Luminescence Dating of an Eemian (MIS 5e) Site in Denmark Using K-Feldspar: IRSL Dating of an Eemian Site Using K-Feldspar. Boreas 2011, 40, 46–56. [Google Scholar] [CrossRef]
  33. Sohbati, R.; Murray, A.S.; Buylaert, J.-P.; Ortuño, M.; Cunha, P.P.; Masana, E. Luminescence Dating of Pleistocene Alluvial Sediments Affected by the Alhama de Murcia Fault (Eastern Betics, Spain)—A Comparison between OSL, IRSL and Post-IRIRSL Ages: Luminescence Dating of Pleistocene Alluvial Sediments. Boreas 2012, 41, 250–262. [Google Scholar] [CrossRef]
  34. Tsakalos, E.; Christodoulakis, J.; Charalambous, L. The Dose Rate Calculator (DRc) for Luminescence and ESR Dating-a Java Application for Dose Rate and Age Determination: The Dose Rate Calculator (DRc). Archaeometry 2016, 58, 347–352. [Google Scholar] [CrossRef]
  35. Stokes, S.; Ingram, S.; Aitken, M.J.; Sirocko, F.; Anderson, R.; Leuschner, D. Alternative Chronologies for Late Quaternary (Last Interglacial–Holocene) Deep Sea Sediments via Optical Dating of Silt-Sized Quartz. Quat. Sci. Rev. 2003, 22, 925–941. [Google Scholar] [CrossRef]
  36. Lai, Z.P.; Zöller, L.; Fuchs, M.; Brückner, H. Alpha Efficiency Determination for OSL of Quartz Extracted from Chinese Loess. Radiat. Meas. 2008, 43, 767–770. [Google Scholar] [CrossRef]
  37. Balescu, S.; Ritz, J.-F.; Lamothe, M.; Auclair, M.; Todbileg, M. Luminescence Dating of a Gigantic Palaeolandslide in the Gobi-Altay Mountains, Mongolia. Quat. Geochronol. 2007, 2, 290–295. [Google Scholar] [CrossRef]
  38. Krbetschek, M.R.; Rieser, U.; Zöller, L.; Heinicke, J. Radioactive Disequilibria in Palaeodosimetric Dating of Sediments. Radiat. Meas. 1994, 23, 485–489. [Google Scholar] [CrossRef]
  39. Olley, J.M.; Murray, A.; Roberts, R.G. The Effects of Disequilibria in the Uranium and Thorium Decay Chains on Burial Dose Rates in Fluvial Sediments. Quat. Sci. Rev. 1996, 15, 751–760. [Google Scholar] [CrossRef]
  40. Galbraith, R.F.; Roberts, R.G.; Laslett, G.M.; Yoshida, H.; Olley, J.M. Optical Dating of Single and Multiple Grains of Quartz from Jinmium Rock Shelter, Northern Australia: Part I, Experimental Design and Statistical Models. Archaeometry 1999, 41, 339–364. [Google Scholar] [CrossRef]
  41. Wintle, A.G.; Murray, A.S. A Review of Quartz Optically Stimulated Luminescence Characteristics and Their Relevance in Single-Aliquot Regeneration Dating Protocols. Radiat. Meas. 2006, 41, 369–391. [Google Scholar] [CrossRef]
Figure 1. Maps of the study area, showing the main geology and active faults. (a) The study area, (b) geological map of the north Awaji Island (adapted from Mizuno et al. [20] and Lin and Nishiwaki [15]), (c) location of the Nojima fault drilling site, and (d) geologic profile (modified from Lin and Nishiwaki [15]). Data on active faults are from the Research Group for Active Faults of Japan [17]; data on the 1995 surface-rupture zone was taken from Lin and Uda [18].
Geosciences 14 00099 g001
Figure 2. Sketch and photograph showing the core (NFD-1-S1-②) retrieved from the 506–507 m depth of the NFZ, which contained fault gouge, breccia, and cataclasite (taken from Tsakalos et al. [16]). Codes (CAT-01, BR-01 to BR-03, G-01 to G-14, and GB-15) correspond to cataclasite, breccia, and gouge samples used in the OSL study by Tsakalos et al. [16]. The selection of samples for ITL dating (this study) was based on the availability of the remaining mineral grains after chemical treatment as well as any quantity left after OSL dating.
Geosciences 14 00099 g002
Figure 3. Preheat/dose recovery (given/measured dose ratios) of fine-grained quartz (NFD-1-S1-②-G-06) and medium-grained feldspar (NFD-1-S1-②-G-08) samples. The ITL signal of five aliquots from each sample was zeroed by heat (450 °C for 1 h), and a fixed beta dose of 200 Gy was subsequently given. ITL measurements were then conducted at different temperatures (from 270 to 350 °C, in 20 °C steps). The black solid line has a value of 1.0, and the black dotted lines are the acceptability limits (0.9 and 1.1).
Geosciences 14 00099 g003
Figure 4. Dose recovery (given/measured dose ratios) of fine-grained quartz (NFD-1-S1-②-G-06) and medium-grained feldspar (NFD-1-S1-②-G-08) samples. Aliquots of both quartz and feldspar (five aliquots for each sample) were first bleached for 4 h in the sun, and a laboratory dose of 200 Gy was given; then, the aliquots were measured using the SAR-ITL protocol. The dash-dotted and dashed lines are the mean given/measured dose ratios of NFD-1-S1-②-G-06 and NFD-1-S1-②-G-08 samples, respectively. The black solid line represents a value of 1.0, and the black dotted lines are the “acceptability” limits (0.9 and 1.1).
Geosciences 14 00099 g004
Figure 5. ITL growth curve of sample NFD-1-S1-②-G-08 (medium-grained feldspar) using the SARA procedure. The calculated DE values (dots) are plotted as a function of the added doses. An extrapolation to the dose-axis DE value is then calculated.
Geosciences 14 00099 g005
Figure 6. Dose recovery (given/measured dose ratios) of sample NFD-1-S1-②-G-08 (medium-grained feldspar) using the SARA-ITL procedure. A dot represents the ratio of the given/measured (recovered) dose using four aliquots, each with a different added dose. The dashed line is the mean given/measured dose ratio. The black solid line represents a value of 1.0, and the black dotted lines are the “acceptability limits” (0.9 and 1.1).
Geosciences 14 00099 g006
Figure 7. Dose-response growth and luminescence decay curves for the SAR-ITL signal at 310 °C for (a) a fine-grain (4–11 μm) quartz (sample NFD-1-S1-②-G-12) and (b) a medium (80–125 μm) feldspar (sample NFD-1-S1-②-G-08) aliquot.
Geosciences 14 00099 g007
Figure 8. Comparison between ITL (this study) and OSL (cited from Tsakalos et al. [16]) ages of the Nojima fault-gouge samples.
Geosciences 14 00099 g008
Table 1. The SAR-ITL protocol.
StepTreatment
1Give dose, Di (1)
2Heat to 310 °C, hold for 300 s
3Give test dose, Dt (2)
4Heat to 310 °C, hold for 300 s
5Return to step 1
(1) Di = natural dose; (2) Dt = fixed test dose.
Table 2. Sample IDs, material used, grain size, radioelement content, moisture concentration, and calculated dose rates.
Sample IDMaterialGrain Size (μm)U
(ppm)
Th
(ppm)
K
(wt %)
Rb
(ppm)
Water (wt%)Dose Rate (Gy/ka)
External αβγTotal Dose Rate
NFD-1-S1-②-G-06 (a)Gouge/quartz4–114.3112.7122.27.30.63 ± 0.232.86 ± 0.211.55 ± 0.095.03 ± 0.32
NFD-1-S1-②-G-06 (b)Gouge/feldspar80–1254.3112.7122.27.30.19 ± 0.063.22 ± 0.241.55 ± 0.094.95 ± 0.25
NFD-1-S1-②-G-08 (a)Gouge/quartz4–113.210.12.92122.1130.47 ± 0.172.67 ± 0.211.35 ± 0.084.5 ± 0.28
NFD-1-S1-②-G-08 (b)Gouge/feldspar80–1253.210.12.92122.1130.17 ± 0.063.07 ± 0.231.35 ± 0.084.6 ± 0.25
NFD-1-S1-②-G-11 (b)Gouge/feldspar80–1253.711.42.93132.2160.18 ± 0.063.08 ± 0.231.42 ± 0.094.67 ± 0.25
NFD-1-S1-②-G-12 (a)Gouge/quartz4–113.410.93.04134.2100.53 ± 0.192.88 ± 0.221.47 ± 0.094.88 ± 0.31
NFD-1-S1-②-G-12 (b)Gouge/feldspar80–1253.410.93.04134.2100.18 ± 0.063.27 ± 0.241.47 ± 0.094.93 ± 0.26
(a) Dose rate cited from Tsakalos et al. [16]. (b) The internal beta dose rate was calculated based on an assumed K content of 12.5 ± 0.5% and an internal Rb content of 400 ± 100 ppm. An internal alpha contribution of 0.10 ± 0.05 Gy/ka from internal U and Th was also assumed.
Table 3. ITL DE values of Nojima fault-gouge samples and ITL ages.
Sample IDMaterialMineral Used Grain Size (μm)n of AliquotsDE (Gy)Overdispersion
(%)
Dr (Gy/ka)Age (ka)
NFD-1-S1--G-06GougeQuartz4–1115337.48 ± 7.315.65.03 ± 0.3267.09 ± 4.51
NFD-1-S1--G-06GougeFeldspar80–12518389.05 ± 5.9104.95 ± 0.2578.6 ± 4.15
NFD-1-S1--G-08GougeQuartz4–1118130.12 ± 3.48.64.5 ± 0.2828.92 ± 1.95
NFD-1-S1--G-08 (a)GougeFeldspar80–12532155.15 ± 10.0104.67 ± 0.2533.22 ± 2.79
NFD-1-S1--G-11 (a)GougeFeldspar80–1253266.15 ± 5.9322.234.93 ± 0.2613.42 ± 1.4
NFD-1-S1--G-12GougeQuartz4–111677.57 ± 3.3516.14.42 ± 0.2817.55 ± 1.35
NFD-1-S1--G-12 (a)GougeFeldspar80–12532121.53 ± 8.0604.6 ± 0.2526.42 ± 2.27
(a) SARA-ITL procedure.
Disclaimer/Publisher’s Note: The statements, opinions and data contained in all publications are solely those of the individual author(s) and contributor(s) and not of MDPI and/or the editor(s). MDPI and/or the editor(s) disclaim responsibility for any injury to people or property resulting from any ideas, methods, instructions or products referred to in the content.

