

Energy-Based Pore Pressure Generation Models in Silty Sands under Earthquake Loading


Abstract
:1. Introduction
2. Test Materials and Procedure
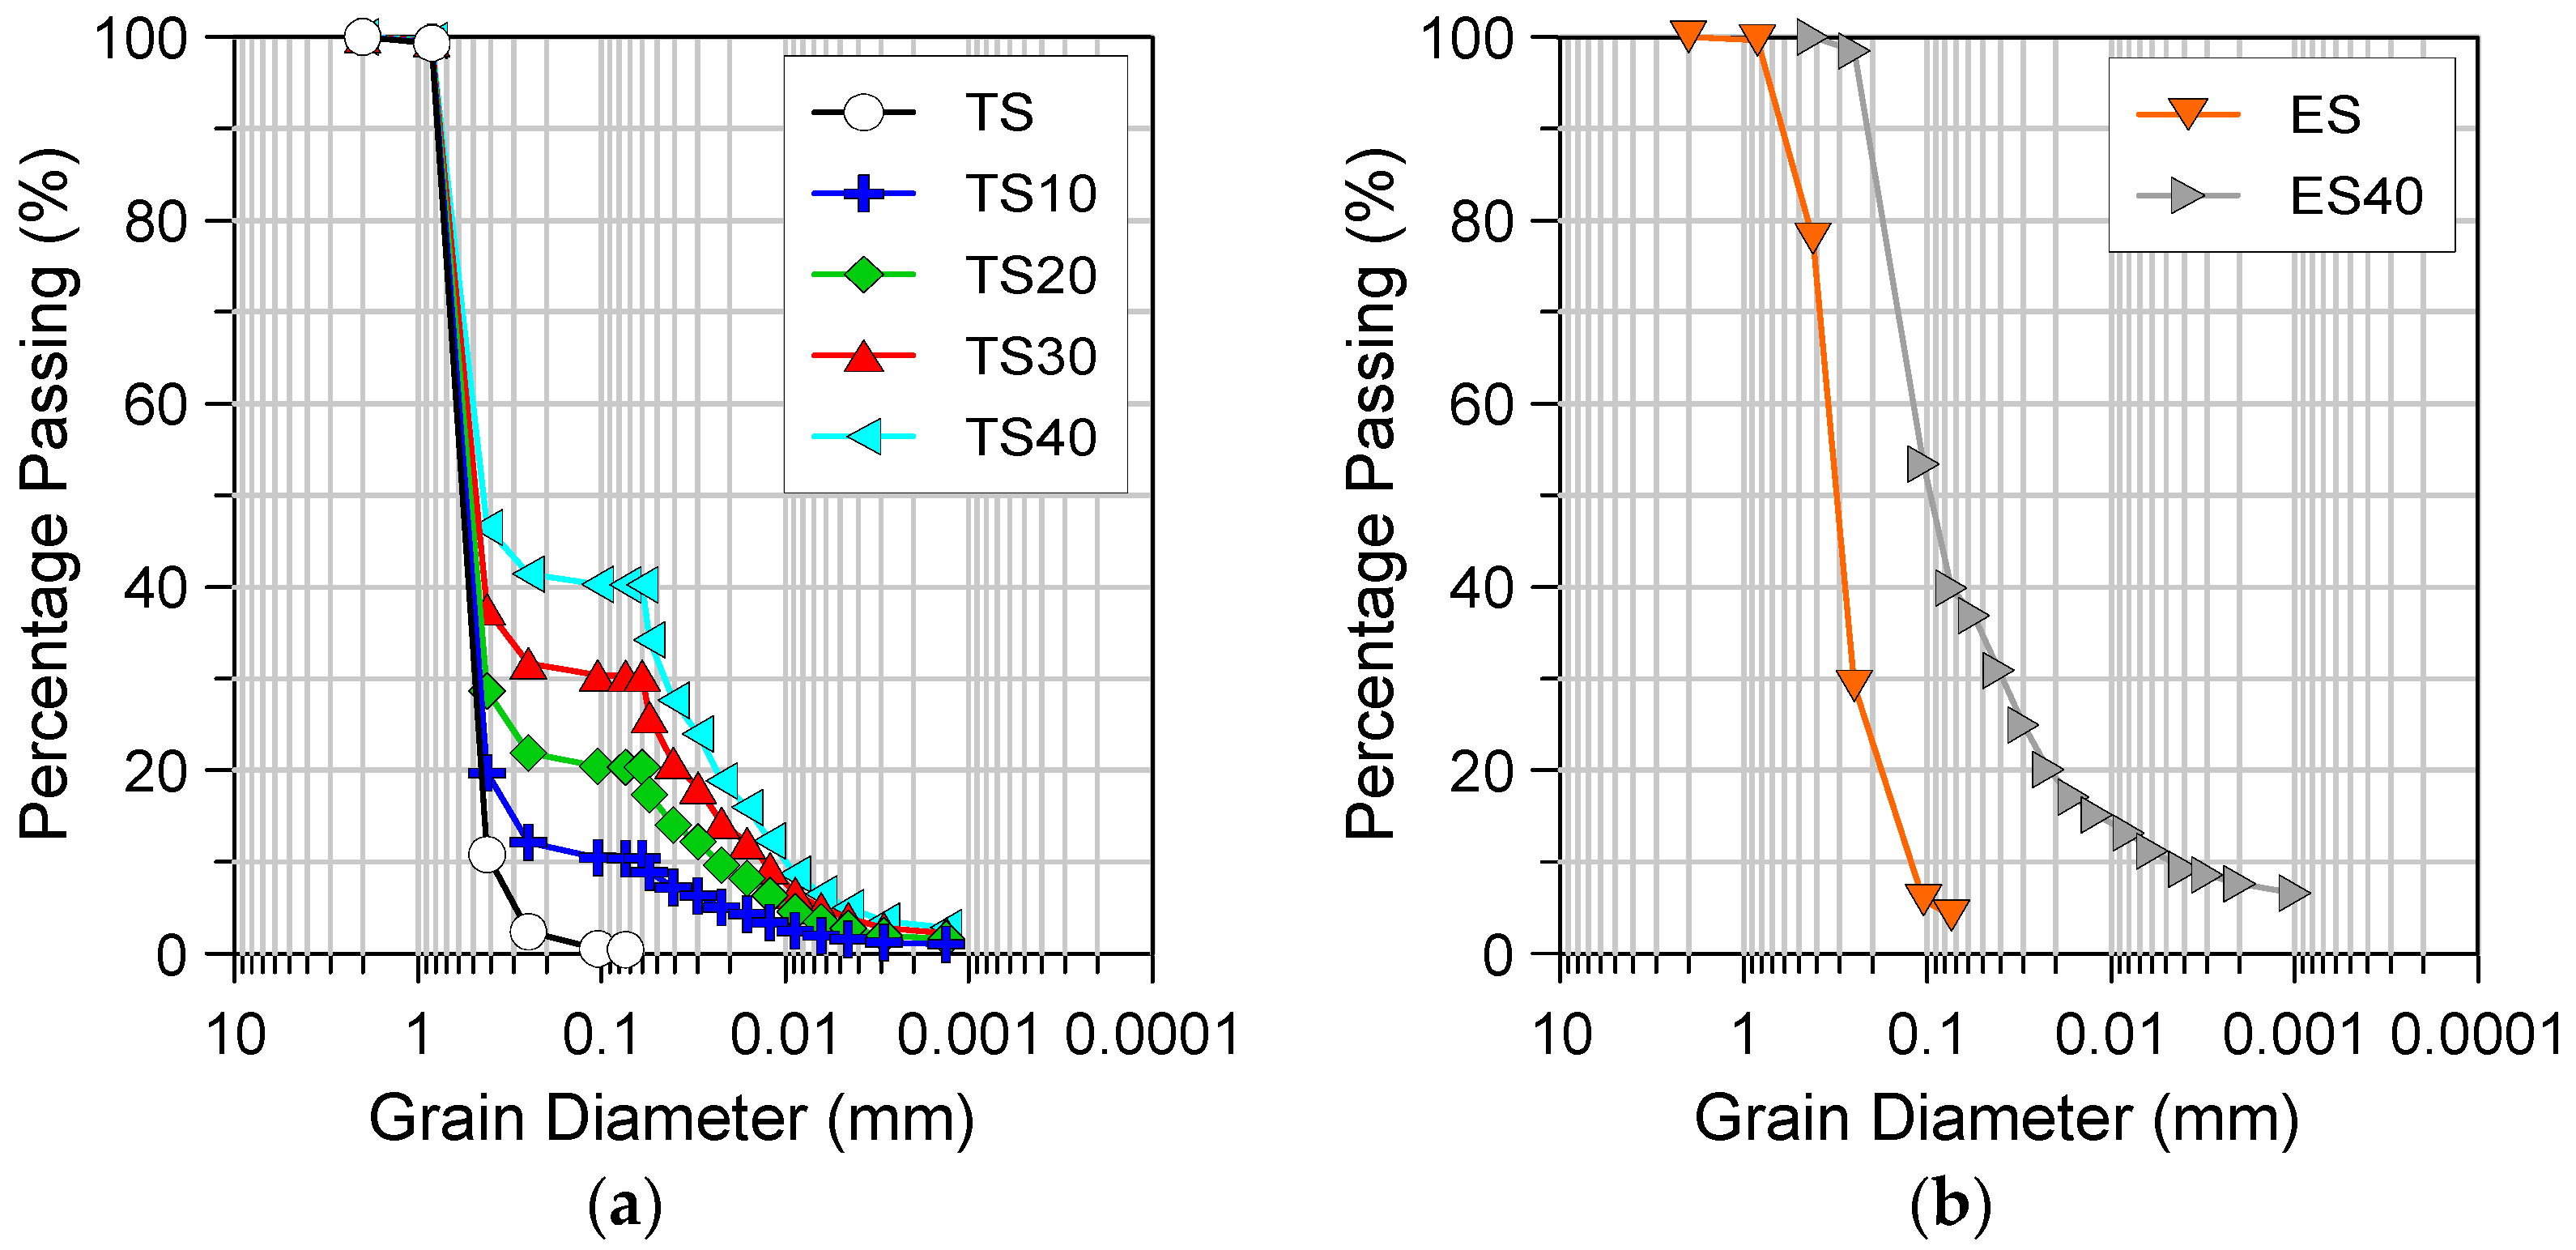
2.1. Test Materials
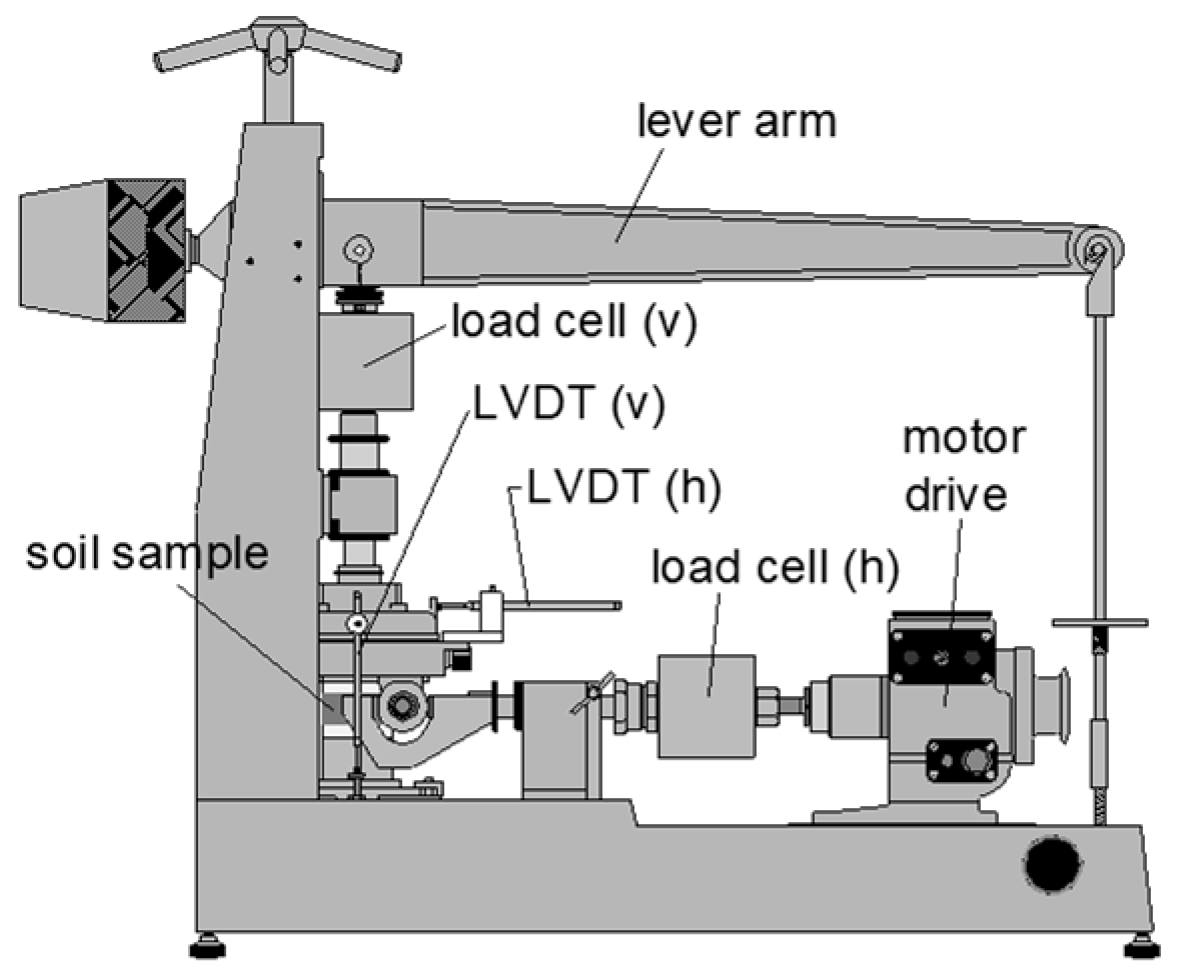
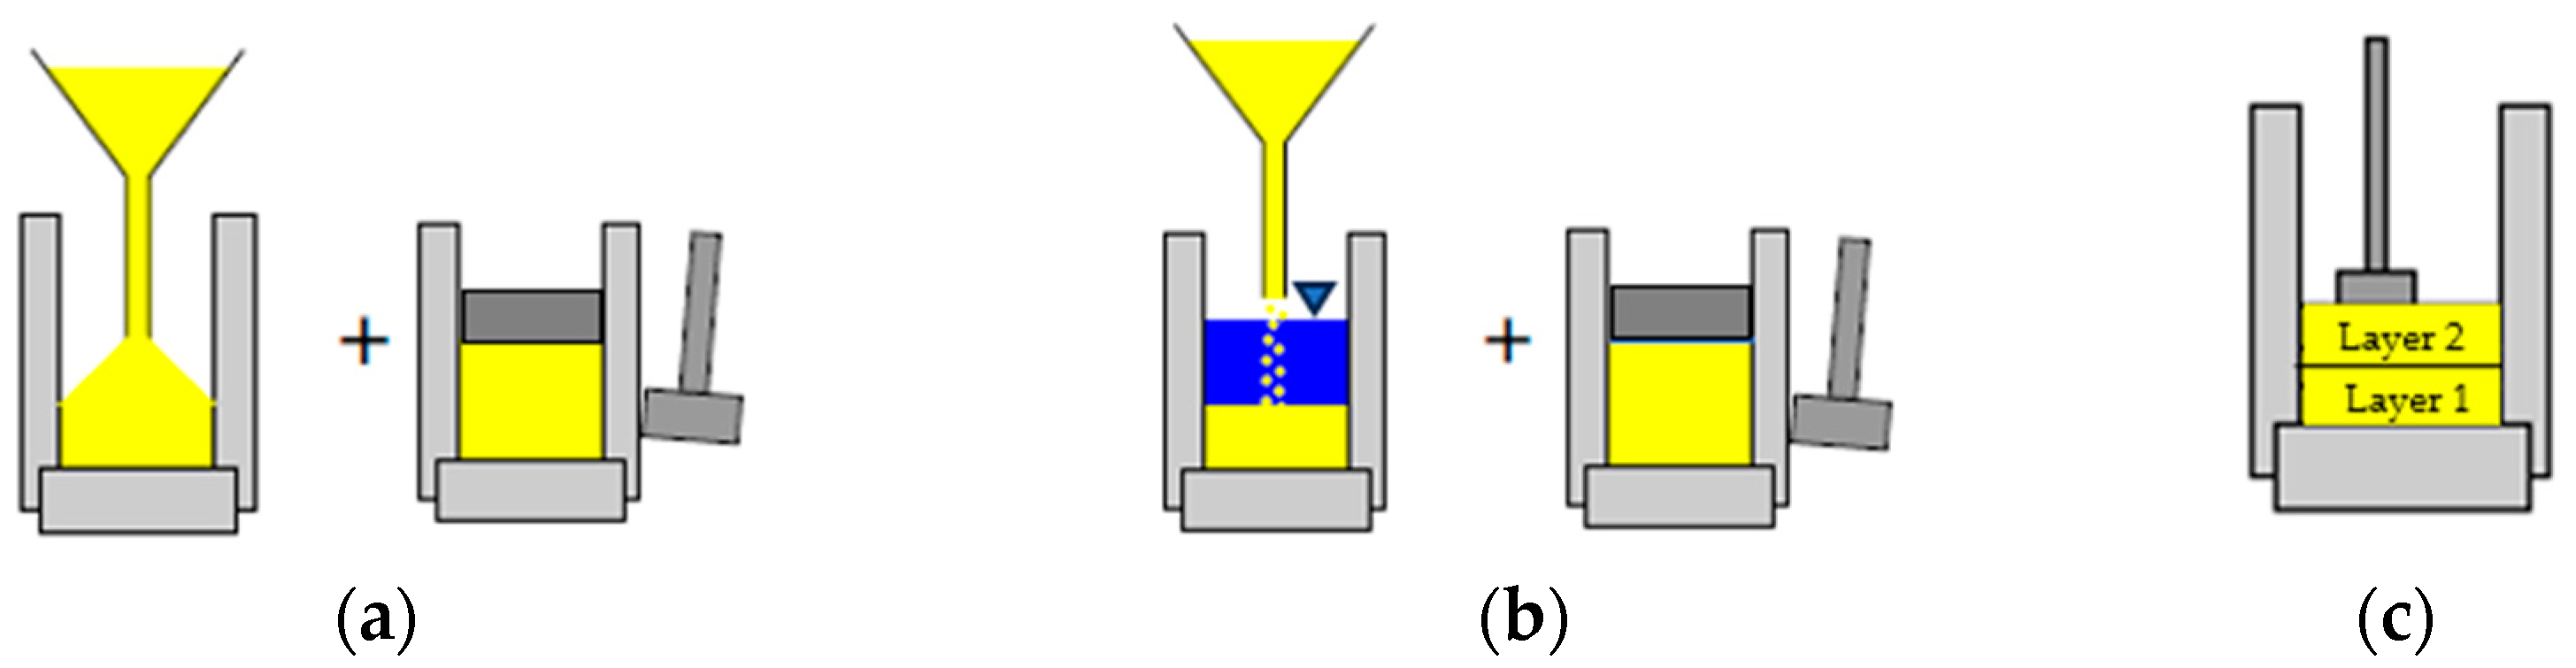
2.2. Test Procedure
3. Analysis of Test Results
3.1. Undrained Cyclic Simple-Shear Responses of Silty Sand Specimens
3.2. Key Factors Influencing Cyclic Excess Pore Water Pressure in Silty Sands Based on an Energy Approach
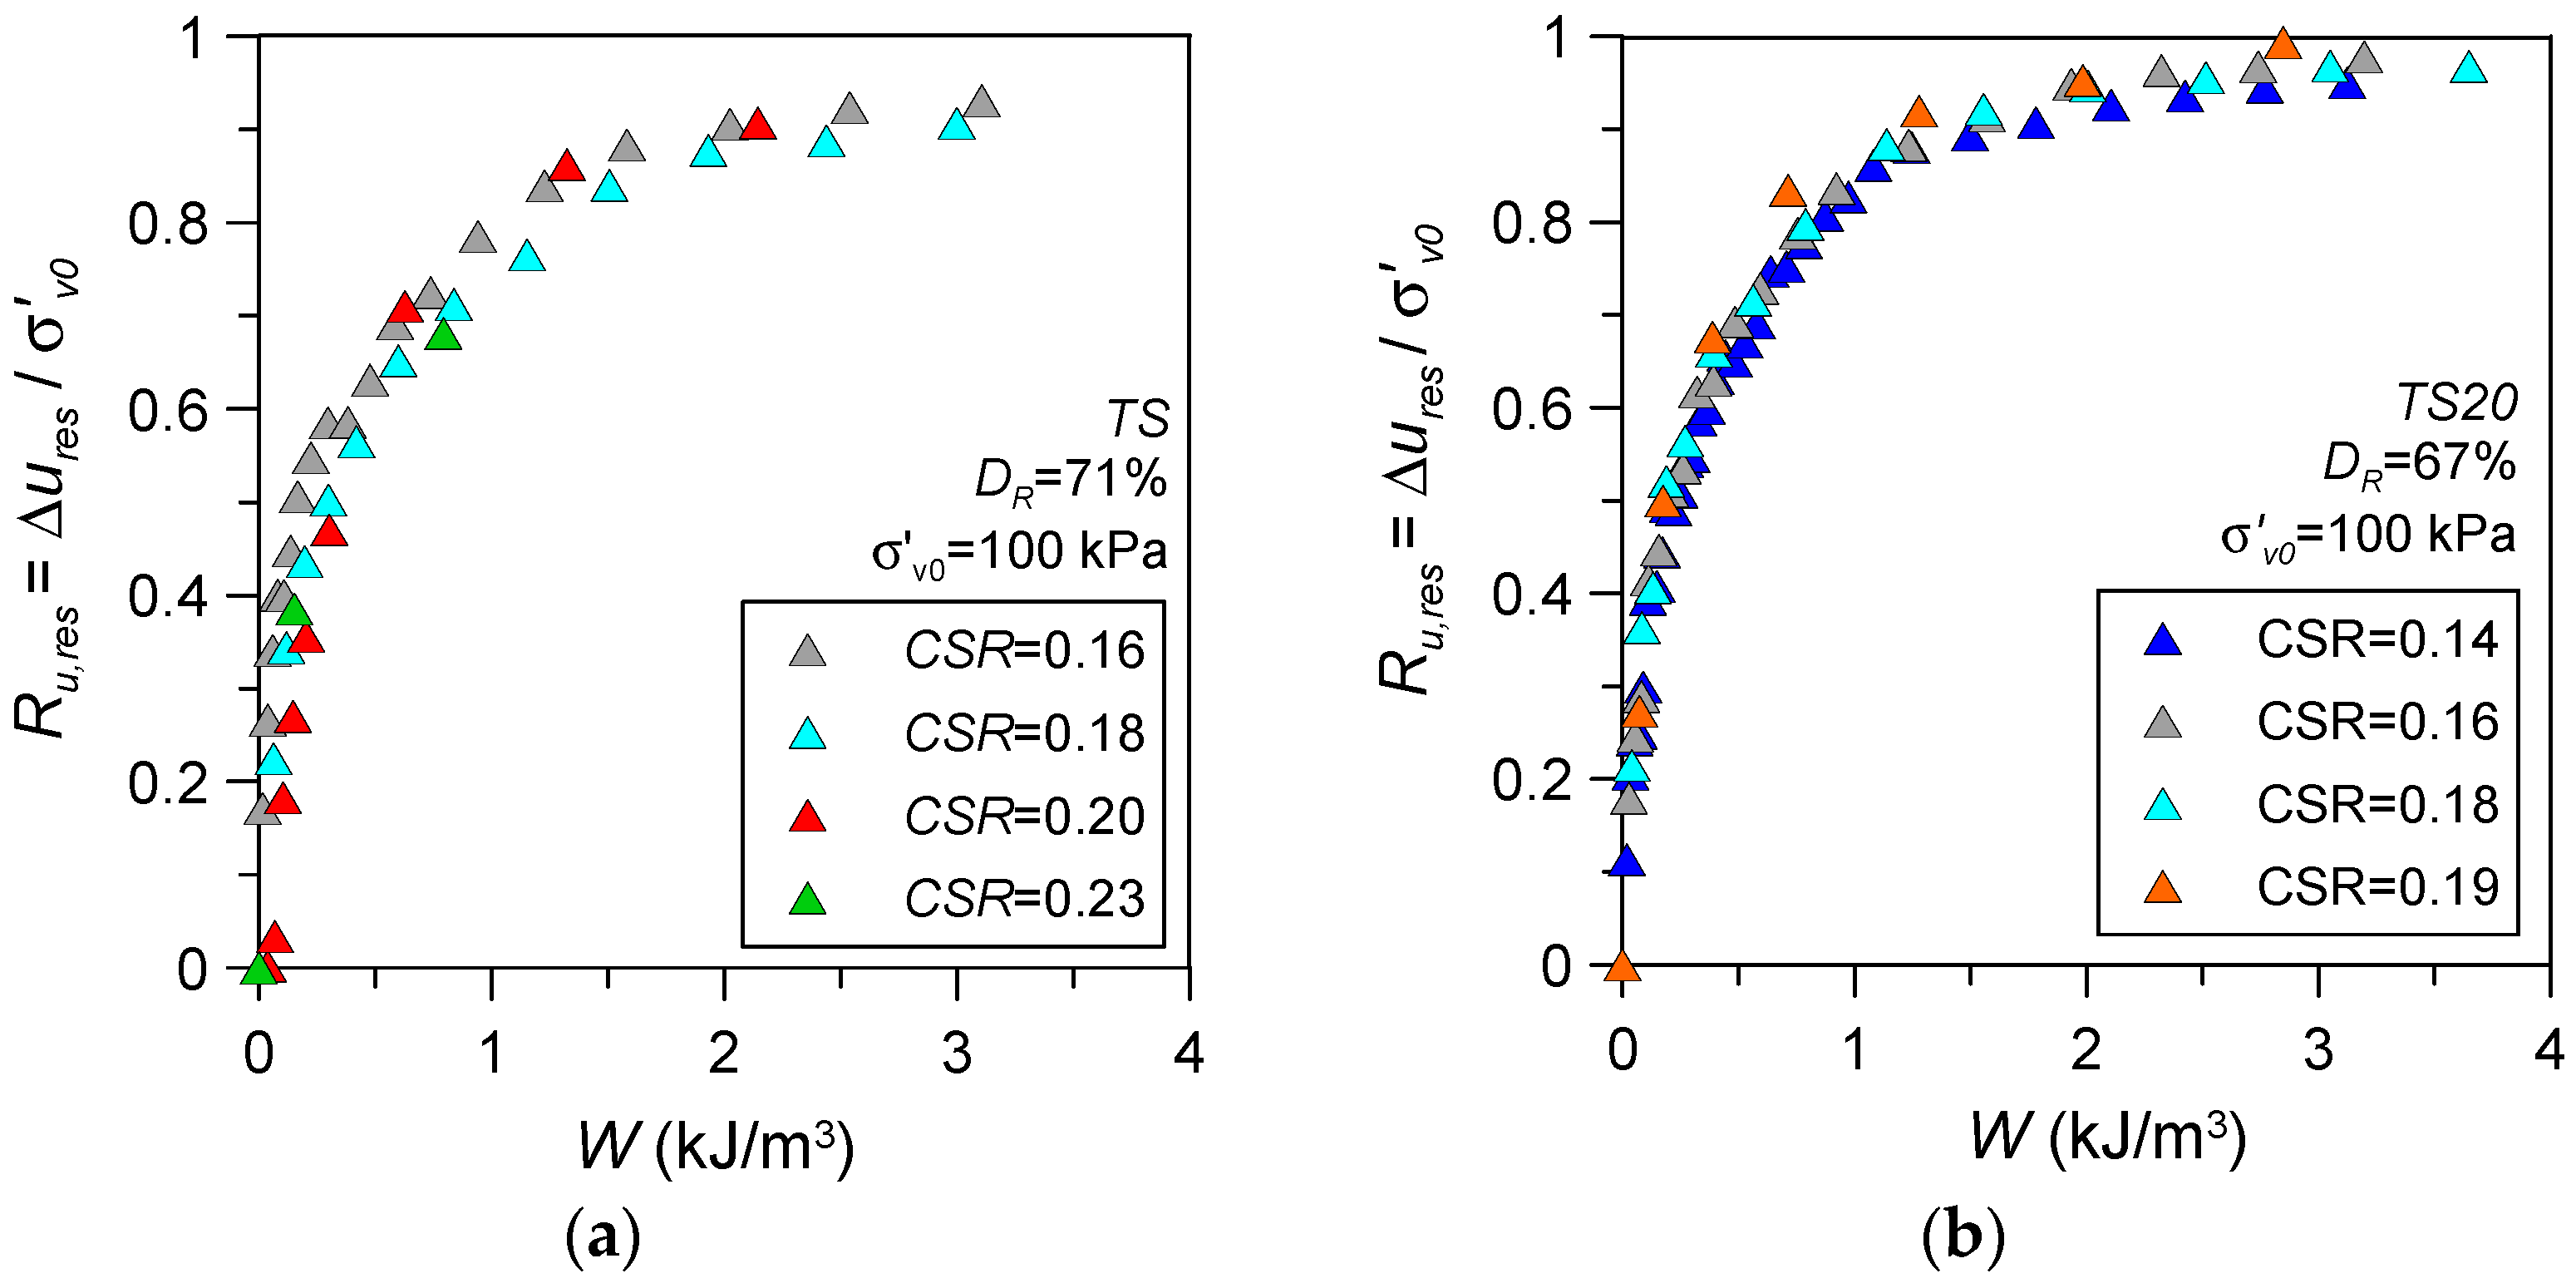
3.2.1. Influence of Applied Cyclic Stress Ratio
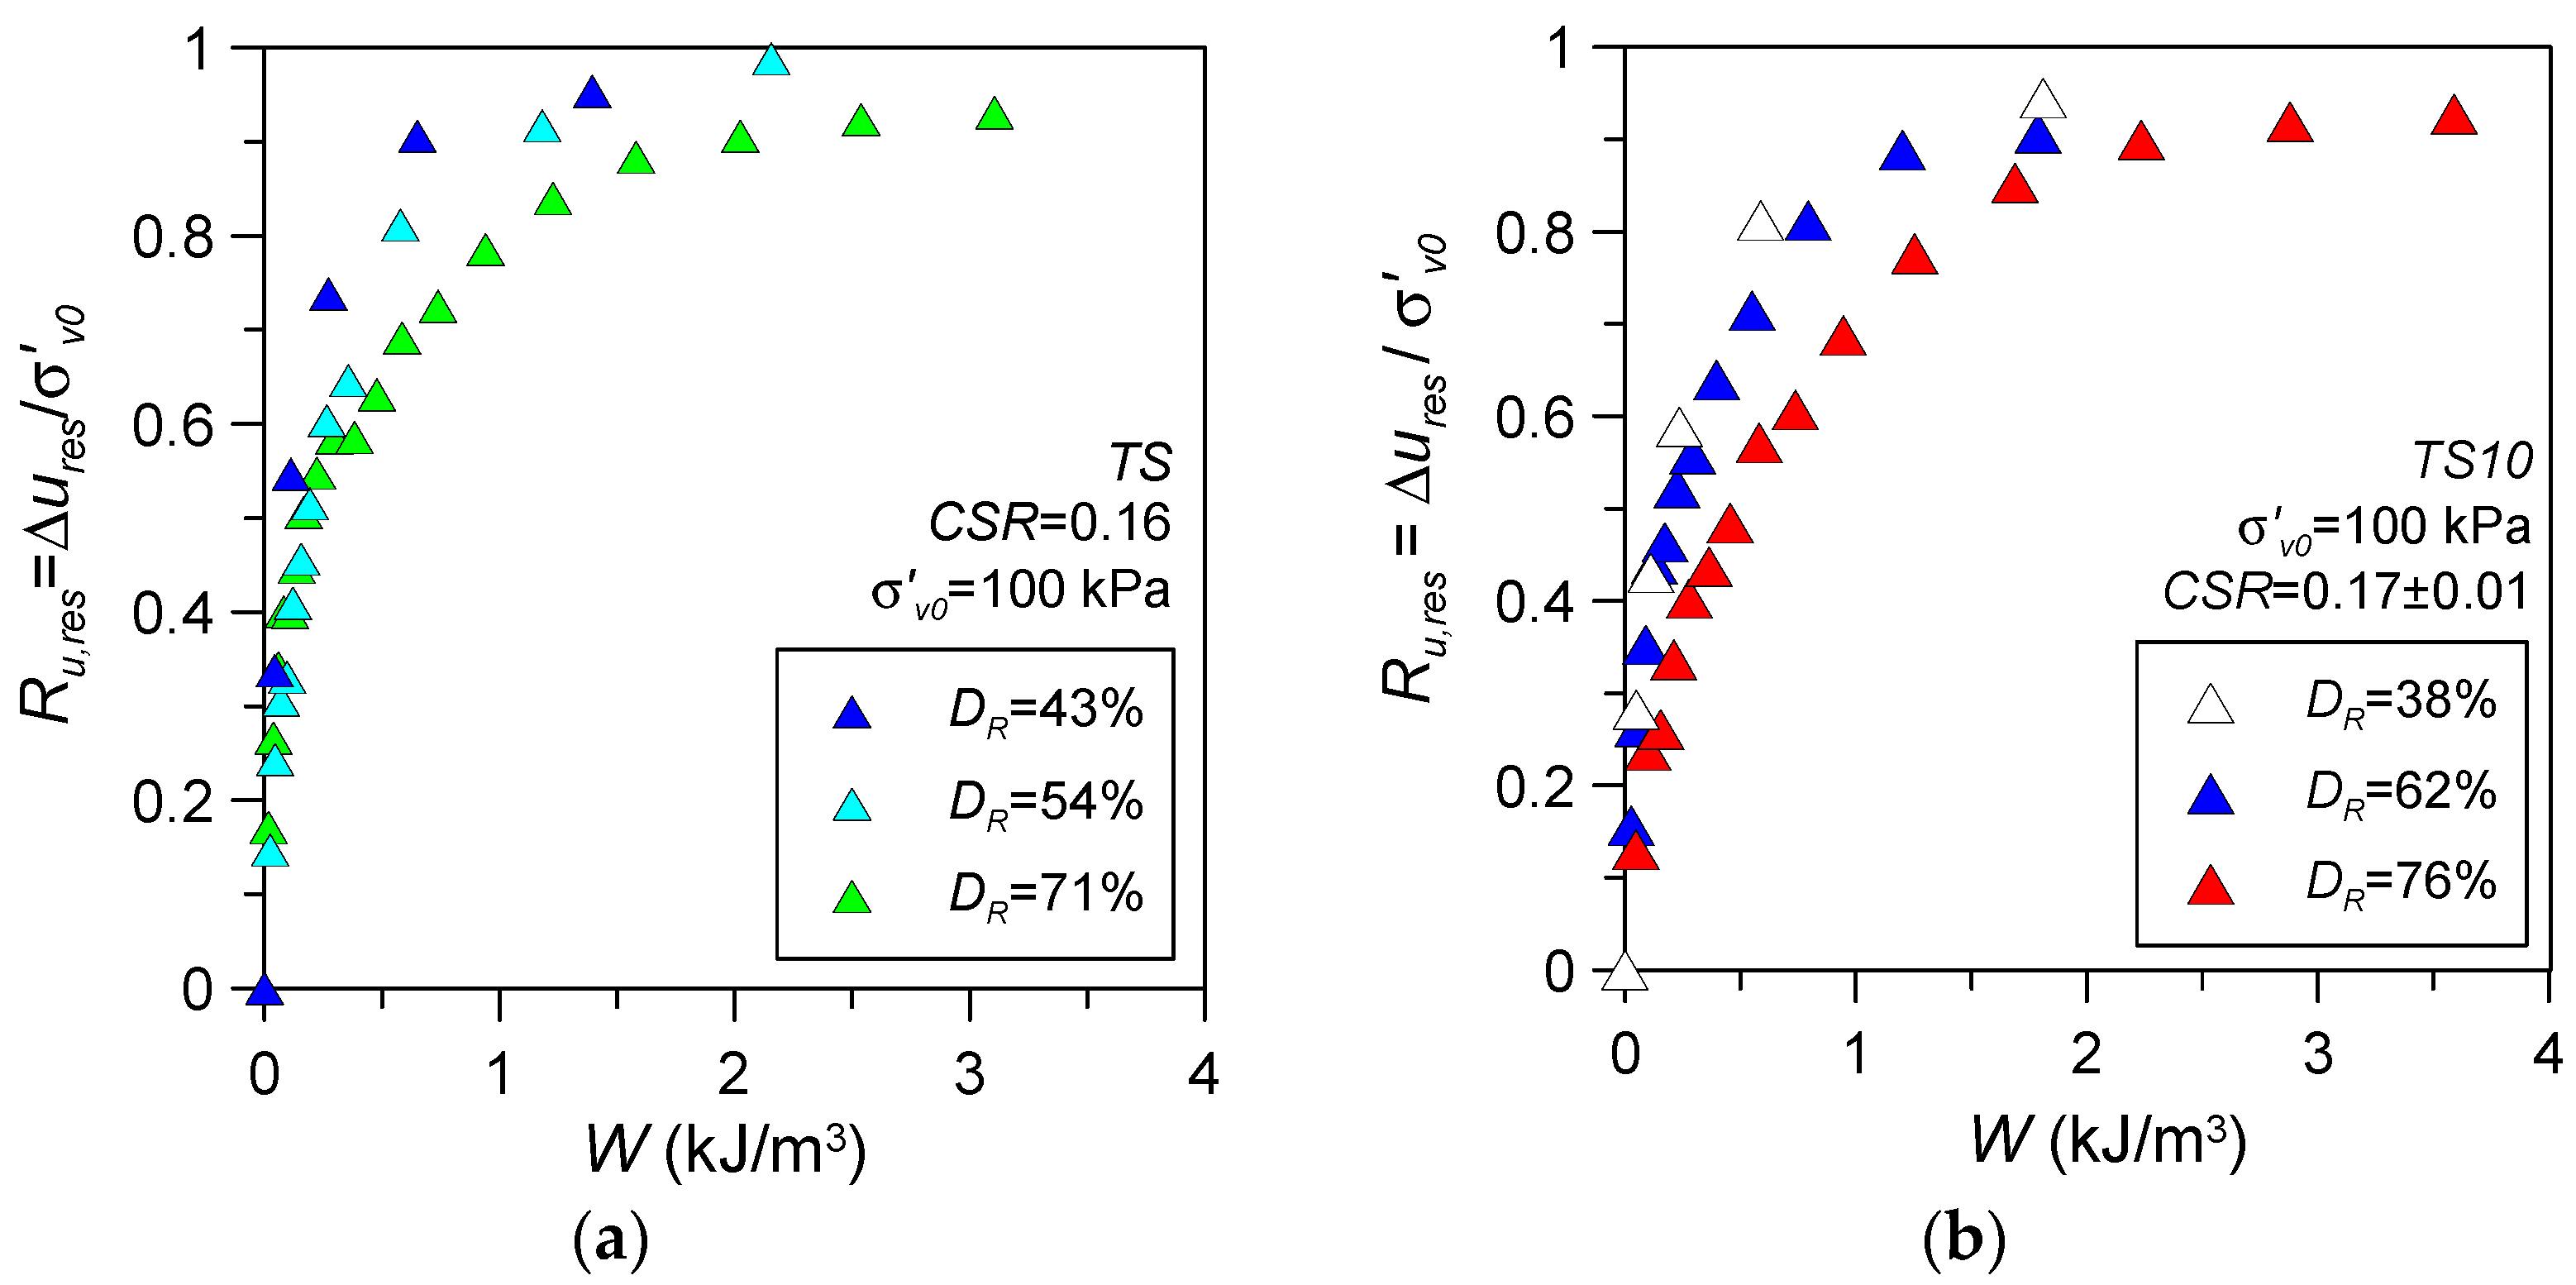
3.2.2. Influence of Fines Content and Packing Density
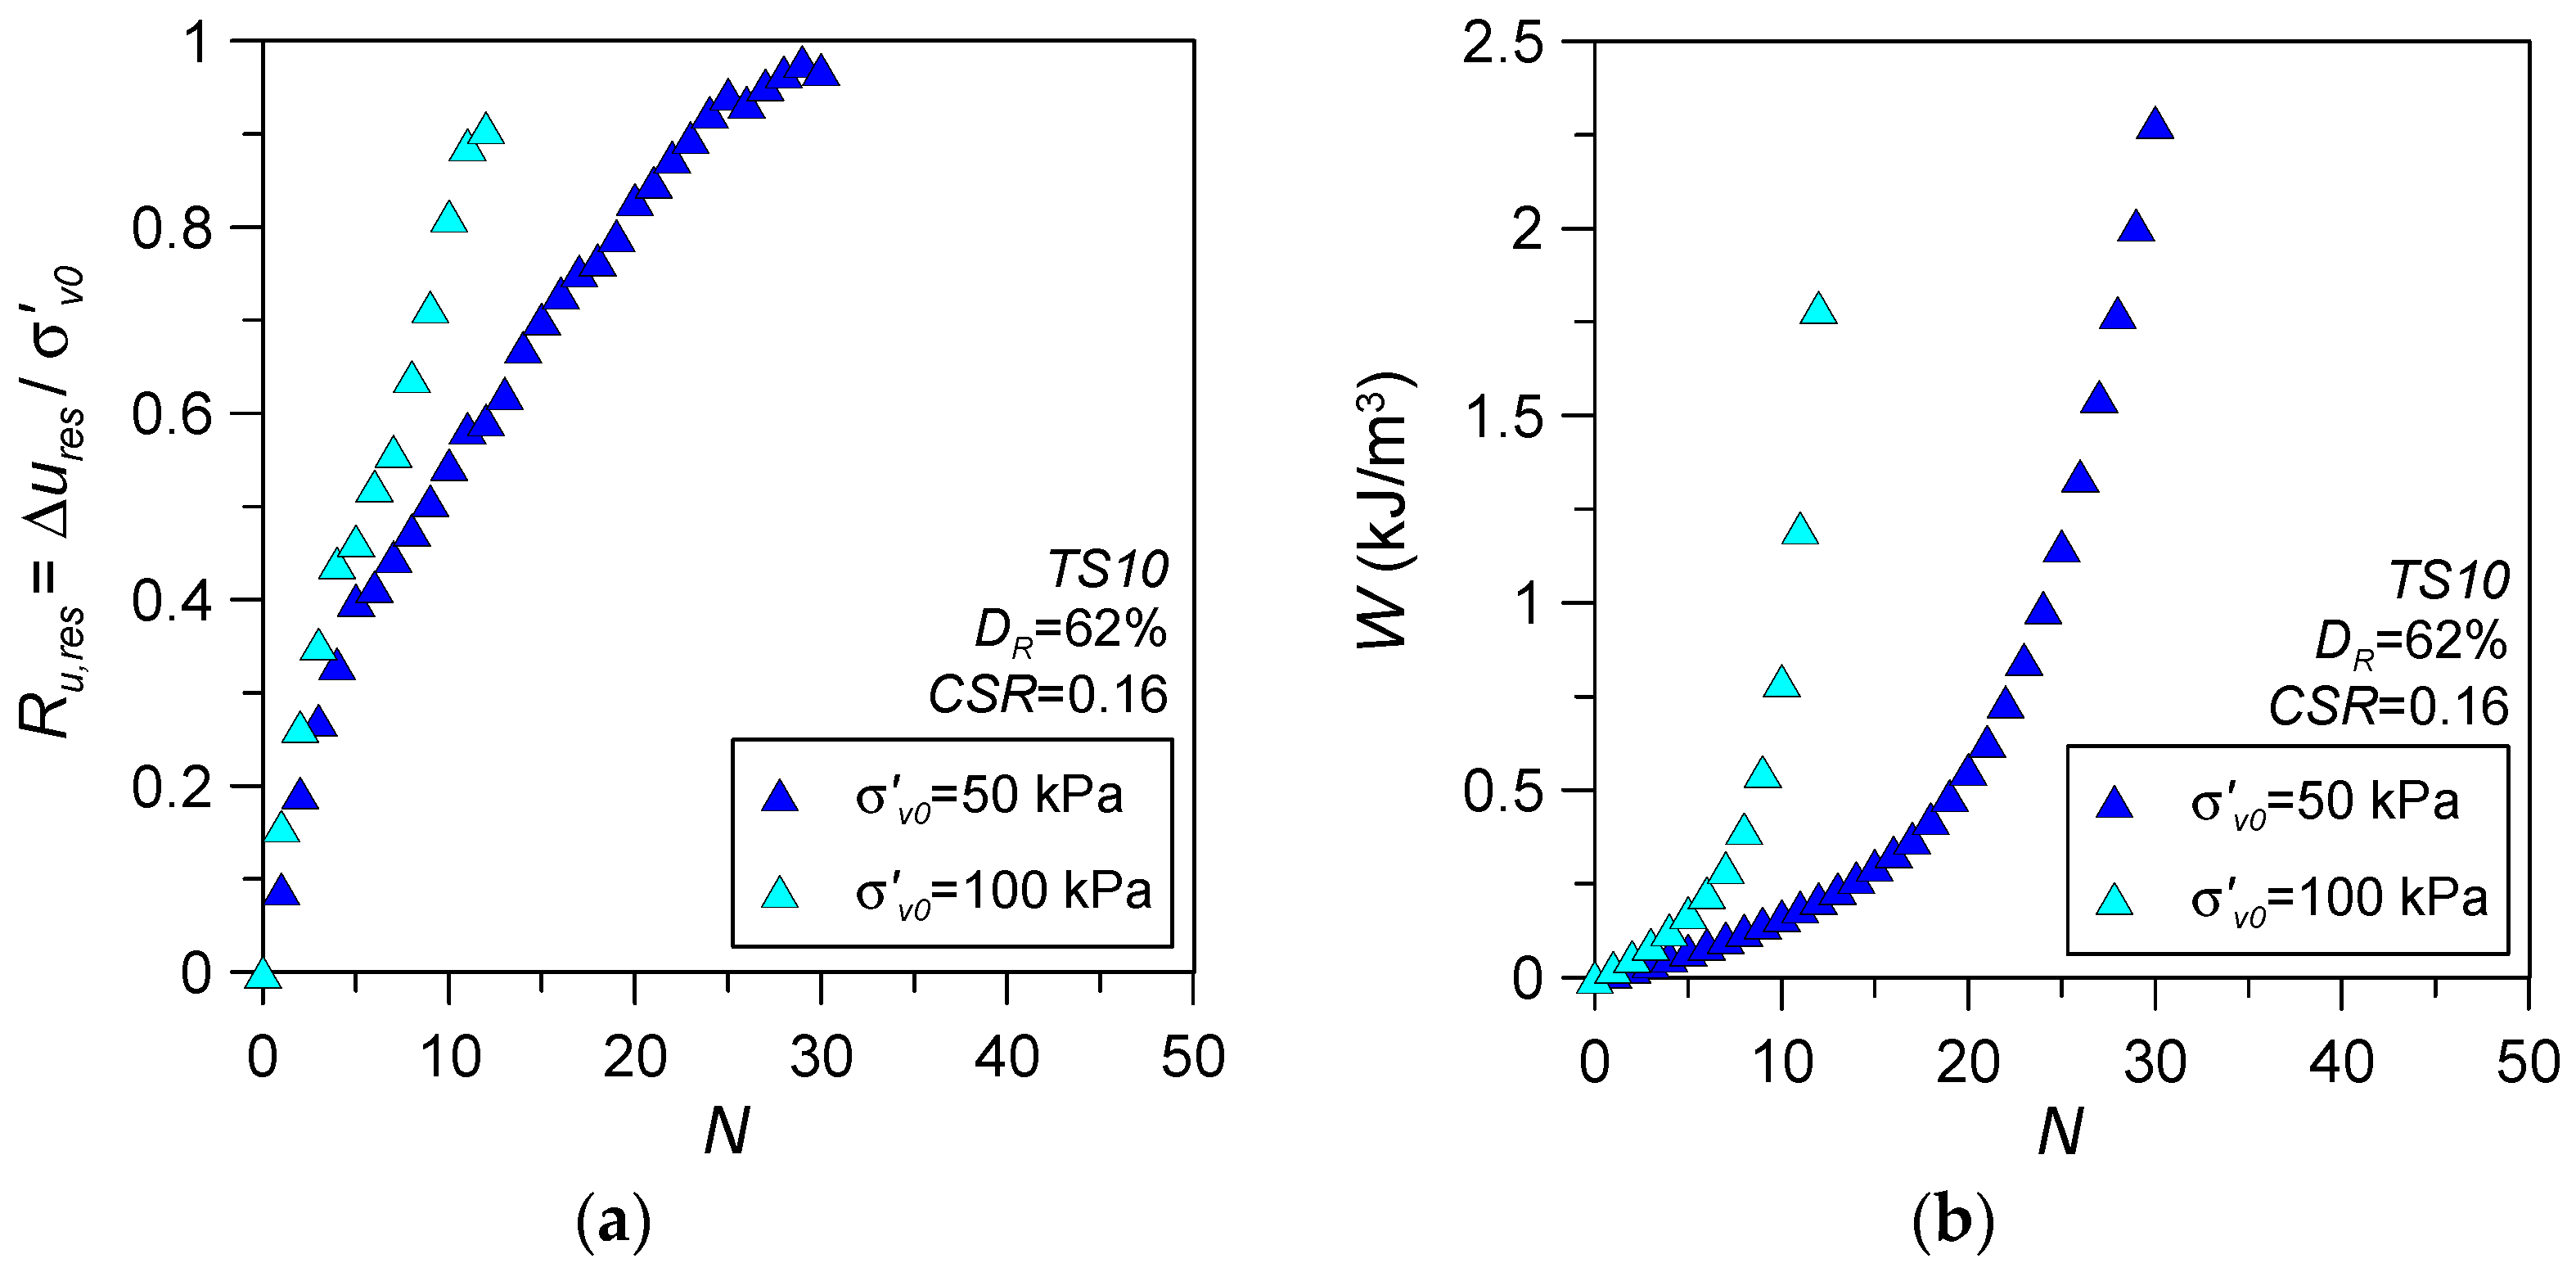
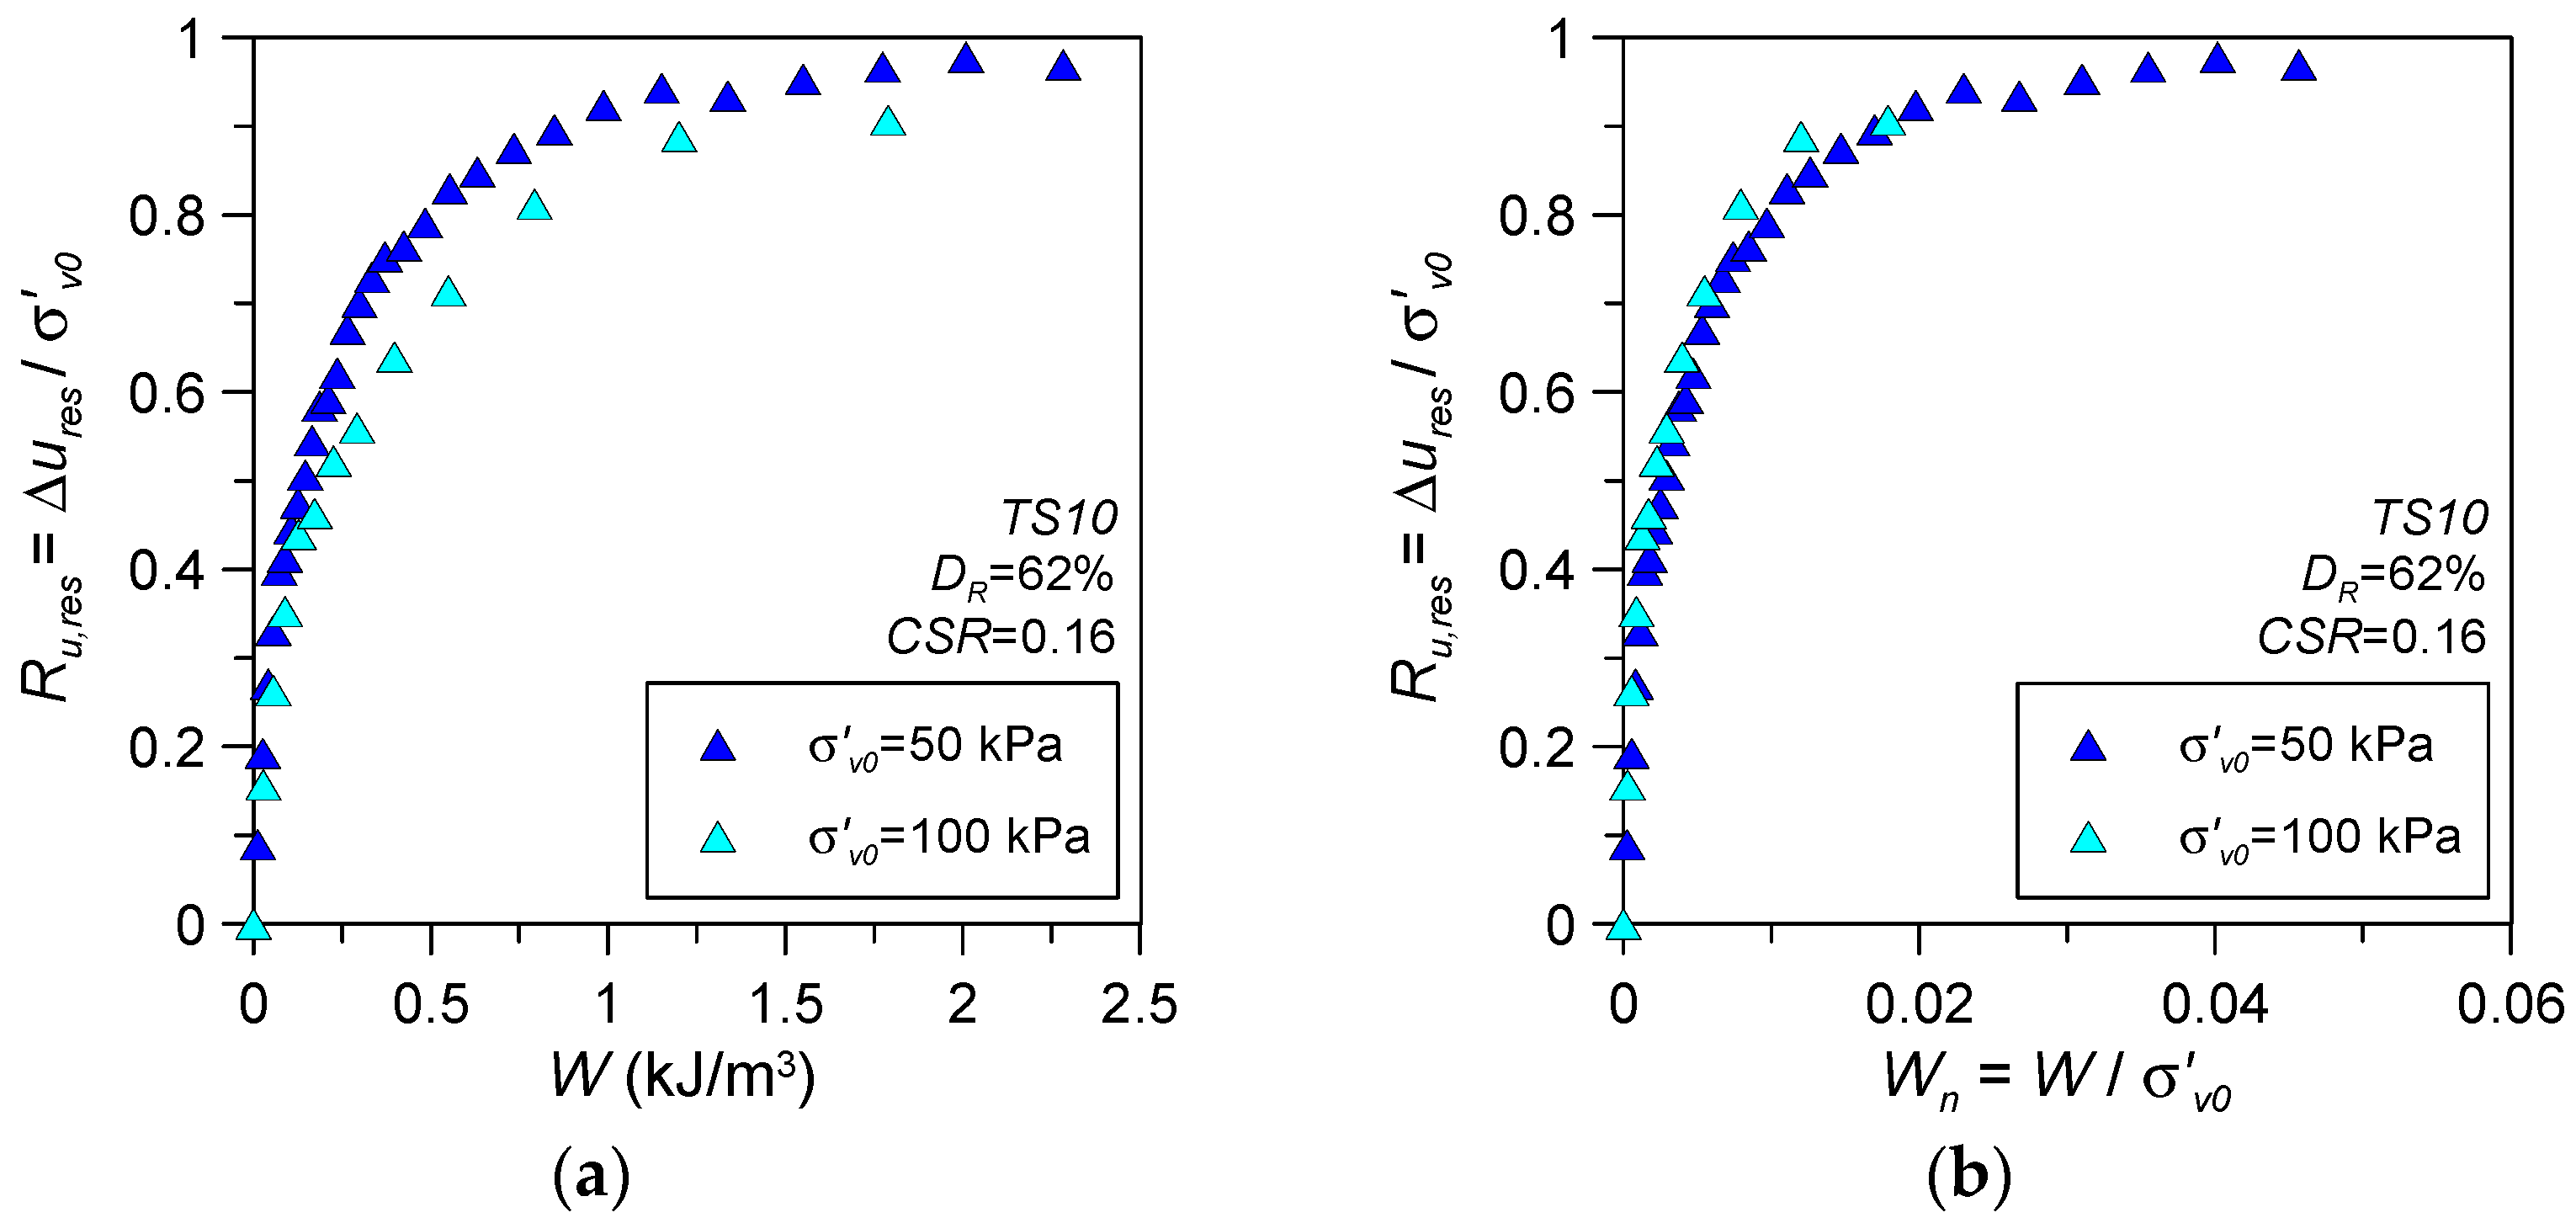
3.2.3. Influence of Vertical Effective Stress
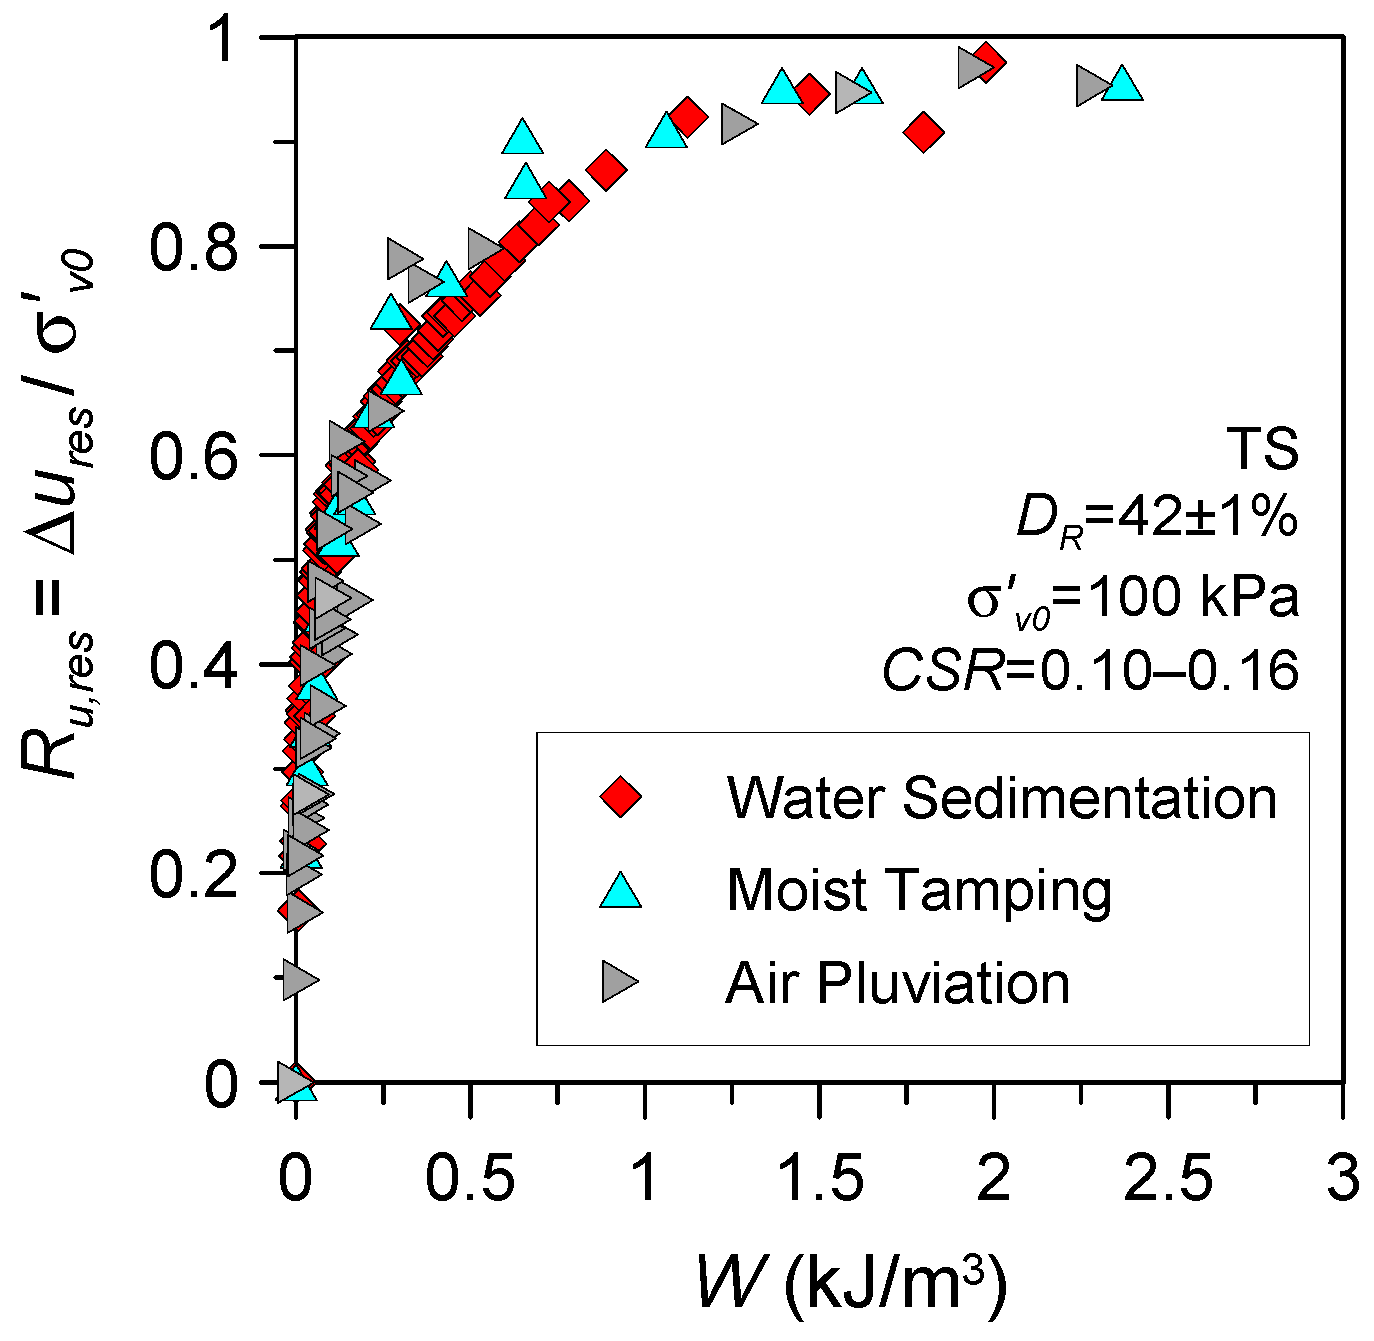
3.2.4. Influence of Initial Soil Fabric/Reconstitution Method
3.3. Modelling of Excess Pore Water Pressure Based on Energy Approach for Silty Sand and Validation
4. Conclusions
- Two types of undrained cyclic response were observed in clean sand and silty sand, namely cyclic mobility and flow failure. In both types of behaviour, the normalised cumulative dissipated energy and the excess pore water pressure ratio increased with increasing the applied number of cyclic loading, confirming that Ru and W are strongly linked. Notably, just before liquefaction conditions are reached (γSA = 3.75%) W increases abruptly, especially for specimens exhibiting a flow failure response.
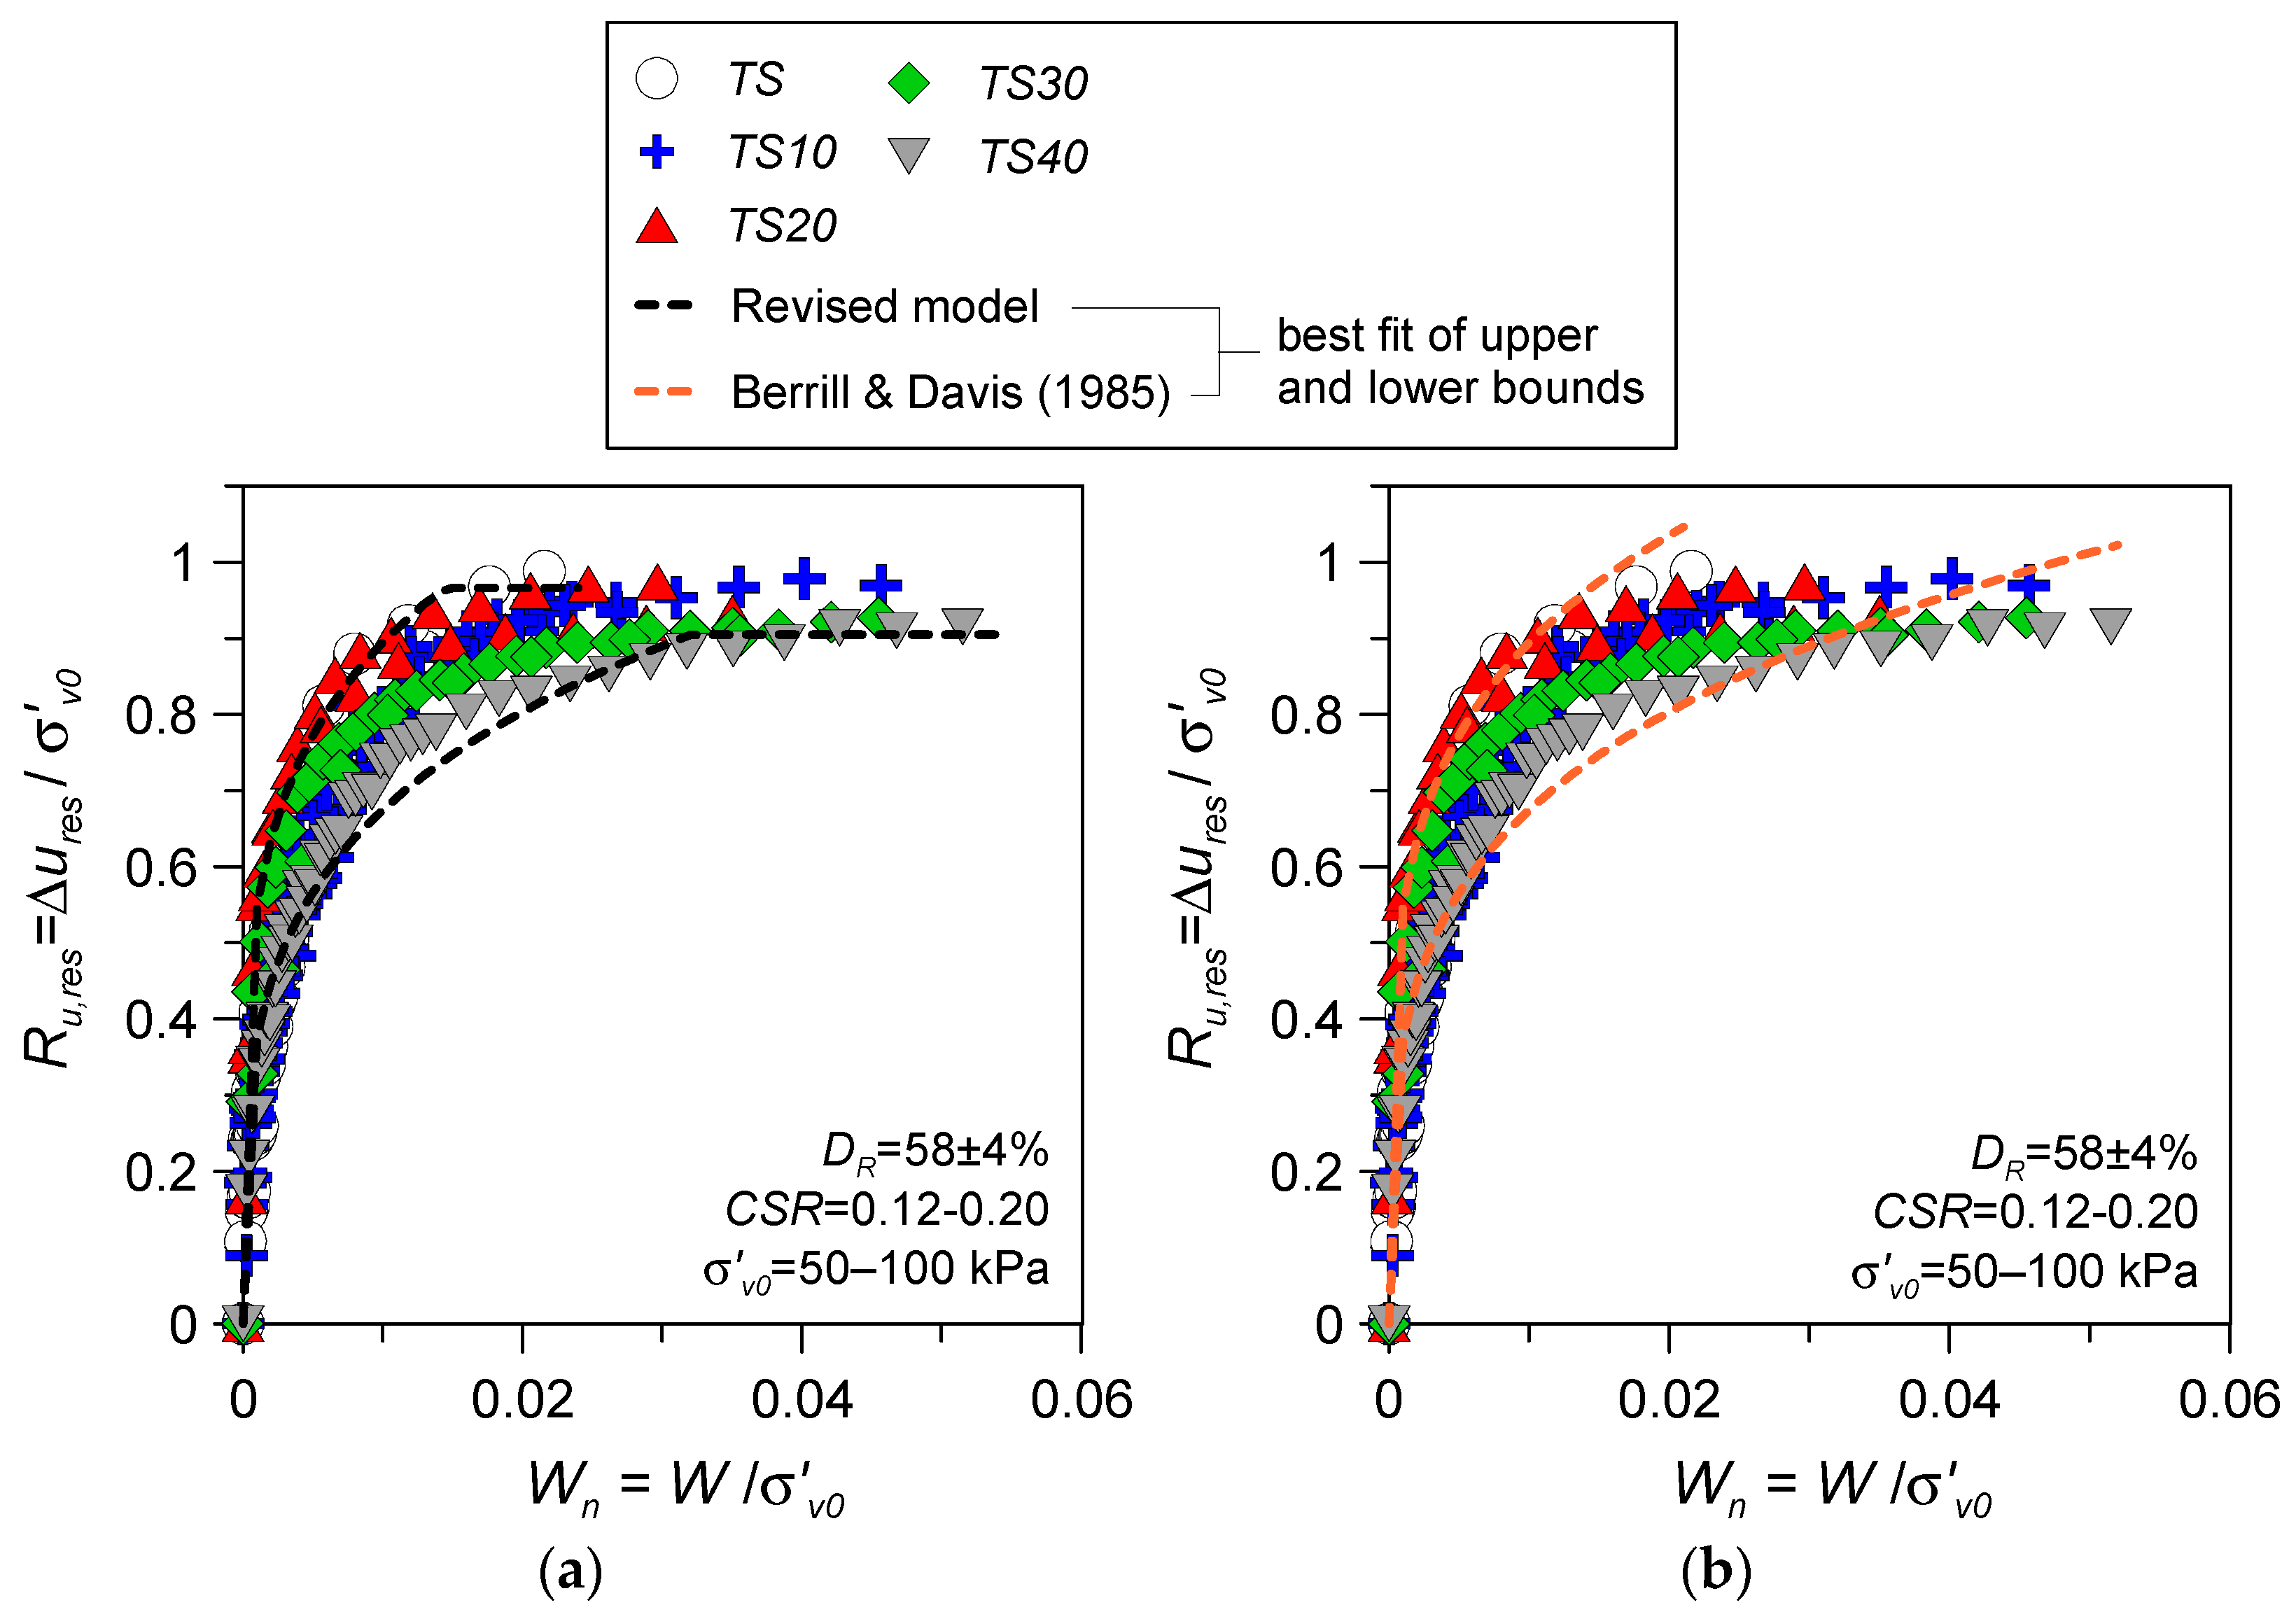
- A nonlinear increasing trend between the residual excess pore water pressure ratio Ru,res and normalised dissipated energy Wn was observed for silty sands. The Ru,res-Wn relationship was found to be dependent on the fines content of the mixture as well as relative density, whereas the applied cyclic stress ratio CSR, initial vertical effective stress σ′v0, and the sample reconstitution method/soil fabric appeared to have a minor impact.
- To determine the response of silty sands in a more accurate way, the original energy-based PWP model of Berrill and Davis [29] for clean sands under cyclic loading was properly revised, introducing an additional calibration parameter, namely the limiting value of excess pore water pressure at liquefaction (Ru,lim). It was found that Wf increased with an increasing fines content when tested under the same initial test conditions (DR, σ′v0).
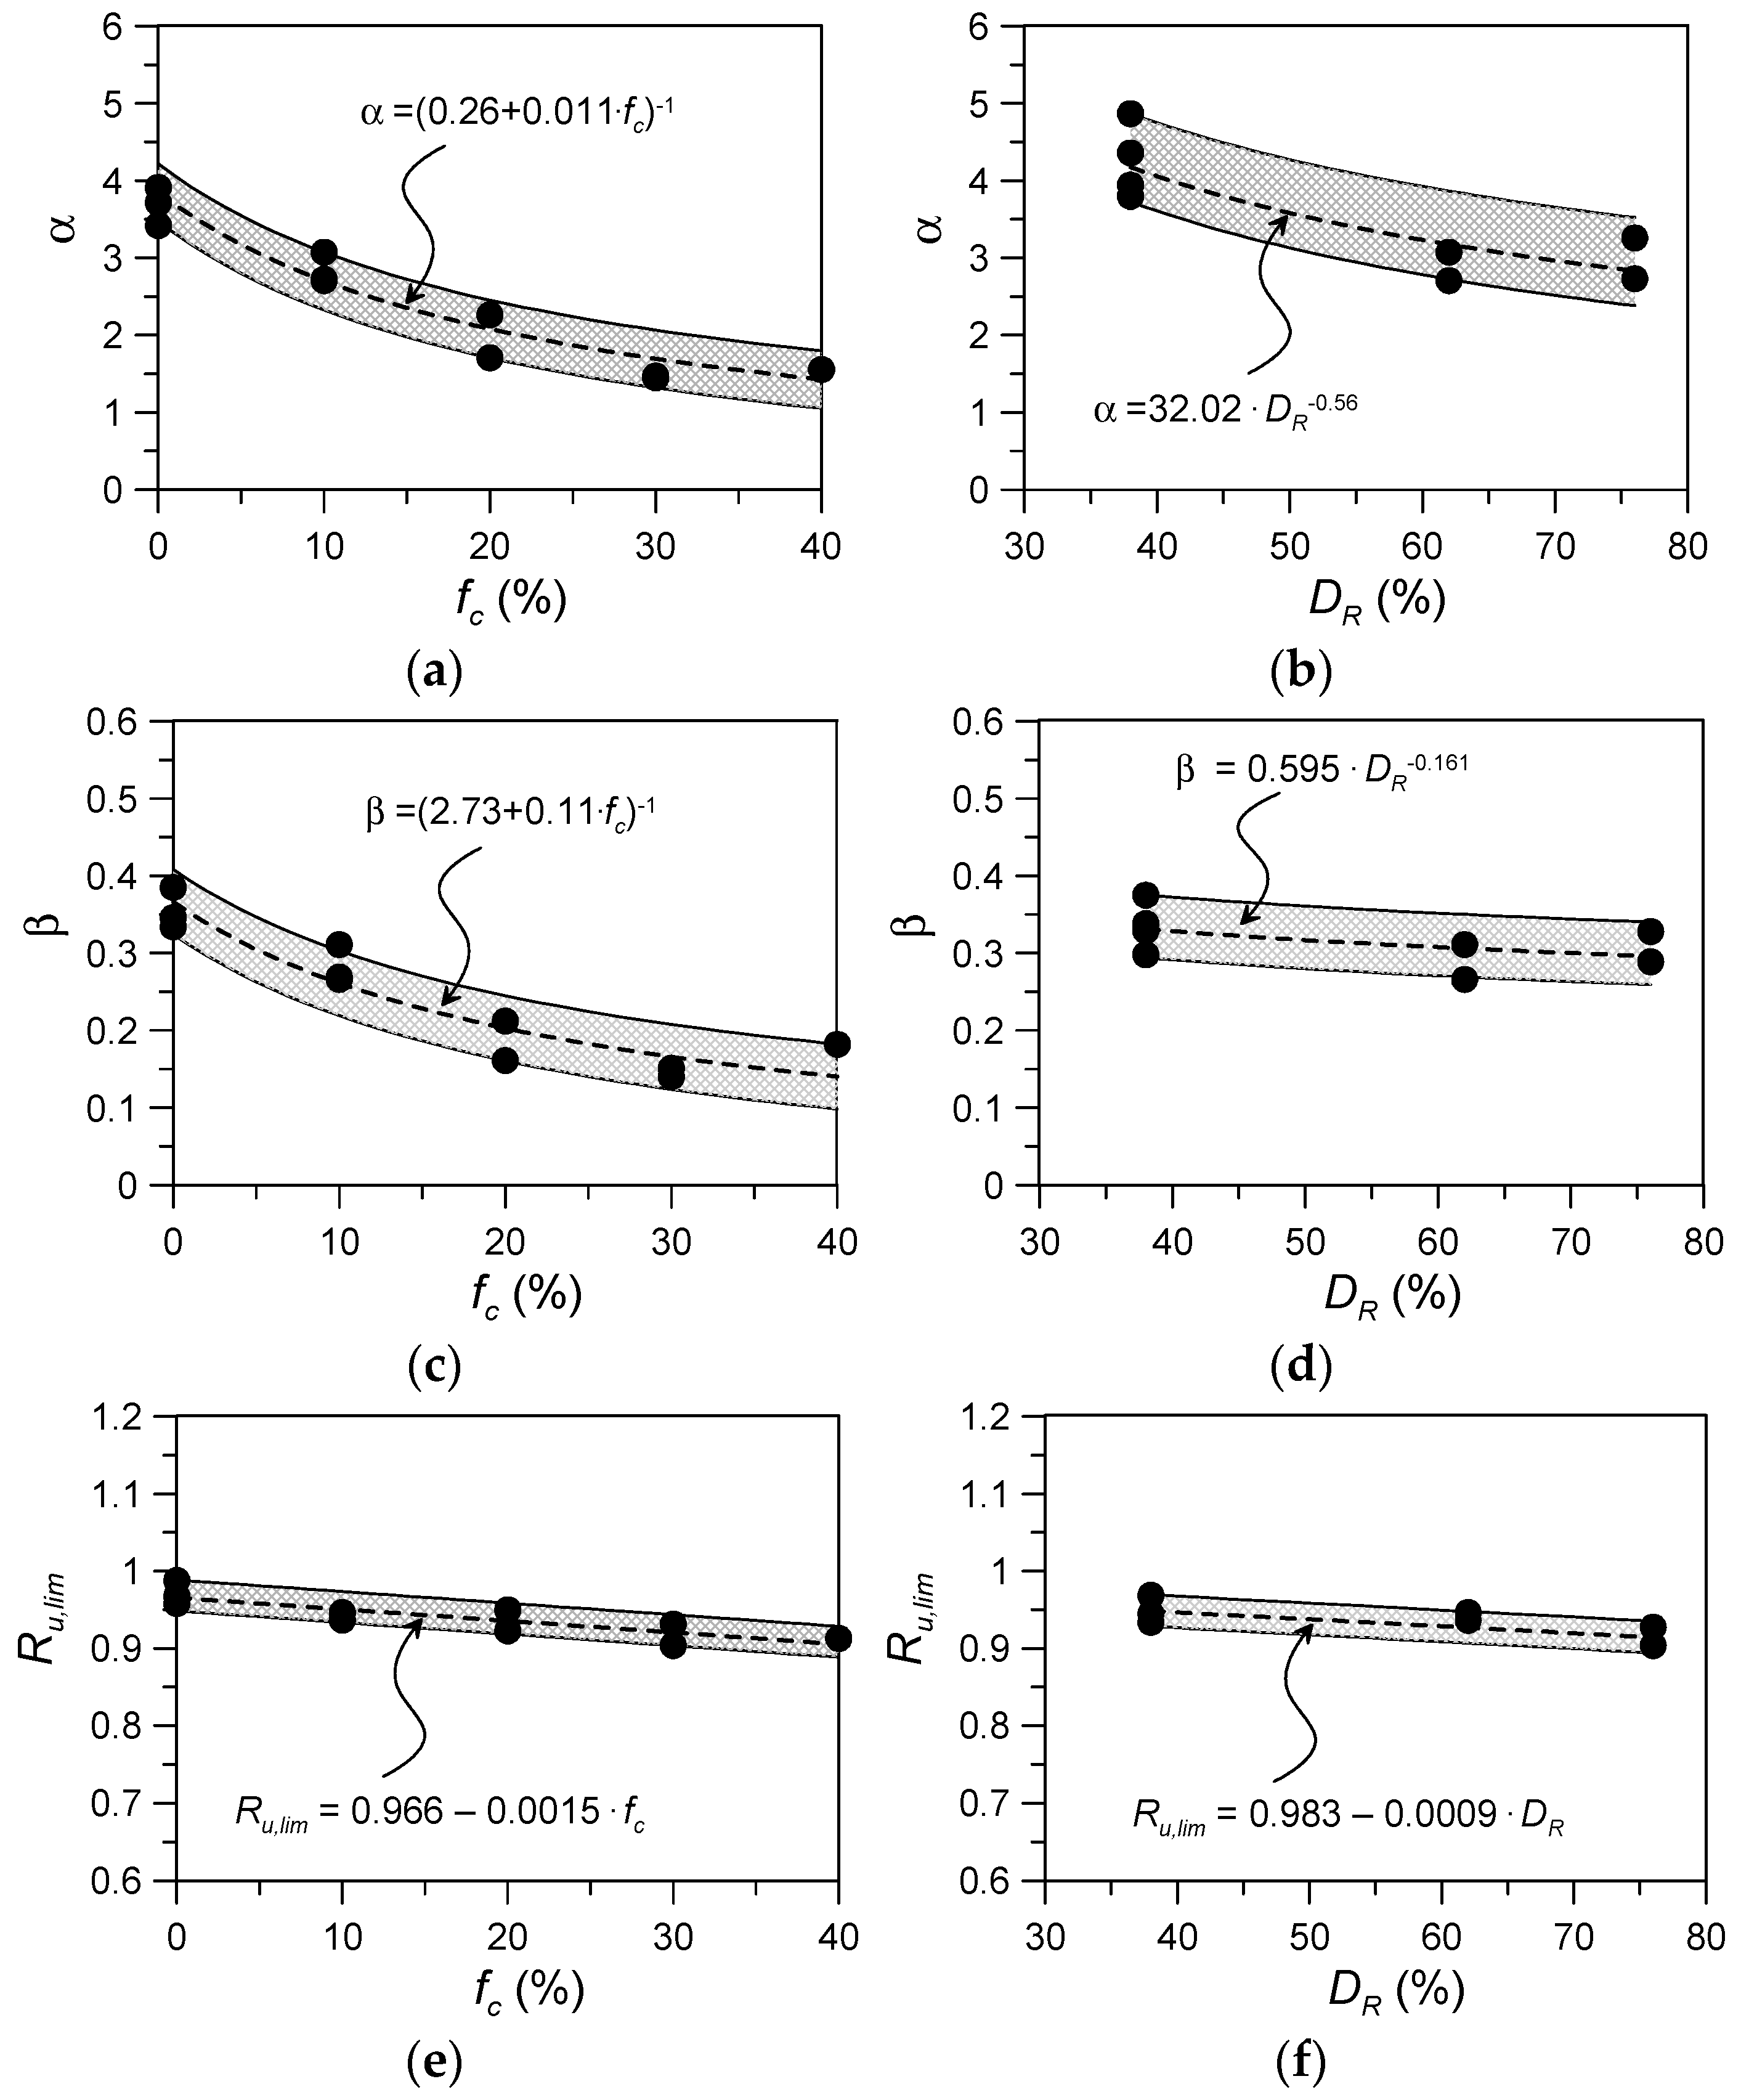
- Specific correlations for the calibration parameters α, β, and Ru,lim of the modified model were developed and proposed for soils with fc ≤ 40%, DR = 26–94%, and CSR = 0.08–0.26. The trends in all the calibration parameters evidenced a decrease with an increasing packing density and fines content of silty sands.
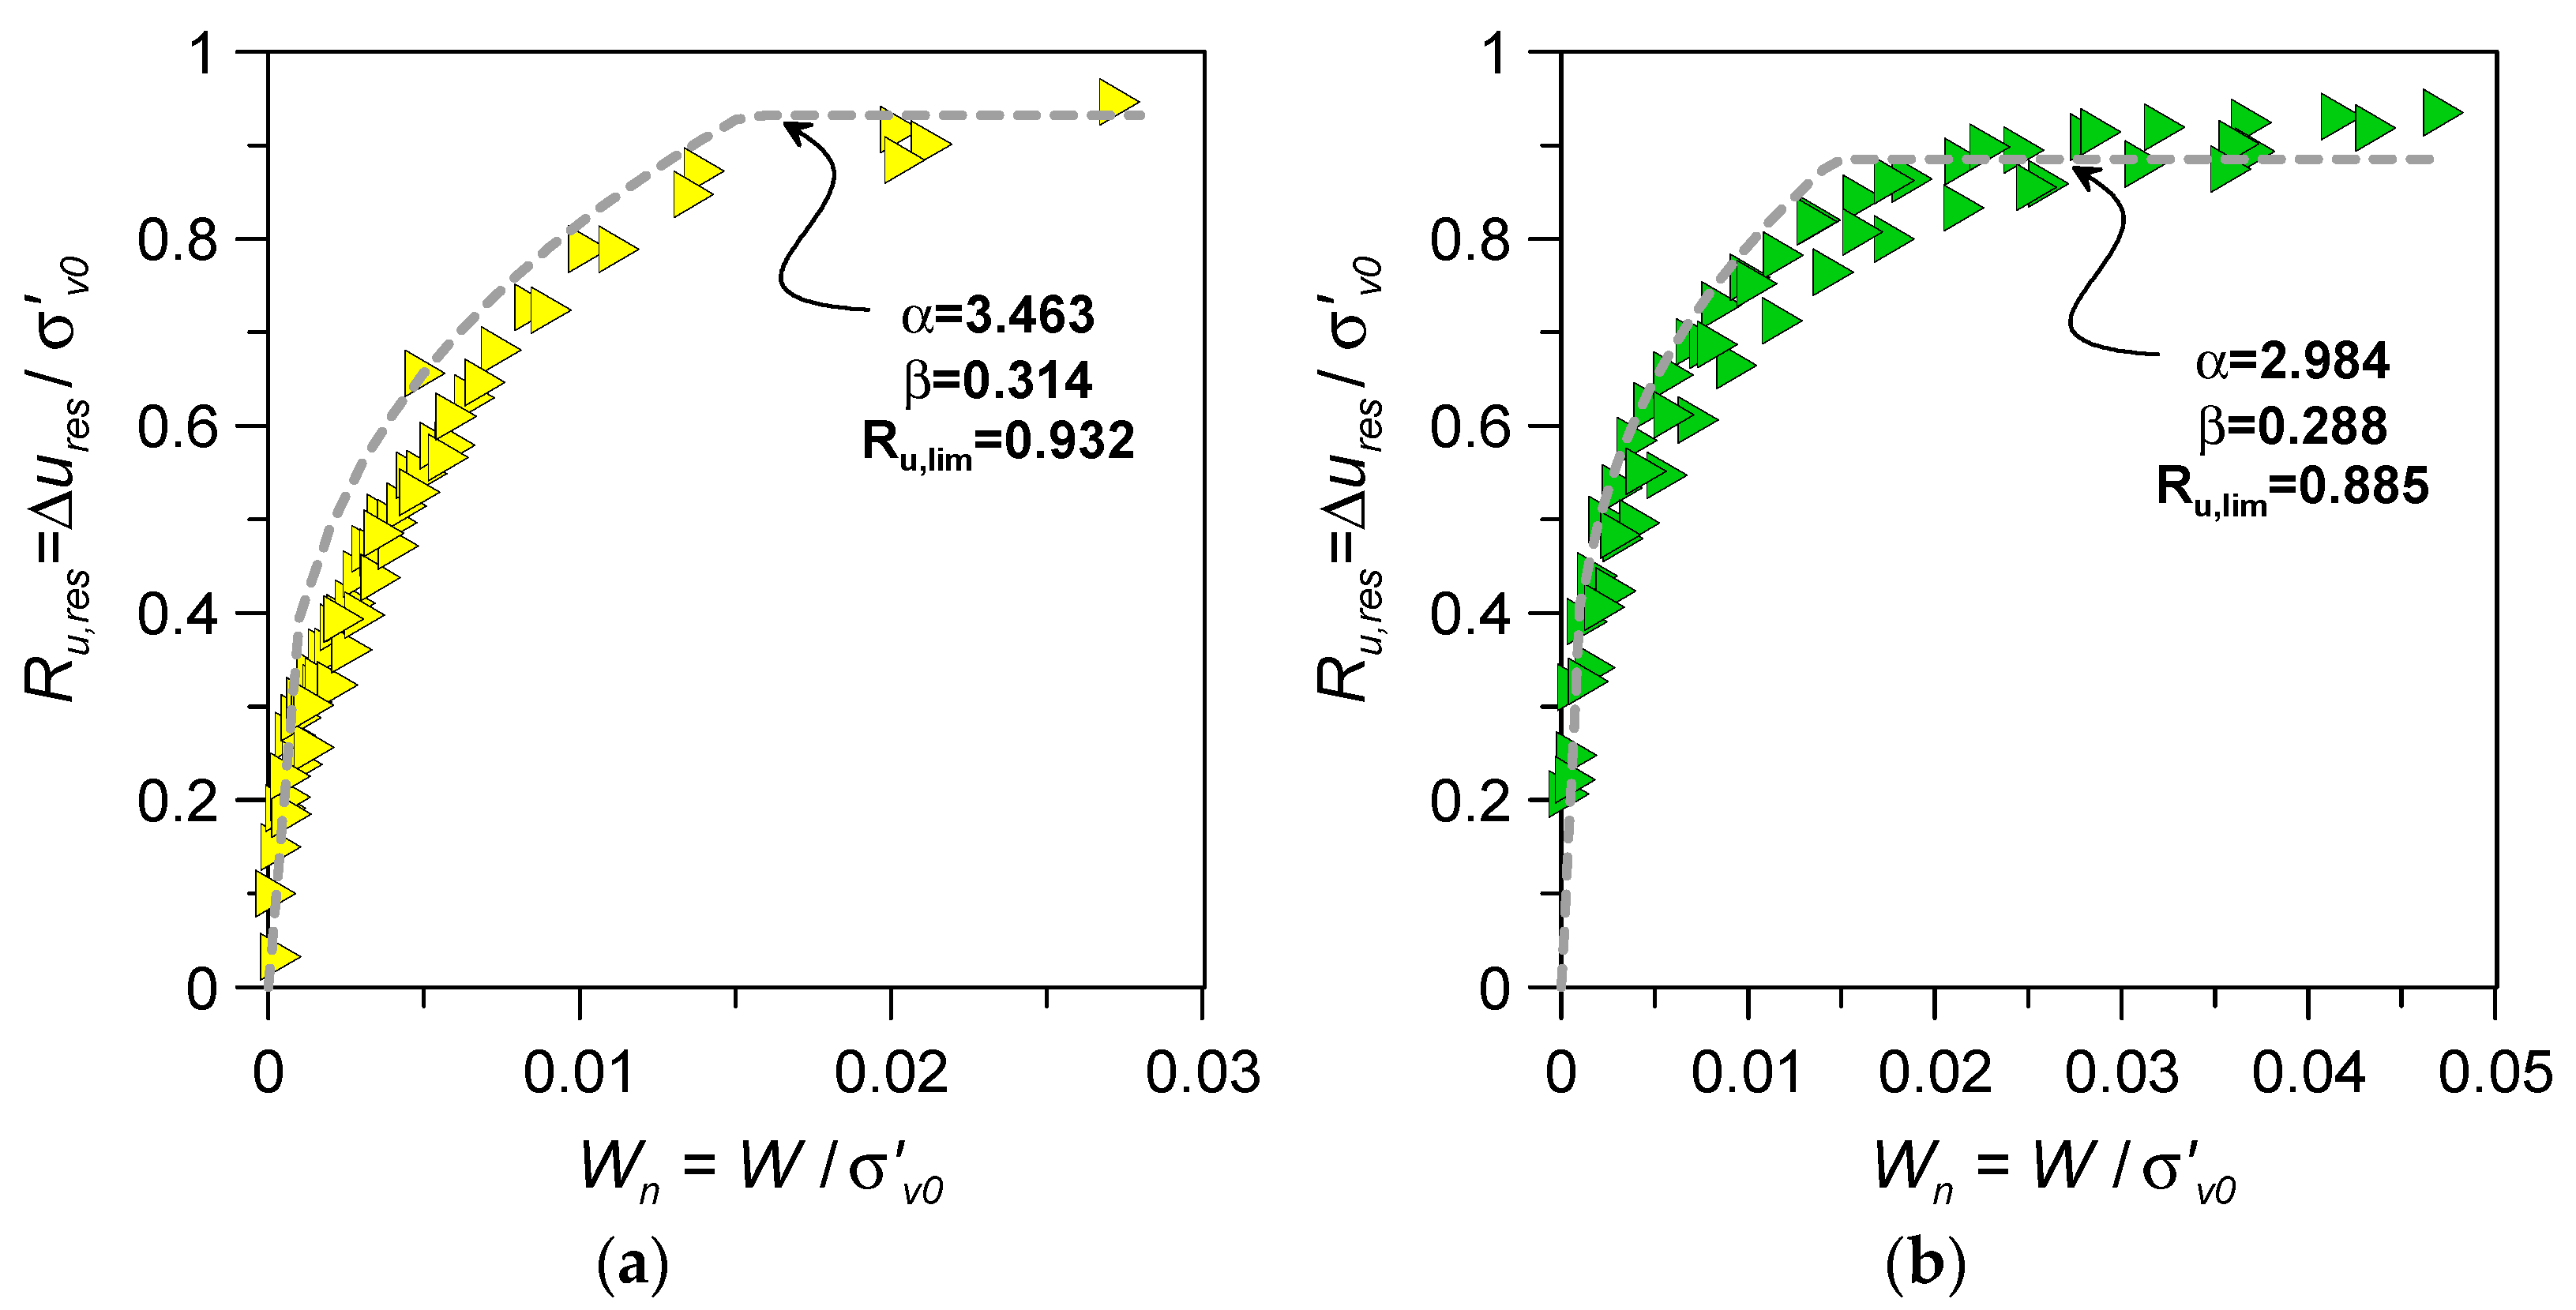
- The validation of the proposed correlations for the model parameters based on the results of CSS tests performed on additional materials, i.e., Emilia Romagna clean sand and silty sand, indicated that such correlations provided accurate predictions of the experimental PWP response, even for undisturbed natural sand–silt mixtures.
Author Contributions
Funding
Data Availability Statement
Conflicts of Interest
References
- Kramer, S.L. Geotechnical Earthquake Engineering, 1st ed.; Prentice Hall: Upper Saddle River, NJ, USA, 1996; pp. 348–417. [Google Scholar]
- Bray, J.D.; Sancio, R.B.; Durgunoglu, T.; Ohap, A.; Youd, T.L.; Stewart, J.; Seed, R.B.; Cetin, O.K.; Bol, E.; Baturay, M.B.; et al. Subsurface Characterization at Ground Failure Sites in Adapazari, Turkey. J. Geotech. Geoenvironmental Eng. 2004, 130, 673–685. [Google Scholar] [CrossRef]
- Porcino, D.; Diano, V. Laboratory Study on Pore Pressure Generation and Liquefaction of Low-Plasticity Silty Sandy Soils during the 2012 Earthquake in Italy. J. Geotech. Geoenviron. Eng. 2016, 142, 04016048. [Google Scholar] [CrossRef]
- Cavallaro, A.; Capilleri, P.; Grasso, S. Site Characterization by in Situ and Laboratory Tests for Liquefaction Potential Evaluation during Emilia Romagna Earthquake. Geosciences 2018, 8, 242. [Google Scholar] [CrossRef]
- Quilter, P.W.; van Ballegooy, S.; Russ, M. The Effect of Sea Level Rise on Liquefaction Vulnerability. In Proceedings of the 6th International Conference on Earthquake Geotechnical Engineering, Christchurch, New Zealand, 1–4 November 2015. [Google Scholar]
- Monk, C.B.; van Ballegooy, S.; Hughes, M.; Villeneuve, M. Liquefaction vulnerability increase at North New Brighton due to subsidence, sea level rise and reduction in thickness of the non-liquefying layer. Bull. N. Z. Soc. Earthq. Eng. 2016, 49, 334–340. [Google Scholar] [CrossRef]
- Abueladas, A.-R.A.; Niemi, T.M.; Al-Zoubi, A.; Tibor, G.; Kanari, M.; Ben-Avraham, Z. Liquefaction susceptibility maps for the Aqaba-Elat region with projections of future hazards with sea-level rise. Q. J. Eng. Geol. Hydrogeol. 2021, 54, 1–12. [Google Scholar] [CrossRef]
- Dong, L.; Cao, J.; Liu, X. Recent Developments in Sea-Level Rise and Its Related Geological Disasters Mitigation: A Review. J. Mar. Sci. Eng. 2022, 10, 355. [Google Scholar] [CrossRef]
- Amini, F.; Qi, Z. Liquefaction testing of stratified silty sands. J. Geotech. Geoenviron. Eng. 2000, 126, 208–217. [Google Scholar] [CrossRef]
- Pan, K.; Zhou, G.Y.; Yang, Z.X.; Cai, Y.Q. Comparison of cyclic liquefaction behavior of clean and silty sands considering static shear effect. Soil Dyn. Earthq. Eng. 2020, 136, 106338. [Google Scholar] [CrossRef]
- Pan, X.D.; Chen, J.Q.; Pan, K.; Xu, X.; Jiang, J.W.; Yang, Z.X. Cyclic behavior of anisotropically consolidated sand with small amount of fines. Soils Dyn. Earthq. Eng. 2021, 146, 106778. [Google Scholar] [CrossRef]
- Polito, C.P.; Martin, J.R., II. Effects of nonplastic fines on the liquefaction resistance of sands. J. Geotech. Geoenviron. Eng. 2001, 127, 408–415. [Google Scholar] [CrossRef]
- Xenaki, V.C.; Athanasopoulos, G.A. Liquefaction resistance of sand-silt mixtures: An experimental investigation of the effect of fines. Soils Dyn. Earthq. Eng. 2003, 23, 1–12. [Google Scholar] [CrossRef]
- Porcino, D.D.; Triantafyllidis, T.; Wichtmann, T.; Tomasello, G. Application of Critical State Approach to Liquefaction Resistance of Sand-Silt Mixtures under Cyclic Simple Shear Loading. J. Geotech. Geoenviron. Eng. 2021, 147, 04020177. [Google Scholar] [CrossRef]
- Polito, C.P. The Effect of Non-Plastic and Plastic Fines on the Liquefaction of Sandy Soils. Ph.D. Thesis, Department of Civil Engineering, Virginia Tech, Blacksburg, VA, USA, 1999. [Google Scholar]
- Hazirbaba, K. Pore Pressure Generation Characteristics of Sands and Silty Sands: A Strain Approach. Ph.D. Thesis, Department of Civil, Architectural, and Environmental Engineering, University of Texas, Austin, TX, USA, 2005. [Google Scholar]
- Zuo, L.; Baudet, B.A. Determination of the transitional fines content of sand-non plastic fines mixtures. Soils Found. 2015, 55, 213–219. [Google Scholar] [CrossRef]
- Porcino, D.D.; Tomasello, G.; Wichtmann, T. An insight into the prediction of limiting fines content for mixtures of sand with non-plastic fines based on monotonic and cyclic tests. In Proceedings of the 7th International Conference on Earthquake Geotechnical Engineering, Rome, Italy, 17–20 June 2019. [Google Scholar]
- Rees, S. Effect of Fines on the Undrained Behaviour of Christchurch Sandy Soils. Ph.D. Thesis, University of Canterbury, Christchurch, New Zealand, 2010. [Google Scholar]
- Papadopolou, A.I.; Tika, T.M. The effect of fines plasticity on monotonic undrained shear strength and liquefaction resistance of sands. Soils Dyn. Earthq. Eng. 2016, 88, 191–206. [Google Scholar] [CrossRef]
- Wei, X.; Yang, J.; Zhou, Y.-G.; Chen, Y. Influence of particle-size disparity on cyclic liquefaction resistance of silty sands. Géotechnique Lett. 2020, 10, 151–161. [Google Scholar] [CrossRef]
- Tomasello, G.; Porcino, D.D. Earthquake-induce large deformations and failure mechanisms of silty sands in sloped ground conditions. Soils Dyn. Earthq. Eng. 2023, 173, 108056. [Google Scholar] [CrossRef]
- Seed, H.B.; Martin, P.P.; Lysmer, J. The Generation and Dissipation of Pore-Water Pressures during Soil Liquefaction; Geotechnical Report No. EERC; University of California: Berkeley, CA, USA, 1975. [Google Scholar]
- Baziar, M.H.; Shahnazari, H.; Sharafi, H. A laboratory study on the pore pressure generation model for Firouzkooh silty sands using hollow torsional test. Int. J. Civ. Eng. 2011, 9, 126–134. [Google Scholar]
- Hubler, J.F.; Athanasopoulos-Zekkos, A.; Zekkos, D. Pore Pressure Generation of Gravelly Soils in Constant Volume Cyclic Simple Shear. J. Geotech. Geoenviron. Eng. 2023, 149, 04022130. [Google Scholar] [CrossRef]
- Martin, G.R.; Finn, W.D.L.; Seed, H.B. Fundamentals of liquefaction under cyclic loading. J. Geotech. Geoenviron. Eng. 1975, 101, 423–438. [Google Scholar] [CrossRef]
- Vucetic, M.; Dobry, R. Pore Pressure Build-Up and Liquefaction at Level Sandy Sites during Earthquakes; Research Report CE-86-3; Department of Civil Engineering, Rensselaer Polytechnic Institute: Troy, NY, USA, 1986. [Google Scholar]
- Chen, G.; Zhao, D.; Chen, W.; Juang, C.H. Excess Pore-Water Pressure Generation in Cyclic Undrained Testing. J. Geotech. Geoenviron. Eng. 2019, 145, 04019022. [Google Scholar] [CrossRef]
- Berrill, J.B.; Davis, R.O. Energy dissipation and seismic liquefaction of sands: Revised model. Soils Found. 1985, 25, 106–118. [Google Scholar] [CrossRef] [PubMed]
- Green, R.A.; Mitchell, J.K.; Polito, C.P. An energy-based excess pore-water pressure generation model for cohesionless soils. In Proceedings of the John Booker Memorial Symposium, Sydney, Australia, 16–17 November 2000. [Google Scholar]
- Zhang, J.; Ji, X.; Zou, D.; Liu, J.; Kong, X.; Zhou, C.; Fu, Y. Study on the energy-based pore pressure model of coarse-grained soils by eliminating membrane compliance. Acta Geotech. 2023, 18, 6505–6528. [Google Scholar] [CrossRef]
- Elgamal, A.; Yang, Z.; Parra, E.; Ragheb, A. Modeling of cyclic mobility in saturated cohesionless soils. Int. J. Plast. 2003, 19, 883–905. [Google Scholar] [CrossRef]
- Taiebat, M.; Shahir, H.; Pak, A. Study of pore pressure variation during liquefaction using two constitutive models for sand. Soil Dyn. Earthq. Eng. 2007, 27, 60–72. [Google Scholar] [CrossRef]
- Boulanger, R.W.; Ziotopoulou, K. PM4Sand (Version 3): A Sand Plasticity Model for Earthquake Engineering Applications; Report No. UCD/CGM-15/01; Center for Geotechnical Modeling, University of California at Davis: Davis, CA, USA, 2015. [Google Scholar]
- Cetin, K.O.; Bilge, H.T. Cyclic Large Strain and Induced Pore Pressure Models for Saturated Clean Sands. J. Geotech. Geoenviron. Eng. 2012, 138, 309–323. [Google Scholar] [CrossRef]
- Dobry, R.; El-Sekelly, W.; Abdoun, T. Calibration of non-linear effective stress code for seismic analysis of excess pore pressures and liquefaction in the free field. Soils Dyn. Earthq. Eng. 2018, 107, 374–389. [Google Scholar] [CrossRef]
- Pervaiz, U.; Park, D.; Hashah, Y.; Xing, G. Testing performance of pore pressure models implemented in one-dimensional site response analysis program against centrifuge test data measured in mildly sloping ground. Soil Dyn. Earthq. Eng. 2021, 149, 106867. [Google Scholar] [CrossRef]
- Lee, K.L.; Albaisa, A. Earthquake Induced Settlements in Saturated Sands. J. Geotech. Geoenviron. Eng. 1974, 100, 387–406. [Google Scholar]
- Dobry, R.; Pierce, W.G.; Dyvik, R.; Thomas, G.E.; Ladd, R.S. Pore Pressure Model for Cyclic Straining of Sand; Research Report 1985-06; Rensselaer Polytechnic Institute: Troy, NY, USA, 1985. [Google Scholar]
- Polito, C.P.; Green, R.A.; Lee, J. Pore pressure generation models for sands and silty soils subjected to cyclic loading. J. Geotech. Geoenviron. Eng. 2008, 134, 1490–1500. [Google Scholar] [CrossRef]
- Porcino, D.D.; Tomasello, G.; Diano, V. Key factors affecting prediction of seismic pore water pressures in silty sands based on damage parameter. Bull. Earthq. Eng. 2018, 16, 5801–5819. [Google Scholar] [CrossRef]
- Konstadinou, M.; Georgiannou, V.N. Prediction of pore water pressure generation leading to liquefaction under torsional cyclic loading. Soils Found. 2014, 54, 993–1005. [Google Scholar] [CrossRef]
- Green, R.A.; Terry, G.A. Number of Equivalent Cycles Concept for Liquefaction Evaluations-Revisited. J. Geotech. Geoenviron. Eng. 2005, 131, 477–488. [Google Scholar] [CrossRef]
- Biondi, G.; Cascone, E.; Di Filippo, G. Affidabilità di alcune correlazioni empiriche per la stima del numero di cicli di carico equivalente. Riv. Ital. Di Geotec. 2012, 46, 9–39. [Google Scholar]
- Castiglia, M.; Santucci de Magistris, F. Prediction of the number of equivalent cycles for earthquake motion. Bull. Earthq. Eng. 2018, 16, 3571–3603. [Google Scholar] [CrossRef]
- Seed, H.B.; Idriss, I.M. Ground Motions and Soil Liquefaction during Earthquakes; Earthquake Engineering Research Institute: Oakland, CA, USA, 1982. [Google Scholar]
- Idriss, I.M. An update to the seed-idriss simplified procedure for evaluating liquefaction potential. In Proceedings of the TRB Workshop on New Approaches to Liquefaction, Washington, DC, USA, 10 January 1999. [Google Scholar]
- Wei, X.; Yang, J. Characterizing the effects of fines on the liquefaction resistance of silty sands. Soils Found. 2019, 59, 1800–1812. [Google Scholar] [CrossRef]
- Nemat-Nasser, S.; Shokooh, A. A unified approach to densification and liquefaction of cohesionless sand in cyclic shearing. Can. Geotech. J. 1979, 16, 659–678. [Google Scholar] [CrossRef]
- Baziar, M.H.; Sharafi, H. Assessment of silty sand liquefaction potential using hollow torsional tests—An energy approach. Soil Dyn. Earthq. Eng. 2011, 31, 857–865. [Google Scholar] [CrossRef]
- Jafarian, Y.; Towhata, I.; Baziar, M.H.; Noorzad, A.; Bahmanpour, A. Strain energy based evaluation of liquefaction and residual pore water pressure in sands using cyclic torsional shear experiments. Soil Dyn. Earthq. Eng. 2012, 35, 13–28. [Google Scholar] [CrossRef]
- Polito, C.; Green, R.A.; Dillon, E.; Sohn, C. Effect of load shape on relationship between dissipated energy and residual excess pore pressure generation in cyclic triaxial tests. Can. Geotech. J. 2013, 50, 1118–1128. [Google Scholar] [CrossRef]
- Azeiteiro, R.J.N.; Coelho, P.A.L.F.; Taborda, D.M.G.; Grazina, J.C.D. Energy-based evaluation of liquefaction potential under non-uniform cyclic loading. Soil Dyn. Earthq. Eng. 2017, 92, 650–665. [Google Scholar] [CrossRef]
- Porcino, D.D.; Tomasello, G.; Farzalizadeh, R. Pore-pressure generation of sands subjected to cyclic simple shear loading: An energy approach. In Proceedings of the 4th International Conference on Performance-Based Design in Earthquake Geotechnical Engineering, Beijing, China, 15–17 July 2022. [Google Scholar]
- Qin, Y.; Yang, Z.; Du, X.; Wu, Q.; Guoxing, C. An energy-based model for the generation of excess pore water pressure in saturated coral sand. Mar. Georesour. Geotechnol. 2023, 42, 193–204. [Google Scholar] [CrossRef]
- Zhou, G.Y.; Pan, K.; Yang, Z.X. Energy-based assessment of cyclic liquefaction behavior of clean and silty sand under sustained initial stress conditions. Soil Dyn. Earthq. Eng. 2023, 164, 107609. [Google Scholar] [CrossRef]
- Green, R.A. Energy-Based Evaluation and Remediation of Liquefiable Soils. Ph.D. Thesis, Virginia Polytechnic Institute and State University, Blacksburg, VA, USA, 2001. [Google Scholar]
- Hashah, Y.M.A.; Musgrove, M.H.; Harmon, J.A.; Ilhan, O.; Xing, G.; Numanoglu, O.; Groholski, D.R.; Phillips, C.A.; Park, D. DEEPSOIL 7.0, User Manual; Board of Trustees of University of Illinois at Urbana-Champaign: Urbana, IL, USA, 2020. [Google Scholar]
- Mele, L.; Lirer, S.; Flora, A. A simple procedure to calibrate a pore pressure energy-based model from in situ tests. Acta Geotech. 2022, 18, 1569–1591. [Google Scholar] [CrossRef]
- Baziar, M.H.; Jafarian, Y. Assessment of liquefaction triggering using strain energy concept and ANN model: Capacity Energy. Soil Dyn. Earthq. Eng. 2007, 27, 1056–1072. [Google Scholar] [CrossRef]
- Alavi, A.H.; Gandomi, A.H. Energy-based numerical models assessment of soil liquefaction. Geosci. Front. 2012, 3, 541–555. [Google Scholar] [CrossRef]
- NTC D.M. New Technical Standards for Buildings. 2018. Available online: https://www.gazzettaufficiale.it/eli/gu/2018/02/20/42/so/8/sg/pdf (accessed on 11 June 2024).
- Porcino, D.; Caridi, G.; Malara, M.; Morabito, E. An Automated Control System for Undrained Monotonic and Cyclic Simple Shear Tests. In Proceedings of the GeoCongress 2006: Geotechnical Engineering in the Information Technology Age, Atlanta, GA, USA, 26 February–1 March 2006. [Google Scholar]
- Tonni, L.; Gottardi, G.; Amoroso, S.; Bardotti, R.; Bonzi, L.; Chiaradonna, A.; d’Onofrio, A.; Fioravante, V.; Ghinelli, A.; Giretti, D.; et al. Analisi dei fenomeni deformativi indotti dalla sequenza sismica emiliana del 2012 su un tratto di argine del Canale Diversivo di Burana (FE). Riv. Ital. Di Geotec. 2015, 2, 28–58. [Google Scholar]
- Miura, S.; Toki, S. A sample preparation method and its effect on static and cyclic deformation-strength properties of sand. Soils Found. 1982, 22, 61–77. [Google Scholar] [CrossRef]
- Vaid, Y.P.; Negussey, D. Preparation of reconstituted sand specimens. In Advanced Triaxial Testing of Soil and Rock, 1st ed.; Donaghe, R.C., Chaney, R.C., Silver, M.L., Eds.; ASTM International: West Conshohocken, PA, USA, 1988; Volume 1, pp. 405–417. [Google Scholar]
- Wood, F.M.; Yamamuro, J.A.; Lade, P.V. Effect of depositional method on the undrained response of silty sand. Can. Geotech. J. 2008, 45, 1525–1537. [Google Scholar] [CrossRef]
- Wichtmann, T.; Steller, K.; Triantafyllidis, T. On the influence of the sample preparation method on strain accumulation in sand under high-cyclic loading. Soil Dyn. Earthq. Eng. 2020, 131, 106028. [Google Scholar] [CrossRef]
- Vaid, Y.P.; Sivathayalan, S. Static and cyclic liquefaction potential of Fraser Delta sand in simple shear and triaxial tests. Can. Geotech. J. 1996, 33, 281–289. [Google Scholar] [CrossRef]
- Sivathayalan, S.; Ha, D. Effect of static shear stress on the cyclic resistance of sands in simple shear loading. Can. Geotech. J. 2011, 48, 1471–1484. [Google Scholar] [CrossRef]
- Tomasello, G.; Porcino, D.D. Influence of sloping ground conditions on cyclic liquefaction behavior of sand under simple shear loading. Soil Dyn. Earthq. Eng. 2022, 163, 107516. [Google Scholar] [CrossRef]
- Finn, W.D.L. Aspects of constant volume cyclic simple shear. In Proceedings of the Advances in the Art of Testing Soils under Cyclic Conditions, Detroit, MI, USA, 24 October 1985. [Google Scholar]
- Dyvik, R.; Berre, T.; Lacasse, S.; Raadim, B. Comparison of truly undrained and constant volume direct simple shear tests. Géotechnique 1987, 37, 3–10. [Google Scholar] [CrossRef]
- ASTM D8296; Standard Test Method for Consolidated Undrained Cyclic Direct Simple Shear Test under Constant Volume with Load Control or Displacement Control. ASTM International: West Conshohocken, PA, USA, 2019.
- Reyna, F.; Chameau, J.L. Dilatometer Based Liquefaction Potential of Sites in the Imperial Valley. In Proceedings of the Second International Conference on Recent Adavances in Geotechnical Earthquake Engineering and Soil Dynamics, St. Louis, MI, USA, 11–15 March 1991. [Google Scholar]
- Porcino, D.D.; Triantafyllidis, T.; Wichtmann, T.; Tomasello, G. Using different state parameters for characterizing undrained static and cyclic behavior of sand with non-plastic fines. Soil Dyn. Earthq. Eng. 2022, 159, 107318. [Google Scholar] [CrossRef]
- Pan, K.; Yang, Z.X. Evaluation of the Liquefaction Potential of Sand under Random Loading Conditions: Equivalent Approach Versus Energy-Based Method. J. Earthq. Eng. 2020, 24, 59–83. [Google Scholar] [CrossRef]
- Figueroa, J.L.; Saada, A.S.; Liang, L.; Dahisaria, N.M. Evaluation of Soil Liquefaction by Energy Principles. J. Geotech. Eng. 1994, 120, 1554–1569. [Google Scholar] [CrossRef]
- Towhata, I.; Ishihara, K. Shear work and pore water pressure in undrained shear. Soils Found. 1985, 25, 73–84. [Google Scholar] [CrossRef] [PubMed]
- Sassa, K.; Wang, G.; Fukuoka, H.; Vankov, D.A. Shear-displacement-amplitude dependent pore-pressure generation in undrained cyclic loading ring shear tests: An energy approach. J. Geotech. Geoenviron. Eng. 2005, 131, 750–761. [Google Scholar] [CrossRef]
- Yang, J.; Wei, L.M.; Dai, B.B. State variables for silty sands: Global void ratio or skeleton void ratio? Soils Found. 2015, 55, 99–111. [Google Scholar] [CrossRef]
- Rahman, M.M.; Sitharam, T.G. Cyclic liquefaction screening of sand with non-plastic fines: Critical state approach. Geosci. Front. 2020, 11, 429–438. [Google Scholar] [CrossRef]
- Carraro, J.A.H.; Bandini, P.; Salgado, R. Liquefaction resistance of clean and nonplastic silty sands based on cone penetration resistance. J. Geotech. Geoenviron. Eng. 2003, 129, 965–976. [Google Scholar] [CrossRef]
- Boulanger, R.W.; Idriss, I.M. Liquefaction criteria for silts and clays. J. Geotech. Geoenviron. Eng. 2006, 132, 1413–1426. [Google Scholar] [CrossRef]
- Yang, Z.X.; Pan, K. Energy-Based Approach to Quantify Cyclic Resistance and Pore Pressure Generation in Anisotropically Consolidated Sand. J. Mater. Civ. Eng. 2018, 30, 04018203. [Google Scholar] [CrossRef]
- Chien, L.-K.; Oh, Y.-N.; Chang, C.-H. Effects of fines content on liquefaction strength and dynamics settlment of reclaimed soil. Can. Geotech. J. 2002, 39, 254–265. [Google Scholar] [CrossRef]
- Ishihara, K. Liquefaction on flow failure during earthquake. Géotechnique 1993, 43, 351–415. [Google Scholar] [CrossRef]
- Sze, H.Y.; Yang, Y. Failure Modes of Sand in Undrained Cyclic Loading: Impact of Sample Preparation. J. Geotech. Geoenviron. Eng. 2014, 140, 152–169. [Google Scholar] [CrossRef]
- Ghionna, V.N.; Porcino, D. Liquefaction resistance of undisturbed and reconstituted samples of a natural coarse sand from undrained cyclic triaxial tests. J. Geotech. Geoenviron. Eng. 2006, 132, 194–202. [Google Scholar] [CrossRef]


| Material | GS | D10 (mm) | D50 (mm) | CU | emax | emin |
|---|---|---|---|---|---|---|
| TS | 2.68 | 0.417 | 0.564 | 1.5 | 0.93 | 0.58 |
| TS10 | 2.67 | 0.059 | 0.547 | 10.2 | 0.81 | 0.47 |
| Fines | 2.72 | 0.004 | 0.024 | 8.5 | - | - |
| TS20 | 2.68 | 0.023 | 0.518 | 24.7 | 0.79 | 0.37 |
| TS30 | 2.69 | 0.013 | 0.483 | 41.6 | 0.80 | 0.37 |
| TS40 | 2.70 | 0.010 | 0.440 | 50.5 | 0.95 | 0.48 |
| ES | 2.70 | 0.120 | 0.320 | 2.8 | 0.93 | 0.54 |
| ES40 | 2.77 | 0.005 | 0.096 | 24.0 | - | - |
| Material | RC | fc (%) | e0 | DR (%) | σ′v0 (kPa) | CSR | No. Tests | Behaviour |
|---|---|---|---|---|---|---|---|---|
| TS | MT | 0 | 0.78 | 43 | 100 | 0.12–0.16 | 3 | CM |
| TS | MT | 0 | 0.74 | 54 | 100 | 0.12–0.18 | 4 | CM |
| TS | MT | 0 | 0.68 | 71 | 100 | 0.16–0.23 | 4 | CM |
| TS | MT | 0 | 0.63 | 86 | 100 | 0.20–0.25 | 3 | CM |
| TS | MT | 0 | 0.60 | 94 | 100 | 0.23–0.26 | 2 | CM |
| TS | WS | 0 | 0.79 | 42 | 100 | 0.10–0.15 | 2 | CM |
| TS | AP | 0 | 0.78 | 43 | 100 | 0.10–0.16 | 5 | CM |
| ES | WS | 0 | 0.69 | 60 * | 100 | 0.13–0.23 | 4 | CM |
| TS10 | MT | 10 | 0.60 | 62 | 100 | 0.14–0.20 | 3 | CM |
| TS10 | MT | 10 | 0.60 | 62 | 50 | 0.16–0.18 | 2 | CM |
| TS10 | MT | 10 | 0.68 | 38 | 100 | 0.10–0.16 | 3 | CM |
| TS10 | MT | 10 | 0.68 | 38 | 50 | 0.14–0.15 | 2 | CM |
| TS10 | MT | 10 | 0.55 | 76 | 100 | 0.18–0.20 | 2 | CM |
| TS20 | MT | 20 | 0.51 | 67 | 100 | 0.14–0.19 | 4 | CM |
| TS20 | MT | 20 | 0.55 | 57 | 100 | 0.14–0.16 | 2 | CM |
| TS20 | MT | 20 | 0.58 | 50 | 100 | 0.12–0.16 | 3 | CM |
| TS20 | MT | 20 | 0.58 | 50 | 50 | 0.14–0.15 | 2 | CM |
| TS20 | MT | 20 | 0.68 | 26 | 100 | 0.08–0.10 | 2 | FF |
| TS30 | MT | 30 | 0.49 | 72 | 100 | 0.20–0.22 | 2 | CM |
| TS30 | MT | 30 | 0.55 | 58 | 100 | 0.16–0.20 | 2 | CM |
| TS30 | MT | 30 | 0.58 | 51 | 100 | 0.12–0.18 | 3 | CM |
| TS30 | MT | 30 | 0.68 | 28 | 100 | 0.12–0.14 | 2 | FF |
| TS30 | MT | 30 | 0.68 | 28 | 50 | 0.14–0.18 | 2 | CM |
| TS40 | MT | 30 | 0.68 | 57 | 100 | 0.12 | 1 | CM |
| ES40 | UND | 40 | 0.69 ± 0.15 | 32 * | 130 | 0.17–0.26 | 4 | CM |
Disclaimer/Publisher’s Note: The statements, opinions and data contained in all publications are solely those of the individual author(s) and contributor(s) and not of MDPI and/or the editor(s). MDPI and/or the editor(s) disclaim responsibility for any injury to people or property resulting from any ideas, methods, instructions or products referred to in the content. |
© 2024 by the authors. Licensee MDPI, Basel, Switzerland. This article is an open access article distributed under the terms and conditions of the Creative Commons Attribution (CC BY) license (https://creativecommons.org/licenses/by/4.0/).
Share and Cite
Tomasello, G.; Porcino, D.D. Energy-Based Pore Pressure Generation Models in Silty Sands under Earthquake Loading. Geosciences 2024, 14, 166. https://doi.org/10.3390/geosciences14060166
Tomasello G, Porcino DD. Energy-Based Pore Pressure Generation Models in Silty Sands under Earthquake Loading. Geosciences. 2024; 14(6):166. https://doi.org/10.3390/geosciences14060166
Chicago/Turabian StyleTomasello, Giuseppe, and Daniela Dominica Porcino. 2024. "Energy-Based Pore Pressure Generation Models in Silty Sands under Earthquake Loading" Geosciences 14, no. 6: 166. https://doi.org/10.3390/geosciences14060166