Abstract
Supra-glacial debris cover is important for the control of surface ice melt and glacier retreat in mountain regions. Despite the progress in techniques based on various satellite imagery, the mapping of debris-covered glacier boundaries over large regions remains a challenging task. Previous studies of the debris-covered glaciers in the Greater Caucasus have only focused on limited areas. In this study, using the Sentinel 1–2 imagery (2020), DebCovG-carto toolbox, and existing glacier inventory (2020), we produced the first detailed assessment of supra-glacial debris cover for individual glaciers in the entire Greater Caucasus. Our study shows that in 2020, 10.3 ± 5.6% of the glacier surface in this mountain region was covered by debris. A comparison of sub-regions such as the Elbrus Massif and other individual glaciers from the central Greater Caucasus shows an increasing trend of supra-glacial debris cover from 2014 to 2020. The total area of supra-glacial debris cover expanded from ~4.6% to ~5.8% for Elbrus and from ~9.5% to ~13.9% for the glaciers of the central Greater Caucasus during the same period. Supra-glacial debris cover also expanded upward on these glaciers between 2014 and 2020. A recent increase in rock-ice avalanche activity in combination with increased air temperature and decreased precipitation in the Greater Caucasus may be responsible for this upward migration and expanded area of supra-glacial debris cover. This study provides valuable insights into the spatial distribution, temporal evolution, and factors influencing supra-glacial debris cover in the Greater Caucasus. The findings contribute to our understanding of glacier dynamics and highlight the importance of continuous monitoring and assessment of supra-glacial debris cover in the context of climate change and glacier retreat. We recommend using the DebCovG-carto toolbox for regional assessment of supra-glacial debris coverage in other mountain regions as well.
1. Introduction
Debris-covered glaciers are a special type of glacier surrounded by lateral and terminal moraines, periglacial deposits, and sediment avalanches that contain similar reflectance characteristics [1]. A greater proportion of ice is expected to become debris-covered as mountain glaciers continue to decrease in the coming decades [2]. Where debris is thicker than a few centimeters, the melt rate is expected to decrease as the thick debris cover insulates the underlying ice [3]. However, several satellite remote sensing studies showed that thick debris-covered glaciers display high rates of surface lowering, comparable to those of clean ice glaciers [4,5,6]. This contradiction has been explained by melt hotspots, such as ice cliffs [7,8,9] or supra-glacial ponds [10,11], scattered within the debris cover. Understanding how debris cover impacts glacier meltwater production is crucial in order to make better projections of regional water resources and global sea-level rise [12].
Debris-covered glaciers are widely found in most of the high mountainous areas of the world, such as Alaska [13], the European Alps [14], the Caucasus [15,16], the Karakoram [17], the Himalayas [18,19,20], the Andes [21,22], and the Southern Alps of New Zealand [23,24], changing glacier ablation and thereby glacier responses to climate change differently. Supra-glacial debris cover also increases the difficulty and uncertainty of glacier boundary identification [25]. Furthermore, the retreat and melt of the debris-covered glaciers in high-mountain regions, with complex and steep terrain, are prone to cause geohazards and directly threaten the safety of human life [26]. It is also important to understand how debris-covered glacier ablation can be associated with glacial lake formation as glacial lake outburst floods (GLOF) can cause extreme risks to downstream populations [27]. These types of hazards are very common in the Caucasus Region, leading to major casualties [28,29,30]. Supra-glacial debris cover also plays a critical role in regulating the freshwater resources of the Caucasus countries. Thus, mapping and accurately assessing supra-glacial debris cover is important to better understand the future evolution and sustainability of these glaciers in view of climate scenarios and water security as well as to monitor further glacier fluctuations. Recent advances in remote sensing [31,32] techniques may improve our understanding of debris-covered glacier surfaces and their variability in remote areas such as the Greater Caucasus.
For the first time in this study, we aim to estimate the extent of supra-glacial debris cover for all glaciers in the entire Greater Caucasus using the Sentinel 1–2 imagery from 2020, DebCovG-carto toolbox [32], and existing glacier inventory [33].
2. Previous Studies
Recent work in the Greater Caucasus has mainly focused on regional glacier inventories and changes in glacier area [33,34,35] and geodetic mass balance [36], while several studies have also estimated supra-glacial debris cover for relatively small areas. For example, Stokes et al. [15] assessed the distribution and surface area of supra-glacial debris cover for individual glaciers in the Adylsu River valley (northern slopes), indicating an increase in supra-glacial debris cover area from <5% to >25% between 1985 and 2000. Lambrecht et al. [37] explored that the supra-glacial debris cover increase was much lower on the southern slope of the central Greater Caucasus in the same period (from 6.2 % to 8.1 %) for the Zopkhito and Laboda glaciers. Popovnin et al. [38] reported a supra-glacial debris cover increase from 2 % to 13 % between 1968 and 2010 based on direct field monitoring of the Djankuat Glacier on the northern slope of the central Greater Caucasus. Based on satellite imagery and ground-based investigation, Tielidze et al. [39] concluded that the supra-glacial debris-covered area increased from ~6% to ~8% for the Chalaati Glacier and from ~3% to ~9% for the Zophito Glacier in the southern slopes of the Greater Caucasus between 1960 and 2014. A comparison between 34 debris-covered and debris-free glaciers by Tielidze et al. [36] showed that geodetic mass loss was higher for debris-covered glaciers than for their debris-free counterparts in the Greater Caucasus during 2000–2019.
A recent global study by Scherler et al. [40] concluded that the Caucasus shows the highest percentage of supra-glacial debris cover worldwide (more than 25 % of glacier area), although the latest study by Tielidze et al. [16] indicated much lower relative supra-glacial debris cover (~13.4%) for 659 glaciers in 2014. The newest modeling experiment by Postnikova et al. [41] shows that on average, the fraction of debris-covered ice in the northern Greater Caucasus (Terek and Kuban River basins) will increase while debris cover will become thinner toward the end of the century.
3. Study Area
The Greater Caucasus mountains are an asymmetrical mountainous system with a long, gentle northern slope and a short, steep southern slope stretching more than 1100 km from the Taman Peninsula in the Black and Azov seas almost to the Absheron Peninsula on the shores of the Caspian Sea. The ridges of the Greater Caucasus are steeply sloped, strongly and deeply dissected, with alpine glacial and paleoglacial relief in the upper parts (troughs, cirques, and in some places cirque stairs), and rocky peaked ridges. There are about 200 peaks with a height of more than 4000 m in the Greater Caucasus and three dozen with a height of 4500 m or more. This mountain is divided into three parts—western, central, and eastern (Figure 1).

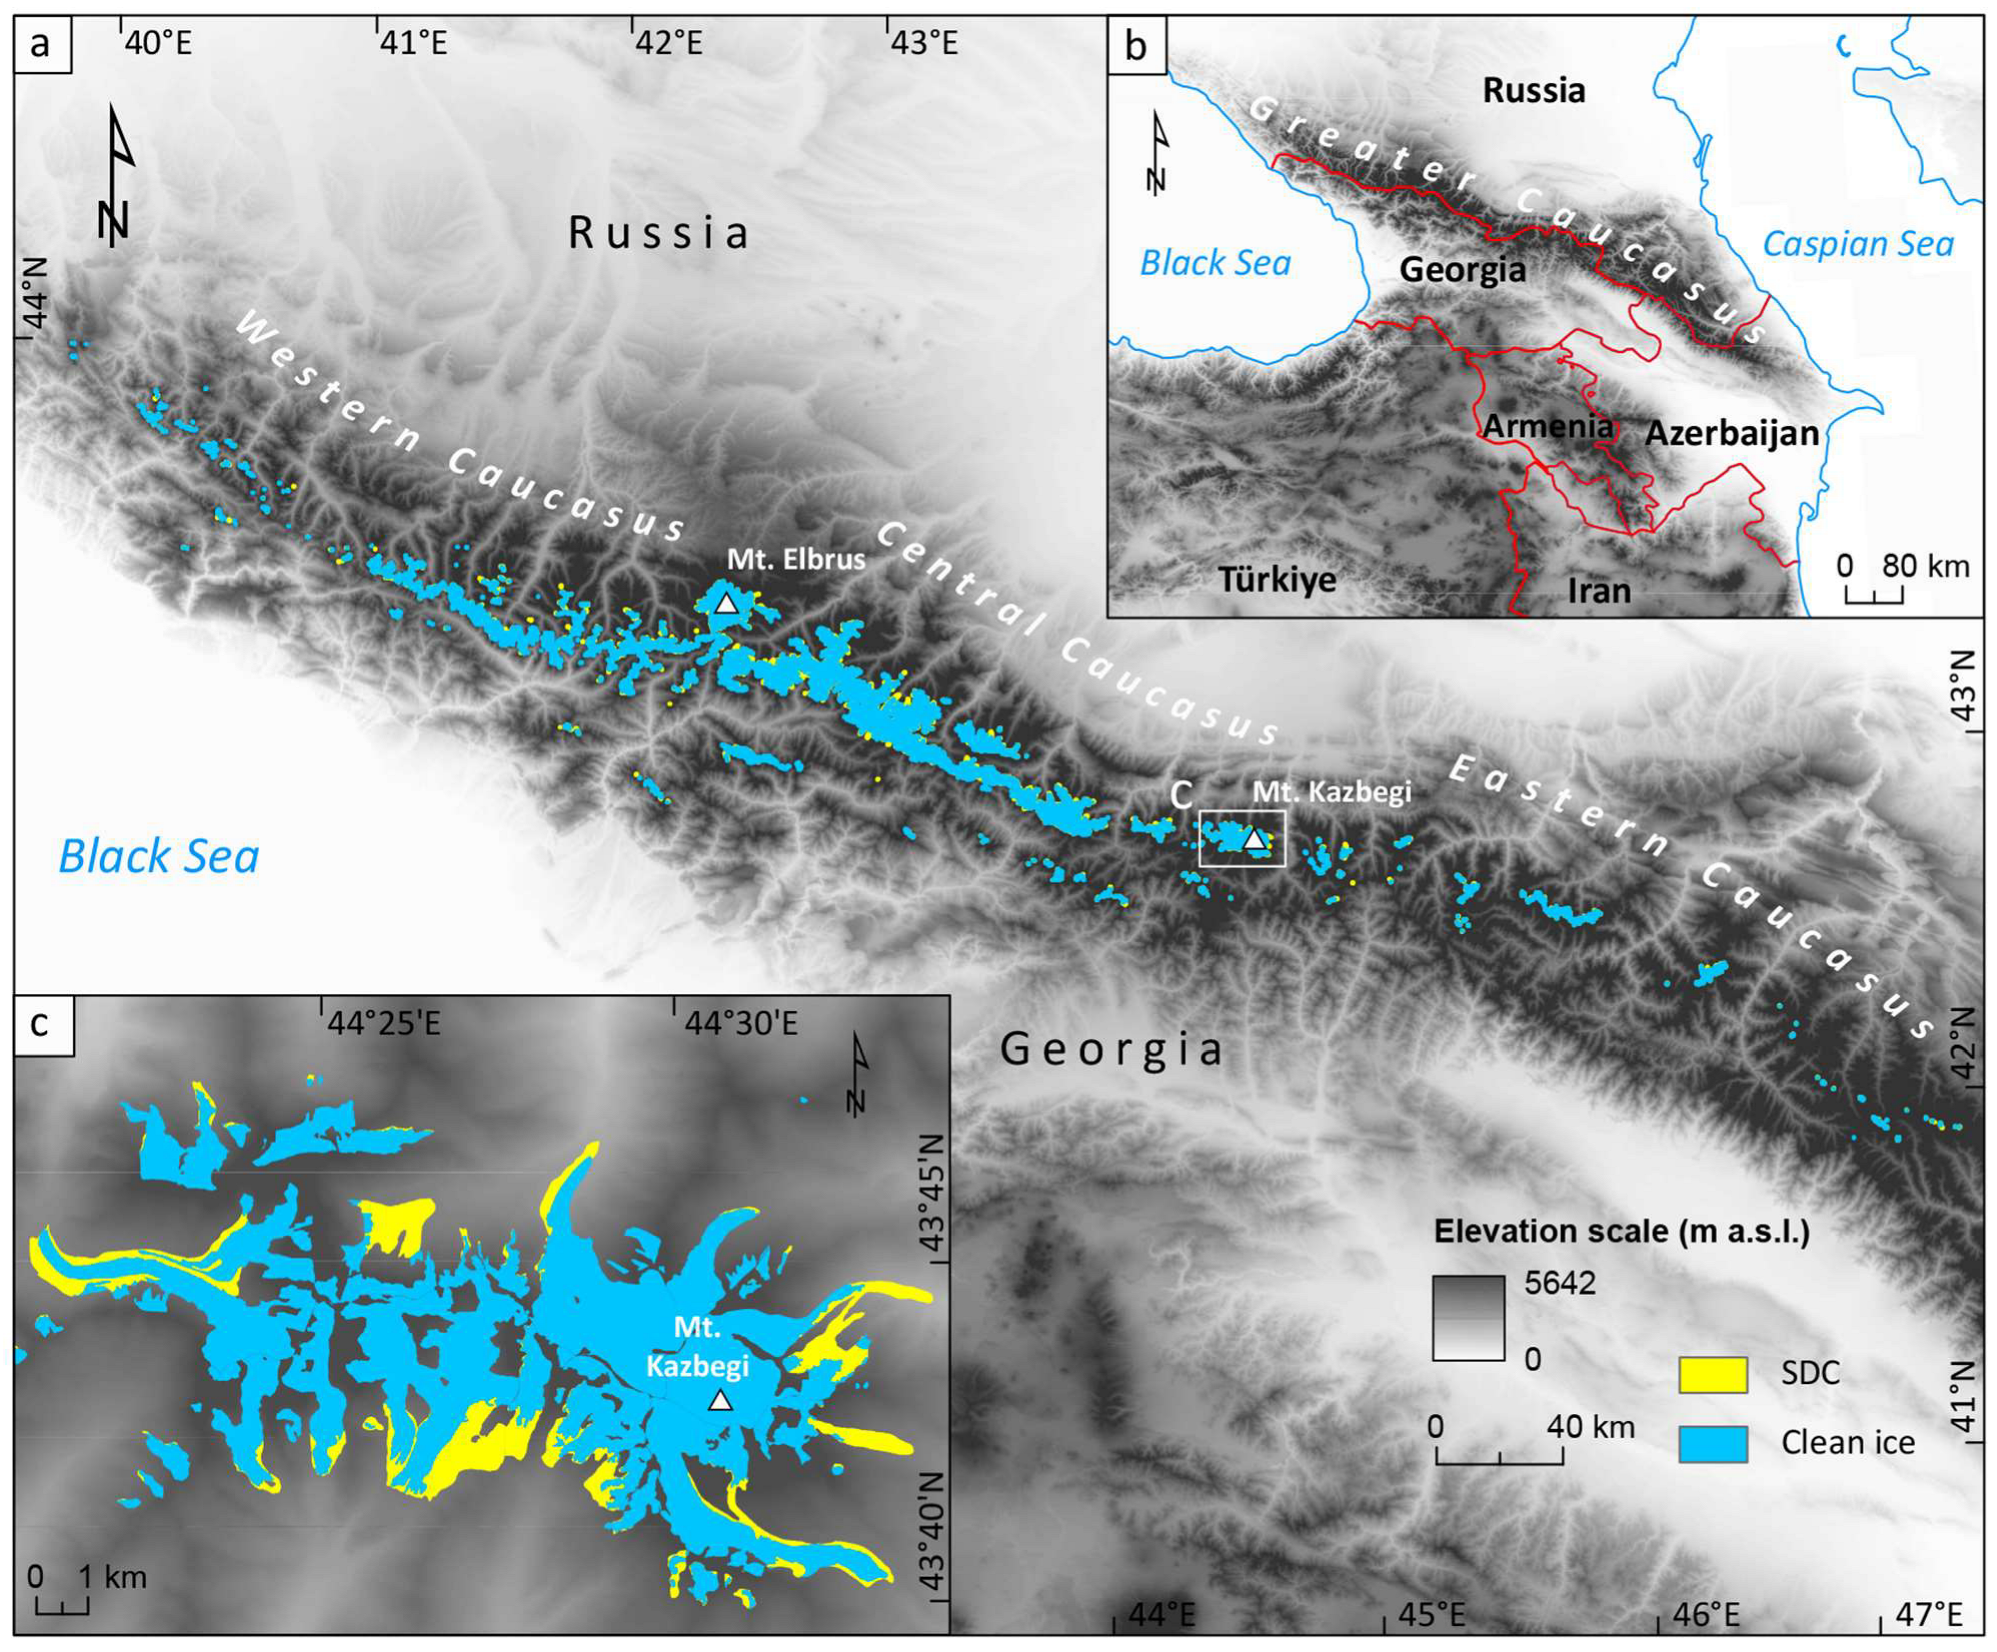
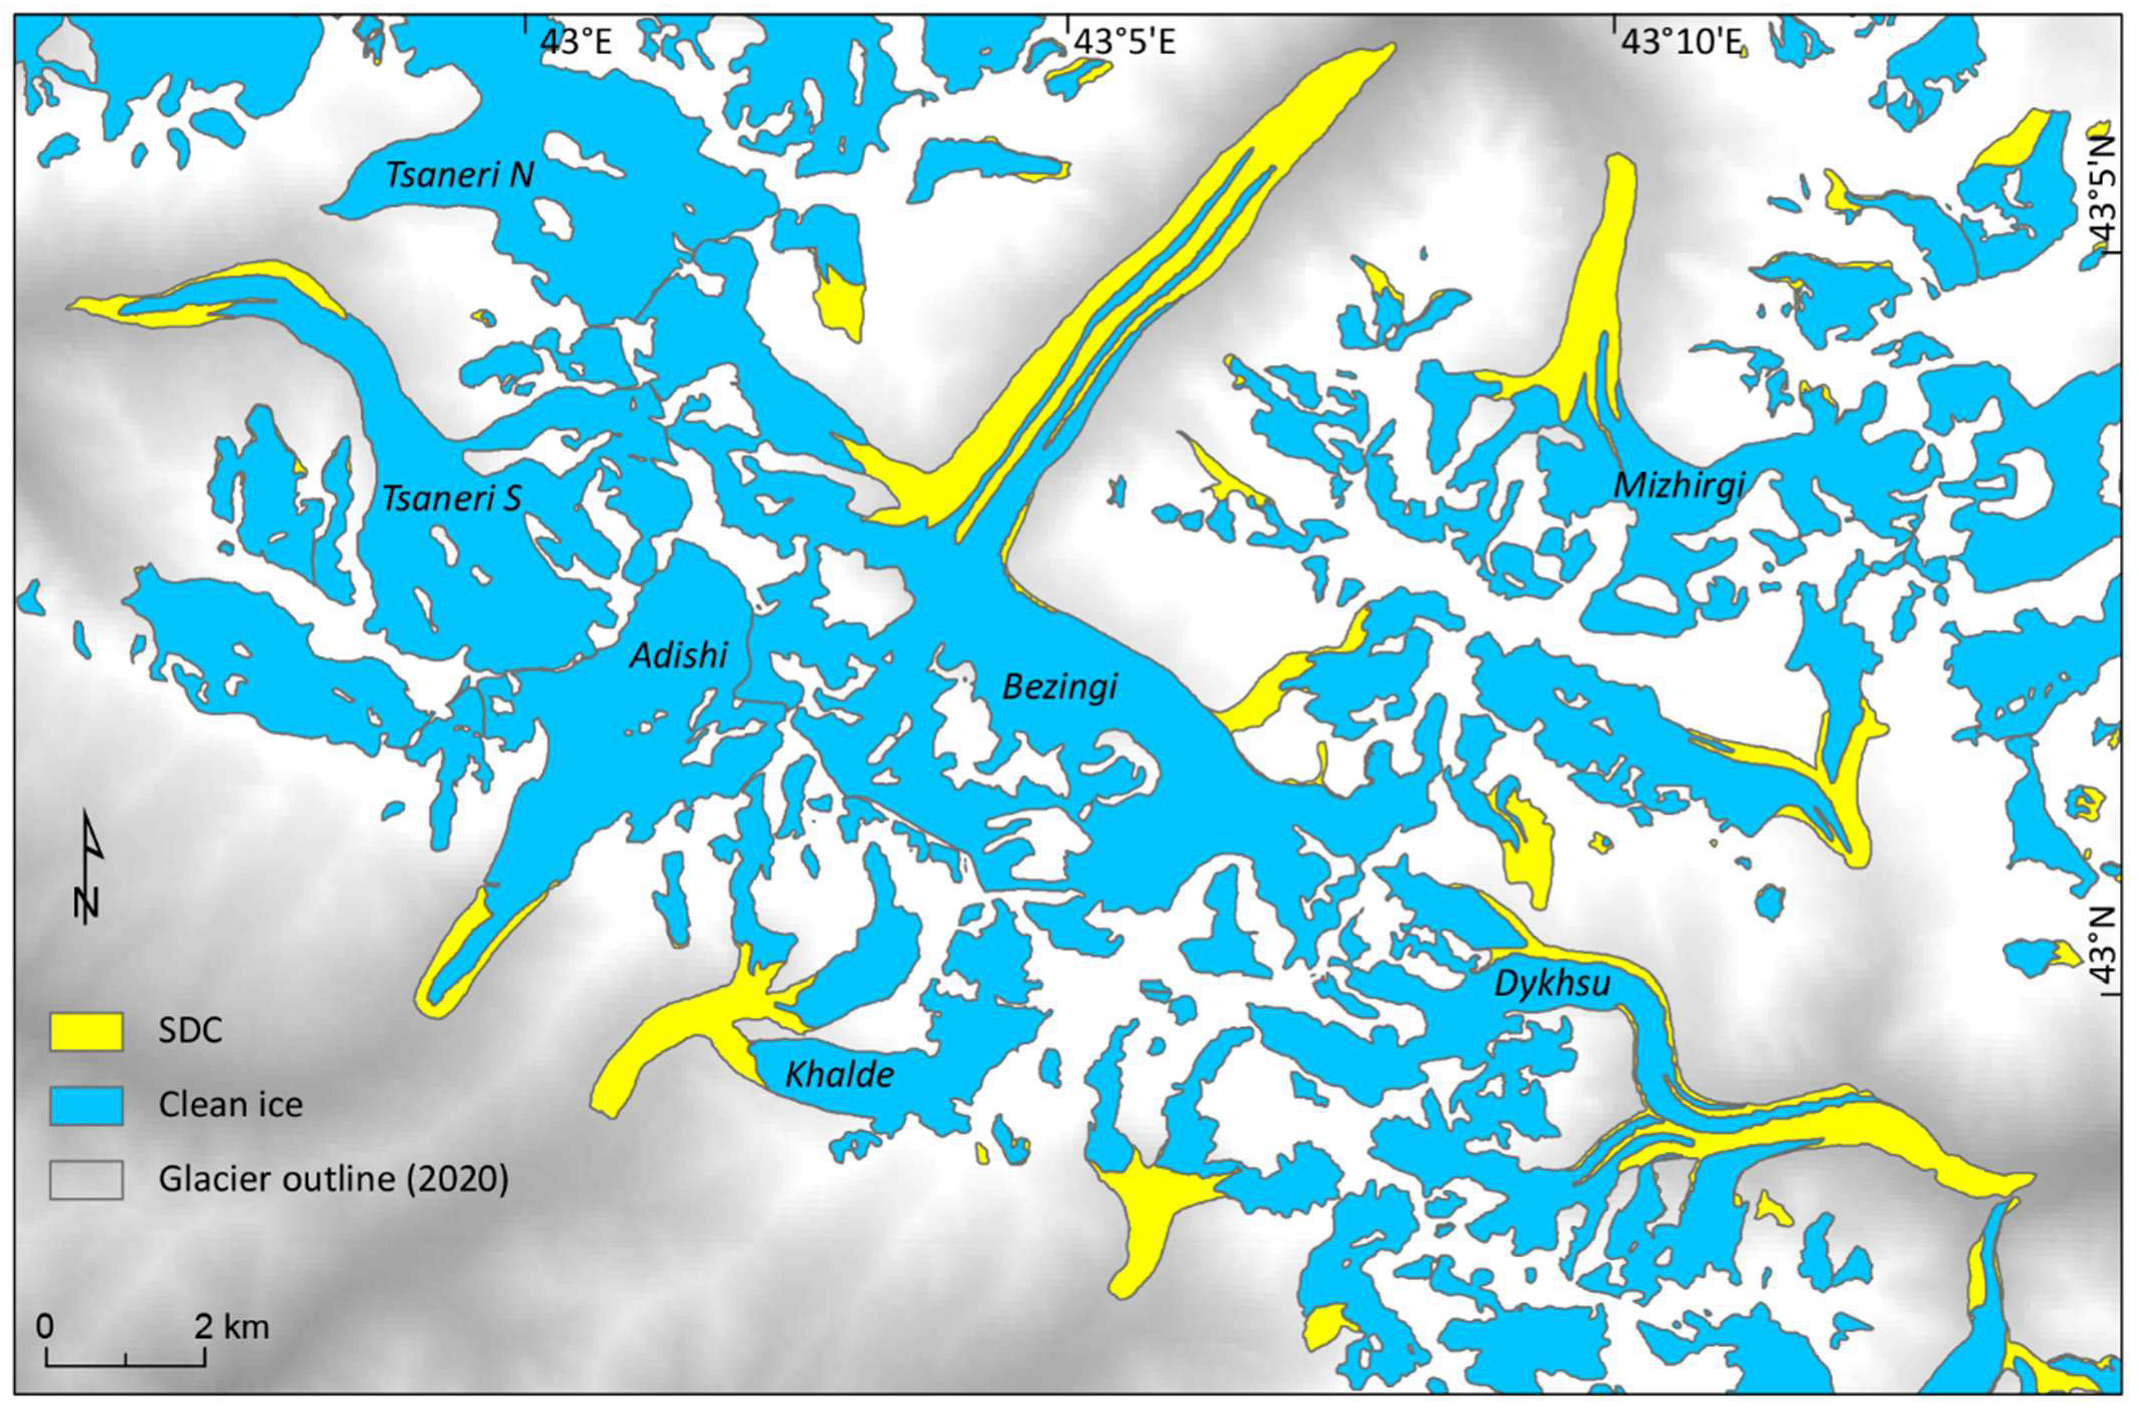
Figure 1.
(a)—Regional division of the Greater Caucasus and the extent of modern glaciers (2020); (b)—The location of the Caucasus region relative to surrounding countries; (c)—Enlarged image of the Mt Kazbegi Region (See white box in panel (a)). Blue corresponds to clean ice while yellow corresponds to supra-glacial debris cover (SDC). The thermal emission and reflection radiometer (ASTER) global digital elevation model (GDEM) (2011) was used as a background in all panels.
The western Greater Caucasus extends from the Black Sea to the highest point of the Caucasus—Mount Elbrus (5642 m a.s.l.). It is the lowest section of this mountain region with the highest peak being Mt Dombay-Ulgen (4046 m a.s.l.). The central Greater Caucasus stretches from Mt Elbrus to Mt Kazbegi (5047 m a.s.l.) and contains at least 7 peaks above the 5000 m a.s.l. This is the widest part of this mountainous region, stretching 180 km around the Elbrus meridian. The eastern Greater Caucasus is the longest section of the mountain region and lies between Mt Kazbegi and the Absheron Peninsula. The highest peak of the eastern section is Mt Tebulosmta (4493 m a.s.l.). Glacial forms are less pronounced in the eastern Greater Caucasus due to the development of clayey shales that are less resistant to denudation [42,43].
The climatic regions of the Caucasus Mountains are diverse because of different topography, air currents, and local circulation. Changes in climatic conditions in the Caucasus occur in various directions. From the western part of the Greater Caucasus toward the east, the continental climate increases. From north to south, the total solar radiation increases. Throughout the year, different air masses penetrate, such as Arctic cold air, humid air of the Mediterranean tropics, Atlantic humid air masses, or dry and dusty Central Asian and Middle East air. In the northern Caucasus in winter, mainly continental air of temperate latitudes dominates. In winter, low-pressure areas form over the Black and Caspian seas, resulting in strong cold winds. The Asian anticyclone moves to the east, which reduces the amount of snow.
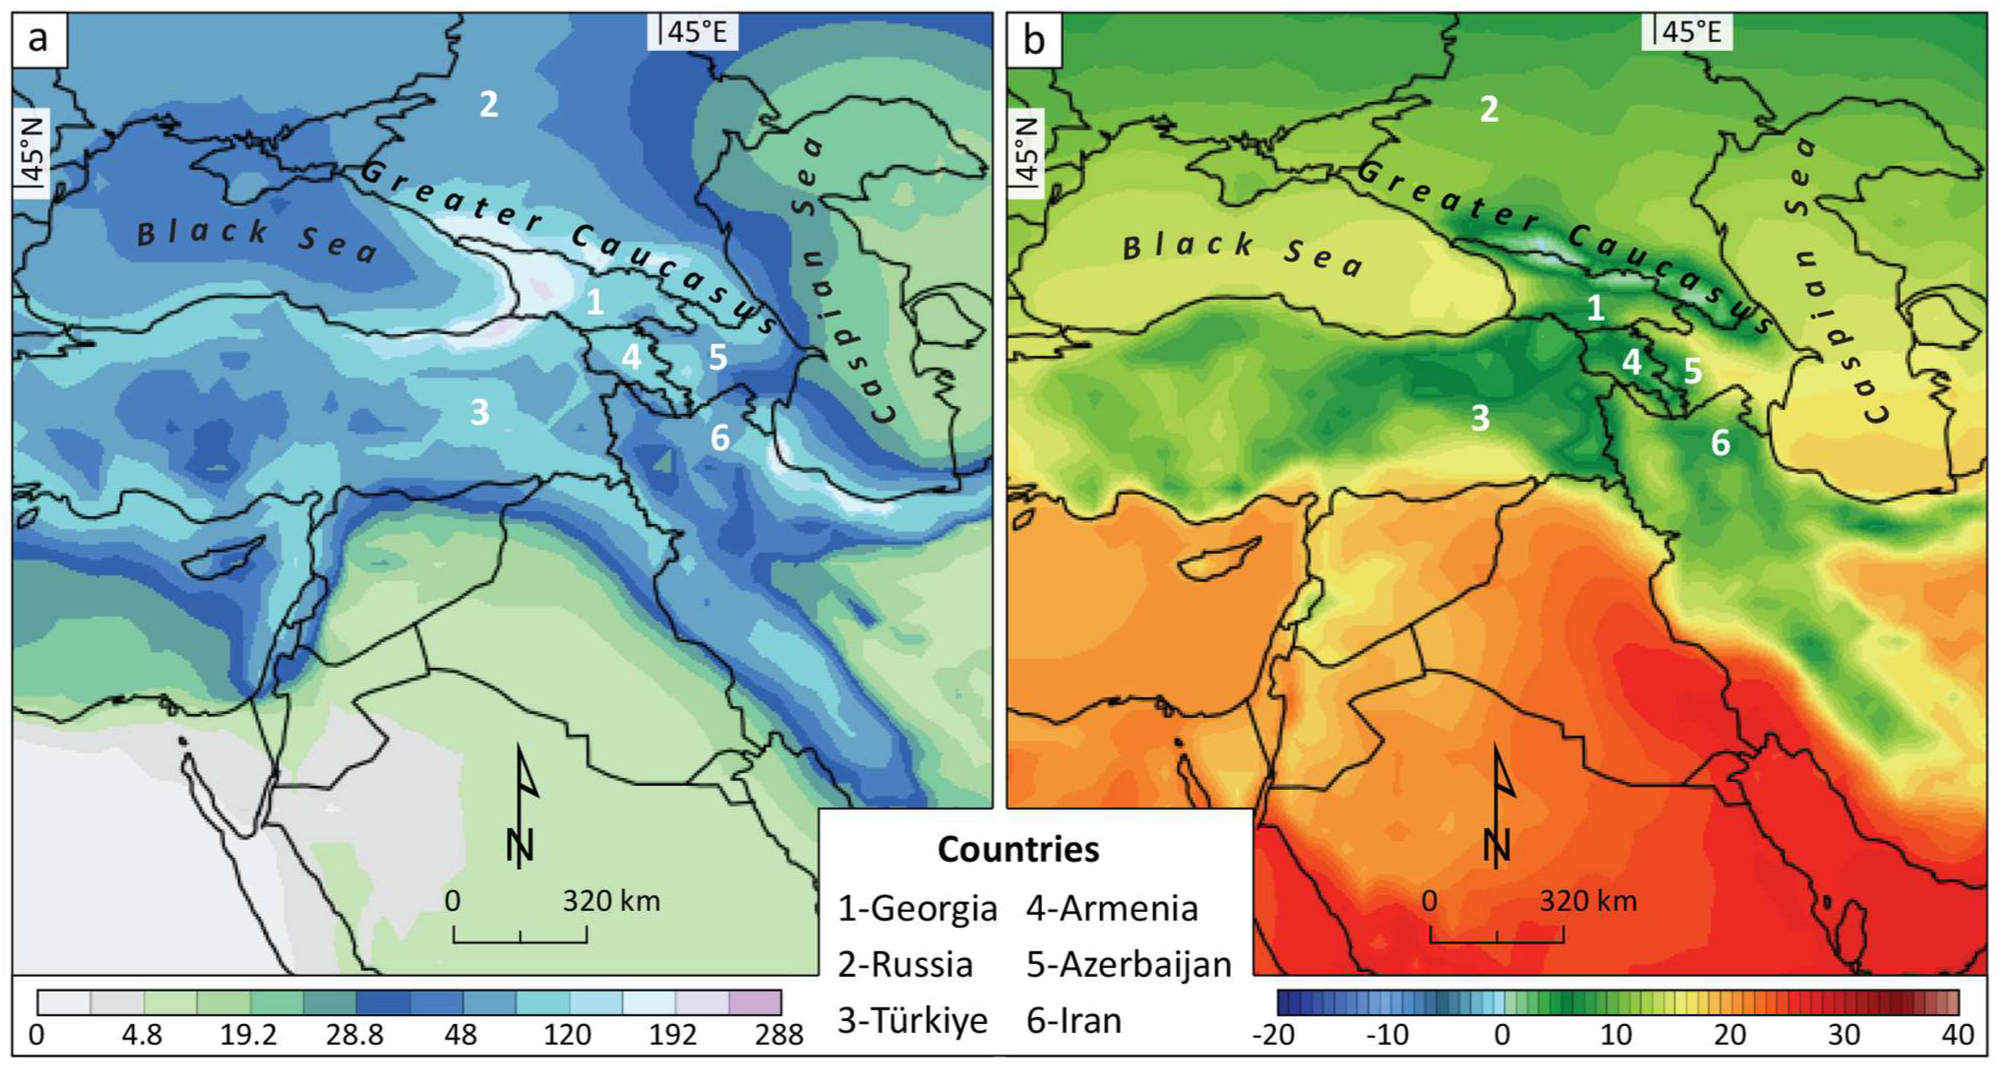
In the northern Caucasus, Atlantic cyclones bring the maximum amount of precipitation in the first half of summer. In mid-summer, air masses transform over the southeast of the East European Plain, which leads to a decrease in precipitation. The annual rate of precipitation in the northwest and central lowlands reaches 550–600 mm (Figure 2a). Rising from the foothills to the mountains, the amount of annual precipitation increases and ranges between 2000 and 2500 mm at 2500 m a.s.l. in the west and declines to 800–1150 mm in the east on the northern slope of the Greater Caucasus [44]. The southern slopes of the Greater Caucasus are more humid. The average precipitation in the southwest of the Greater Caucasus ranges between 3000 and 3200 mm. To the southeast, it decreases further and amounts to 2000 mm in the central part and to 1000 mm in the eastern part [45].

Figure 2.
(a)—Sum of the precipitation (cm) for all months, and (b)—2 m annual surface temperatures (°C) derived from Climate Reanalyzer, based on ERA5 (0.5° × 0.5°) between 01/1940 and 04/2024 for the Caucasus and the Middle East region (© ClimateReanalyzer.org).
In the Greater Caucasus, the air temperature decreases noticeably with altitude. Above an elevation of approximately 2000 m, a westerly air current prevails, strengthening maritime influences and greatly moderating climatic conditions (Figure 2b). Average air temperatures reach −8 °C in January and 13 °C in August. The average annual air temperature (1907–1995) at an elevation of 2900 m a.s.l. in the central Greater Caucasus is about −2.2 °C, while it reaches −5.7 °C (1907–2009) at 3600 m a.s.l. [35]. The average summer temperature in the mountainous region of the Greater Caucasus has increased by 0.5–0.7 °C over the past 30 years [46]. Recent instrumental measurements for individual glaciers over the past 50 years also show that the summer lapse rate can reach −7.8 °C/km (Zopkhito Glacier) or even −9.8 °C/km (Chalaati Glacier) [39]. The southwestern slopes of the Greater Caucasus are often covered with a 3–4-m blanket of snow for five or more months (November–April) [47].
The dynamics of glaciers in the Greater Caucasus are strongly influenced by multiannual variability in temperatures and precipitation and modulated by morphometric factors [48]. Here, a warming trend has been observed since the end of the Little Ice Age (LIA). However, the accelerated retreat beginning in the 1980s [49] can be correlated with an increase in summer temperatures and a decrease in precipitation during the same season [50]. According to the recent inventory [33], there were 2223 glaciers with a total area of 1060.9 ± 33.6 km2. Up to 70% of the total number and area of these glaciers is concentrated in the Central Greater Caucasus.
4. Data and Methods
4.1. Data
The analysis of glaciers in the Greater Caucasus region utilizes a variety of satellite data sources, including radar and optic satellite images and high-resolution elevation from DEMs vectorial data from the Global Land Ice Measurements from Space (GLIMS) Glacier Database. These datasets are combined to construct a robust and nuanced view of the glacial topography, vegetation, and ice cover. This multi-source data integration ensures a more accurate and comprehensive analysis, crucial for informed environmental decision-making and research.
The data involved in the creation of the 2020 Caucasus glacier dataset consist of Sentinel-1 SAR (Table A1), Sentinel-2 (Table A2) imagery, and advanced land observing satellite (ALOS)/phased array type L-band synthetic aperture radar (PALSAR) high-resolution terrain corrected digital elevation model (DEM) (Table A3), as illustrated by Holobâcă et al. [32] in a study focused on the Ushba and Chalaati glaciers. For SAR imagery, single-look complex (SLC) data are specifically chosen, comprising six pairs of ascending and five pairs of descending C-band Sentinel-1A and Sentinel-1B images (Figure 3). These images have a spatial resolution of 5 × 20 m and dual polarization, both with vertical transmit, horizontal receive (VH), and vertical transmit, vertical receive (VV). The acquisition mode is interferometric wide (IW). Each SAR image pair corresponds to a particular orbit path. Regarding the revisit time of the SAR data, the shortest time interval of 12 days between 2 acquisitions from the same orbit is chosen, which is specific for the latitude of the Greater Caucasus area.
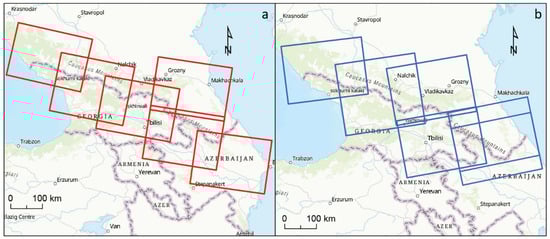
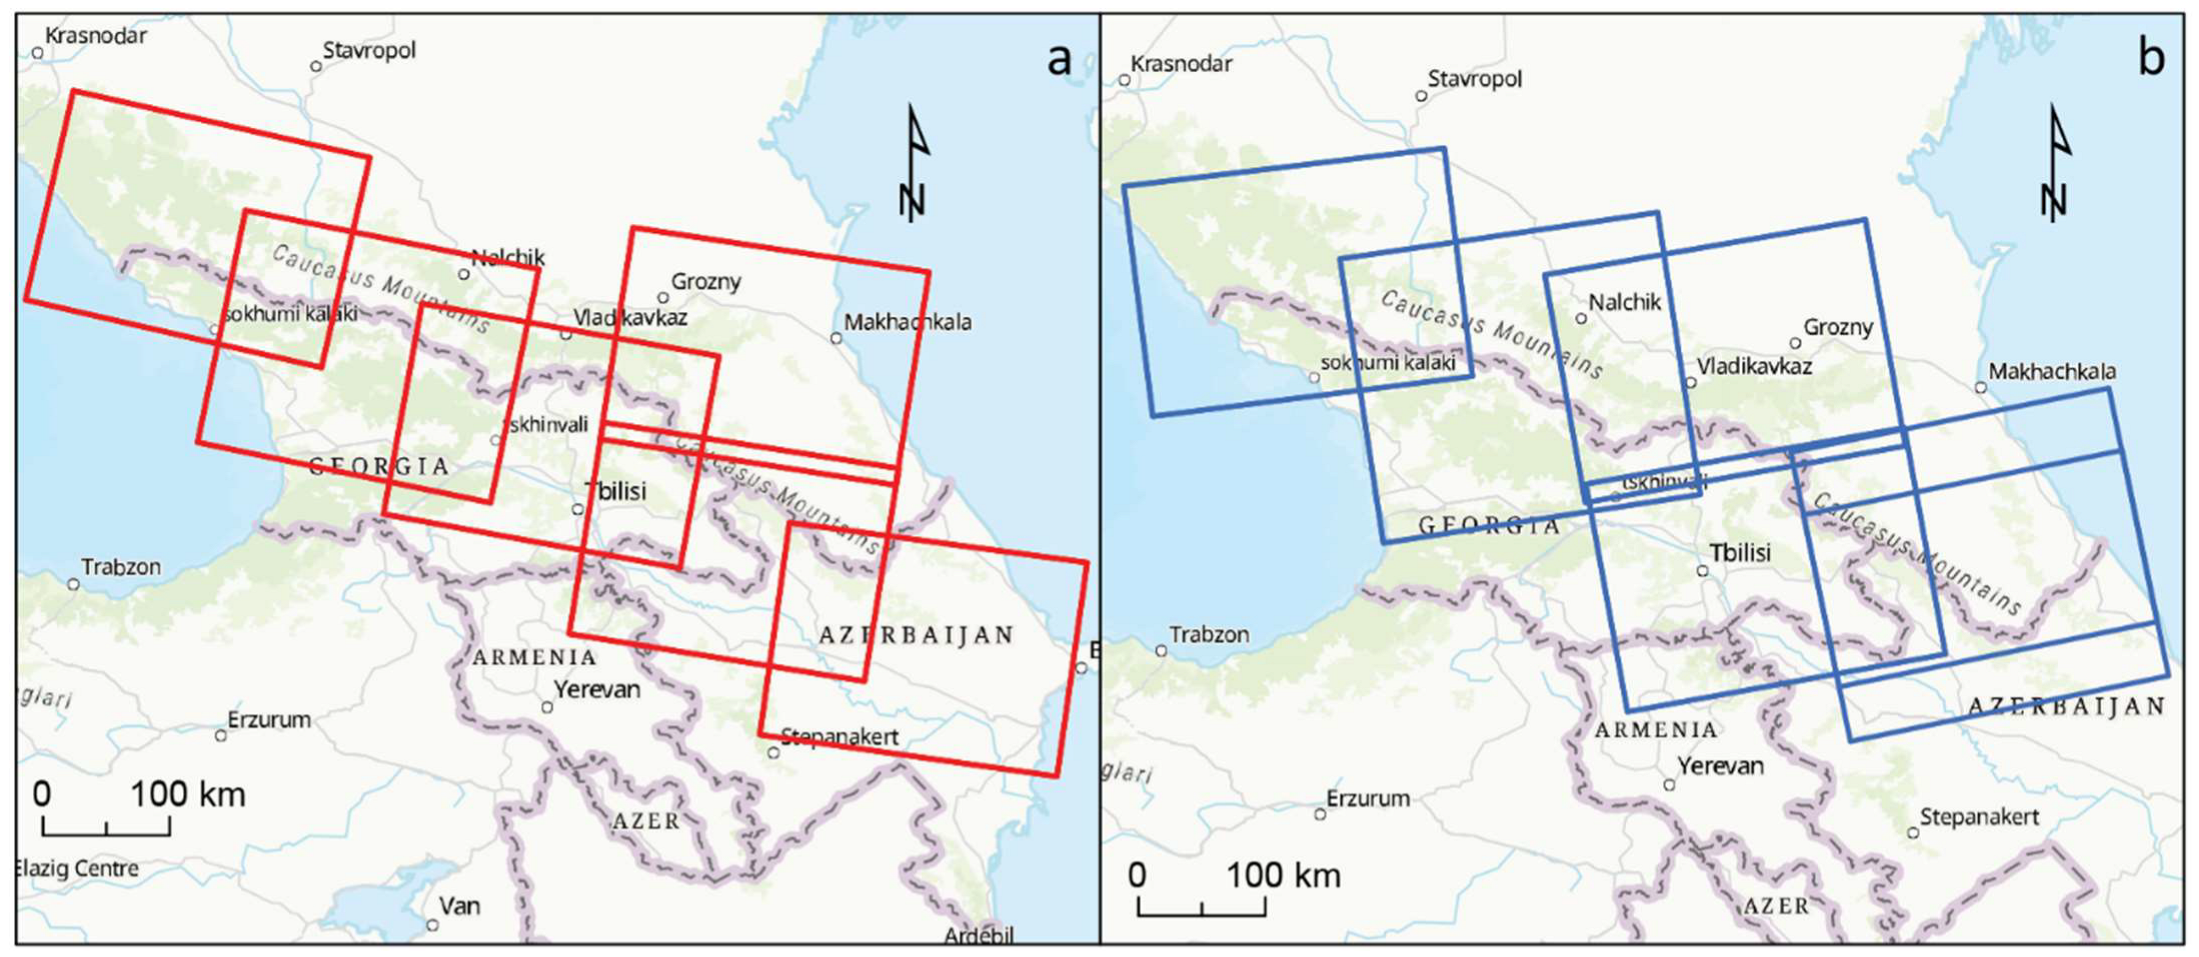
Figure 3.
The footprints of descending (a) and ascending (b) Sentinel-1 image pairs. Basemap © Esri, TomTom, Garmin, FAO, NOAA, USGS was used as a background.
The green (B3), red (B4), visible and near-infrared (B5), and short-wave infrared (B11) bands from Sentinel-2 are used for the calculation of the NDVI (normalized difference vegetation index) and NDSI (normalized difference snow index) spectral indices, as will be described below. In areas not covered by the ALOS-PALSAR DEM, the terra advanced spaceborne thermal emission and reflection radiometer (ASTER) global elevation model (GDEM) with a 30 m resolution is employed (Table 1). This GDEM was also used for topographic parameters such as elevation and slope distribution for supra-glacial debris-covered areas. The time interval between August and September 2019 and 2020 is taken into consideration for Sentinel-1 and Sentinel-2 data selection. For Sentinel-2 imagery, due to the high cloud cover percentage, data from 2019 are also selected.

Table 1.
Information regarding the remote sensing data used in the creation of the inventory.
The Sentinel-2 data are downloaded from the Copernicus Open Space Data System (https://dataspace.copernicus.eu/browser/, accessed on 27 October 2023). The ALOS-PALSAR DEM, with a resolution of 12.5 m, and Sentinel-1 SAR data were sourced from the Vertex web platform of the Alaska Satellite Facility Distributed Active Archive Center (ASF DAAC) (https://search.asf.alaska.edu/, accessed on 22 November 2023) (ASF DAAC, 2006; 2007; 2008; 2020). The ASTER-GDEM (2011) version 3 data were obtained from the National Aeronautics and Space Administration (NASA) Earthdata Search web portal (https://search.earthdata.nasa.gov/, accessed on 8 November 2023).
The GLIMS Glacier Database is a spatio-temporal dataset developed and implemented at the National Snow and Ice Data Center (NSIDC) in Boulder, Colorado, USA. This database encompasses glacier outlines alongside various metadata, including details regarding the analysts involved, processing techniques employed, and dimensional data such as width or length [51]. For this study, a subset of this dataset is used, encompassing the Greater Caucasus region. It is obtained from the GLIMS Glacier Viewer web interface (https://www.glims.org/maps/glims, accessed on 21 February 2024) in shapefile format [52] and consists of polygon data from which glacier outlines corresponding to the year 2020 are extracted.
4.2. Methods
The 2020 supra-glacial debris-covered glacier inventory for the Greater Caucasus region was created by adapting the DebCovG-carto toolbox following the steps outlined by Holobâcă et al. [32]. DebCovG-carto is an algorithm that automatically delineates bare ice and debris-covered glacier surfaces by means of optical and radar imagery. The upcoming sections will provide a thorough description of the stages involved in developing this inventory.
4.2.1. Pre-Processing of SAR Data
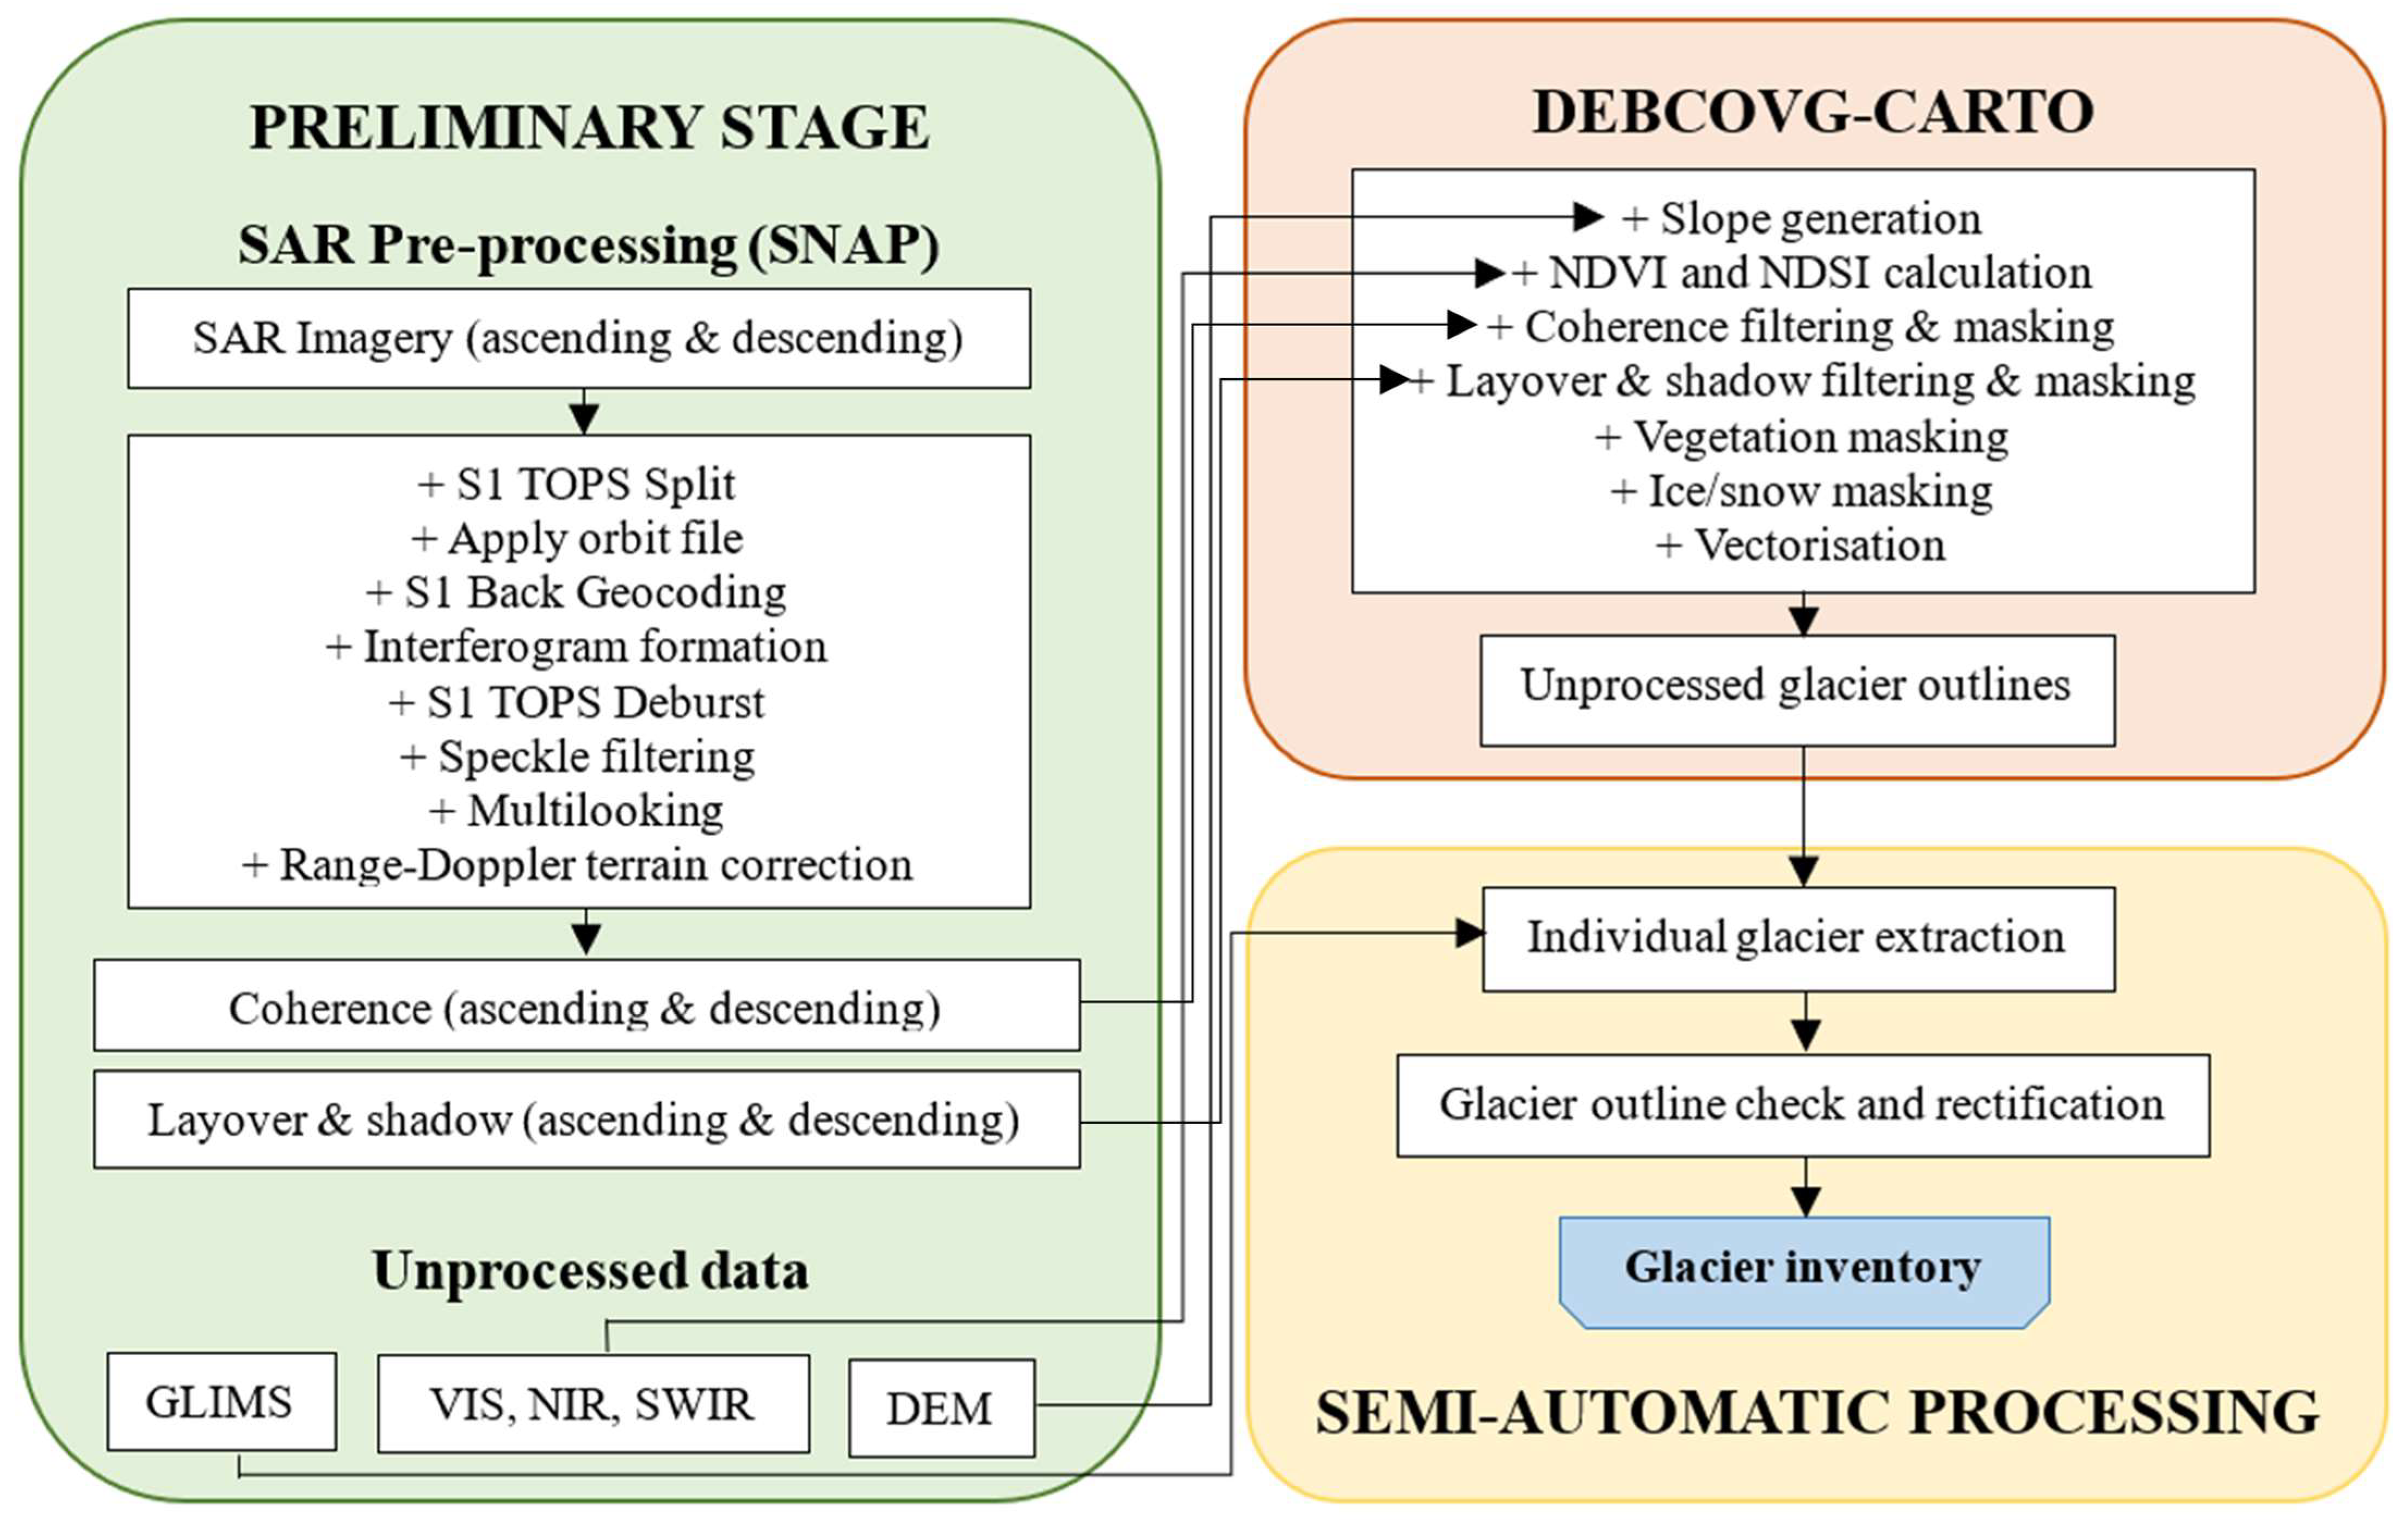
Before incorporating Sentinel-1 SAR data into the DebCovG-carto algorithm, a pre-processing stage is necessary. All pre-processing steps were executed using tools available in the Sentinel Application Platform (SNAP v10.0.0) open-source software, provided freely by the European Space Agency (ESA). The objective of SAR data pre-processing is to compute coherence, layover, and shadow for each ascending and descending pair of images, as illustrated in Figure 4.
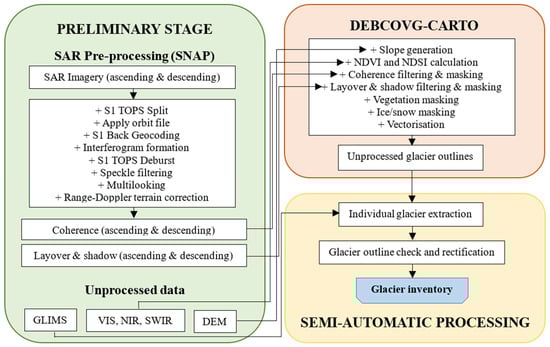
Figure 4.
Flowchart of the processing steps for the mapping of supra-glacial debris cover in the Greater Caucasus.
To begin, the Sentinel-1 imagery is divided into sub-swaths and bursts based on the area of interest (AOI). After accurately positioning the resulting SAR imagery with the SNAP function Apply Orbit File, co-registration of images in each pair is performed using a 30-m resolution shuttle radar topography mission (SRTM) digital elevation model (DEM). Subsequently, interferograms are generated for each SAR image pair. During this step, the effect of terrain altitude variation is removed by subtracting the topographic phase from the interferogram, and the product is de-bursted (the individual bursts are organized into a single dataset).
Speckle noise is then eliminated using the Lee Sigma filter and Multi-looking function, enhancing the signal-to-noise ratio. Finally, geometrical distortions in the interferogram are corrected and the data are spatially referenced using the Range-Doppler Terrain Correction tool. This step also involves generating layover and shadow masks for subsequent use in the DebCovG-carto algorithm.
4.2.2. DebCovG-Carto Algorithm
The DebCovG-carto toolbox offers a novel approach to outlining debris-covered glaciers. It leverages coherence data resulting from the displacement of ice within a specified timeframe [32]. The algorithm first employs thresholding and masking of both ascending and descending coherence images. Subsequently, these images are merged and areas exhibiting low coherence due to layover or shadow are excluded. Next, it successively filters out elements that contribute to image decorrelation (e.g., slope, vegetation), retaining only coherence loss attributable to surface movement. Utilizing NDSI data, the algorithm then distinguishes between ice or snow and debris-covered glacier surfaces. The resulting raster file is converted to vector format, yielding outlines of previously described glacier types identifiable by class codes.
For this endeavor, the algorithm was optimized for efficient processing of large datasets. The primary modification compared to the version employed by Holobâcă et al. [32] involves the integration of algorithms for calculating NDSI and NDVI. Additionally, the toolbox was made compatible with the Environmental Systems Research Institute (ESRI) ArcGIS Pro 3.2.1 geospatial data processing software. This integration aimed to streamline data input within a single geoprocessing tool interface.
4.2.3. Semi-Automatic Processing
In order to extract individual glacier boundaries from the unprocessed DebCovG-carto algorithm outputs, a comprehensive geoprocessing workflow was developed within the ArcGIS Pro Model Builder tool. This workflow automates the extraction process by iterating through each entity within the GLIMS Glacier Database and extracting it from the algorithm-generated shapefile. The extracted individual glacier feature classes are subsequently exported into a geodatabase. Each glacier boundary undergoes a rigorous manual verification process to identify and rectify jagged lines, redundant polygons that might have been introduced during the raster-to-vector conversion, and topological errors, including overlapping polygons or gaps between the polygons. Finally, the feature classes are merged according to their designated class codes and converted into a shapefile data format to enhance data accessibility (Figure 5).
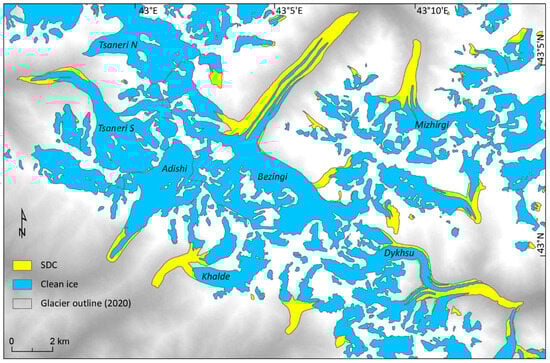
Figure 5.
An example of supra-glacial debris cover mapping in the Greater Caucasus using the DebCovG-carto toolbox [32] and existing glacier outlines from 2020 [33]. ASTER GDEM (2011) was used as a background.
The buffer method was used for uncertainty estimation for both clean-ice and debris-covered glacier parts. For the clean ice, a 10 m buffer was used, yielding an average uncertainty of 3.6%. For the debris-covered parts, the buffer size was doubled and a 20 m buffer was used, generating an average uncertainty of 5.6%. Uncertainty estimates for all Caucasus glaciers are described in more detail in previous studies [16,33].
5. Results
Results reveal that the total area of the glaciers in the Greater Caucasus was 1060.1 ± 31.5 km2 in 2020, where we identified 109.7 ± 6.1 km2 or 10.3 ± 5.6% as a debris-covered area, while the rest of the parts (950.4 ± 30.9 km2) as debris-free ice. The percentage difference in the distribution of supra-glacial debris cover was heterogeneous by regions and slopes. The western Greater Caucasus had the lowest percentage (~7.1%) of supra-glacial debris cover, with the lowest mean elevation (~2984 m a.s.l.). The percentage of debris-covered ice was highest in the eastern Greater Caucasus (~18.0%) with the highest mean elevation (~3527 m a.s.l.). The northern slopes of the Greater Caucasus also experienced a higher percentage distribution of supra-glacial debris cover than the southern (Figure 6a). The mean elevation of supra-glacial debris cover was relatively lower (~3240 m a.s.l) than the clean ice (~3320 m a.s.l.) for the entire mountain region (Figure 6b). Distribution of the supra-glacial debris cover varied markedly in average slope (Figure 6c) and altitudinal range (Figure 6d). Hypsometric distributions (Figure 6d) suggest that the significant amount and area of supra-glacial debris cover was distributed between 2200 and 4200 m a.s.l. but the debris-covered ice was limited above 4200 m a.s.l. The distribution of supra-glacial debris cover according to mean elevation is shown in Figure 7.
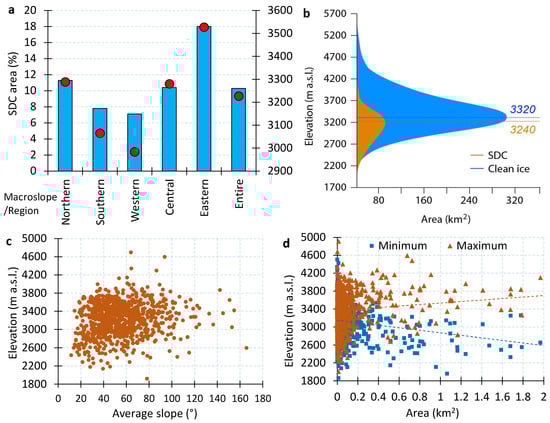
Figure 6.
(a)—Percentage distribution of the supra-glacial debris cover (SDC—blue) vs. mean elevation (red); (b)—Hypsometric distribution curve of supra-glacial debris cover and clean ice for the entire Greater Caucasus. The dotted line corresponds to the mean elevation; (c)—Average slope vs. mean elevation for individual SDC parts of the glaciers for the entire Greater Caucasus; (d)—Minimum and maximum elevation for individual SDC parts of the glaciers for the entire Greater Caucasus.

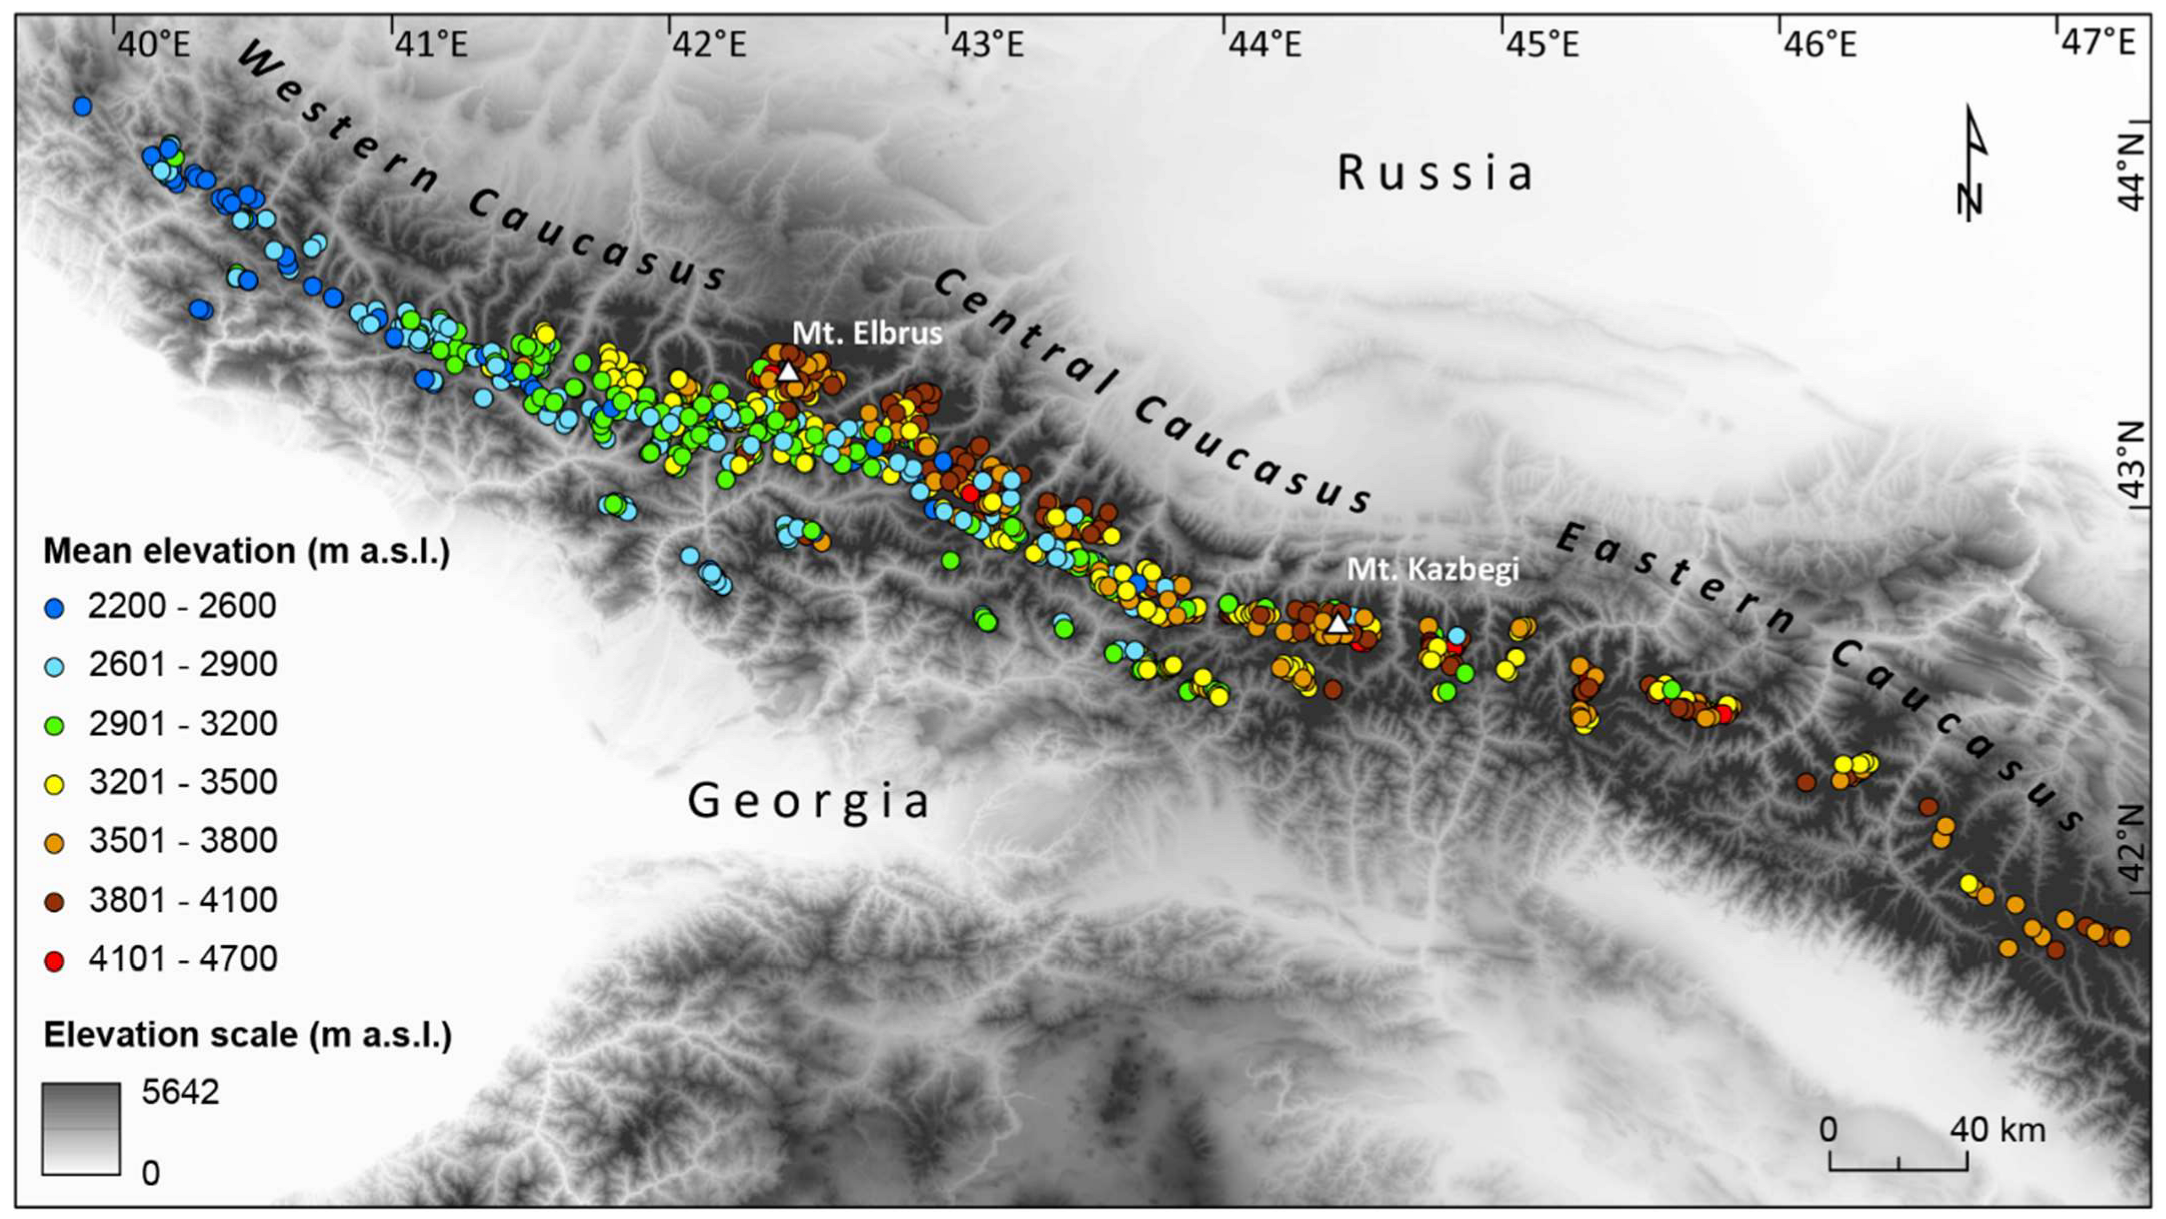
Figure 7.
Spatial distribution of mean elevation (color-coded) for supra-glacial debris-covered parts of the glaciers in the Greater Caucasus in 2020.
6. Discussion
6.1. Regional Distribution of Supra-Glacial Debris Cover
Hypsometric distribution of supra-glacial debris cover according to the different regions, such that the lowest percentage of the debris-covered area (Figure 6a) is associated with the lowest mean elevation and vice versa, shows a clear signal of altitudinal effects on debris cover distribution in the Greater Caucasus. The heterogeneous findings between the regions (western, central, and eastern) can be related to different climates and lithology. For example, most of the river basins in the eastern Greater Caucasus are characterized by relatively high denudation rates as they are built on Jurassic sedimentary rocks [42,43], supporting the highest probability of formation of supra-glacial debris cover. Furthermore, high denudation and associated rockfalls onto glacier surfaces from surrounding slopes often contribute to the formation of heavily debris-covered glaciers, sometimes misclassified as active rock glaciers [53]. A relatively small percentage of the supra-glacial debris cover in the central Greater Caucasus can be also caused by the morphology and lithology of the local landscape, e.g., glacier tongues in the central Greater Caucasus are relatively steeper than their eastern and western counterparts and hence less favorable for debris cover accumulation. Furthermore, the relief of the central Greater Caucasus is mainly constructed from crystalline slates and quartz diorites, which are more resistant and less prone to the formation of rock avalanches. There is no clear geographic template that explains the lowest percentage distribution of supra-glacial debris cover in the western Greater Caucasus, specifically when a previous study by Tielidze et al. [16] showed the highest percentage increase in supra-glacial debris cover in this region. A proper explanation of this may require a detailed field study and could be part of a separate investigation.
6.2. Increased Supra-Glacial Debris Cover between 2014 and 2020
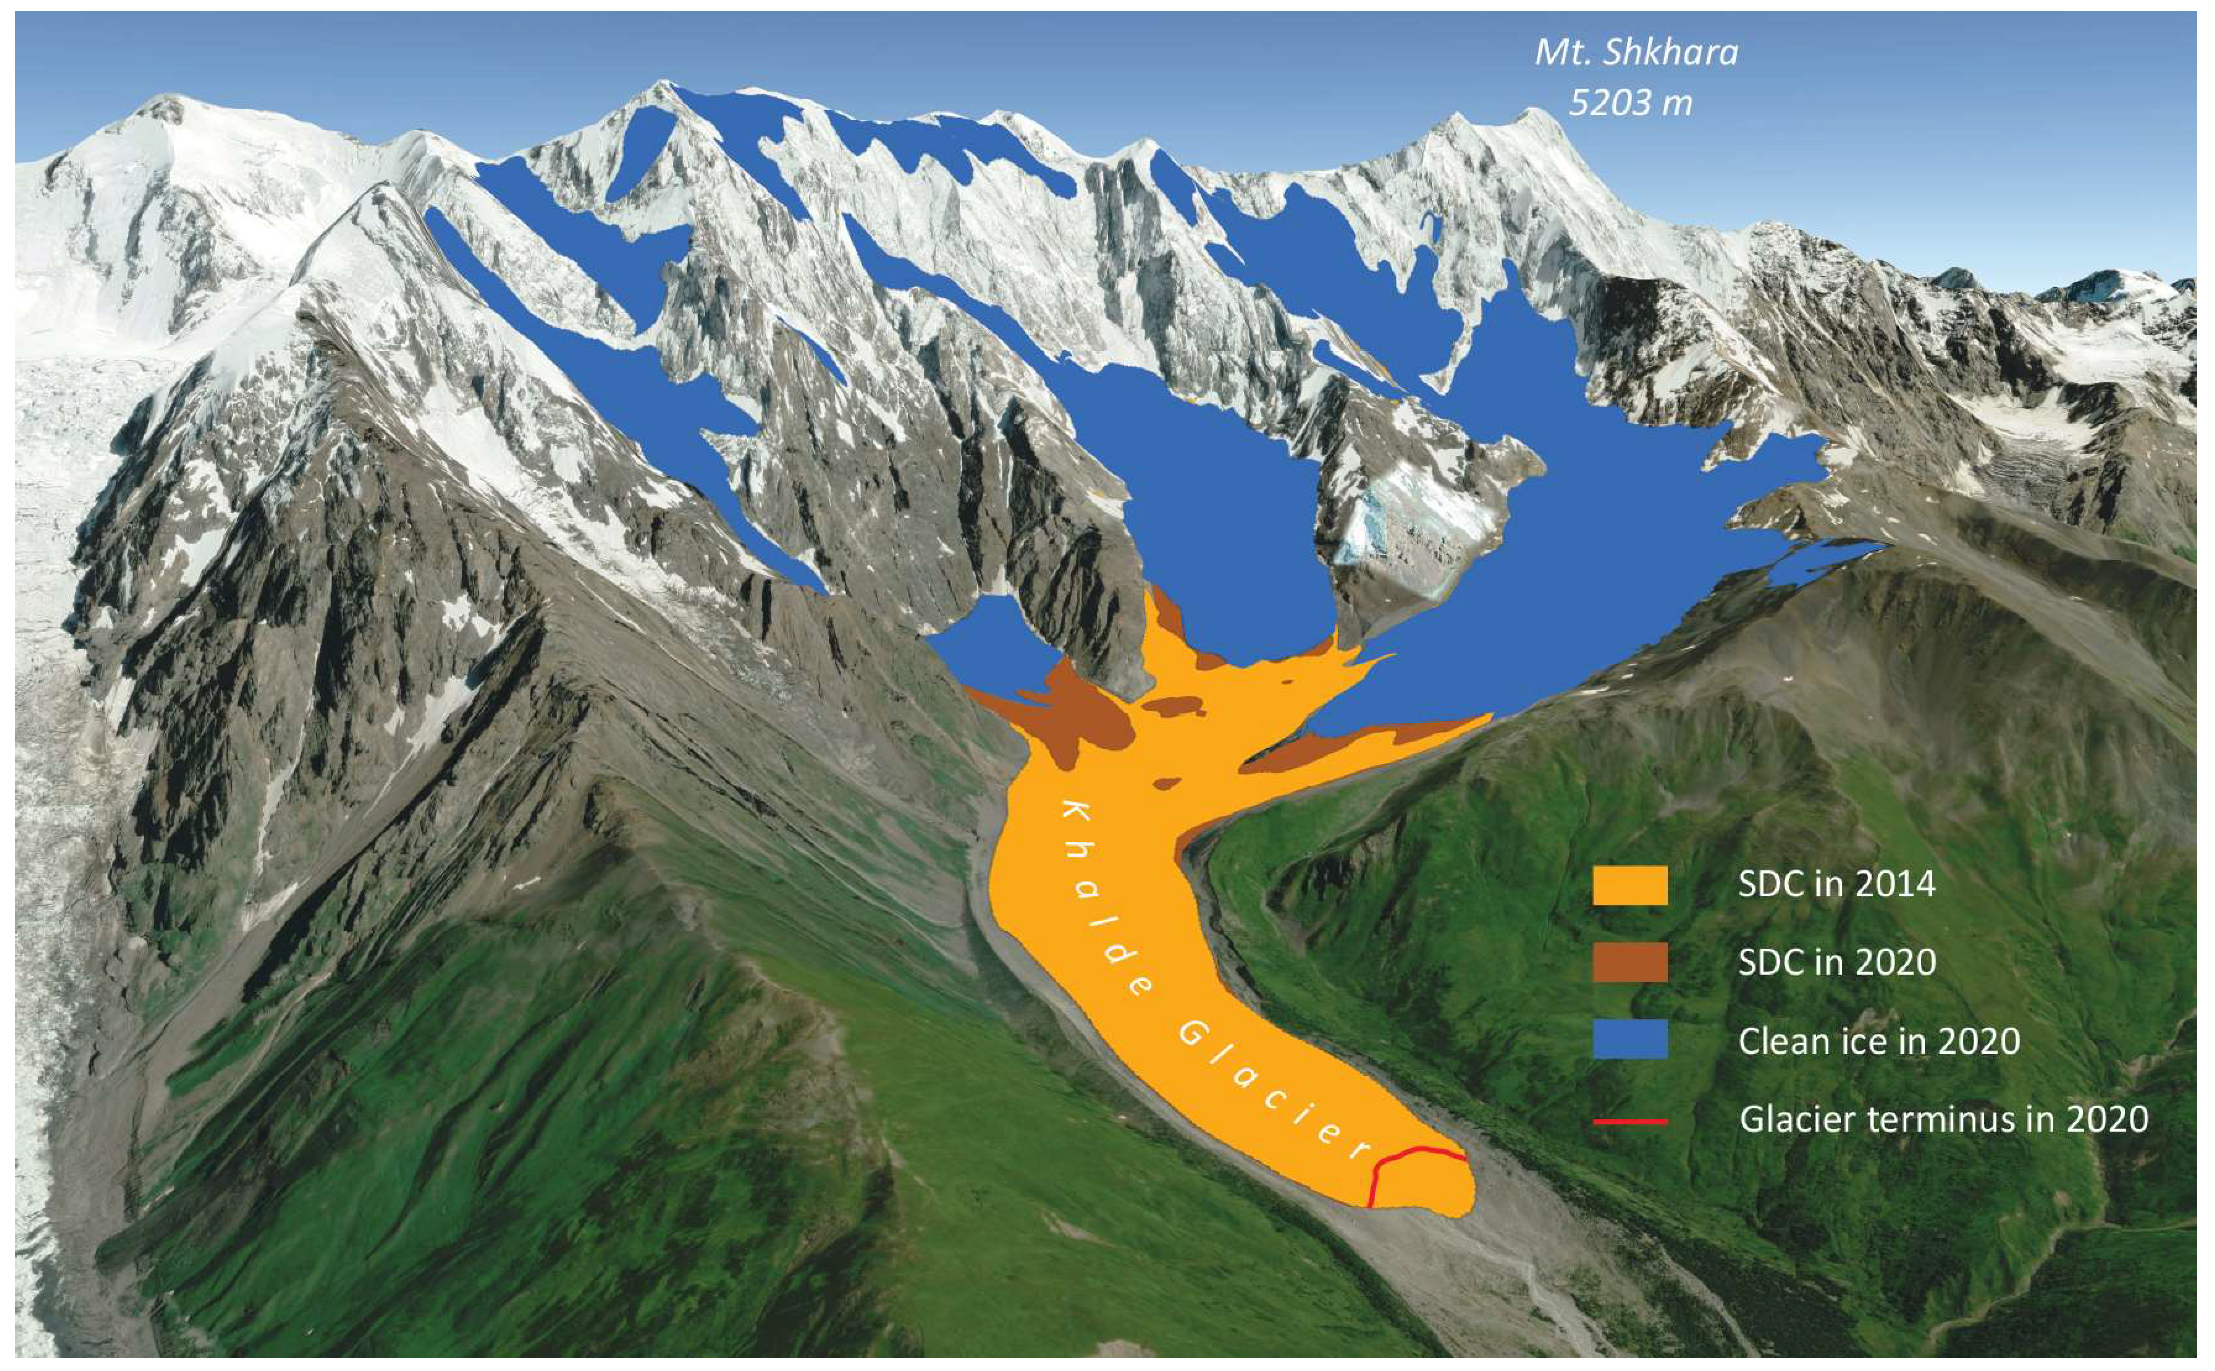
Previous works on the supra-glacial debris cover of the Greater Caucasus do not cover the entire region, making direct regional comparisons difficult. However, we compare individual sub-sections and glaciers from our study with a similar dataset from 2014 to demonstrate the expansion of supra-glacial debris cover in the Greater Caucasus over the last few years. First, we selected the Elbrus Massif and a comparison showed that the area of supra-glacial debris cover increased from 4.6% to 5.8% between 2014 and 2020 (Figure 8). A similar comparison for the glaciers in the central Greater Caucasus such as Lekhziri (Glims ID G042766E43151N), Khalde (G043043E42994N), Kashkatash (G042693E43189N), Bashkara (G042734E43194N), and Djankuat (G042766E43192N) show that the area of the supra-glacial debris cover increased from 9.5% in 2014 to 13.9% in 2020. A comparison of these two datasets also shows an upward expansion of supra-glacial debris cover in the Greater Caucasus during 2014–2020, e.g., for the Ulluchiran Glacier (G042432E43372N) on Elbrus Massif, the upper limit of supra-glacial debris cover migrated from ~3650 m in 2014 to ~3720 m a.s.l. in 2020, while for the Lekhziri and Khalde glaciers in the central Greater Caucasus it was upward from ~3140 m to ~3200 m and from ~3005 m to ~3050 m a.s.l., respectively (Figure 9).
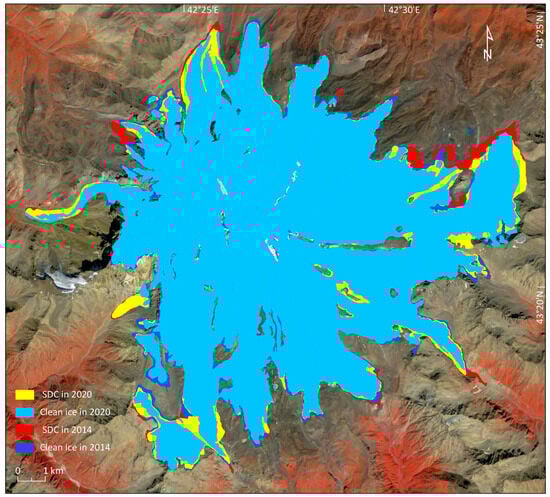
Figure 8.
An example of clean ice area decrease and supra-glacial debris cover (SDC) area increase on the Elbrus Massif from 2014 to 2020. Landsat (4/09/2020) is used as the background.

Figure 9.
An example of the supra-glacial debris upward expansion for the Khalde Glacier between 2014 and 2020. Google Earth image (8/08/2020) was used as the background (© Google Earth).
6.3. Possible Causes of Increased Supra-Glacial Debris Cover
The increasing trend of supra-glacial debris cover in the Greater Caucasus over the last few years may be related to the recent activities of rock-ice and snow avalanches [54] with a combination of increased air temperature and decreased precipitation [46]. These types of events are common in the Greater Caucasus and last happened in August 2023 when the massive ice-rock falls occurred near the slopes of the Tbilisa Glacier, covering the glacier surface and moving downstream with the glacier ice [30]. Such phenomena play a key role in the increase and fluctuation of supra-glacial debris-covered areas [55].
The mean monthly air temperatures in the mountainous region of the Greater Caucasus have increased up to 1.0 °C over the past 20 years [36]. The extension of positive degree days (ablation season) over the last two decades was also confirmed by instrumental measurement from the southern Greater Caucasus (Chalaati and Zopkhito glaciers) [39]. Thus, glacier thinning and atmospheric warming can lead to permafrost melting and slope instability at high elevations [56], allowing eroded materials to fall from rocky slopes and deposit onto the ice surface.
Another source of supra-glacial debris cover on the glacier surface may be reworked material from lateral moraines. As the glacier lowers and the permafrost melts, the lateral moraines become unstable, causing moraine material to fall onto the glacier [57]. Debris eroded from the glacier bed may also be entangled in the ice. The degree of under-ice entrainment mainly depends on the thermal conditions at the base of the glacier and the substrate erodibility [55].
6.4. Limitation of the DebCovG-Carto Toolbox
While this classification method effectively mitigates coherence loss from areas with steep slopes or affected by a layover and shadow effects, these areas can still be misclassified as debris-covered, as highlighted by Holobâcă et al. [32], and need further investigation. An additional limitation is the effect of speckle noise arising from isolated pixels or pixel clusters that need to be manually removed after the raster to vector conversion, a time-consuming and potentially subjective step. Another difficulty is the need to handle the large volumes of imagery and the resulting glacier data in batches. This is due to both the extensive size of the original satellite images and the requirement for the satellite scenes to overlap, coupled with computational constraints. This could be solved by mosaicking the raw input data, allowing for a single processing step, provided sufficient computational resources are available.
This methodology could be improved by utilizing higher-resolution satellite imagery that can lead to a more precise delineation. Further automation could be achieved through the development, training, and testing of machine learning algorithms specifically tailored to glacier classification.
6.5. Comparison with Other Mountainous Regions
Our estimate of 10.3 ± 5.6% supra-glacial debris cover in the Greater Caucasus is much lower than other mid-latitude mountain regions. For example, a recent study by Fleischer et al. [14] showed that 22.8% of the total glacier area in the Austrian Alps was covered by debris in 2015. Another study from Afghanistan Hindu Kush Himalaya [58] identified ∼22% of supra-glacial debris cover in 2016 as a percentage of the total glacier area. A relatively low percentage of supra-glacial debris cover was estimated in other mountain regions, such as the Tibetan Plateau with 7.2% in 2016–2020 [59]. A low percentage was also observed in Patagonian glaciers where the proportion of debris-covered area was 7.9% in 2015 [60]. A latitudinal variation in the regional percentage of debris cover can be caused by a negative exponential function of distance from the equator, implying that warmer climatic zones are more dynamic and conducive to supraglacial debris production [61]. However, orographic and geological factors such as hypsometry, local topography, lithology, and tectonic uplifting may also cause regional-scale differences.
7. Conclusions
We present the extent of supra-glacial debris cover from the entire Greater Caucasus using the DebCovG-carto toolbox based on Sentinel images from 2020. The result shows that ~10.3% of the total area of the Caucasus glacier is covered by debris. Comparison with similar data from 2014 showed an expanding trend of supra-glacier debris cover. Furthermore, debris-covered areas were constantly migrating to high altitudes. The distribution elevation of debris-covered parts of the glaciers was generally lower than that of clean ice parts of the glaciers. Debris-covered glaciers were more distributed on the northern slopes than the southern. The eastern section of the Greater Caucasus has experienced the highest percentage distribution of supra-glacial debris cover than central and western. The findings of our study can be used in glacier hydrology, glacier hazard, mass balance, and glacier response to climate change models in the future.
The methods involved in this study were optimized for efficient processing of the extensive datasets involved in the creation of the debris-covered glacier inventory. In this regard, the DebCovG-carto algorithm was adapted to streamline data input into a single geoprocessing tool interface. Additionally, a comprehensive workflow for individual glacier extraction was developed. However, the primary limitations of this methodology arise from the effects of speckle noise and the management of large data volumes, requiring further analysis. The combination of advanced satellite data analysis techniques and specialized algorithms facilitates the creation of a detailed and reliable glacier inventory, which is essential for understanding the dynamics of glacial systems in the Greater Caucasus region.
With global warming and the existing increased trend of supra-glacial debris cover in the Greater Caucasus, it is expected that many clean glaciers will be transformed into debris-covered glaciers or may become fully debris-covered in the coming decades, which may significantly affect the water resources. Further investigations are therefore required to improve our understanding of the processes and impacts associated with predicting runoff production from debris-covered glaciers. Future field and instrumental-based work should also focus on extracting information about debris thickness by ground-penetrating radar and monitoring other surface features such as ice cliffs and supra-glacial ponds using high-resolution satellite imagery.
Author Contributions
Conceptualization, L.G.T.; methodology, G.I. and I.H.H.; software, L.G.T., G.I. and I.H.H.; validation, L.G.T., G.I. and I.H.H.; formal analysis, L.G.T., G.I. and I.H.H.; investigation, L.G.T., G.I. and I.H.H.; writing—original draft preparation, L.G.T., G.I. and I.H.H.; review and editing, L.G.T., G.I. and I.H.H.; visualization, L.G.T., G.I. and I.H.H. All authors have read and agreed to the published version of the manuscript.
Funding
This work was supported by the Shota Rustaveli National Science Foundation of Georgia (SRNSFG; grant no. YS-22-171).
Data Availability Statement
The DebCovG-carto toolbox is openly available on GitHUB https://github.com/iulianholo/DebCov_Carto. The newly created dataset for the Greater Caucasus is openly available in Zenodo https://doi.org/10.5281/zenodo.12550905 (accessed on 3 June 2024).
Acknowledgments
We would like to thank three anonymous reviewers for their thoughtful and constructive comments, which clearly enhanced the quality of the final manuscript. Levan Tielidze was supported by the Australian Research Council (ARC) Special Research Initiative (SRI) Securing Antarctica’s Environmental Future (SR200100005).
Conflicts of Interest
The authors declare no conflicts of interest.
Appendix A
Table A1.
Sentinel-1 remote sensing data used in the creation of the debris-covered glacier inventory.
Table A1.
Sentinel-1 remote sensing data used in the creation of the debris-covered glacier inventory.
| Satellite | Acquisition Date | Spatial Resolution (m) | Orbit | Pass | Polarisation | Scene ID |
|---|---|---|---|---|---|---|
| Sentinel-1B | 07/09/2020 | 5 × 20 | 145 | Ascending | VV-VH | S1B_IW_SLC__1SDV_20200907T151029_20200907T151055_023271_02C31A_D7C6 |
| Sentinel-1A | 03/09/2020 | 5 × 20 | 174 | Ascending | VV-VH | S1A_IW_SLC__1SDV_20200903T145435_20200903T145502_034196_03F8FE_EEA3 |
| Sentinel-1A | 03/09/2020 | 5 × 20 | 174 | Ascending | VV-VH | S1A_IW_SLC__1SDV_20200903T145410_20200903T145437_034196_03F8FE_30A6 |
| Sentinel-1B | 02/09/2020 | 5 × 20 | 72 | Ascending | VV-VH | S1B_IW_SLC__1SDV_20200902T150201_20200902T150234_023198_02C0DB_5C4F |
| Sentinel-1A | 29/08/2020 | 5 × 20 | 101 | Ascending | VV-VH | S1A_IW_SLC__1SDV_20200829T144559_20200829T144627_034123_03F67C_0DD0 |
| Sentinel-1B | 26/08/2020 | 5 × 20 | 145 | Ascending | VV-VH | S1B_IW_SLC__1SDV_20200826T151028_20200826T151055_023096_02BDA5_7424 |
| Sentinel-1A | 22/08/2020 | 5 × 20 | 174 | Ascending | VV-VH | S1A_IW_SLC__1SDV_20200822T145434_20200822T145501_034021_03F2D7_9136 |
| Sentinel-1A | 22/08/2020 | 5 × 20 | 174 | Ascending | VV-VH | S1A_IW_SLC__1SDV_20200822T145409_20200822T145436_034021_03F2D7_2728 |
| Sentinel-1B | 21/08/2020 | 5 × 20 | 72 | Ascending | VV-VH | S1B_IW_SLC__1SDV_20200821T150200_20200821T150234_023023_02BB67_E53B |
| Sentinel-1A | 17/08/2020 | 5 × 20 | 101 | Ascending | VV-VH | S1A_IW_SLC__1SDV_20200817T144552_20200817T144619_033948_03F04C_28A9 |
| Sentinel-1A | 04/09/2020 | 5 × 20 | 6 | Descending | VV-VH | S1A_IW_SLC__1SDV_20200904T025226_20200904T025253_034203_03F940_A473 |
| Sentinel-1A | 02/09/2020 | 5 × 20 | 152 | Descending | VV-VH | S1A_IW_SLC__1SDV_20200902T030826_20200902T030853_034174_03F840_683E |
| Sentinel-1B | 01/09/2020 | 5 × 20 | 50 | Descending | VV-VH | S1B_IW_SLC__1SDV_20200901T031546_20200901T031616_023176_02C019_FEA2 |
| Sentinel-1A | 31/08/2020 | 5 × 20 | 123 | Descending | VV-VH | S1A_IW_SLC__1SDV_20200831T032428_20200831T032455_034145_03F74A_71BA |
| Sentinel-1A | 28/08/2020 | 5 × 20 | 79 | Descending | VV-VH | S1A_IW_SLC__1SDV_20200828T030027_20200828T030054_034101_03F5A9_15D7 |
| Sentinel-1A | 28/08/2020 | 5 × 20 | 79 | Descending | VV-VH | S1A_IW_SLC__1SDV_20200828T030002_20200828T030029_034101_03F5A9_F446 |
| Sentinel-1A | 23/08/2020 | 5 × 20 | 6 | Descending | VV-VH | S1A_IW_SLC__1SDV_20200823T025225_20200823T025252_034028_03F31A_D6BE |
| Sentinel-1A | 21/08/2020 | 5 × 20 | 152 | Descending | VV-VH | S1A_IW_SLC__1SDV_20200821T030825_20200821T030852_033999_03F213_751F |
| Sentinel-1B | 20/08/2020 | 5 × 20 | 50 | Descending | VV-VH | S1B_IW_SLC__1SDV_20200820T031545_20200820T031615_023001_02BA9B_A183 |
| Sentinel-1A | 19/08/2020 | 5 × 20 | 123 | Descending | VV-VH | S1A_IW_SLC__1SDV_20200819T032427_20200819T032454_033970_03F121_5D1A |
| Sentinel-1A | 16/08/2020 | 5 × 20 | 79 | Descending | VV-VH | S1A_IW_SLC__1SDV_20200816T030026_20200816T030053_033926_03EF81_1BDB |
| Sentinel-1A | 16/08/2020 | 5 × 20 | 79 | Descending | VV-VH | S1A_IW_SLC__1SDV_20200816T030001_20200816T030028_033926_03EF81_CFE8 |
Table A2.
Sentinel-2 data used in the creation of the debris-covered glacier inventory.
Table A2.
Sentinel-2 data used in the creation of the debris-covered glacier inventory.
| Satellite | Spatial Resolution (m) | Acquisition Date | Spectral Bands | Scene |
|---|---|---|---|---|
| Sentinel-2B | 10 (B11–20 m) | 04/09/2020 | B3, B4, B8, B11 | 37TFJ |
| Sentinel-2B | 10 (B11–20 m) | 04/09/2020 | B3, B4, B8, B11 | 37TFH |
| Sentinel-2B | 10 (B11–20 m) | 04/09/2020 | B3, B4, B8, B11 | 37TGH |
| Sentinel-2B | 10 (B11–20 m) | 04/09/2020 | B3, B4, B8, B11 | 37TEJ |
| Sentinel-2B | 10 (B11–20 m) | 04/09/2020 | B3, B4, B8, B11 | 37TGJ |
| Sentinel-2B | 10 (B11–20 m) | 05/09/2020 | B3, B4, B8, B11 | 38TQL |
| Sentinel-2B | 10 (B11–20 m) | 05/09/2020 | B3, B4, B8, B11 | 38TPM |
| Sentinel-2B | 10 (B11–20 m) | 05/09/2020 | B3, B4, B8, B11 | 38TPL |
| Sentinel-2B | 10 (B11–20 m) | 11/09/2020 | B3, B4, B8, B11 | 38TMN |
| Sentinel-2B | 10 (B11–20 m) | 11/09/2020 | B3, B4, B8, B11 | 38TLN |
| Sentinel-2B | 10 (B11–20 m) | 15/08/2019 | B3, B4, B8, B11 | 38TNN |
| Sentinel-2B | 10 (B11–20 m) | 15/08/2019 | B3, B4, B8, B11 | 38 TNM |
| Sentinel-2B | 10 (B11–20 m) | 22/08/2019 | B3, B4, B8, B11 | 39TTF |
| Sentinel-2B | 10 (B11–20 m) | 23/08/2019 | B3, B4, B8, B11 | 38TMN |
Table A3.
DEM data used in the creation of the debris-covered glacier inventory.
Table A3.
DEM data used in the creation of the debris-covered glacier inventory.
| DEM Type | Spatial Resolution (m) | Acquisition Date | Scene ID |
|---|---|---|---|
| ALOS-PALSAR | 12.5 | 08/06//2007 | ALPSRP074500820 |
| ALOS-PALSAR | 12.5 | 10/01/2008 | ALPSRP104550840 |
| ALOS-PALSAR | 12.5 | 07/01/2007 | ALPSRP050870840 |
| ALOS-PALSAR | 12.5 | 11/06/2007 | ALPSRP073480840 |
| ALOS-PALSAR | 12.5 | 08/07/2007 | ALPSRP077420860 |
| ALOS-PALSAR | 12.5 | 08/07/2007 | ALPSRP077420870 |
| ALOS-PALSAR | 12.5 | 06/09/2007 | ALPSRP073190860 |
| ALOS-PALSAR | 12.5 | 03/07/2007 | ALPSRP076690860 |
| ALOS-PALSAR | 12.5 | 15/07/2007 | ALPSRP078440840 |
| ALOS-PALSAR | 12.5 | 15/07/2007 | ALPSRP078440850 |
| ALOS-PALSAR | 12.5 | 22/07/2008 | ALPSRP132850850 |
| ALOS-PALSAR | 12.5 | 22/07/2008 | ALPSRP132850860 |
| ALOS-PALSAR | 12.5 | 03/07/2007 | ALPSRP076690850 |
| ALOS-PALSAR | 12.5 | 03/07/2007 | ALPSRP076690840 |
| ALOS-PALSAR | 12.5 | 21/06/2007 | ALPSRP074940860 |
| ALOS-PALSAR | 12.5 | 21/06/2007 | ALPSRP074940850 |
| ALOS-PALSAR | 12.5 | 16/06/2007 | ALPSRP074210860 |
| ALOS-PALSAR | 12.5 | 16/06/2007 | ALPSRP074210850 |
| ALOS-PALSAR | 12.5 | 16/06/2007 | ALPSRP074210840 |
| ALOS-PALSAR | 12.5 | 26/12/2006 | ALPSRP049120850 |
| ALOS-PALSAR | 12.5 | 26/12/2006 | ALPSRP049120840 |
| ASTER-GDEM | 30 | 01/03/2000–30/11/2013 | ASTGTMV003_N42E045 |
| ASTER-GDEM | 30 | 01/03/2000–30/11/2013 | ASTGTMV003_N42E046 |
| ASTER-GDEM | 30 | 01/03/2000–30/11/2013 | ASTGTMV003_N41E046 |
| ASTER-GDEM | 30 | 01/03/2000–30/11/2013 | ASTGTMV003_N41E047 |
References
- Lin, R.; Mei, G.; Xu, N. Accurate and automatic mapping of complex debris-covered glacier from remote sensing imagery using deep convolutional networks. Geol. J. 2022, 58, 2254–2267. [Google Scholar] [CrossRef]
- Herreid, S.; Pellicciotti, F. The state of rock debris covering Earth’s glaciers. Nat. Geosci. 2020, 13, 621–627. [Google Scholar] [CrossRef]
- Istrem, G. Ice Melting under a Thin Layer of Moraine, and the Existence of Ice Cores in Moraine Ridges. Geogr. Ann. 1959, 41, 228–230. Available online: https://www.jstor.org/stable/4626805 (accessed on 9 March 2024).
- Gardelle, J.; Berthier, E.; Arnaud, Y.; Kääb, A. Region-wide glacier mass balances over the Pamir-Karakoram-Himalaya during 1999–2011. Cryosphere 2013, 7, 1263–1286. [Google Scholar] [CrossRef]
- Pellicciotti, F.; Stephan, C.; Miles, E.; Herreid, S.; Immerzeel, W.W.; Bolch, T. Mass-balance changes of the debris-covered glaciers in the Langtang Himal, Nepal, from 1974 to 1999. J. Glaciol. 2015, 61, 373–386. [Google Scholar] [CrossRef]
- Brun, F.; Wagnon, P.; Berthier, E.; Jomelli, V.; Maharjan, S.B.; Shrestha, F.; Kraaijenbrink, P.D.A. Heterogeneous Influence of Glacier Morphology on the Mass Balance Variability in High Mountain Asia. J. Geophys. Res. Earth Surf. 2019, 124, 1331–1345. [Google Scholar] [CrossRef]
- Reid, T.; Brock, B. Assessing ice-cliff backwasting and its contribution to total ablation of debris-covered Miage glacier, Mont Blanc massif, Italy. J. Glaciol. 2014, 60, 3–13. [Google Scholar] [CrossRef]
- Brun, F.; Wagnon, P.; Berthier, E.; Shea, J.M.; Immerzeel, W.W.; Kraaijenbrink, P.D.A.; Vincent, C.; Reverchon, C.; Shrestha, D.; Arnaud, Y. Ice cliff contribution to the tongue-wide ablation of Changri Nup Glacier, Nepal, central Himalaya. Cryosphere 2018, 12, 3439–3457. [Google Scholar] [CrossRef]
- Miles, K.E.; Hubbard, B.; Irvine-Fynn, T.D.; Miles, E.S.; Quincey, D.J.; Rowan, A.V. Hydrology of debris-covered glaciers in High Mountain Asia. Earth-Sci. Rev. 2020, 207, 103212. [Google Scholar] [CrossRef]
- Sakai, A.; Takeuchi, N.; Fujita, K.; Nakawo, M. Role of supraglacial ponds in the ablation process of a debris-covered glacier in the Nepal Himalayas. Int. Assoc. Hydrol. Sci. 2000, 264, 119–130. [Google Scholar]
- Sahu, R.; Ramsankaran, R.; Bhambri, R.; Verma, P.; Chand, P. Evolution of Supraglacial Lakes from 1990 to 2020 in the Himalaya–Karakoram Region Using Cloud-Based Google Earth Engine Platform. J. Indian Soc. Remote Sens. 2023, 51, 2379–2390. [Google Scholar] [CrossRef]
- Hock, R.; Rasul, G.; Adler, C.; Cáceres, B.; Gruber, S.; Hirabayashi, Y.; Jackson, M.; Kääb, A.; Kang, S.; Kutuzov, S.; et al. High Mountain Areas. In IPCC Special Report on Ocean and the Cryosphere in a Changing Climate (SROCC); IPCC: Geneva, Switzerland, 2019; pp. 131–202. [Google Scholar] [CrossRef]
- Le Bris, R.; Paul, F.; Frey, H.; Bolch, T. A new satellite-derived glacier inventory for western Alaska. Ann. Glaciol. 2011, 52, 135–143. [Google Scholar] [CrossRef]
- Fleischer, F.; Otto, J.; Junker, R.R.; Hölbling, D. Evolution of debris cover on glaciers of the Eastern Alps, Austria, between 1996 and 2015. Earth Surf. Process. Landf. 2021, 46, 1673–1691. [Google Scholar] [CrossRef]
- Stokes, C.R.; Popovnin, V.V.; Aleynikov, A.; Shahgedanova, M. Recent glacier retreat in the Caucasus Mountains, Russia, and associated changes in supraglacial debris cover and supra/proglacial lake development. Ann. Glaciol. 2007, 46, 196–203. [Google Scholar] [CrossRef]
- Tielidze, L.G.; Bolch, T.; Wheate, R.D.; Kutuzov, S.S.; Lavrentiev, I.I.; Zemp, M. Supra-glacial debris cover changes in the Greater Caucasus from 1986 to 2014. Cryosphere 2020, 14, 585–598. [Google Scholar] [CrossRef]
- Copland, L.; Sylvestre, T.; Bishop, M.P.; Shroder, J.F.; Seong, Y.B.; Owen, L.A.; Bush, A.; Kamp, U. Expanded and Recently Increased Glacier Surging in the Karakoram. Arct. Antarct. Alp. Res. 2011, 43, 503–516. [Google Scholar] [CrossRef]
- Bhambri, R.; Bolch, T.; Chaujar, R.K. Mapping of debris-covered glaciers in the Garhwal Himalayas using ASTER DEMs and thermal data. Int. J. Remote Sens. 2011, 32, 8095–8119. [Google Scholar] [CrossRef]
- Shukla, A.; Garg, P.K. Evolution of a debris-covered glacier in the western Himalaya during the last four decades (1971–2016): A multiparametric assessment using remote sensing and field observations. Geomorphology 2019, 341, 1–14. [Google Scholar] [CrossRef]
- Sahu, R.; Gupta, R.D. Glacier mapping and change analysis in Chandra basin, Western Himalaya, India during 1971–2016. Int. J. Remote Sens. 2020, 41, 6914–6945. [Google Scholar] [CrossRef]
- Racoviteanu, A.E.; Arnaud, Y.; Williams, M.W.; Ordoñez, J. Decadal changes in glacier parameters in the Cordillera Blanca, Peru, derived from remote sensing. J. Glaciol. 2008, 54, 499–510. [Google Scholar] [CrossRef]
- Janke, J.R.; Bellisario, A.C.; Ferrando, F.A. Classification of debris-covered glaciers and rock glaciers in the Andes of central Chile. Geomorphology 2015, 241, 98–121. [Google Scholar] [CrossRef]
- Röhl, K. Characteristics and evolution of supraglacial ponds on debris-covered Tasman Glacier, New Zealand. J. Glaciol. 2008, 54, 867–880. [Google Scholar] [CrossRef]
- Anderson, B.; Mackintosh, A. Controls on mass balance sensitivity of maritime glaciers in the Southern Alps, New Zealand: The role of debris cover. J. Geophys. Res. Earth Surf. 2012, 117, 1–15. [Google Scholar] [CrossRef]
- Bhardwaj, A.; Joshi, P.K.; Snehmani; Singh, M.K.; Sam, L.; Gupta, R.D. Mapping debris-covered glaciers and identifying factors affecting the accuracy. Cold Reg. Sci. Technol. 2014, 106–107, 161–174. [Google Scholar] [CrossRef]
- Herman, F.; De Doncker, F.; Delaney, I.; Prasicek, G.; Koppes, M. The impact of glaciers on mountain erosion. Nat. Rev. Earth Environ. 2021, 2, 422–435. [Google Scholar] [CrossRef]
- Benn, D.; Bolch, T.; Hands, K.; Gulley, J.; Luckman, A.; Nicholson, L.; Quincey, D.; Thompson, S.; Toumi, R.; Wiseman, S. Response of debris-covered glaciers in the Mount Everest region to recent warming, and implications for outburst flood hazards. Earth-Sci. Rev. 2012, 114, 156–174. [Google Scholar] [CrossRef]
- Huggel, C.; Zgraggen-Oswald, S.; Haeberli, W.; Kääb, A.; Polkvoj, A.; Galushkin, I.; Evans, S.G. The 2002 rock/ice avalanche at Kolka/Karmadon, Russian Caucasus: Assessment of extraordinary avalanche formation and mobility, and application of QuickBird satellite imagery. Nat. Hazards Earth Syst. Sci. 2005, 5, 173–187. [Google Scholar] [CrossRef]
- Chernomorets, S.S.; Petrakov, D.A.; Aleynikov, A.A.; Bekkiev, M.Y.; Viskhadzhieva, K.S.; Dokukin, M.D.; Kalov, R.K.; Kidyaeva, V.M.; Krylenko, V.V.; Krylenko, I.V.; et al. The outburst of Bashkara glacier lake (Central Caucasus, Russia) on September 1, 2017. Earth’s Cryosph. 2018, 22, 70–80. [Google Scholar] [CrossRef]
- Tielidze, L.G.; Charton, J.; Jomelli, V.; Solomina, O.N. Glacial geomorphology of the Notsarula and Chanchakhi river valleys, Georgian Caucasus. J. Maps 2023, 19, 2261490. [Google Scholar] [CrossRef]
- Alifu, H.; Vuillaume, J.-F.; Johnson, B.A.; Hirabayashi, Y. Machine-learning classification of debris-covered glaciers using a combination of Sentinel-1/-2 (SAR/optical), Landsat 8 (thermal) and digital elevation data. Geomorphology 2020, 369, 107365. [Google Scholar] [CrossRef]
- Holobâcă, I.-H.; Tielidze, L.G.; Ivan, K.; Elizbarashvili, M.; Alexe, M.; Germain, D.; Petrescu, S.H.; Pop, O.T.; Gaprindashvili, G. Multi-sensor remote sensing to map glacier debris cover in the Greater Caucasus, Georgia. J. Glaciol. 2021, 67, 685–696. [Google Scholar] [CrossRef]
- Tielidze, L.G.; Nosenko, G.A.; Khromova, T.E.; Paul, F. Strong acceleration of glacier area loss in the Greater Caucasus between 2000 and 2020. Cryosphere 2022, 16, 489–504. [Google Scholar] [CrossRef]
- Shahgedanova, M.; Nosenko, G.; Kutuzov, S.; Rototaeva, O.; Khromova, T. Deglaciation of the Caucasus Mountains, Russia/Georgia, in the 21st century observed with ASTER satellite imagery and aerial photography. Cryosphere 2014, 8, 2367–2379. [Google Scholar] [CrossRef]
- Tielidze, L.G. Glacier change over the last century, Caucasus Mountains, Georgia, observed from old topographical maps, Landsat and ASTER satellite imagery. Cryosphere 2016, 10, 713–725. [Google Scholar] [CrossRef]
- Tielidze, L.G.; Jomelli, V.; Nosenko, G.A. Analysis of Regional Changes in Geodetic Mass Balance for All Caucasus Glaciers over the Past Two Decades. Atmosphere 2022, 13, 256. [Google Scholar] [CrossRef]
- Lambrecht, A.; Mayer, C.; Hagg, W.; Popovnin, V.; Rezepkin, A.; Lomidze, N.; Svanadze, D. A comparison of glacier melt on debris-covered glaciers in the northern and southern Caucasus. Cryosphere 2011, 5, 525–538. [Google Scholar] [CrossRef]
- Popovnin, V.V.; Rezepkin, A.A.; Tielidze, L.G. Superficial moraine expansion on the Djankuat Glacier snout over the direct glaciological monitoring period. Earth Cryosphere 2015, 1, 79–87. [Google Scholar]
- Tielidze, L.G.; Svanadze, D.; Gadrani, L.; Asanidze, L.; Wheate, R.D.; Hamilton, G.S. A 54-year record of changes at Chalaati and Zopkhito glaciers, Georgian Caucasus, observed from archival maps, satellite imagery, drone survey and ground-based investigation. Hung. Geogr. Bull. 2020, 69, 175–189. [Google Scholar] [CrossRef]
- Scherler, D.; Wulf, H.; Gorelick, N. Global Assessment of Supraglacial Debris-Cover Extents. Geophys. Res. Lett. 2018, 45, 11798–11805. [Google Scholar] [CrossRef]
- Postnikova, T.; Rybak, O.; Gubanov, A.; Zekollari, H.; Huss, M.; Shahgedanova, M. Debris cover effect on the evolution of Northern Caucasus glaciers in the 21st century. Front. Earth Sci. 2023, 11, 1256696. [Google Scholar] [CrossRef]
- Gobejishvili, R.; Lomidze, N.; Tielidze, L. Late Pleistocene (Wurmian) glaciations of the Caucasus. In Quaternary Glaciations: Extent and Chronology; Ehlers, J., Gibbard, P.L., Hughes, P.D., Eds.; Elsevier: Amsterdam, The Netherlands, 2011; pp. 141–147. [Google Scholar] [CrossRef]
- Bochud, M. Tectonics of the Eastern Greater Caucasus in Azerbaijan. Ph.D. Thesis, Faculty of Sciences of the University of Fribourg, Fribourg, Switzerland, 2011. [Google Scholar]
- Rototaeva, O.V.; Nosenko, G.A.; Tarasova, L.N.; Khmelevskoy, I.F. Obschaya kharakteristika oledeneniya severnogo sklona Bolshogo Kavkaza (General characteristics of glacierization of the north slope of the Gteater Caucasus). In Sovremennoe Oledenenie Severnoi i Tsentralnoi Evrazii (Glaciation in North and Central Eurasia at Present Time); Kotlakov, V.M., Ed.; Nauka Press: Moscow, Russia, 2006; pp. 141–144. (In Russian) [Google Scholar]
- Volodicheva, N. The Caucasus. In The Physical Geography of Northern Eurasia; Shahgedanova, M., Ed.; Oxford University Press: Oxford, UK, 2002; pp. 350–376. [Google Scholar]
- Toropov, P.A.; Aleshina, M.A.; Grachev, A.M. Large-scale climatic factors driving glacier recession in the Greater Caucasus, 20th–21st century. Int. J. Climatol. 2019, 39, 4703–4720. [Google Scholar] [CrossRef]
- Sylvén, M.; Reinvang, R.; Andersone-Lilley, Ž. Climate Change in Southern Caucasus: Impacts on Nature, People and Society; World Wildlife Fund Overview Report; WWF Norway WWF Caucasus Programme; Zoï Environment Network: Geneva, Switzerland, 2008. [Google Scholar]
- Holobâcă, I.-H. Recent retreat of the Elbrus glacier system. J. Glaciol. 2016, 62, 94–102. [Google Scholar] [CrossRef]
- Popovnin, V.V.; Rozova, A.V. Influence of Sub-Debris Thawing on Ablation and Runoff of the Djankuat Glacier in the Caucasus. Hydrol. Res. 2002, 33, 75–94. [Google Scholar] [CrossRef]
- Holobâcă, I.-H. Glacier Mapper–a new method designed to assess change in mountain glaciers. Int. J. Remote Sens. 2013, 34, 8475–8490. [Google Scholar] [CrossRef]
- Raup, B.; Racoviteanu, A.; Khalsa, S.J.S.; Helm, C.; Armstrong, R.; Arnaud, Y. The GLIMS geospatial glacier database: A new tool for studying glacier change. Glob. Planet. Chang. 2007, 56, 101–110. [Google Scholar] [CrossRef]
- Graceson, A.; Hare, M.; Hall, N.; Monaghan, J. Use of inorganic substrates and composted green waste in growing media for green roofs. Biosyst. Eng. 2014, 124, 1–7. [Google Scholar] [CrossRef]
- Tielidze, L.G.; Cicoira, A.; Nosenko, G.A.; Eaves, S.R. The First Rock Glacier Inventory for the Greater Caucasus. Geosciences 2023, 13, 117. [Google Scholar] [CrossRef]
- Hambrey, M.J.; Quincey, D.J.; Glasser, N.F.; Reynolds, J.M.; Richardson, S.J.; Clemmens, S. Sedimentological, geomorphological and dynamic context of debris-mantled glaciers, Mount Everest (Sagarmatha) region, Nepal. Quat. Sci. Rev. 2008, 27, 2361–2389. [Google Scholar] [CrossRef]
- Xie, F.; Liu, S.; Wu, K.; Zhu, Y.; Gao, Y.; Qi, M.; Duan, S.; Saifullah, M.; Tahir, A.A. Upward Expansion of Supra-Glacial Debris Cover in the Hunza Valley, Karakoram, During 1990∼2019. Front. Earth Sci. 2020, 8, 1–18. [Google Scholar] [CrossRef]
- Deline, P.; Gruber, S.; Delaloye, R.; Fischer, L.; Geertsema, M.; Giardino, M.; Hasler, A.; Kirkbride, M.; Krautblatter, M.; Magnin, F.; et al. Ice loss and slope stability in high-mountain regions. In Snow and Ice-Related Hazards, Risks and Disasters; Haeberli, W., Whiteman, C., Eds.; Elsevier: Amsterdam, The Netherlands, 2015; pp. 521–561. [Google Scholar] [CrossRef]
- Nakawo, M.; Iwata, S.; Watanabe, O.; Yoshida, M. Processes which Distribute Supraglacial Debris on the Khumbu Glacier, Nepal Himalaya. Ann. Glaciol. 1986, 8, 129–131. [Google Scholar] [CrossRef]
- Shokory, J.A.N.; Lane, S.N. Patterns and drivers of glacier debris-cover development in the Afghanistan Hindu Kush Himalaya. J. Glaciol. 2023, 69, 1–15. [Google Scholar] [CrossRef]
- Hu, M.; Zhou, G.; Lv, X.; Zhou, L.; Wang, X.; He, X.; Tian, Z. Warming Has Accelerated the Melting of Glaciers on the Tibetan Plateau, but the Debris-Covered Glaciers Are Rapidly Expanding. Remote Sens. 2022, 15, 132. [Google Scholar] [CrossRef]
- Glasser, N.F.; Holt, T.; Evans, Z.D.; Davies, B.J.; Pelto, M.; Harrison, S. Recent spatial and temporal variations in debris cover on Patagonian glaciers. Geomorphology 2016, 273, 202–216. [Google Scholar] [CrossRef]
- Huang, L.; Li, Z.; Zhou, J.M.; Zhang, P. An automatic method for clean glacier and nonseasonal snow area change estimation in High Mountain Asia from 1990 to 2018. Remote Sens. Environ. 2021, 258, 112376. [Google Scholar] [CrossRef]


Disclaimer/Publisher’s Note: The statements, opinions and data contained in all publications are solely those of the individual author(s) and contributor(s) and not of MDPI and/or the editor(s). MDPI and/or the editor(s) disclaim responsibility for any injury to people or property resulting from any ideas, methods, instructions or products referred to in the content. |
© 2024 by the authors. Licensee MDPI, Basel, Switzerland. This article is an open access article distributed under the terms and conditions of the Creative Commons Attribution (CC BY) license (https://creativecommons.org/licenses/by/4.0/).