Article

Local Seismic Effects Responsible for Differentiated Damages in Historical City Centers: The Case Study of San Giustino’s Square (Chieti, Italy)

Department of Engineering and Geology (INGEO), University “G. d’Annunzio” in Chieti-Pescara, 66100 Chieti, Italy
*
Author to whom correspondence should be addressed.
Geosciences 2025, 15(3), 76; https://doi.org/10.3390/geosciences15030076
Submission received: 16 December 2024 / Revised: 16 February 2025 / Accepted: 18 February 2025 / Published: 20 February 2025
(This article belongs to the Section Natural Hazards)

Abstract

:
To safeguard historic centers with masonry buildings in medium-high seismic areas, the local seismic response (LSR) should be used. These portions of the urban areas are commonly characterized by complex subsurface features (i.e., underground cavities, buried anthropic structures, and archeological remains) that could be responsible for unexpected amplifications at period intervals similar to the building’s ones. In this study, San Giustino’s Square (Chieti, Italy) was considered due to the differentiated damage caused by the 2009 L’Aquila earthquake mainshock (6 April 2009 at 3:32 CEST, 6.3 Mw). Out of the eight buildings overlooking the square, the structure that suffered the heaviest damage was the Justice Palace. Two-dimensional finite element analyses have been carried out in San Giustino’s square to predict the LSR induced by the seismic shear wave propagation. The influence of the Chieti hill, the anthropogenic shallow soil deposit, and the manmade cavity were investigated. The results outlined that the amplifications of the seismic shaking peaked between 0.2 and 0.4 s. The crest showed amplifications over a wide period range of 0.1–0.8 s with an amplification factor (FA) equal to 2. Throughout the square, FA = 2.0–2.4 was predicted due to the cavities and the filled soil thickness. The large amplified period range is considered responsible for the Justice Court damage.

1. Introduction

Local Seismic Response (LSR) analyses in urban centers are relevant for seismic microzonation studies [1,2,3] to generate maps of differentiated amplifications throughout the urban territory and to quantify the subsurface shaking features that possibly induce damages to historical buildings [4,5,6,7,8].
Different factors influence structural damages induced by seismic events: the ground shaking amplitude and its amplified periods, the buildings’ fundamental periods, and their vulnerability [9].
Numerous recent earthquakes have shown the significant impact of site effects on the distribution of damages in urban areas (e.g., 1985 Mexico City, Mexico; 1995 Kobe, Japan; 1999 Izmit, Turkey; 1999 Chi-Chi, Taiwan; 2001 San Salvador, El Salvador; 2003 Colima, Mexico; 2009 L’Aquila, Italy; 2011 Christchurch, New Zealand; 2016 Central Italy; 2023 Turkey-Syria; 2023 Marrakech-Safi, Morocco). They are evident where ground motion amplifications fall in the same period ranges of the buildings’ natural periods [10] due to the presence of thick soft soils, complex geomorphological features, buried cavities, and near-source effects. This phenomenon is called double resonance and it can occur even for moderate-magnitude seismic events. Several studies in the literature are devoted to estimating the fundamental period Tf of masonry structures. Among those studies related to Italian masonry structures [11], three main formulations are selected from international literature [11,12,13] to estimate the fundamental period of simple masonry structures through their height:
T f = 0.0113 · H 1.138
T f = 0.050 · H 3 / 4
T f = 0.0187 · H
where H is the height of the building starting from the foundation basement. The three formulas are similar but not the same. Each equation is characterized by the L2-norm error, defined as:
L 2 = i e i 2 1 / 2
Of the logarithmic error:
e i = l o g T I e x p l o g T i c o r r
where T I e x p and T i c o r r are the i-th experimental and predicted values of the fundamental period, respectively. Hence, the L2 is equal to 0.61 for Equation (1), 0.8 for Equation (2), and 0.63 for Equation (3).
The LSR simulations show their usefulness when investigating the relationships between the differentiated structural damages, detected in city centers struck by strong earthquakes, and the variable subsurface conditions of urban territories [14]. The LSR can provide effective support in defending historical buildings against earthquakes. LSR numerical simulations can be carried out through 1D, 2D, and 3D subsurface models depending on the geomorphological complexity of the territory [15,16,17]. Numerical methods such as Finite Element (FEM) [18,19,20], Finite Difference (FDM) [6,21], Boundary Element (BEM) [22,23,24], Spectral Element (SEM) [3,25,26] and Hybrid Methods (FEM-BEM, Analytical-FEM) [27,28] can be employed. They calculate the effects of the seismic wave propagation up to the surface, in terms of spectral acceleration, velocity, and displacements as well as FA and amplification functions although several different formulations are used in literature for these amplification indexes.
Considering many studies published after the 2016 Central Italy seismic sequence, which correlated site effects and the damages suffered by masonry buildings, some outcomes are summarized herein. Brando et al. [29], working at the Campotosto (Abruzzi, Italy) historic center, simulated the LSR due to the 2016 Central Italy earthquake that occurred on 24 August, 6.1 Mw. The Campotosto site is located atop a small ridge consisting of flyschoid or turbiditic rock with flanks covered by gravel and sand. The authors compared the spectral acceleration responses computed by 2D FEM simulations with the damage levels of three masonry buildings of 2–3 floors. They considered a reference period of 0.1–0.3 s and found that negligible damages (D0–D1), according to the European Macroseismic Scale [30], were related to spectral accelerations lower than 0.5 g, while serious damages (D3–D4) to spectral accelerations higher than 0.6 g. The damage pattern was linked to topographic effects joined to the presence of a weathered/jointed portion of rock mass and to stratigraphic effects, associated with silty–clayey colluvial covers resting on stiffer flyschoid rock.
Further studies [31] have highlighted the correlations between the damage suffered by ancient stone buildings of one to two stories and the FA at the hamlet of Cortino (Abruzzi, Italy) which is set on unweathered flyschoid stiff rock. From LSR analyses, in shallow soil deposits of about 10 m depth (made up of inorganic silts and fine sands and a substrate alteration), the acceleration response spectra showed peaks of 3 g at a narrow period band around 0.1 s, although the FA was equal to 1.5 over the period range of 0.1–0.5 s, that is, one of the reference periods used in Italian microzonation studies [32].
Another study [33] investigated the influence of site amplification on the seismic vulnerability at the historical center of Baranello, in Campobasso province (Molise, Italy).
The authors evaluated several risk scenarios in this municipality through the 1D LSR simulations using the Strata code [34]. The amplification at this site, characterized by clay silt and silty sand deposits, was calculated as the ratio between the PGAs on the surface and at the bedrock: the calculated amplification of 33% influenced the damage level by raising it from D3 (where bedrock outcrops) to D4.
At Chieti’s historic city center, during the 2009 L’Aquila earthquake mainshock, differentiated damages were suffered by three buildings overlooking the Square. Thus, the main objective of this study is to assess amplifications at San Giustino’s Square, at Chieti city center (Abruzzi, Italy) by 2D LSR numerical simulations.
To accomplish this task, an accurate reconstruction of the subsurface characters of Chieti’s hill underneath San Giustino’s Square has been performed through geognostic, geotechnical, and geophysical investigations.
The seismic and tectonic geological characteristics of San Giustino’s Square on Chieti’s Hill are described in Section 2 below.
Section 3 illustrates the damage suffered by three out of eight historical buildings due to the 2009 L’Aquila earthquake (6.3 Mw). Section 4 shows the geognostic and geophysics investigation made in San Giustino’s Square. Section 5 introduces the 2D numerical method adopted in LSR simulations. Section 6 illustrates and discusses the results before the conclusions are provided.

2. Geological, Litho-Technical, and Seismic–Tectonic Features of Chieti

Chieti is an ancient city located on a hill at 330 m a.s.l. in Southern Abruzzi. It belongs to the Abruzzi’s hilly territory near the Adriatic Sea coastline. A thick sequence of Upper Pliocene–Middle Pleistocene marine deposits, known as the Mutignano Formation (FMT), characterizes the entire territory [35] (Figure 1).
FMT is made up of coarsening thickening upward deposits (clays–sands–conglomerate) that can be divided into four litho-facies: pelitic–sandy (FMTa), conglomeratic (FMTb), sandy–pelitic (FMTc), and sandy–conglomeratic (FMTd).
From the lithological point of view, the FMT is characterized by an alternation of Illyrian–montmorillonite, marly clays, sandstone, and sand. The lithological sequence is closed by coarser clastic deposits made up of heterogeneous gravels in a sandy matrix.
Atop the sequence, there is a quaternary deposit succession including fluvial deposits, alluvial fans, and slope deposits. In addition, there are eluvial–colluvial deposits made up of sands or clays of variable thickness that cover the slopes of the whole territory.
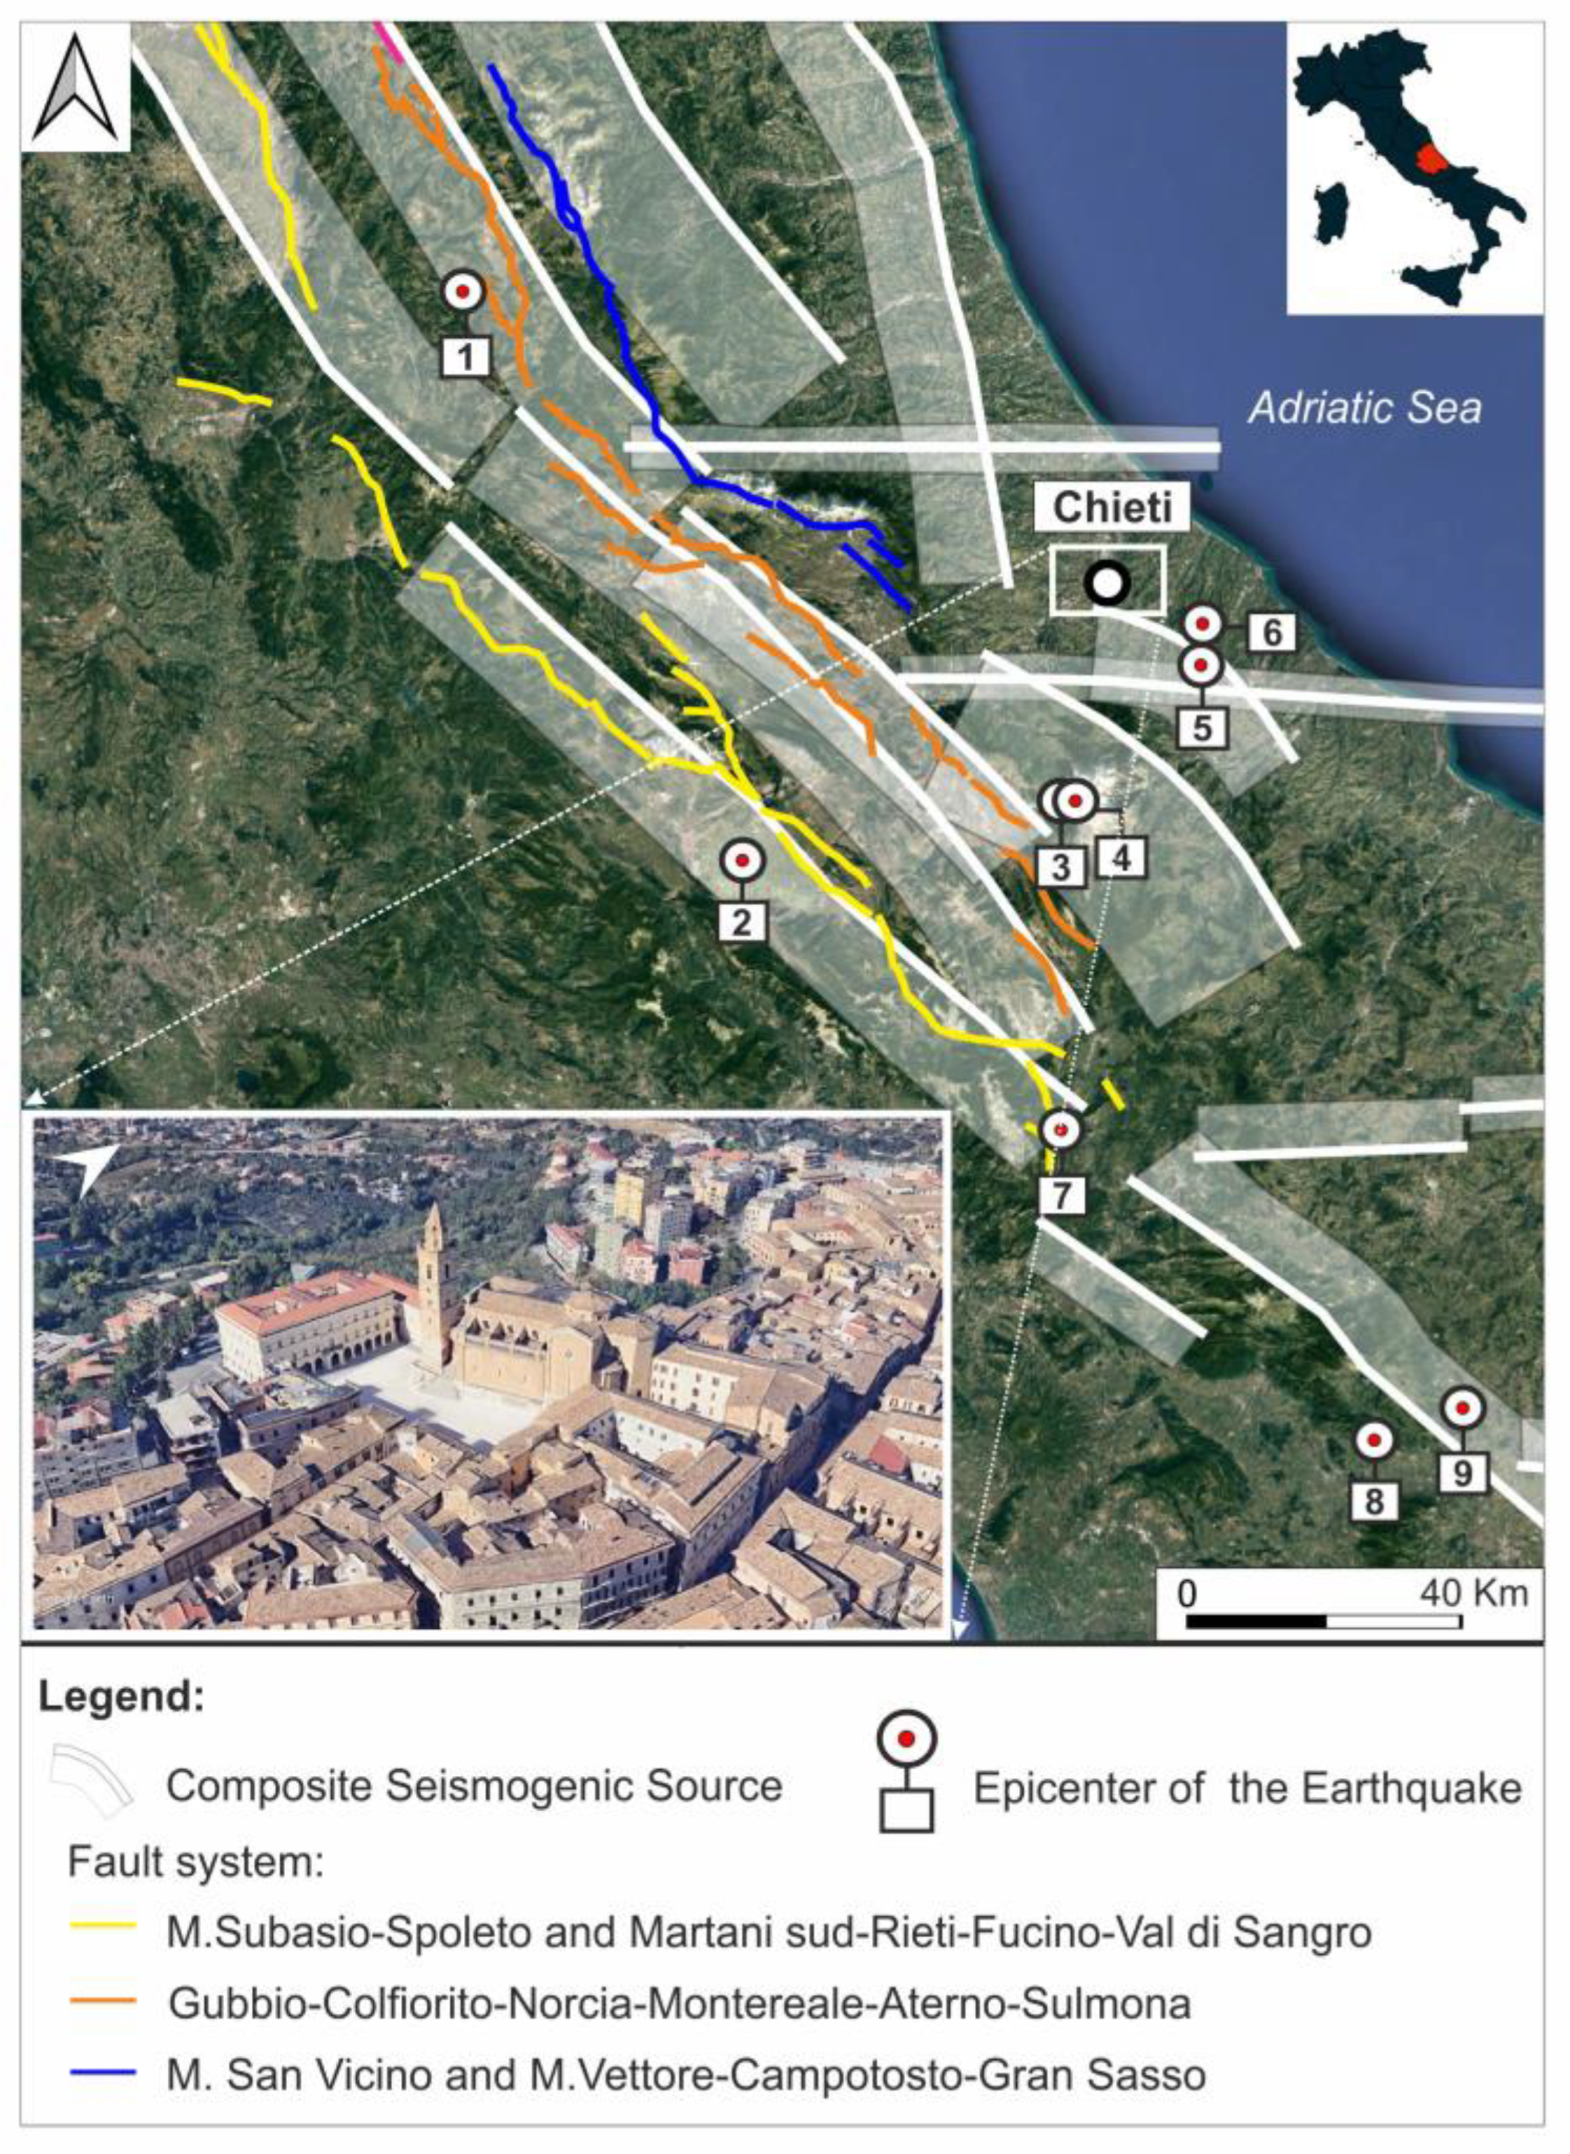
From a tectonic point of view, the city is located between two seismogenic zones: the Apennine-footing belt, which includes the Maiella massif, which was shaken by damaging earthquakes in the last 300 years, and the area between the Apennines and the Adriatic Sea, which is characterized by lower-magnitude seismic activity (Figure 2).
Seismogenic normal faults dominate the active tectonics in the Apennine chain, which is the focal point of most of the seismic activity in Central Italy and along the Italian peninsula [36,37,38,39,40].
Thus, both near-field and far-field earthquakes have been felt in Chieti, causing differentiated damages to several recently constructed buildings as well as older ones.
Figure 1. Geological map of Chieti. FMTa = pelitic–sandy association of the Mutignano Formation; FMTc = sandy–pelitic association of the Mutignano Formation; FMTd = sandy–conglomeratic association of the Mutignano Formation. After, [41]. The trace of the cross-section A-A’ corresponds to 2D geological subsoil model.
Geosciences 15 00076 g001
Figure 2. Seismological characters of Central Apennine. At the bottom, the numbered epicenters of seismic events caused Intensity (in Modified Mercalli Scale IMM) higher than VI at Chieti city center. After [4,38,42,43]. (1) Valnerina, Mw 6.92, (2) Marsica, Mw 7.08, (3) Maiella1, Mw 6.84, (4) Maiella2, Mw 5.90, (5) Chietino1, Mw 5.41, (6) Chietino2, Mw 5.26, (7) Monti della Meta, Mw 5.86, (8) Sannio, Mw 7.06, (9) Central-Southern Apennine, Mw 7.19.
Geosciences 15 00076 g002
In Table 1, the historical earthquakes that produced macroseismic intensities equal to or higher than VI IMCS in the Chieti city site [43] are listed. In particular, the maximum intensity of VII-VIII IMCS was recorded in 1706 and 1933 (earthquakes with epicenters in the Maiella Massif) and 1915 (Avezzano earthquake). The magnitude used in the Italian earthquake catalogue is the Moment Magnitude (Mw), estimated by empirical correlations from the Macroseismic Intensities (I0) associated with historical earthquakes [43,44].

3. Damages Suffered in San Giustino’s Square After the 2009 L’Aquila Earthquake

The 2009 L’Aquila earthquake (6 April 2009 mainshock, 6.3 Mw) [45] was the most recent earthquake that affected Chieti. It was a far-field seismic event, occurring roughly 100 km away from Chieti city center, and caused differentiated damages on buildings set along the borders of its hilltop, much of which were focused on the first two stories. Three buildings overlooking San Giustino’s Square were also damaged [4]: the Palace of Justice, San Giustino’s Cathedral, and the D’Achille Palace (Former Town Hall) (see Figure 3).
The Justice Court building was constructed at the end of the 19th century, and it was characterized by two bodies: a central one and a lateral one known as the “Ala Galliani”. In geometric plan, this building is not regular and shows an L shape [46] although a structural joint was located at the intersection of the two bodies (Figure 3).
A description of the distribution of the damages suffered by the Court (Figure 3) is portrayed in the “Preliminary Project for the Rehabilitation and Seismic Improvement of the Chieti Court Building” by De Deo and Di Renzo [46]. This building suffered internal and external cracks: isolated and diffuse pass-through lesions, lesions on vaults or overhanging arches, and foundation failures were found. In particular, the external pass-through cracks are mainly concentrated in the side elevation of the building (Figure 3(B2)), while the external diffuse pass-through cracks are most visible in the south elevation of the Ala Galliani Building that fronts the square (Figure 3(B3)).
As far as internal lesions are concerned, these were found on the vaults and arches above and were mainly concentrated in the western half (in plan) of the building on all four floors. This damage level was classified as D3, according to the EMS classification.
San Giustino’s Cathedral, conversely, suffered no significant damage but at the circular dome of the high altar (where two pass-through lesions were observed) and to the base of the six skylights [47]. Other visible disconnections occurred in the interior staircase and at the entrance hall where a deep crack ran through the organ to the main rose window [47]. The damage level D1 was estimated for the Cathedral. The D’Achille Palace, which is the former Chieti City Hall, suffered moderate damages, as large as D2 (see Figure 3).
In order to identify possible resonance phenomena between the fundamental periods of the buildings and the amplified periods of the ground, which will be discussed in Section 6 in view of the results obtained from the seismic response analysis, the fundamental period of vibration of the Palace of Justice was calculated according to Equations (1)–(3). The three formulas estimate approximately, according to three different studies, the fundamental period of a simple masonry structure through its height. The three formulas are similar but not the same. Due to the uncertainty related to these empirical formulas, the authors opined it is correct to consider the possible variation range of estimated fundamental periods.
The choice of this historical building is related to the highest damage level suffered and its fairly regular shape compared to the other two buildings. Thus, the approximated Equations (1)–(3) to estimate the fundamental period of this building can be considered reliable.

4. Subsurface Characterization of San Giustino’s Square

4.1. Geognostic Soundings

The study of the dynamic behavior of the slope portion of Chieti Hill was carried out along the two-dimensional geological subsoil section shown in Figure 4. This subsurface model, having an ENE-WSW orientation, longitudinally crosses San Giustino’s Square for a length of 900 m.
The reconstructed model is representative of the subsurface conditions of the three damaged buildings.
For the geological reconstruction of the 2D model and its seismic and mechanical characteristics, the following multidisciplinary investigations were performed.
Six boreholes (Figure 5), deepened up to 50 m, from Level 1 of the Seismic Microzonation studies in Chieti’s city [41] and carried out during the renovation of San Giustino’s Square [48] in 2018, were used to realize the subsoil model.
The geological subsoil model (Figure 4) shows the following horizontal stratigraphy starting from the top:
  • Anthropogenic soil deposits (RI);
  • Altered sandy horizon of yellow silty sand attributable to the sandy-conglomeratic association of the Mutignano Formation (FMTd);
  • Greenish loamy–clayey fine-grained soil (FMTd-1) (this layer is a fine pelitic stratum sedimented within the sandy–conglomeratic association of the Mutignano Formation [49]);
  • Dense yellow sand attributable to the sandier member of the Mutignano Formation (FMTc);
  • Pliocene clayey substrate (FMTa) consisting of grey-blue clay with greyish sandy levels.
Along the slope, there are eluvial–colluvial deposits of varying thickness resulting from the geological substrate alteration of clayey and sandy loam. The water table level was reconstructed based on the boreholes present in the study area.
To represent the real subsurface conditions, the well-known Cisternone’s cavity located in the first layer of anthropogenic material within the San Giustino Square was considered in the section (Figure 4).

4.2. Geophysical Investigations

4.2.1. Seismic Refraction

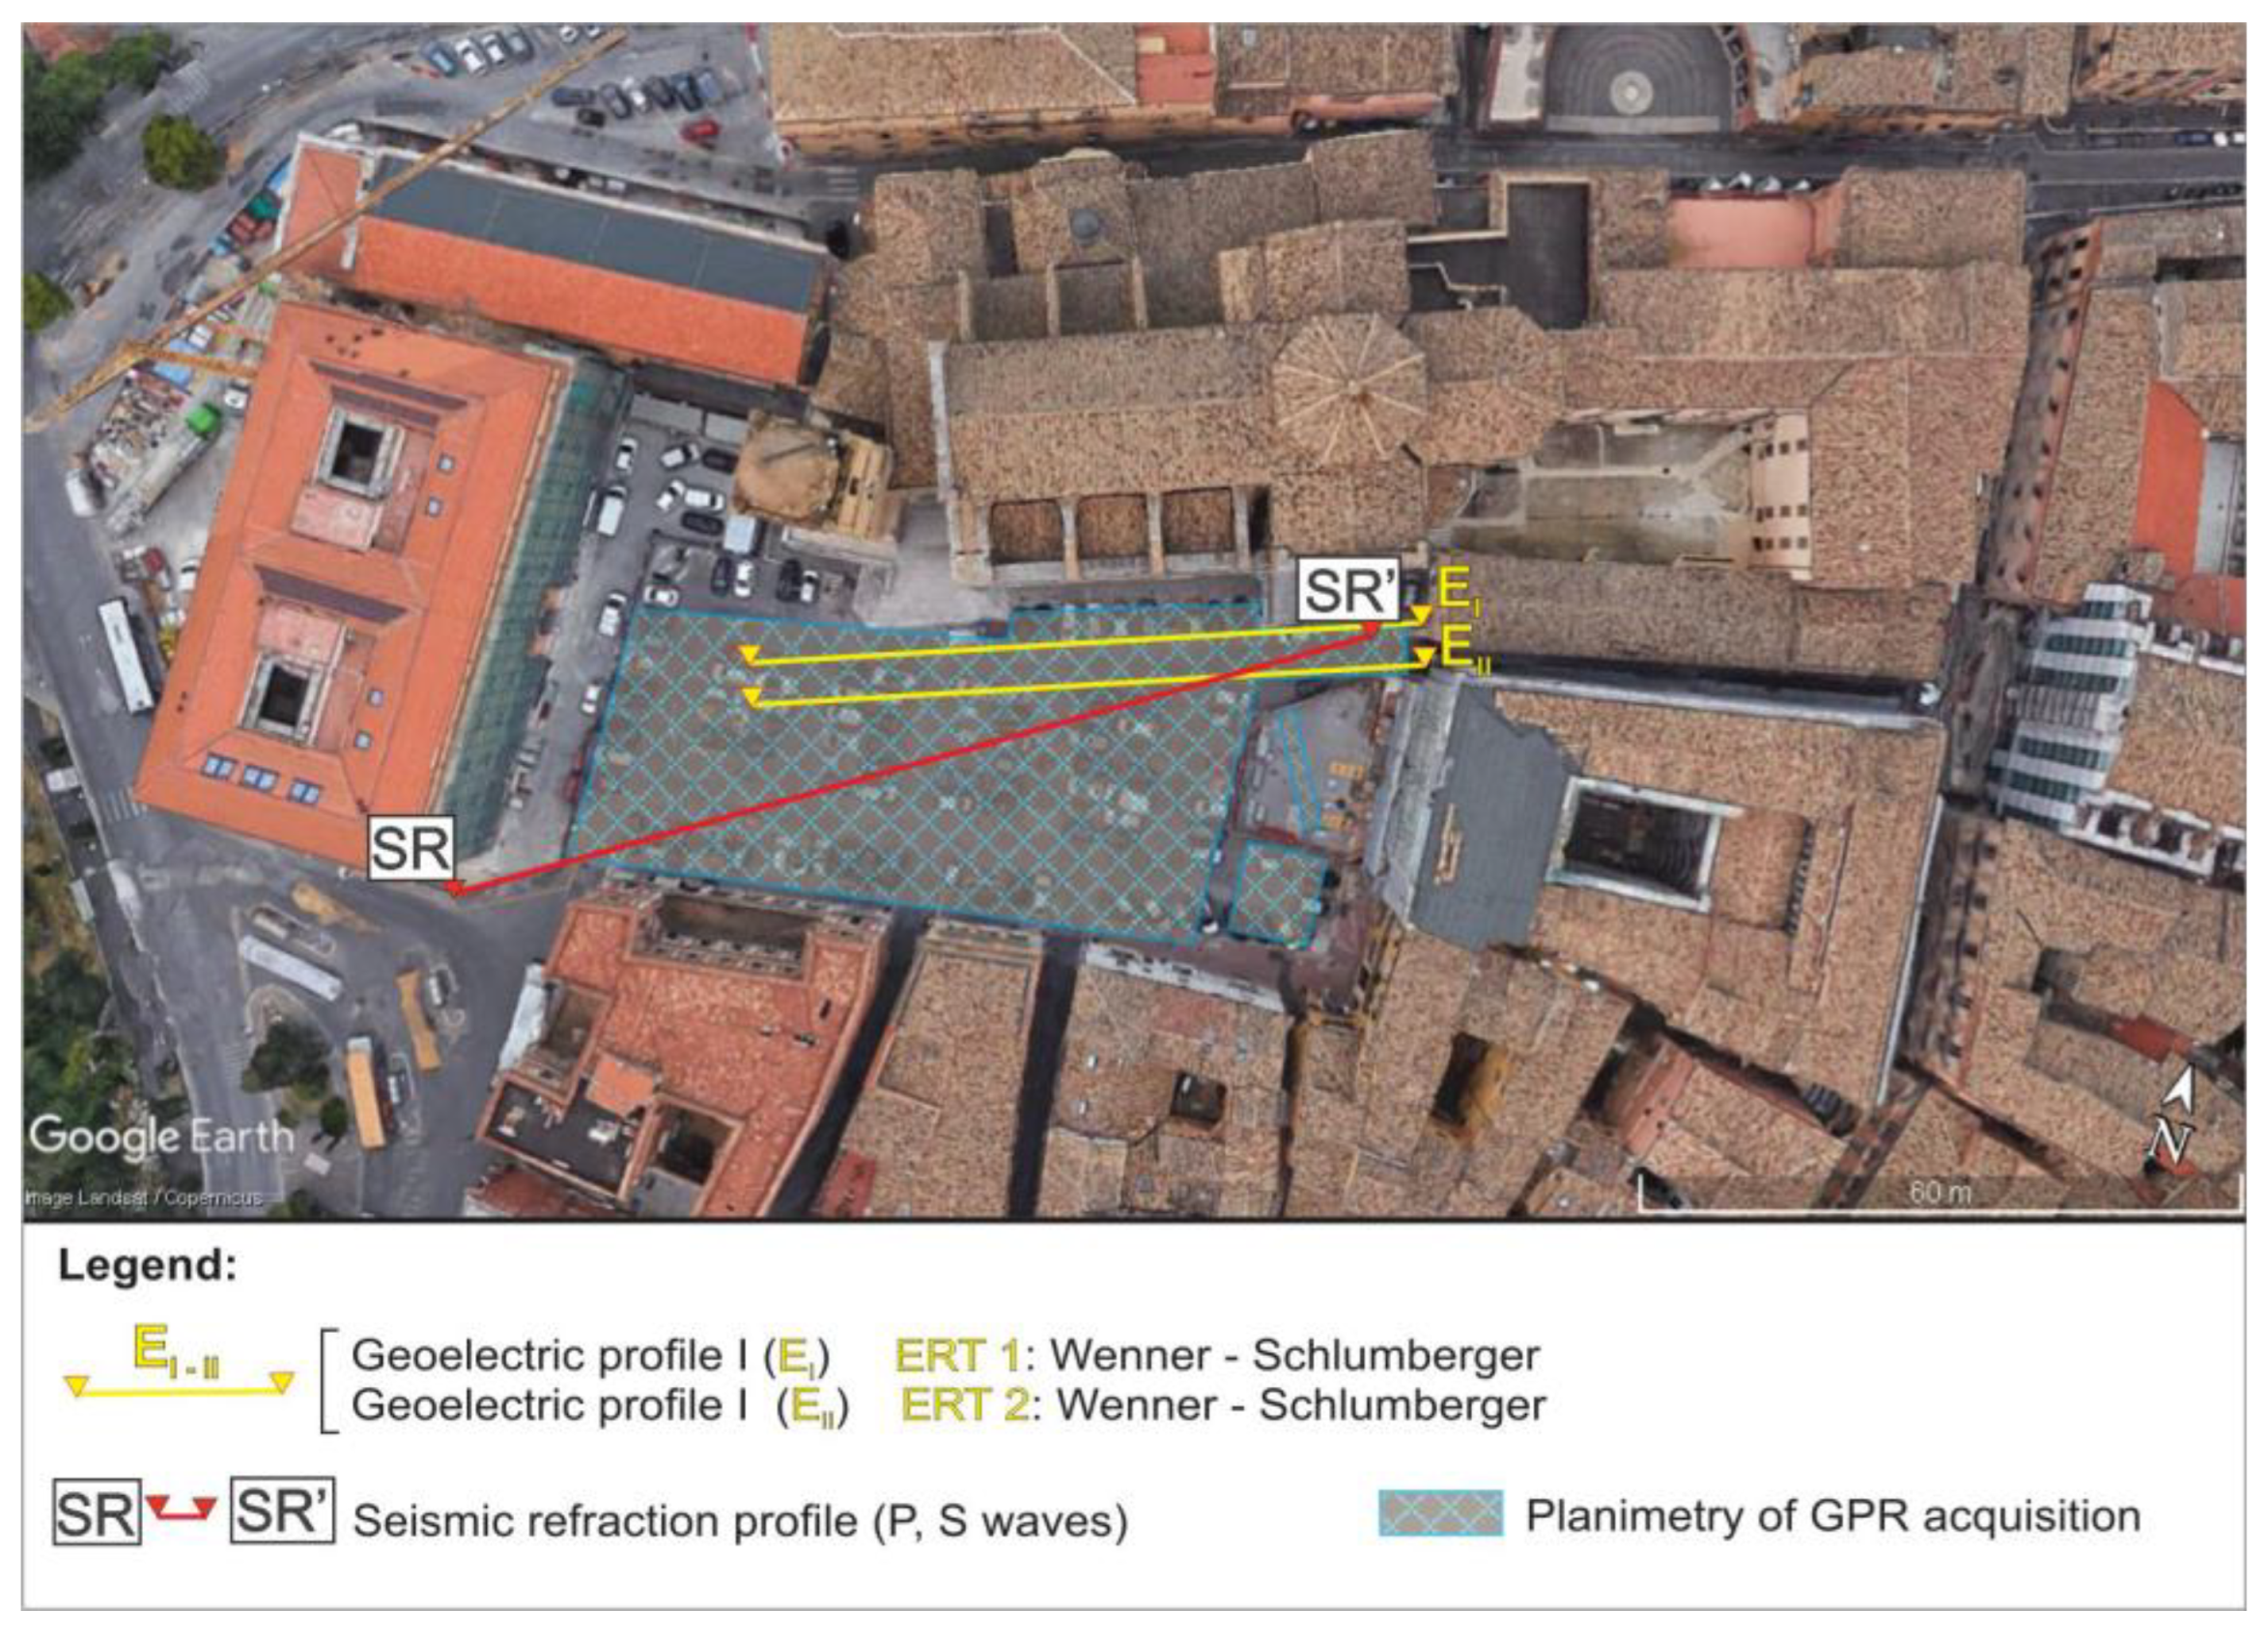
Seismic refraction tomography (SR) and Ground-Penetrating Radar (GPR) acquisition were carried out in San Giustino’s Square in 2018 (Figure 6) as part of the subsoil characterization for the renovation of the Square [48]. Later on, two geoelectrical acquisitions (ERT) were performed [50] to study the local seismic response of San Giustino’s Square considering the anthropogenic cavities.
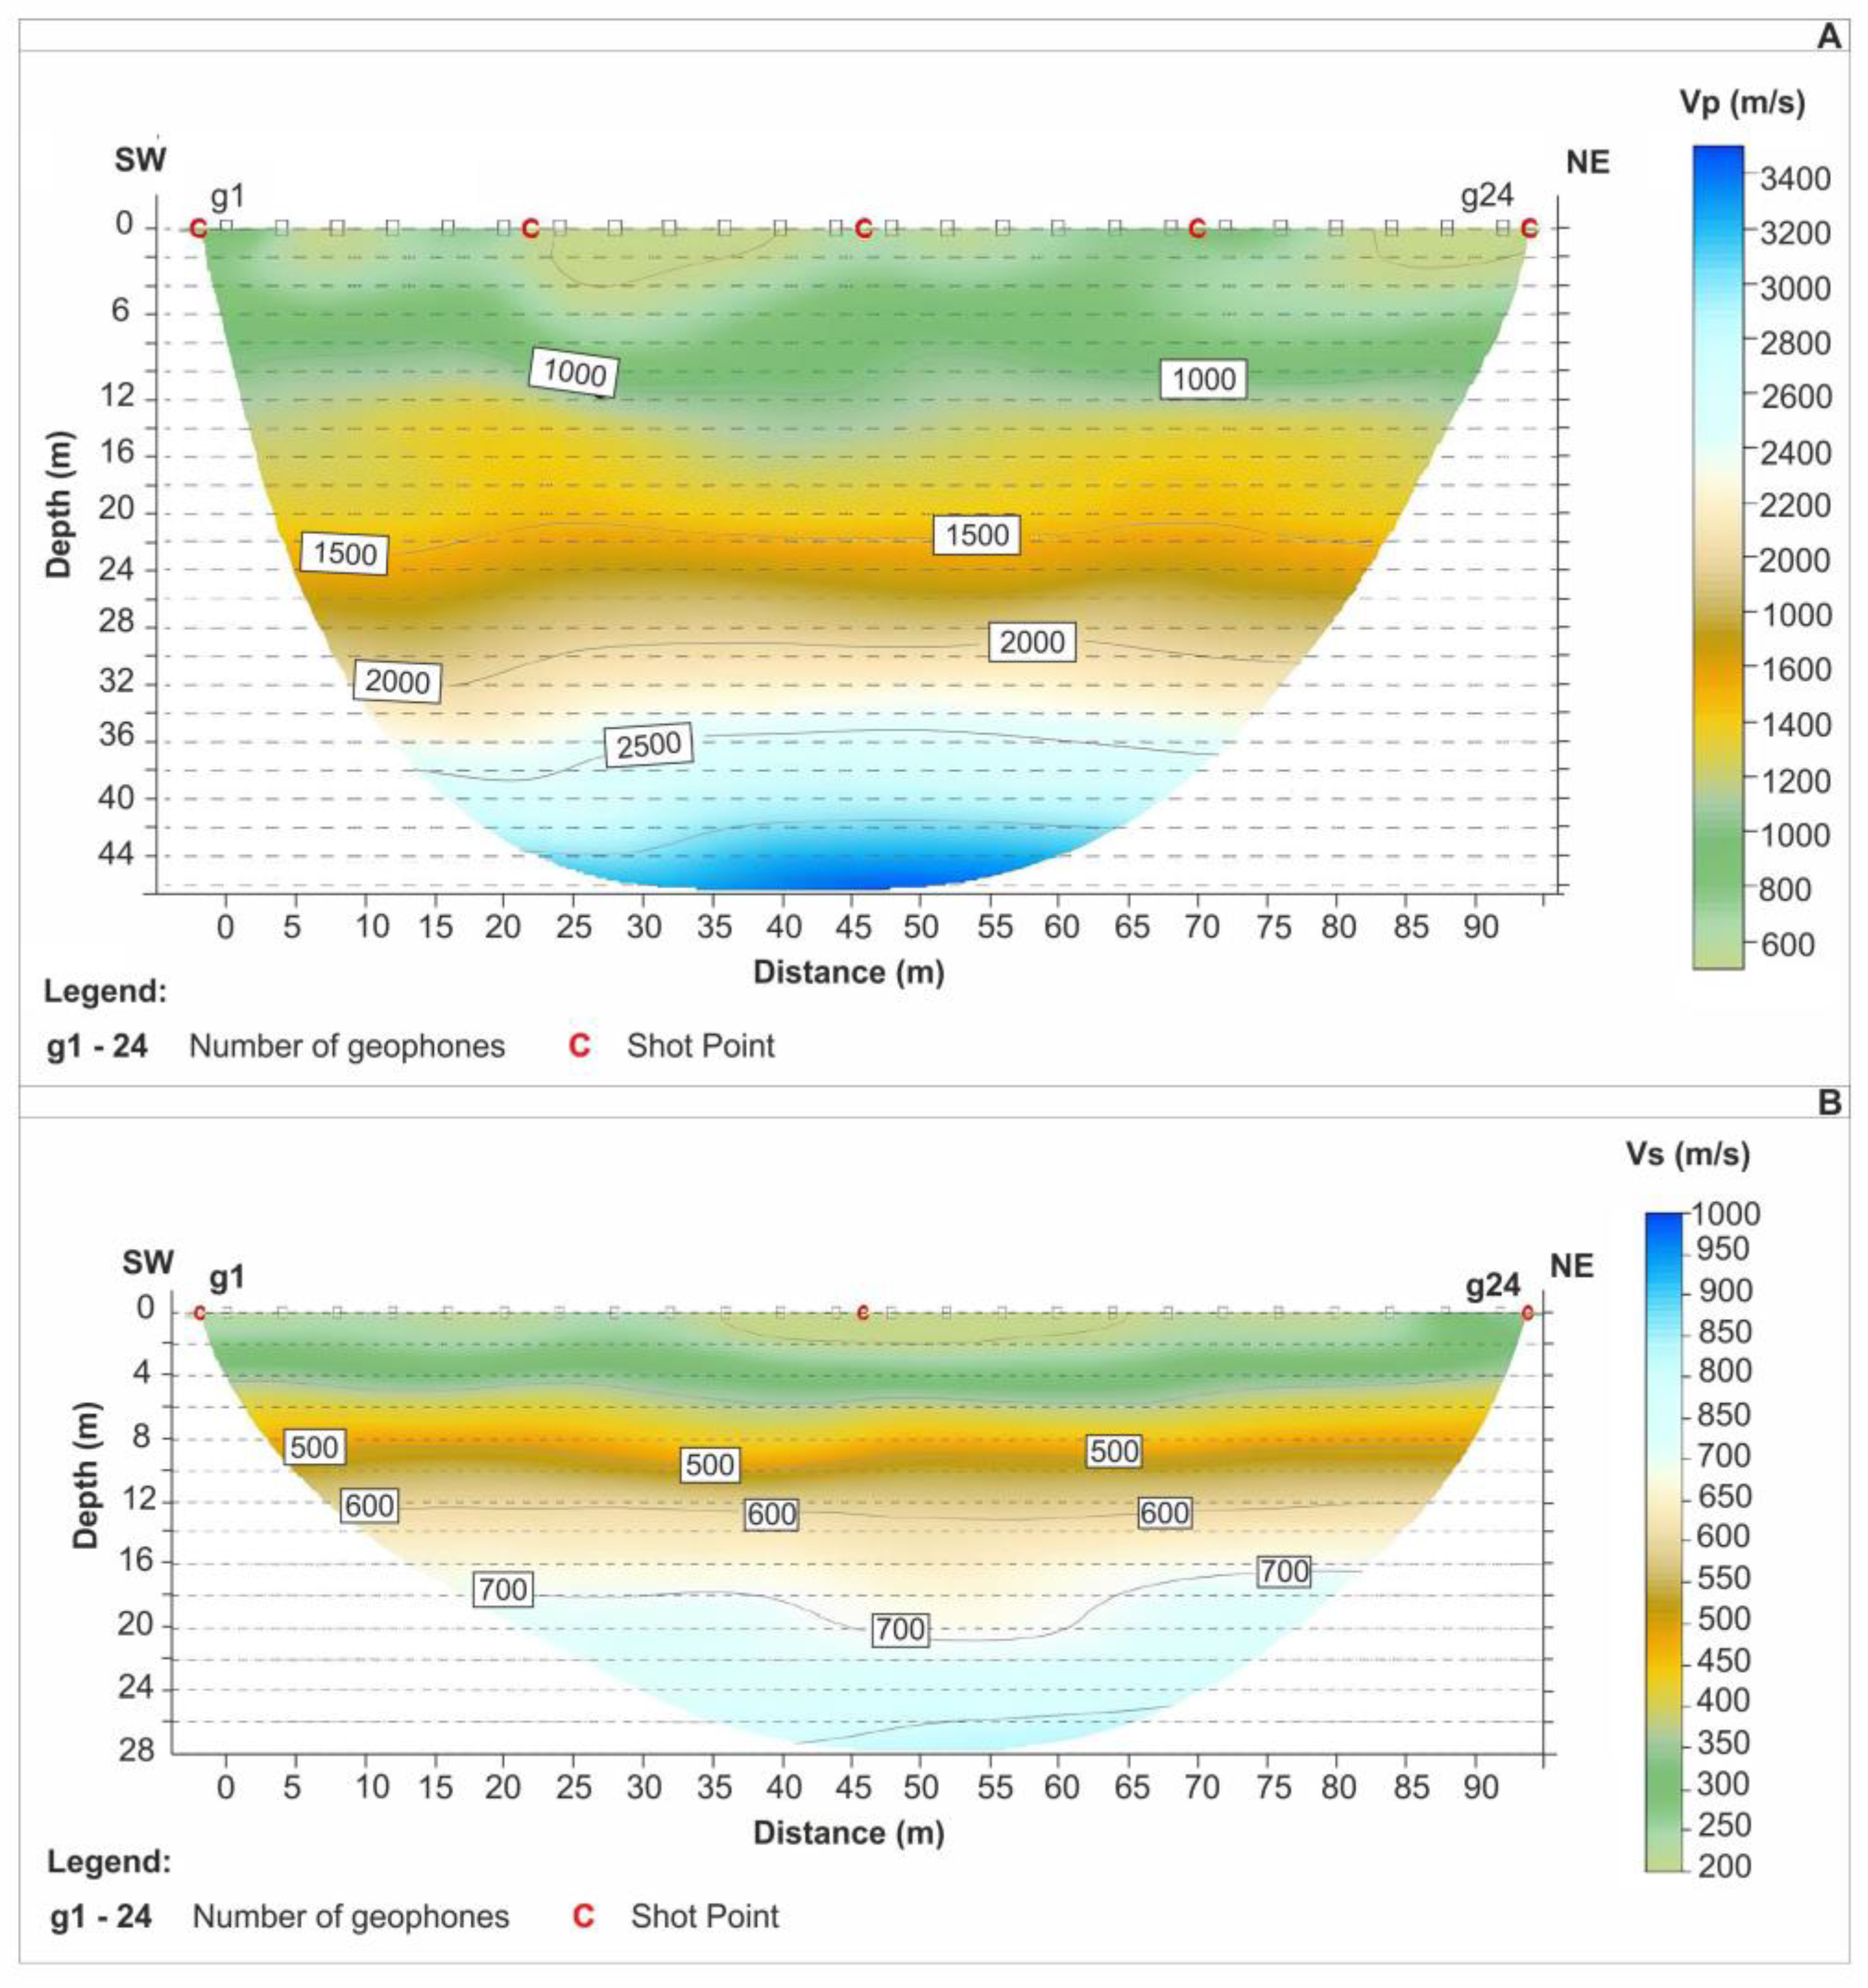
The subsurface structure, the velocity distribution in depth, and the number of underlying layers can be detected by performing seismic refraction tomography [51] in P and S waves (Figure 7). A seismic array of 96 m with 24 geophones was used to investigate in the ENE–WSW direction the areal surface of the square (see Figure 6).
The SR measured S and P wave velocities, Vs and Vp, of the layers and the geometry of the first layer of the filling anthropogenic material where the underground cavity was excavated.
The first 45 m showed five seismic layers at different velocities in the two tomographic sections (Figure 7).
The velocity range of the seismic compressional waves varies from 600 m/s in the first few meters below ground level to a maximum of 3400 m/s at 45 m depth. The average velocity ranges of each seismic layer and the relative thicknesses are shown in Table 2.

4.2.2. Georadar

Since the 1980s, Ground Penetrating Radar (GPR) has been utilized and acknowledged in geological, engineering, environmental, and archeological sciences. The travel time of an electromagnetic wave that is sent from a transmitter antenna, reflected from the subsurface, and picked up by a reception antenna is measured using GPR techniques. Hence, the GPR measures the mass anomalies at variable spatial resolution [52] in the subsurface and in this study, it was used to detect the possible presence of anthropogenic cavities. In San Giustino’s Square, 70 GPR lines were performed investigating a depth of 1.5 m [48].
The GPR revealed an ancient network of underground utilities and several significant areal anomalies found in the investigation meshes named M1 and M3, respectively (Figure 8). Within the M1 area, an A1 anomaly at the cathedral staircase has been highlighted. This anomaly could be due to the presence of an underground cistern with interconnected vaults at distances of approximately 5 m for a total of 20 m long anomaly.
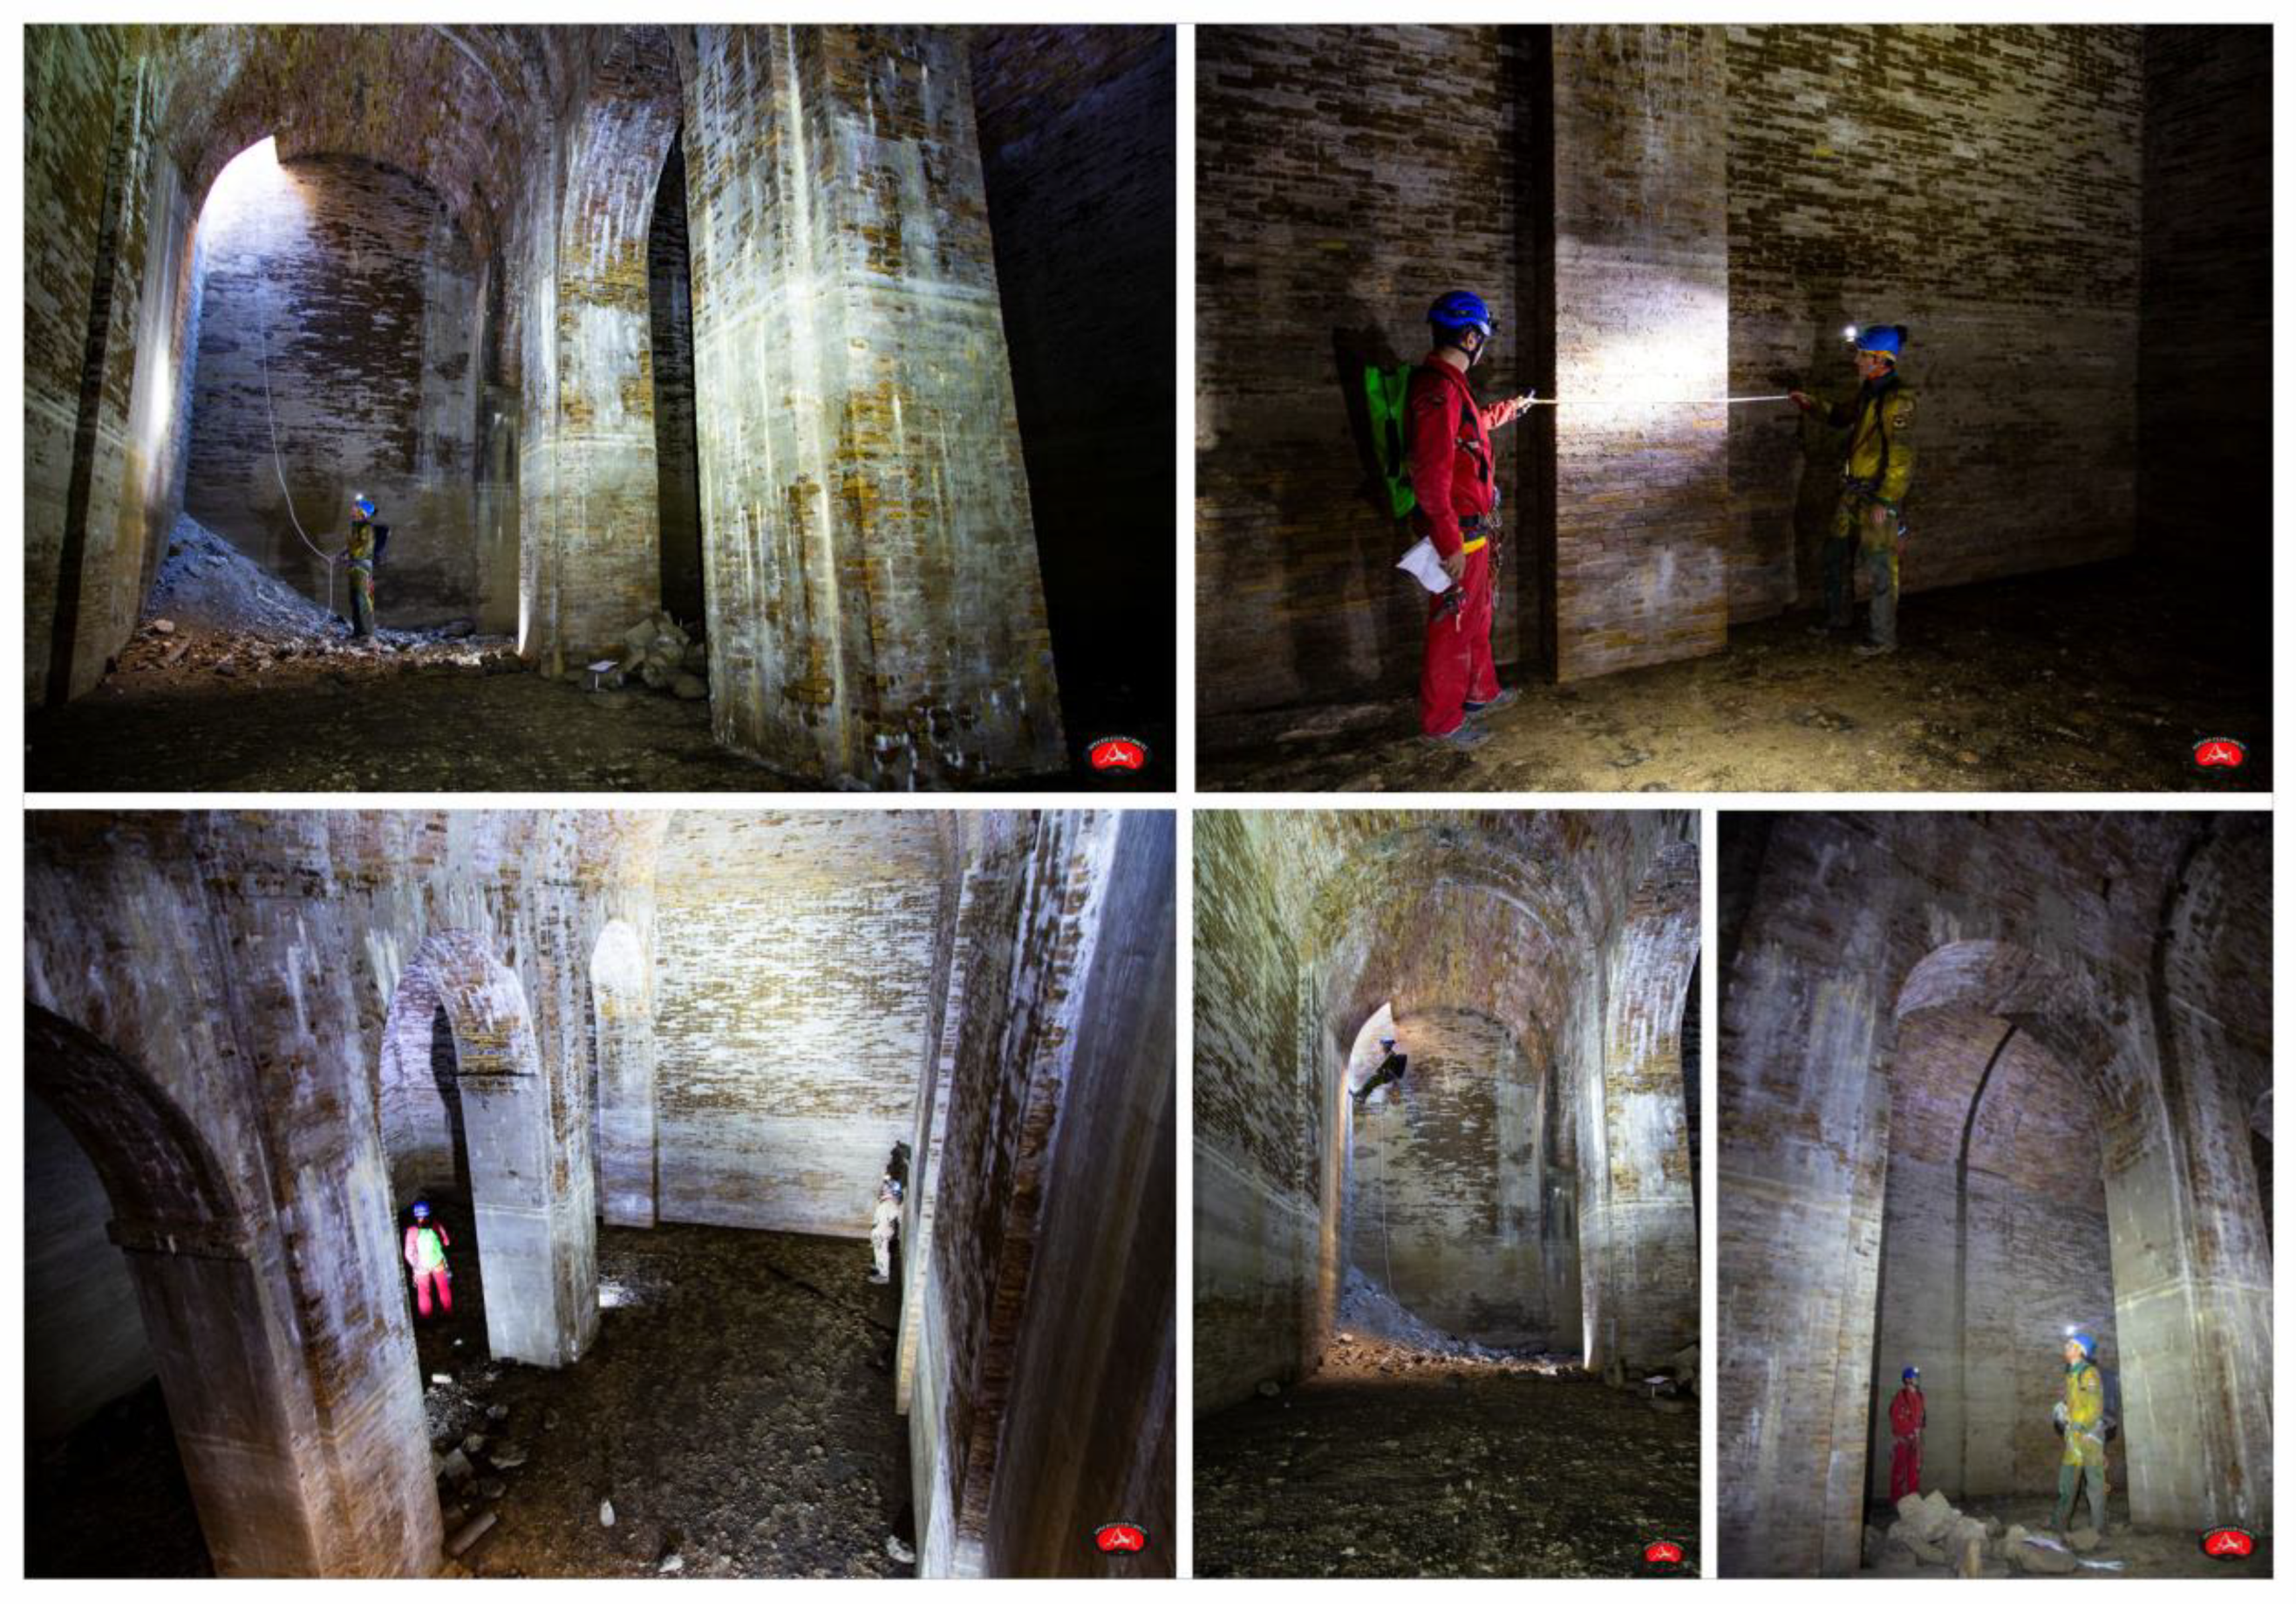
Another important anomaly, with a size of approximately 10 m, is visible in the M3 area: it confirms the presence of an underground cavity of large size already known as the “Cisternone” and reported in the state historical archive as a 19th-century underground structure used as a water reservoir. This is a void with a rectangular plan structure measuring 10 m × 13 m and 8 m in height (Figure 9).
It is worth noticing, between the two barrel-vaulted, arches, that are supporting structures, identified as metric-sized columns (Figure 8). These dimensions were confirmed in 2018 during an inspection inside the cavity by some members of the Speleological Association named “SpeleoClub Chieti” (Figure 9).

4.2.3. Geoelectrical Survey

The Electrical Resistance Technique (ERT) method measures a potential difference in response to the injection of a known amount of electrical current in the subsoil [53].
Different earth materials show different resistance to the passage of electrical current because of the variation in the degree of fractures, material types, and degree of saturation. Both the injection of current and the detection of potential difference are carried out using four metal electrodes, current and potential, respectively [54].
ERT represents the most used geophysical method for investigating cavities and other types of discontinuities in the subsoil because of its inexpensive survey costs and the large resistivity contrast between the surrounding formation and the air-filled hypogea environment [55].
In comparison to the host rock, the electrical conductivity of the cavities that are partially or fully filled with water or other materials can range from extremely conductive to comparatively resistant, based on the composition of the material.
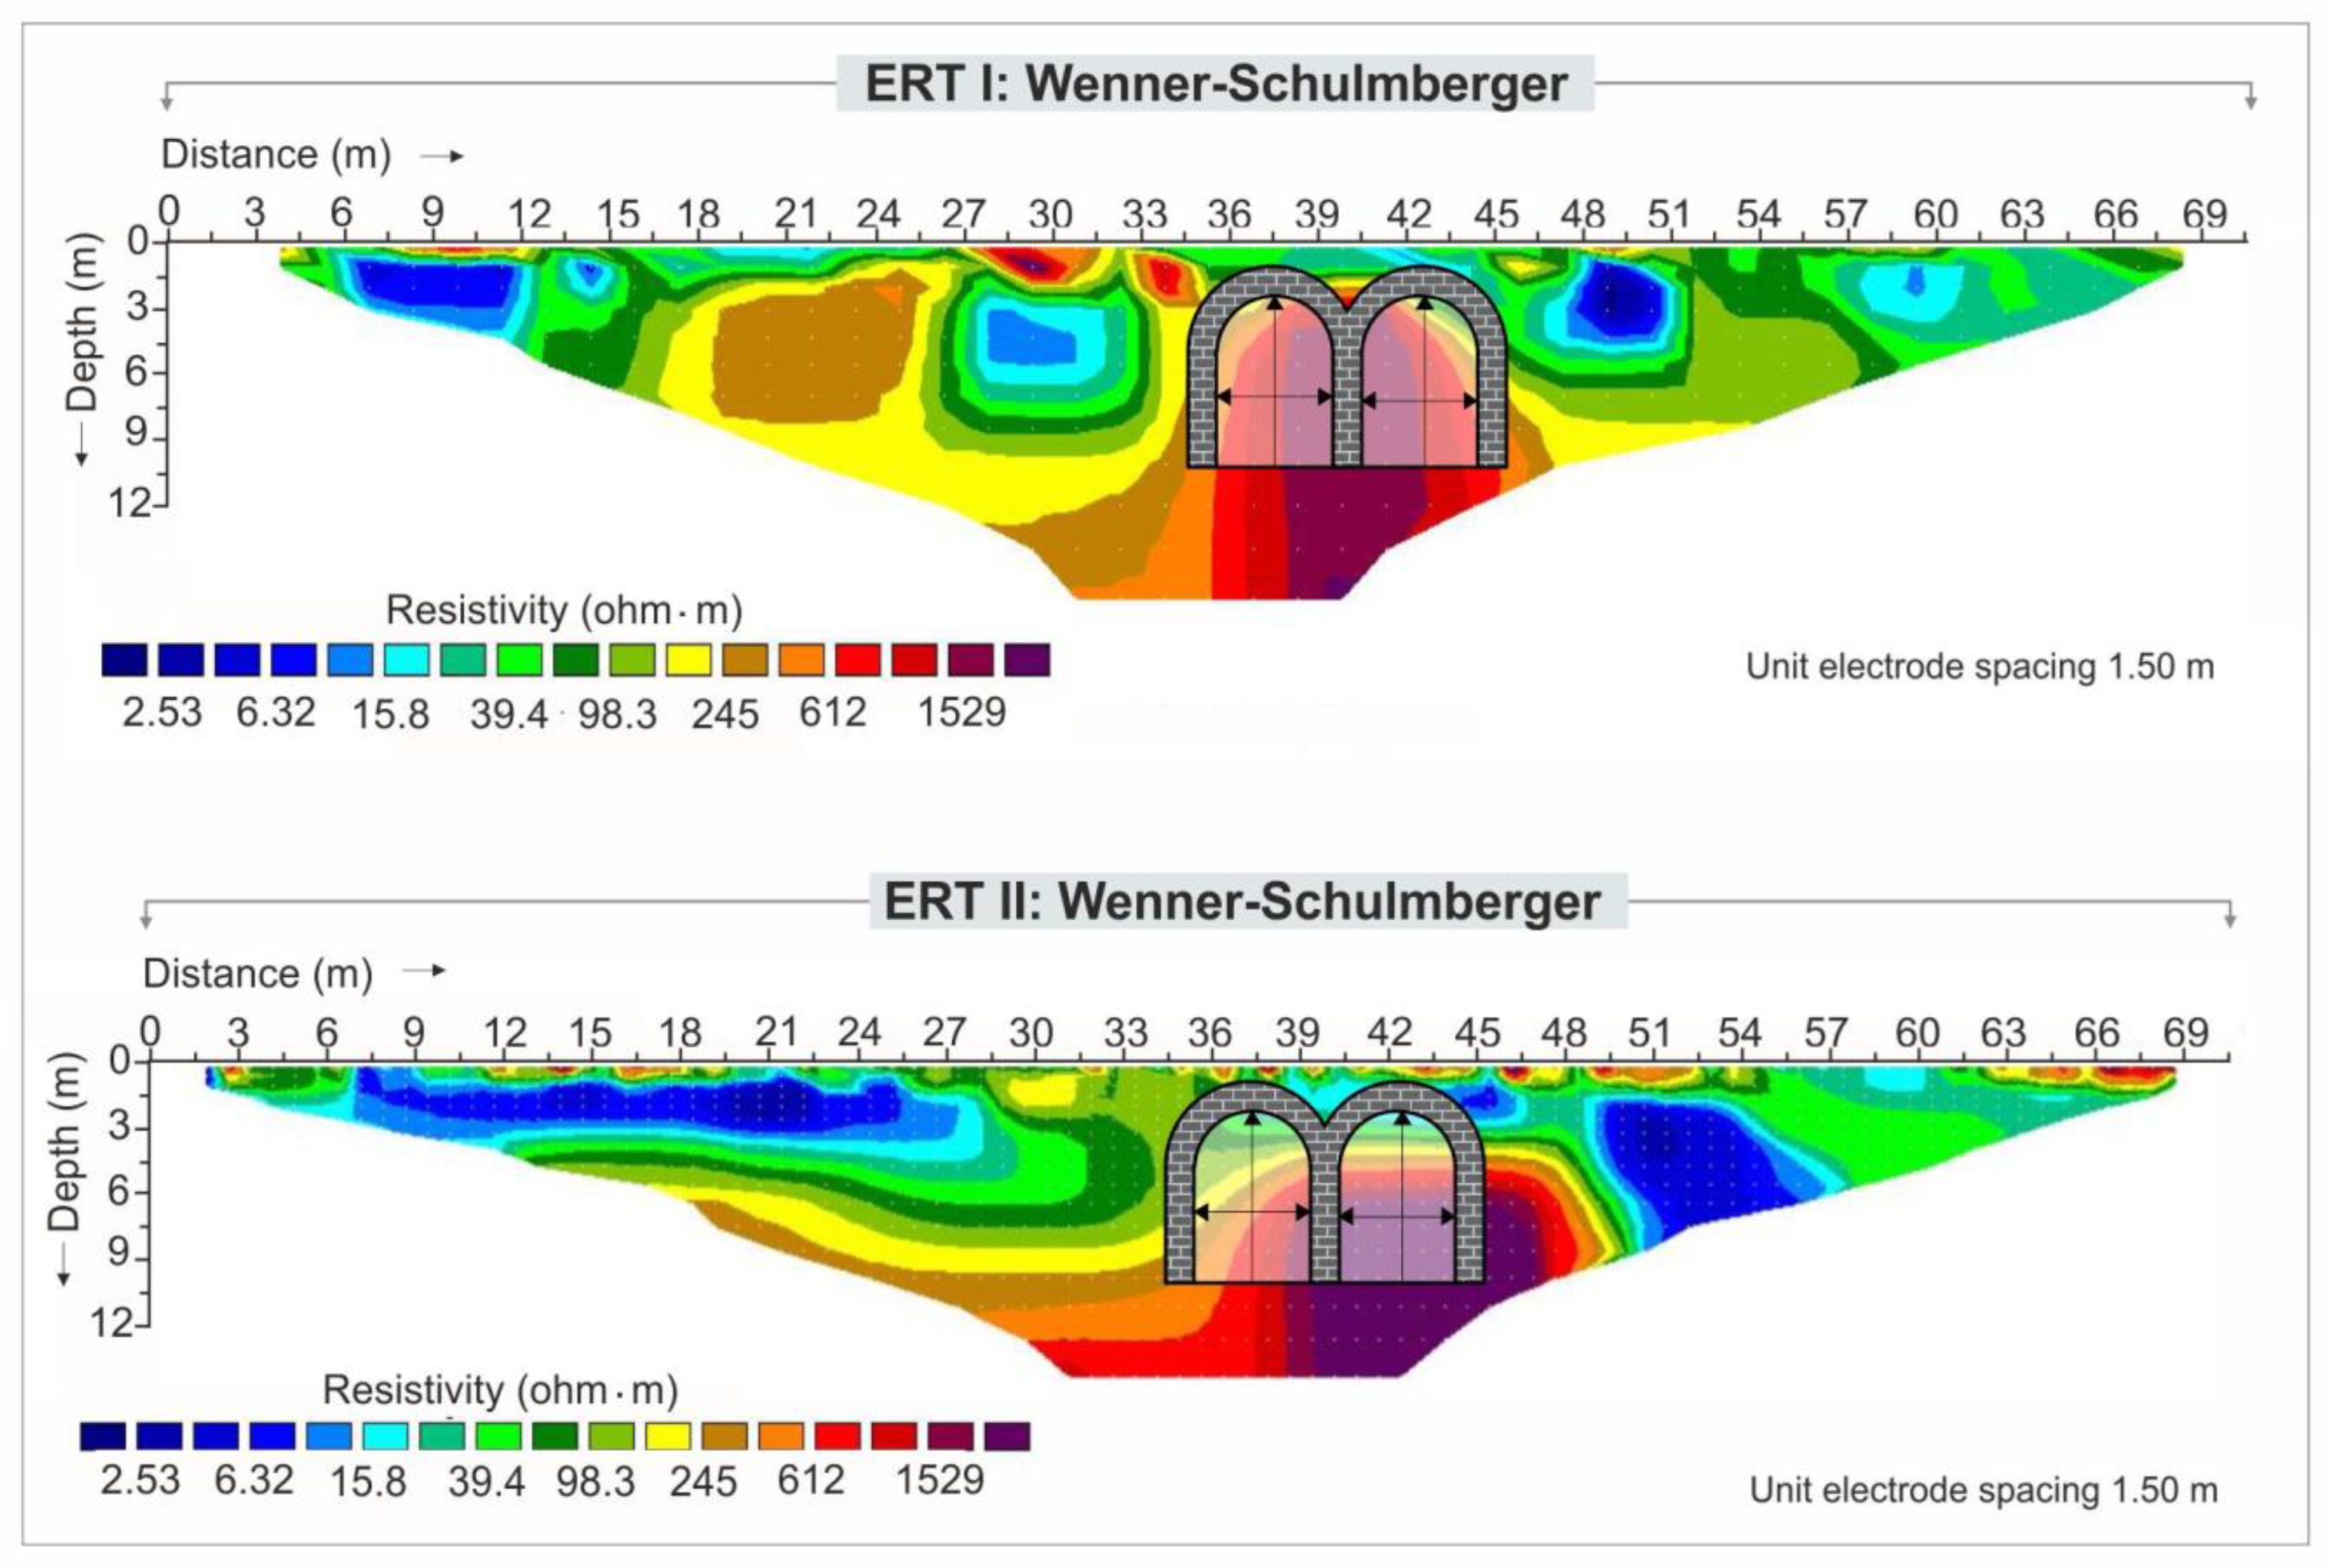
A geoelectric survey was conducted in 2020 in San Giustino’s Square (Figure 10) to reconstruct the geometric features of the cavity, already identified with less penetrating geophysical techniques such as GPR.
Thus, two parallel profiles were carried out (see Figure 6 for location): the first aimed at acquiring quantitative information on the dimensions of the main known cavity used as a calibration of the method itself and also to highlight further hypogea identified below the square. The second profile shifted parallel five meters from the first, allowing volumetric data to be obtained by defining the extent (in width) of the recognized cavities.
A Wenner–Schlumberger acquisition configuration was performed on the two profiles, each 70.5 m-long.
The processed 2D electrical tomographic sections are shown in Figure 10.
The ERT I section (Figure 10) highlighted two increments of resistivity: the first (200–600 Ωm) was observed from 1 m above ground level at a distance of 15 m with mean resistivity values, and the second (≥1500 Ωm) with very high resistivity values where the Cisternone’s cavity is located.
The second ERT profile clearly showed the Cisternone’s cavity at a distance of 5 m from the first ERT instead did not see the second void detected in ERT I.
This possible second void detected through the ERT I (a possibly partially filled void) was brought to light during excavations executed in 2022 in a large part of the square area: this hypogeous environment emerged in a semi-frontal position with respect to the main staircase to S. Giustino’s Cathedral.

5. Two-Dimensional Numerical Model of San Giustino’s Square

5.1. Finite Element Simulations

Using the AlgoShake2D code [56], 2D seismic numerical calculations were carried out in the time domain using an equivalent linear approach.
The Finite Element technique (FEM) was used to calculate stresses and deformations due to the 2D propagation of horizontal shear waves (SH) through rock formations and soils from a horizontal, non-rigid rocky bedrock up to the surface, under total stress conditions.
The recorded horizontal component of the motion at the surface (the seismic station) has been deconvolved to apply the input motion at the bedrock (the bottom of the model). The bedrock’s shear wave velocity provides the properties of a compliant base condition that is assumed at the bottom of the model. At every mesh grid node, the dynamic motion equation is the following:
M u ¨ + C e + C b u ˙ + K u = M I x u b , x ¨ t M I y u b , y ¨ t + F f f ( t )
where M = the global mass matrix of the equation system; C e = global damping matrix of the finite element node system; C b = global damping matrix of the viscous dampers at the bottom of the mesh; K = global stiffness matrix of the equation system; u ¨ = global acceleration; vector, u ˙ = global velocity vector and u = global displacement vector of the equation system; I x = the drag global vector along horizontal direction; I y = the drag global vector along vertical direction; u ¨ b , x , y = horizontal and vertical components of the input acceleration vector; F f f ( t ) = dynamic forces that simulate the free field conditions at the vertical edges of the modeled domain.
The non-linear and non-elastic behavior of soils under seismic motions was modeled through the equivalent linear constitutive model. It consists of using the shear modulus reduction curve with strain amplitude (γ): G(γ)/G0. It is updated at each time step of the analysis by the γ value induced by the input motion [57]. As a result, the damping values are updated to the shear strain level using the damping curve D(γ), which accounts for the damping effects of the cyclic degradation. For these types of numerical simulations on soils, several curves of G/G0 (γ) and D (γ) from the literature are accessible and frequently employed according to specific physical factors.
The finite element damping value is assembled using a traditional Rayleigh technique to yield the global damping matrix, Ce. The damping for each element can be expressed as:
C i = α R , i M i + β R , i K i
where α R , i and β R , i are the Rayleigh coefficients and Mi and Ki are the mass and stiffness matrices of each finite element, respectively.
The AlgoShake2D code, used from now on, has internally completed this calculation. The maximum side dimension of each triangle element in the domain is determined by the cut-off frequency, or maximum propagating frequency (fmax). For far-field sites, fmax = 15 Hz is often assigned. Then, to prevent the aliasing problem in the numerical simulation, the following rule has been adopted for the maximum element side dimension h [58]:
h = V S 6 ÷ 8 · f m a x
where fmax is the greatest frequency value that is mathematically propagated from the bottom to the top of the model, and Vs is the shear wave velocity.
Results have been presented in terms of the acceleration amplification function and acceleration response spectra when the input motion is applied at the bottom of the model domain. This latter is the ratio of the input response spectrum applied at the bedrock line at the bottom of the model to the output response spectrum at a point on the upper surface of the modeled domain, in the period/frequency domain.
The seismic amplification factor (FA) in the literature is defined as follows:
FA = T 1 T 2 SA out ( T ) dT T 1 T 2 SA in ( T ) dT
where the intensity of the acceleration response spectrum is calculated at the bedrock (SAin), which is the bottom of the subsoil model, and on the surface points (SAout) is represented by the integral of the acceleration spectrum (SA). T1 and T2 are the bounds of the period ranges considered in this study: 0.1–0.5 s, 0.4–0.8 s, and 0.7–1.1 s [59].
In order to model the absorption of the wave-associated energy by the semi-infinite domain, lateral boundary conditions have been implemented based on these equations:
F x = ρ V P u ˙ x m u ˙ x f f A
F y = ρ V S u ˙ y m u ˙ y f f A
where ρ = soil mass density of the soil; VP: P wave velocity of the soil; VS: S wave velocity of the soil; A: the influence area of the damping node; u ˙ y m : node velocity in x-direction; u ˙ y m : node velocity in y-direction; u ˙ x f f : node velocity of the free field column in x-direction; u ˙ y f f : node velocity of the free field column in the y-direction.

5.2. Input Motion Used for the Numerical Analysis

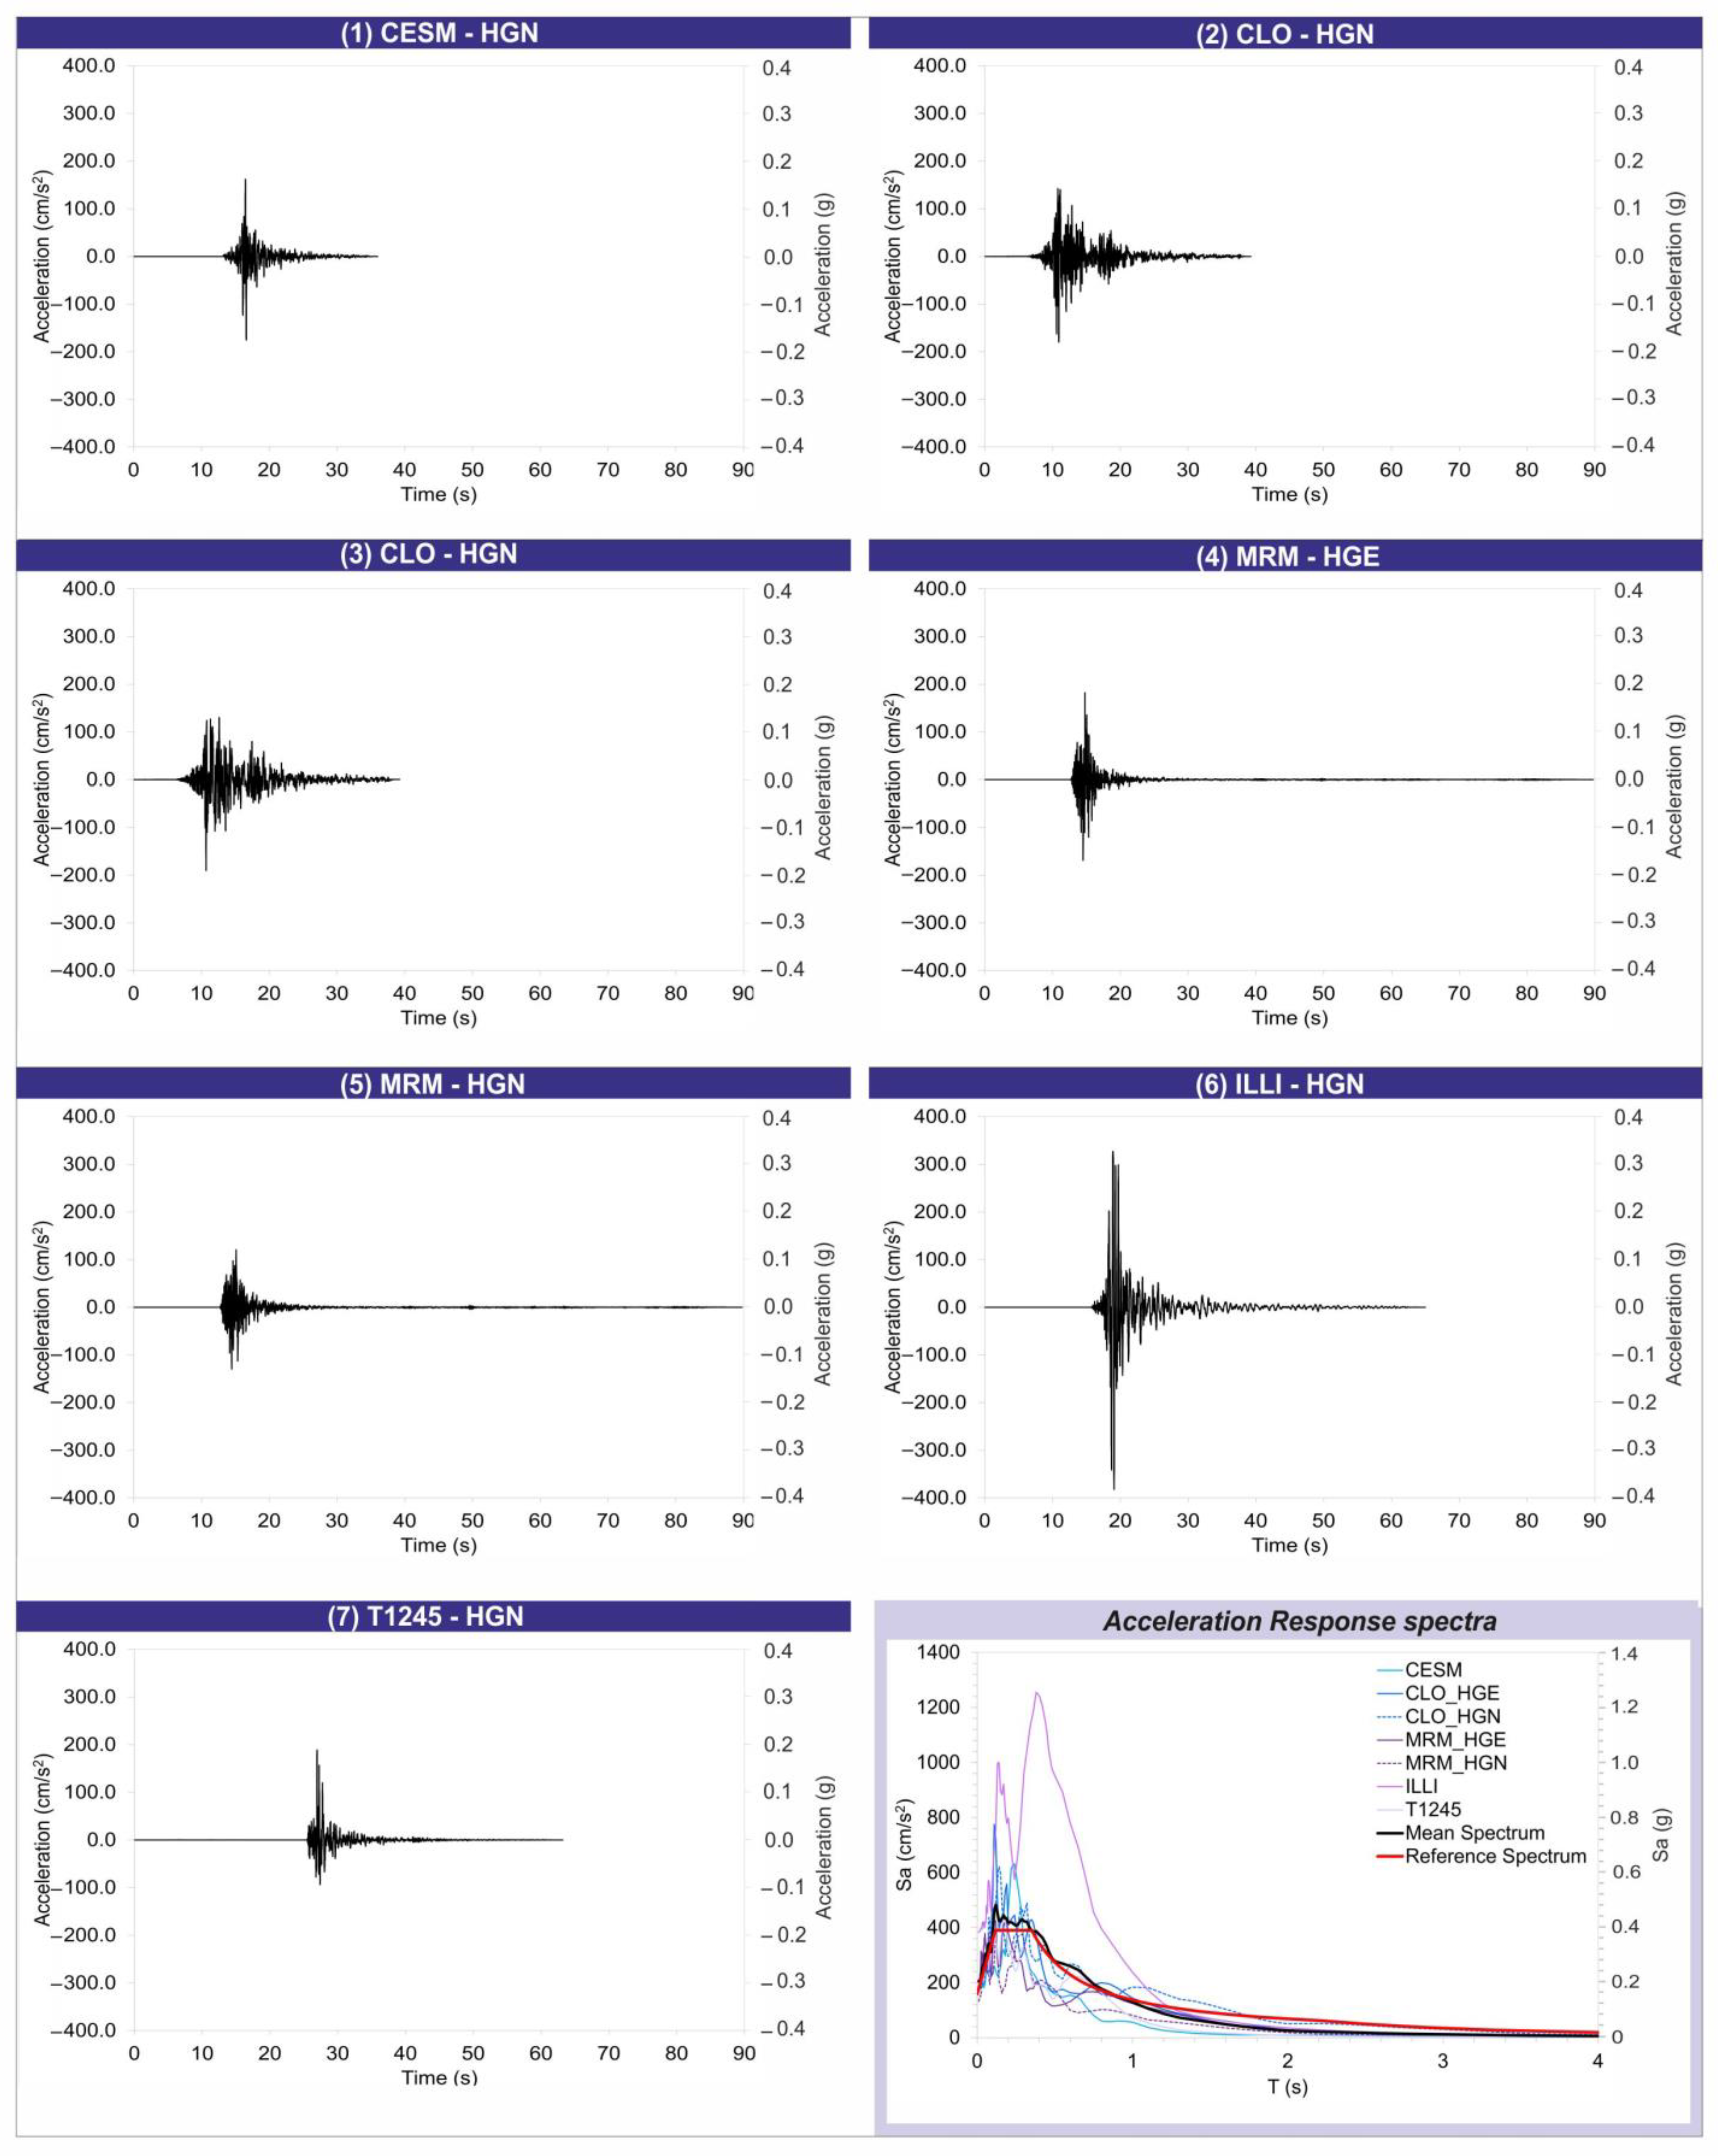
The input motion used for the numerical simulation consists of seven accelerograms selected by the web application REXELweb, which allows searching for combinations of seven strong motion records, compatible on average with a specified code spectrum [60], from the Italian Accelerometric Archive (ITACA) available online at http://itaca.mi.ingv.it/ItacaNet_32/#/rexel (accessed on 8 November 2024)
These acceleration time-histories were selected based on the disaggregated values of magnitude (Mw) and epicenter distance (R) pair for Chieti’s site: Mw = 5.29 and R = 12 km for a return period of 475 years and with the expected peak ground acceleration on flat stiff soil of 0.162 g according to the MPS04 map (Italian seismic reference hazard map) [61].
In Figure 11, the seven acceleration time histories used for numerical simulation are reported. Table 3 shows the seven events related to the selected recorder accelerograms.
No scenario input motions were considered in this study, due to the lack of records of the 2009 Earthquake at Chieti’s city center.

5.3. Two-Dimensional Numerical Model: Mesh and Subsoil Properties Assigned

The numerical model used in the LSR simulations is reported in Figure 12.
The inset shows a zoom of the optimized mesh used. The element size was defined according to Equation (8). The cavity lining was characterized by a 1 m element with the shear wave velocity Vs equal to 1000m/s and the linear elastic behavior. This material represents the properties of the bricks used for the lining. All the seismic–litho-technical characteristics of the subsurface model are shown in Table 4.
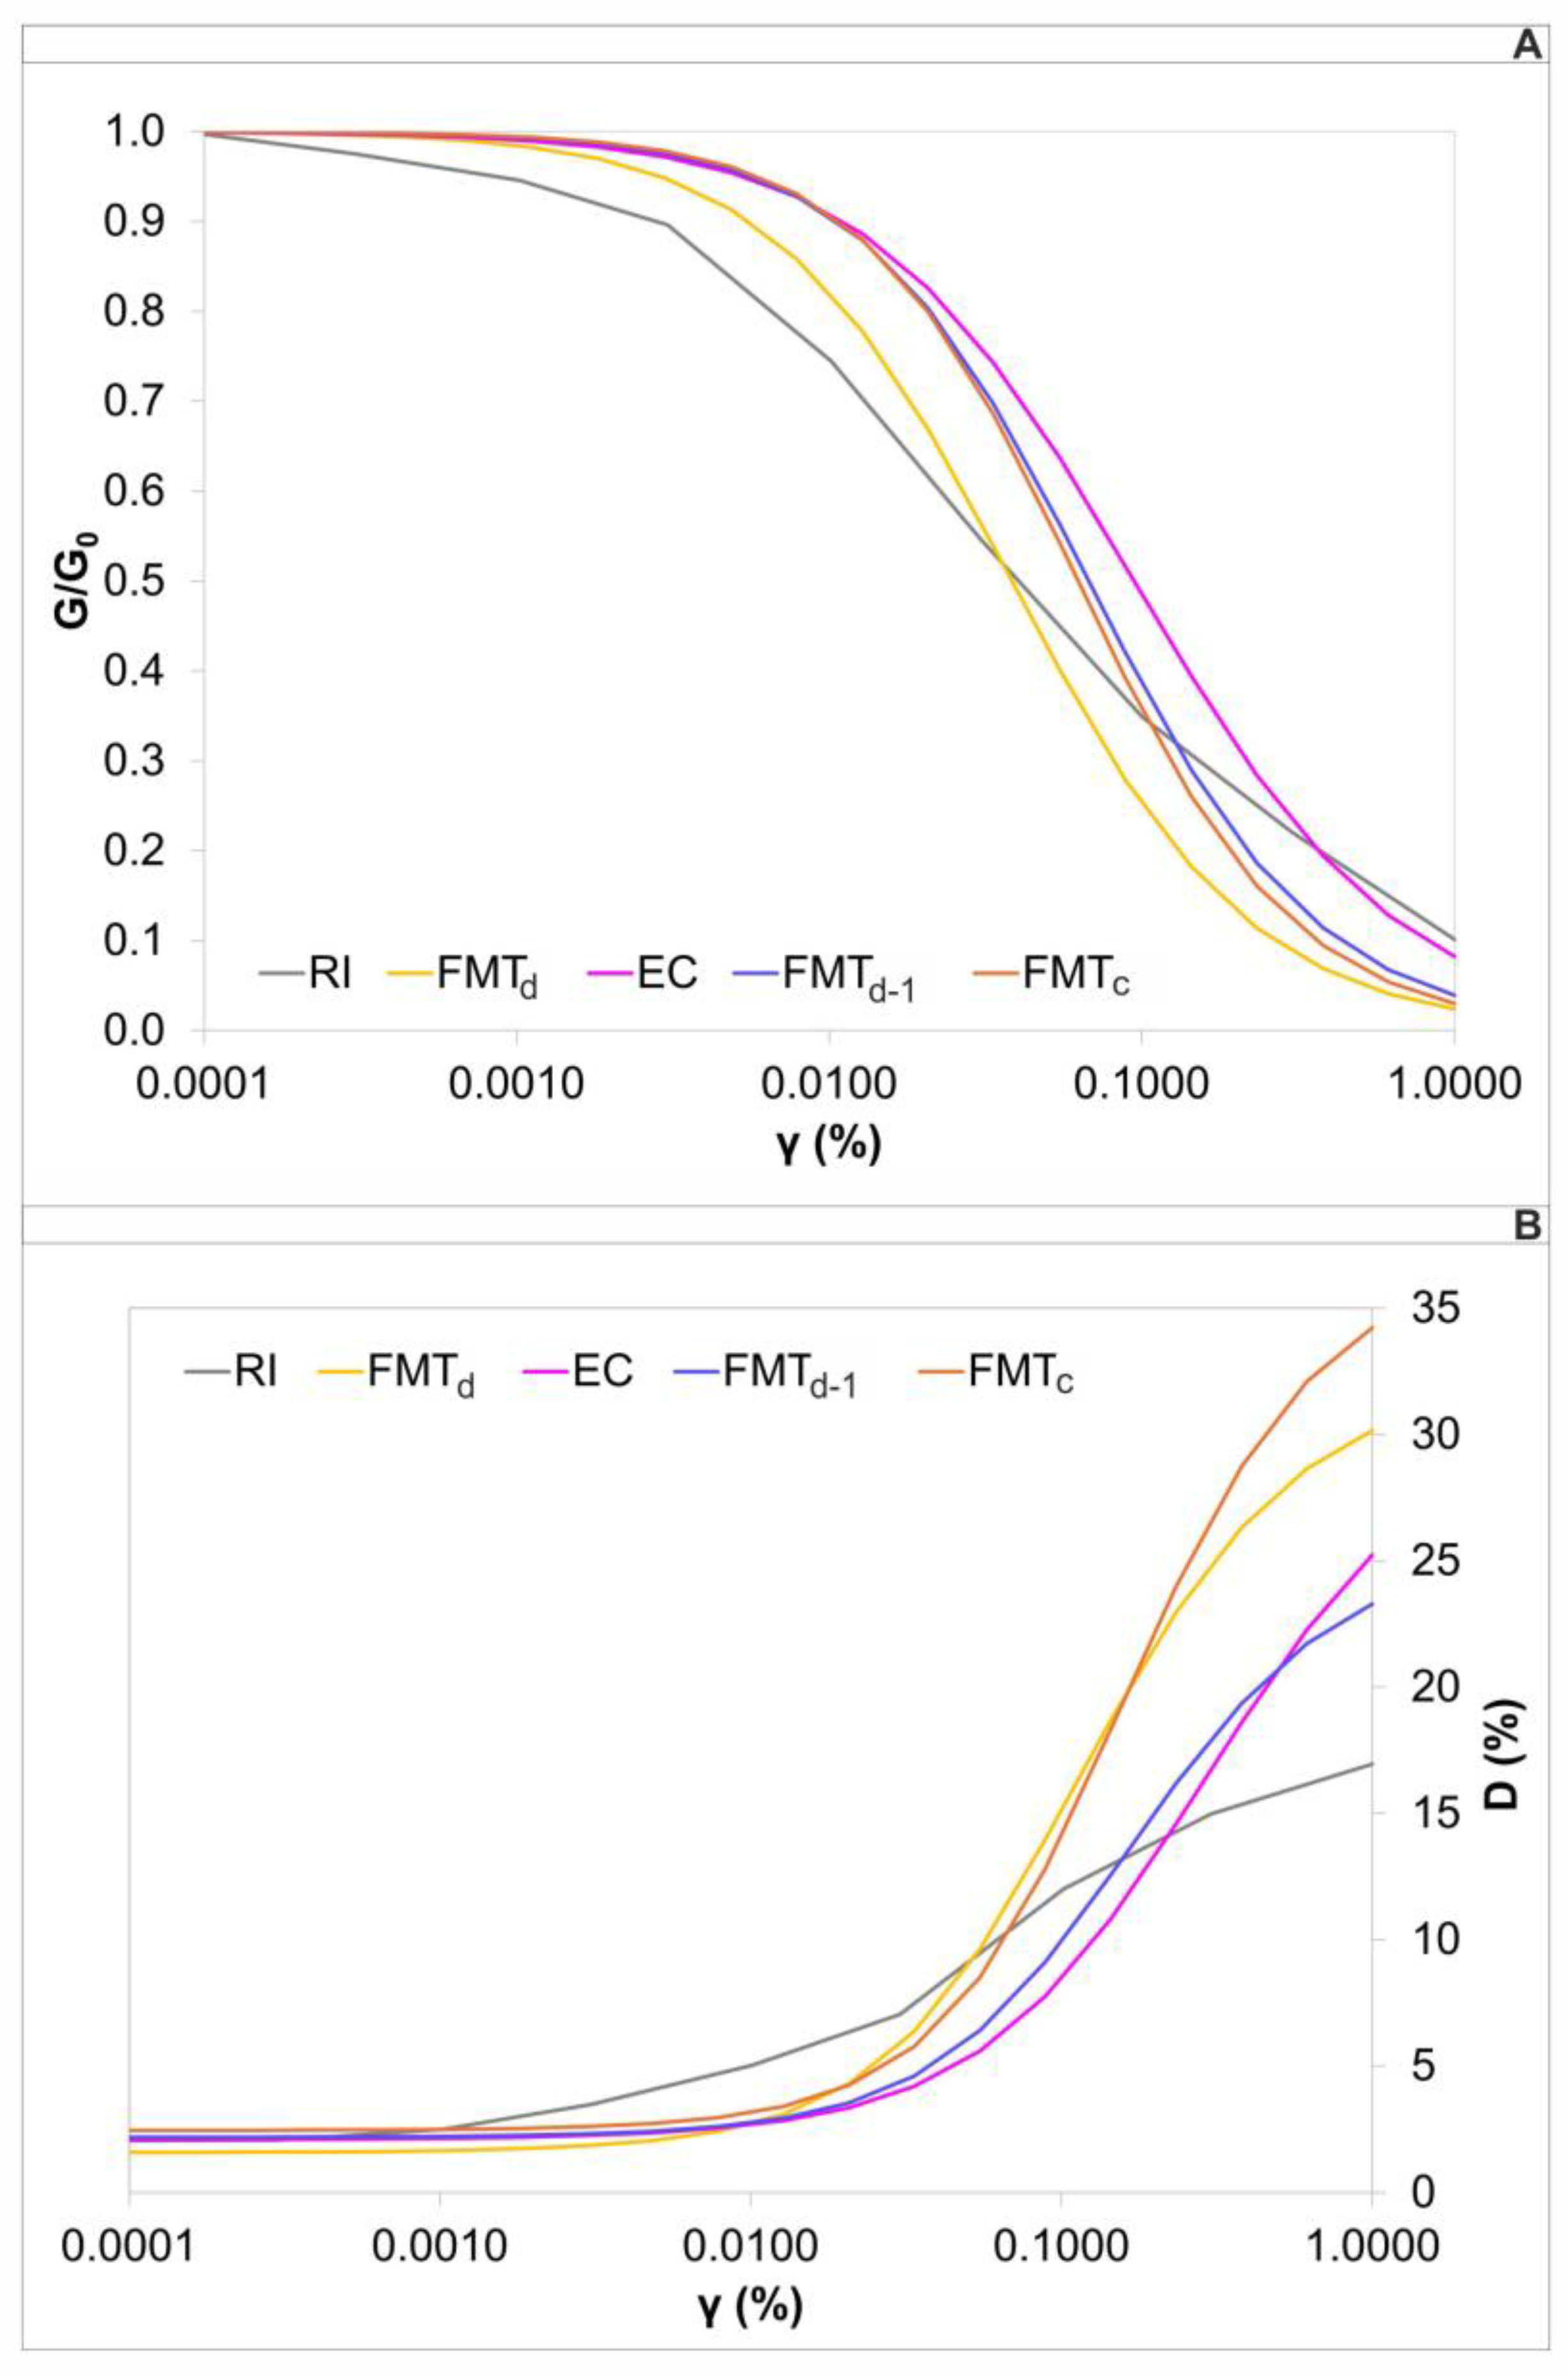
Numerical models of the seismic site response using the equivalent linear technique require characterization of the non-linear behavior of soils. The shear modulus reduction curve G/G0 (γ) and the damping ratio curve D0 (γ) are used in the non-linear formulation of AlgoShake2D elements to account for hysteretic soil behavior. The curves used in this study were chosen among 485 curve pairs by [63] collected from a variety of Italian literature sources, such as published materials, online databases, and Seismic Microzonation Studies (SM) (database available at: https://doi.org/10.5281/zenodo.8134979). The curves were measured on soil samples from the central Italian regions of Emilia Romagna, Toscana, Lazio, Umbria, Marche, Molise, and Abruzzi. Each curve pair (G/G0 (γ), D0 (γ)) corresponds to an engineering geological unit (eg-units) [59].
In this study, we chose the equivalent linear curves from [63] for lithotypes EC, FMTd, FMTd-1, FMTc. For the anthropogenic soil (RI), however, we adopted the site-specific curve published by [64]. All the curves used are shown in Figure 13.
For FMTa (I) and FMTa (II) lithotypes we selected a viscous–elastic behavior characterized by a constant damping factor of 1.7% and 1.0%, respectively.

6. Results

The results drawn from the 2D LSR simulations are illustrated and discussed through the following:
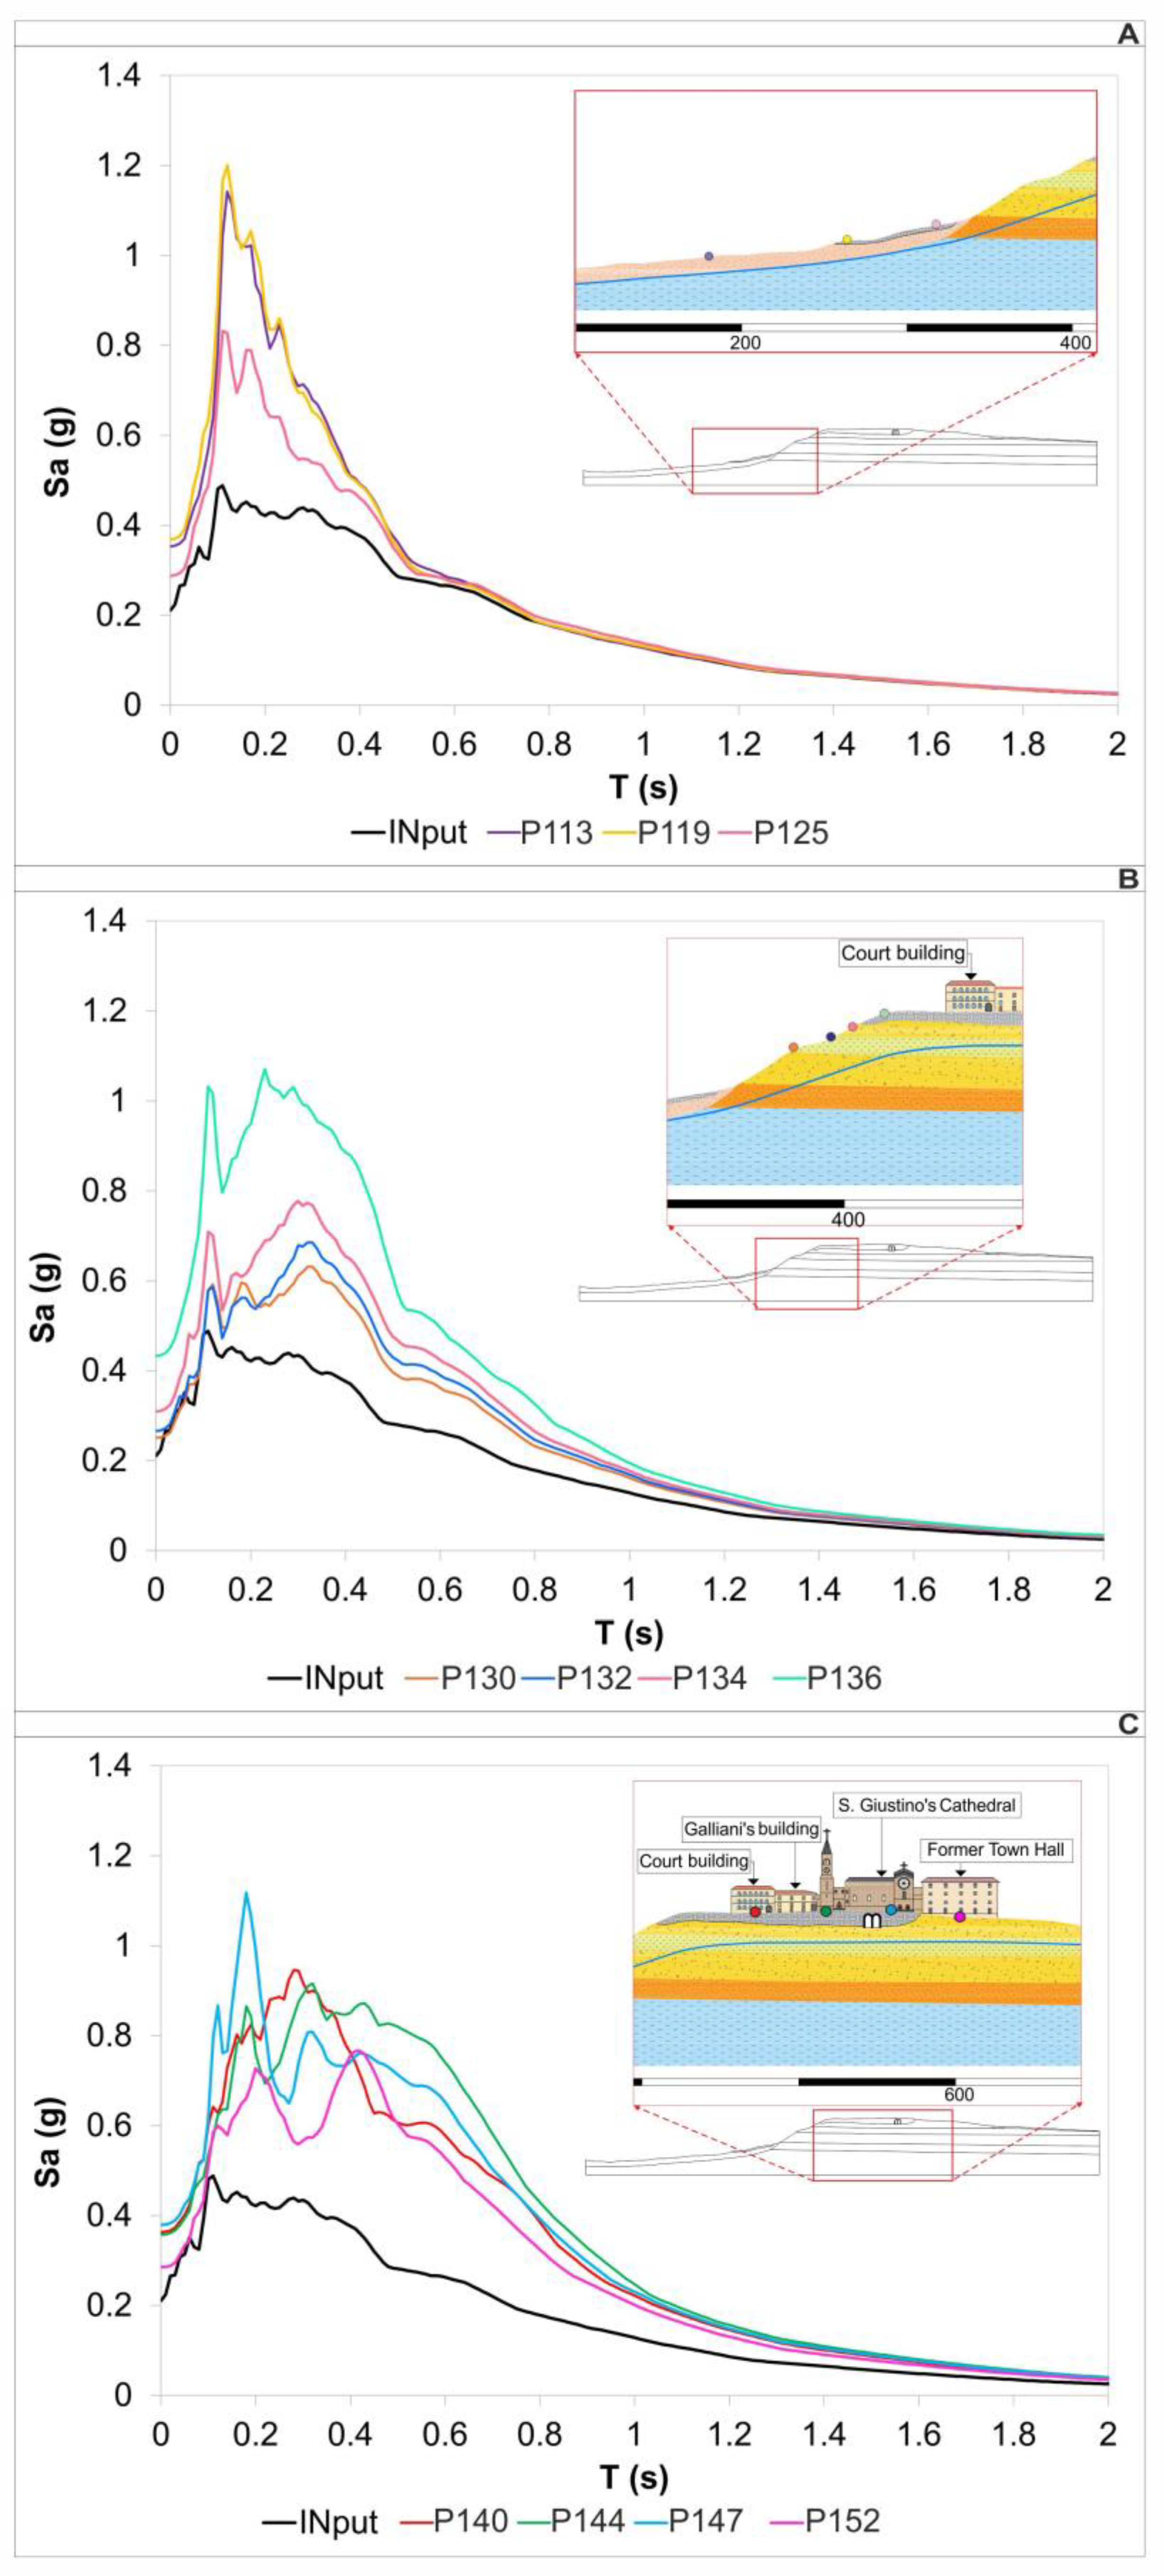
  • The mean Acceleration Response Spectra (SA) calculated on the surface at each selected point (Figure 14) as a result of the average spectrum of the seven input signals;
  • The FA according to Equation (9).
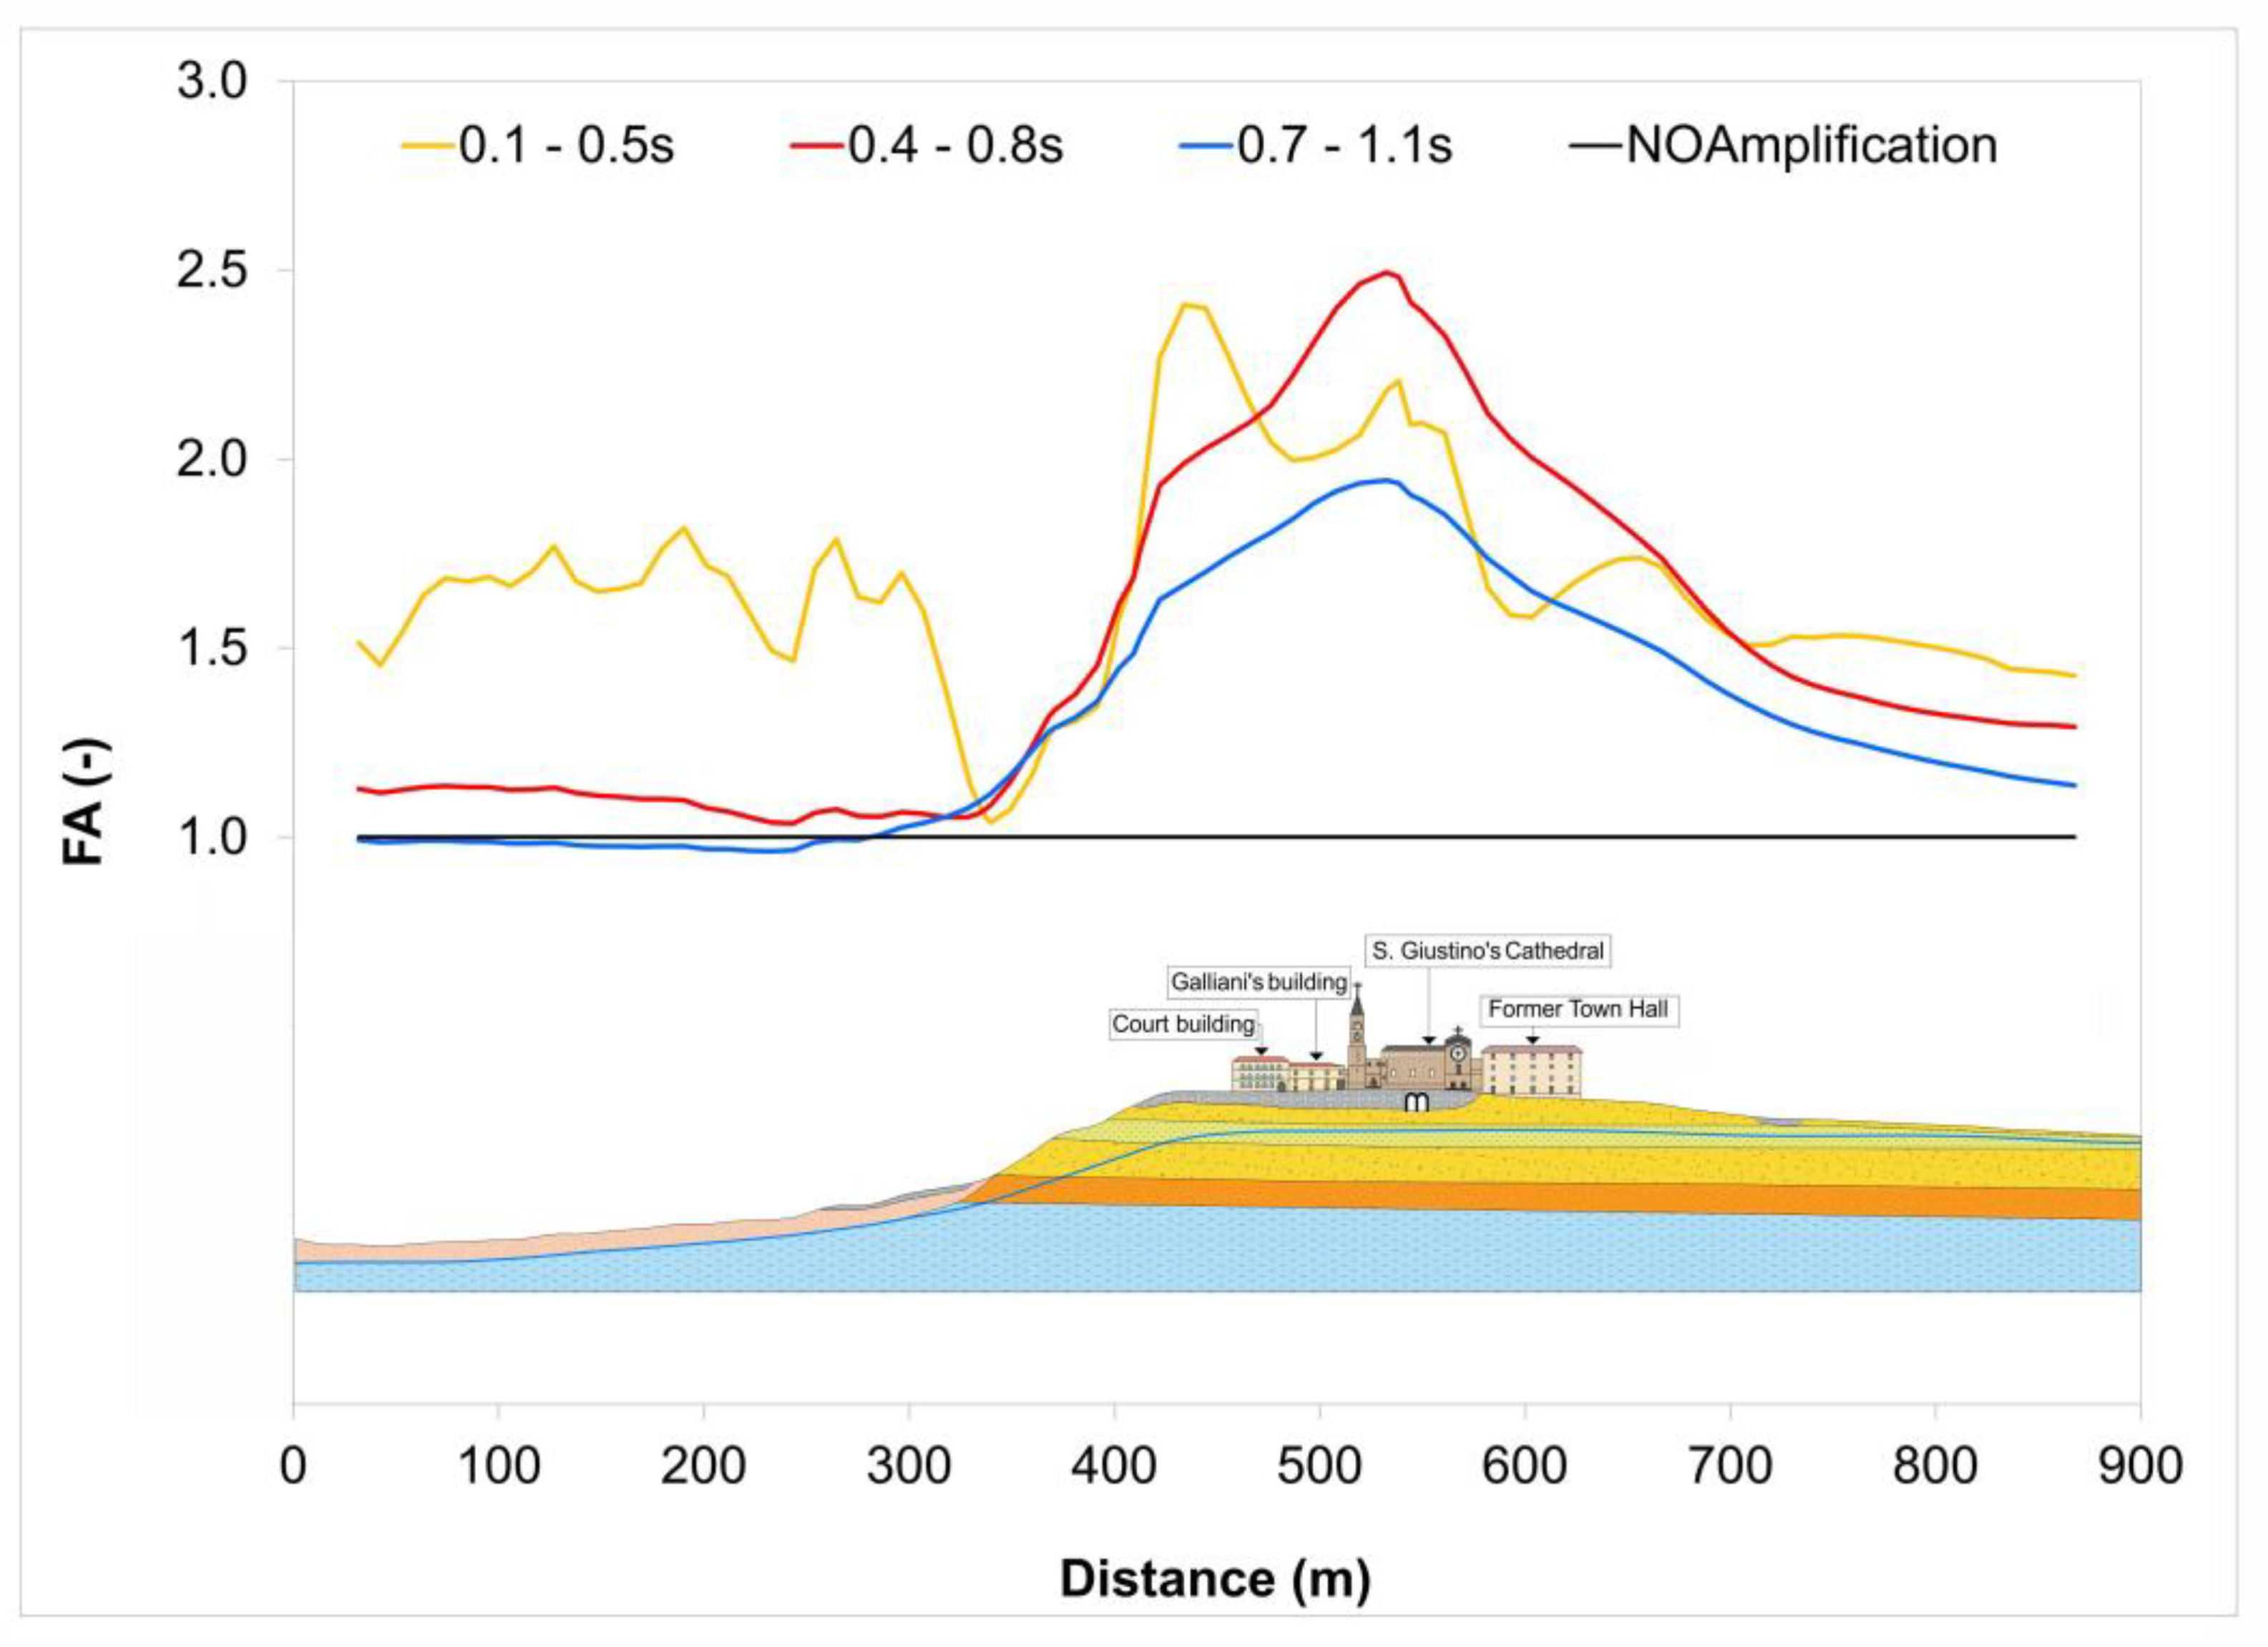
Three Amplification Factors were calculated in three different period ranges, that are 0.1–0.5 s; 0.4–0.8 s; 0.7–1.1 s (Figure 15).
The Acceleration Spectra (Figure 14A,B) reach their peak values along the slope, where anthropogenic and eluvial-colluvial deposits outcrop. The stratigraphic amplification is evident in Figure 14A, where the spectral acceleration peaks at P113 and P119 reach 1.2, whereas at P125, the peak reaches 0.8 g. This lower peak is due to the vicinity of stiffer strata. At the slope toe, the eluvial–colluvial deposits show higher thicknesses than alongside the slope. Atop, the anthropogenic deposits of about 10 m thickness outcrop throughout San Giustino’s Square. As Figure 14C shows, the softness of these deposits reduces the amplitude of the acceleration spectra but increases the amplified period range, which is 0.15–0.8 s. In the Square, the anthropogenic deposits show variable thickness and the presence of two large cavities in front of the Cathedral contributes to the variable response as shown in Figure 14C. Comparing the acceleration response spectra in blue and green (Figure 14C), it can be noted that the amplitude of the amplified band on the right side of the cavities (light blue curve, periods 0.1–0.25 s) is larger than that under the San Giustino building (green curve, periods 0.2–0.6 s). Thus, the highest amplification on the cavities’ side is concentrated in a narrower range of periods than the amplifications shown under San Giustino’s cathedral: at these two locations the soft deposits have the same thickness. Hence, the noted shift in most amplified ranges can be attributed to the cavities.
For instance, at point P140, where the Court building is located, the acceleration spectrum peak is at 0.2 s with 1.15 g and at 0.3 s with a 0.8 g spectral acceleration. It implies that the damage suffered by this building could be due to the resonance between the building’s fundamental period (Tf) and the ground amplified periods. Considering Equations (1)–(3), respectively, we can estimate the following values for the Court building with H = 21 m [46]: 0.36 s, 0.50 s and 0.40 s.
Looking at Figure 15, the trend of the FA changes passing from the slope to the crest: alongside the slope, the highest FA (about 1.8) is related to the period range 0.1–0.5 s while, in San Giustino’s Square, the highest values of FA (2.5) fall in the range 0.4–0.8 s at San Giustino’s cathedral and in the range 0.1–0.5 g at the Court building. This evidence confirms a differentiated possible damage based on different period range of amplification along the Square. Furthermore, the reason for minor damage suffered by the Cathedral and the Former Town Hall could be related to the complex geometry both in-plane and in section and longer fundamental periods than 0.8 s for both buildings. However, the possible 3D seismic shaking response of both structures could have prevented them from large damage. It cannot be caught by a 2D numerical simulation, and it is beyond the scope of this study.
Conversely, the FA values confirm the contribution of the local seismic amplification to the damages suffered by the Court building: the highest amplification factor at P140 (FA = 2.4) shows an amplified period range from 0.1 to 0.5 s but even FA =2.0 within 0.4–0.8 s. In this large range of periods, the estimated fundamental period values of the building fall, which are 0.36–0.50 s; these values correspond to the periods of the spectral acceleration peaks at P140, as shown in Figure 14C.
Finally, the contribution of the cavity named “Cisternone” was considered on the spectral acceleration values at some points near the Former Town Hall and San Giustino’s Cathedral.
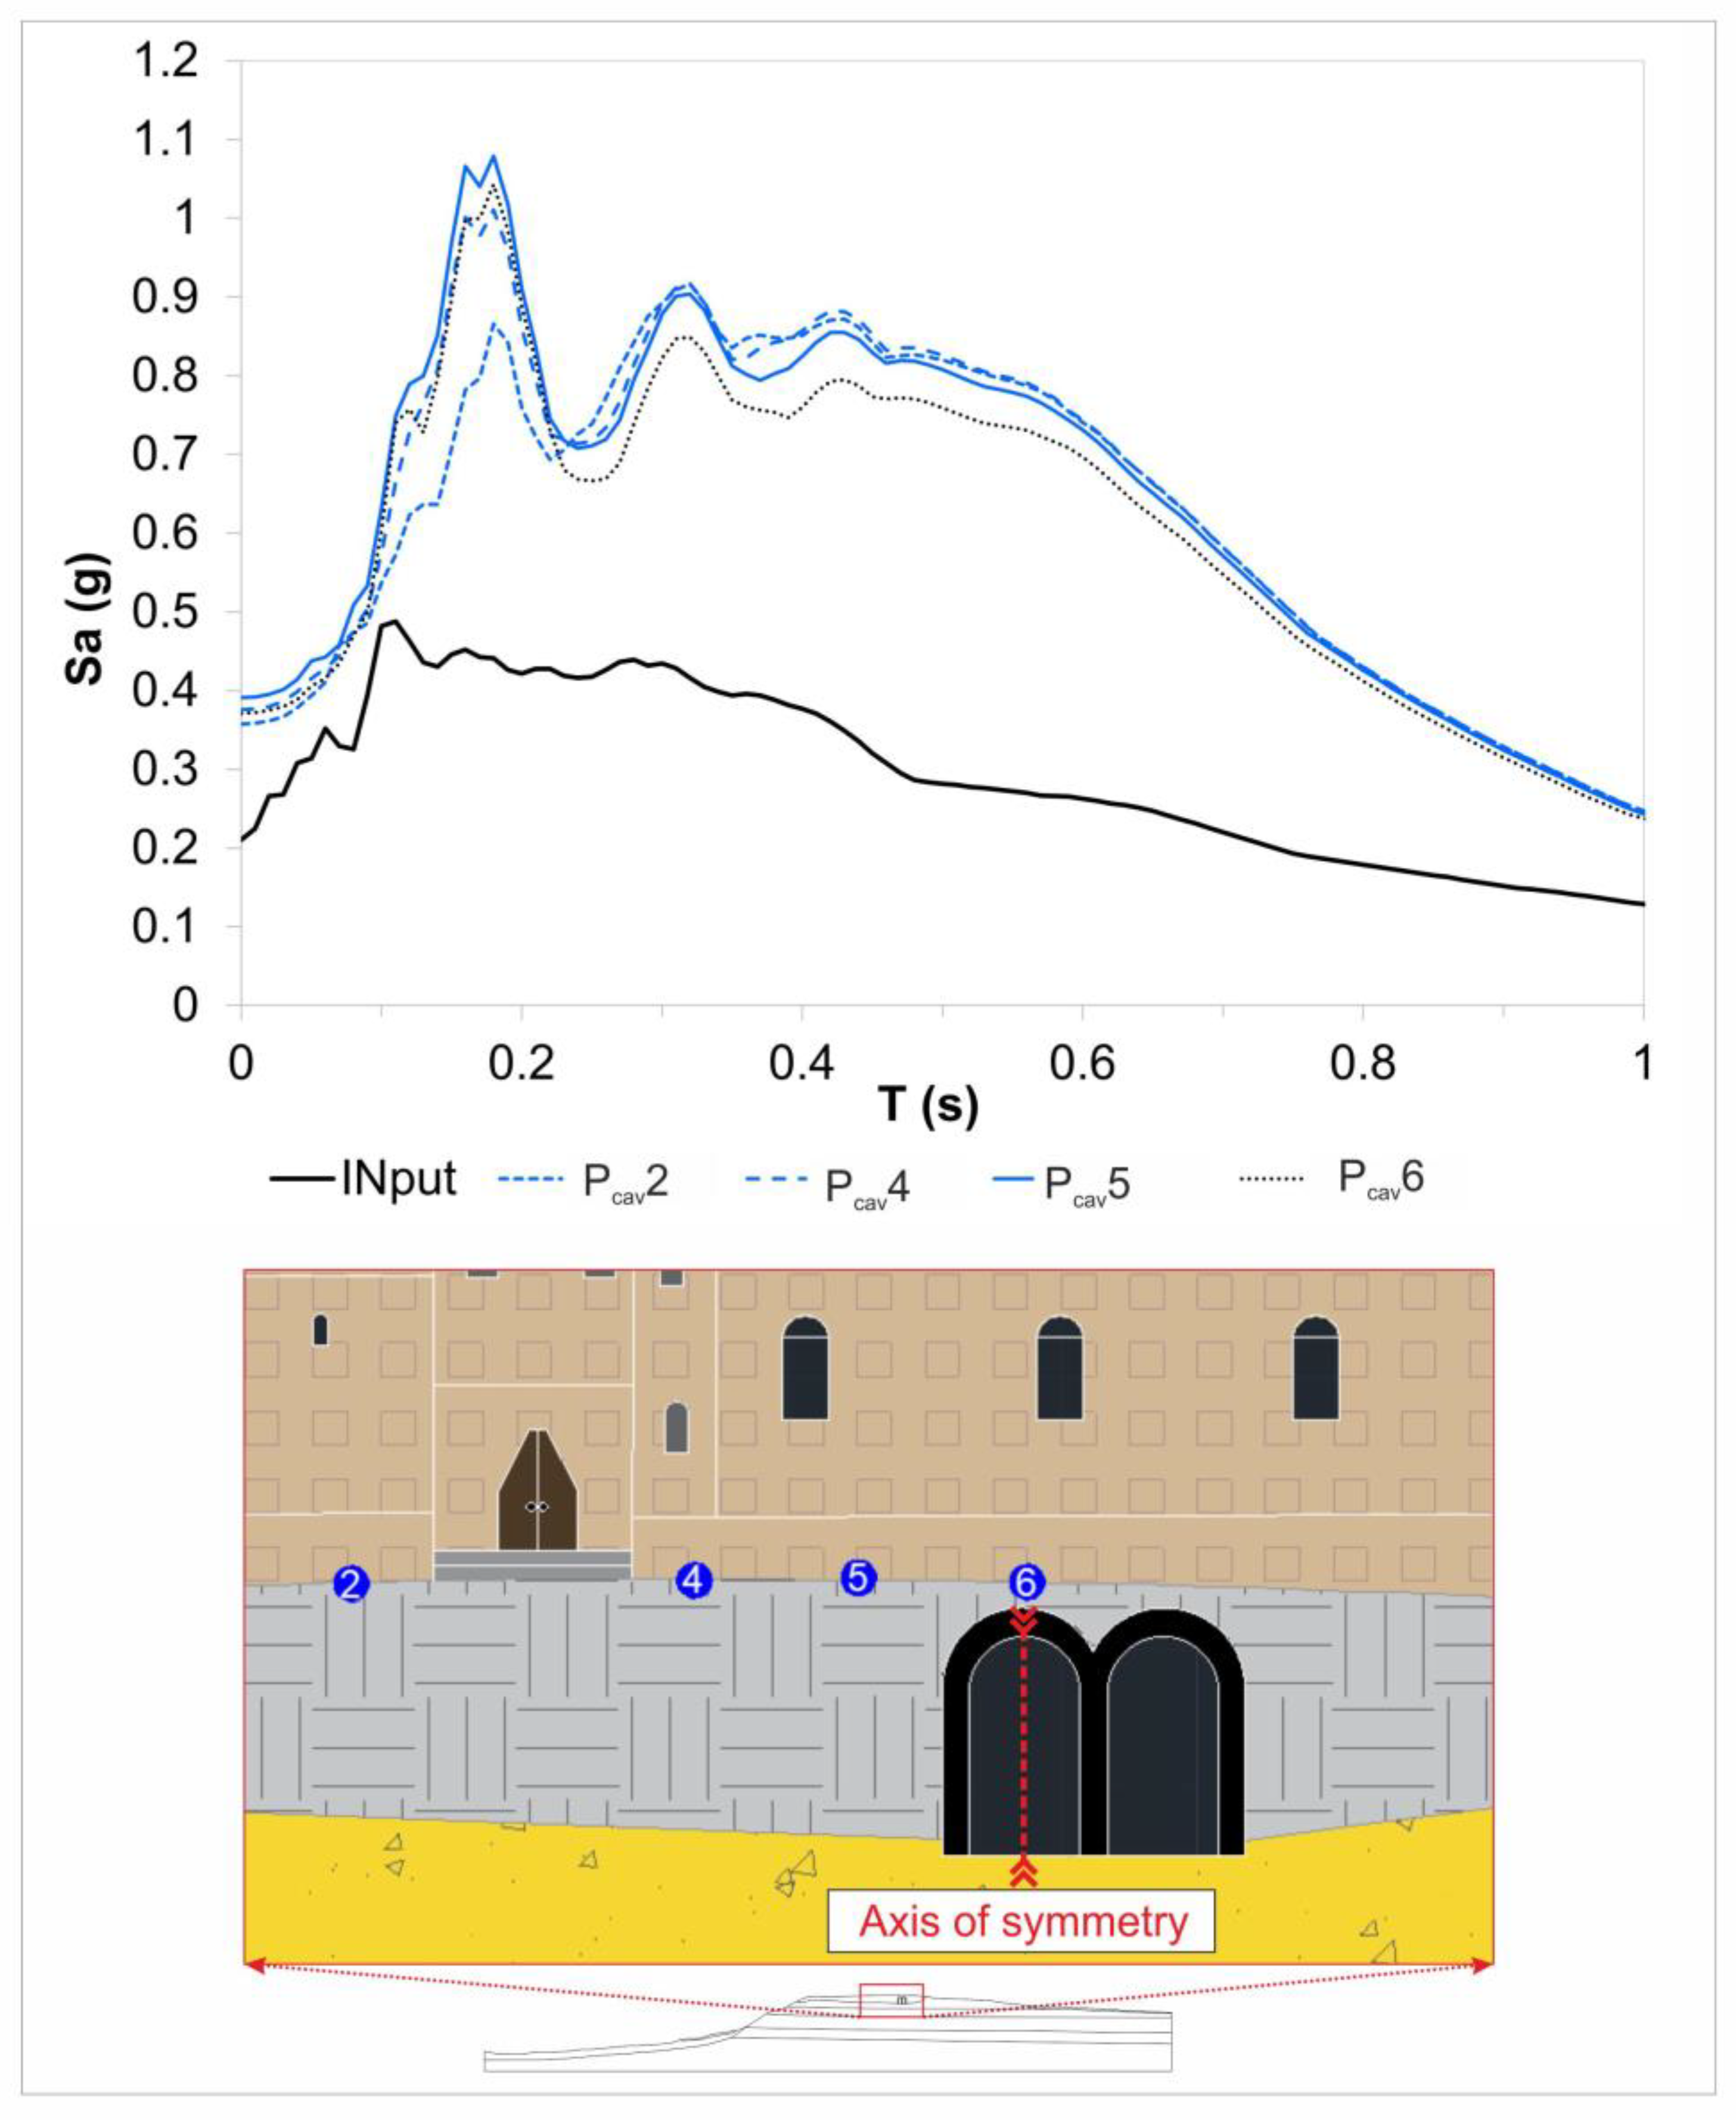
In detail, four points located at increasing distances from the axis of symmetry of the cavity were examined (Figure 16).
Describing the contribution of a cavity on local seismic response means considering the cavity’s shape, size, and depth from the free surface. As a matter of fact, the geometric characteristics (height and width) affect the amplification and the distance of the maximum value from the cavity axis [4].
Cisternone’s cavity is 8 m in height (H), and it is divided into two parts by a column (1 m width), each of 4 m width.
In this study, the maximum spectral acceleration (1.1 g) was found at a distance of 6 m (Pcav5) from the cavity axis (Figure 16). This is confirmed by the parametric study by [4] carried out in Chieti’s center: the maximum amplification is moved away from the cavity axis of 1.5 L, where L is the cavity width. The deamplification induced by the cavity above its axis (control point Pcav6) is evident compared to the acceleration spectrum calculated at Pcav5, as shown by the decrease in spectral acceleration values.
The previous behavior can be observed symmetrically on both sides of the cavity axis. The influence of the cavity on the LSR recorded on the surface can be found up to 25 m distance from its axis [4]. Despite the amplification values, the gradual decrease in spectral accelerations did not play a role in the damage shown by the Court Building and the Former Town Hall, as these are located at distances of 50 and 30 m, respectively, from the Cisternone axis.

7. Conclusions

This study investigated the role of the differentiated local seismic effects on the damage suffered by historical buildings, such as the Court Building of Chieti (CH). The 2D LSR numerical simulations enabled us to point out:
(1)
The Justice Court suffered an amplification of FA equal to 2.4 in the period range 0.1–0.5 s. The spectral acceleration amplified periods correspond to the range of estimated fundamental periods 0.36–0.5 s.
(2)
The presence of a shallow cavity (L = 11 m and H = 8 m) moves away from its axis, the most amplified area at a distance equal to 1.5 L. Nonetheless, the nearby buildings of the Cathedral and the Former Town Hall were not affected by this amplification.
(3)
The LSR results indicated that the soft anthropogenic layer of roughly 10 m is the most significant contributor to the high FA across San Giustino’s Square, even though Chieti’s Hillcrest, close to the Justice Court, contributed to amplify the period range 0.1–0.5 s within which the fundamental periods of the Justice Court building fall.
The role of topographic amplification at San Giustino square, which is characterized by amplification in the low-period range (0.1–0.5 s), is thus confirmed by 2D numerical simulations. In contrast, the seismic amplification observed on the square is primarily due to stratigraphic amplification. This phenomenon has led to zones of differentiated amplification within the square. However, the buried cavities influence the amplitude and the corresponding period range only in localized areas near them.
Furthermore, LSR simulations can provide useful information on possible differentiated amplifications and double-resonance phenomena suffered by buildings during seismic shaking. For structures with regular geometry both in-plane and section, the fundamental period of vibration can be estimated through expressions suggested in the literature, instead for irregular buildings, their 3D vibration modes must be measured or calculated through rigorous methods.

Author Contributions

Conceptualization, C.F. and G.V.; methodology, C.F., F.C. and G.V.; software, C.F.; validation, C.F. and G.V.; formal analysis, C.F.; investigation, C.F. and F.C.; resources, C.F. and F.C.; data curation, C.F. and F.C.; writing—original draft preparation, C.F.; writing—review and editing, C.F. and G.V.; visualization, C.F.; supervision, G.V.; project administration, G.V. All authors have read and agreed to the published version of the manuscript.

Funding

This research received no external funding.

Data Availability Statement

The original contributions presented in this study are included in the article. Further inquiries can be directed to the corresponding author.

Acknowledgments

The authors are grateful to the Speleological Association “SpeleoClub Chieti” and to the Superintendence of Archaeology, Fine Arts and Landscape (SABAP) of Chieti for the photographic material and geometric features of the cavities located under Chieti’s old city. The authors are also grateful to Pizzi A. for the geological details provided on the study area.

Conflicts of Interest

The authors declare no conflicts of interest.

References

  1. Vessia, G.; Rainone, M.L.; De Santis, A.; D’Elia, G. Lessons from April 6, 2009 L’Aquila Earthquake to Enhance Microzoning Studies in near-Field Urban Areas. Geoenviron. Disasters 2020, 7, 11. [Google Scholar] [CrossRef]
  2. Vessia, G.; Laurenzano, G.; Pagliaroli, A.; Pilz, M. Seismic Site Response Estimation for Microzonation Studies Promoting the Resilience of Urban Centers. Eng. Geol. 2021, 284, 106031. [Google Scholar] [CrossRef]
  3. Primofiore, I.; Baron, J.; Klin, P.; Laurenzano, G.; Muraro, C.; Capotorti, F.; Amanti, M.; Vessia, G. 3D Numerical Modelling for Interpreting Topographic Effects in Rocky Hills for Seismic Microzonation: The Case Study of Arquata Del Tronto Hamlet. Eng. Geol. 2020, 279, 105868. [Google Scholar] [CrossRef]
  4. Faraone, C.; Colantonio, F.; Vessia, G. Seismic Amplification Effects Induced by Ancient Shallow Cavities underneath the Urban Area of the Historical City Center of Chieti, Italy. Eng. Geol. 2023, 324, 107259. [Google Scholar] [CrossRef]
  5. Solakov, D.E.; Stefanov, D.; Simeonova, S.; Raykova-Tsankova, P. Seismic Risk Assessment for the City of Sofia, Bulgaria. Geosciences 2024, 14, 307. [Google Scholar] [CrossRef]
  6. Hakimov, F.; Havenith, H.-B.; Ischuk, A.; Reicherter, K. Assessment of Site Effects and Numerical Modeling of Seismic Ground Motion to Support Seismic Microzonation of Dushanbe City, Tajikistan. Geosciences 2024, 14, 117. [Google Scholar] [CrossRef]
  7. Amato, V.; Covolan, M.; Dessales, H.; Santoriello, A. Seismic Microzonation of the Pompeii Archaeological Park (Southern Italy): Local Seismic Amplification Factors. Geosciences 2022, 12, 275. [Google Scholar] [CrossRef]
  8. Graziani, L.; del Mese, S.; Tertulliani, A.; Arcoraci, L.; Maramai, A.; Rossi, A. Investigation on Damage Progression during the 2016–2017 Seismic Sequence in Central Italy Using the European Macroseismic Scale (EMS-98). Bull. Earthq. Eng. 2019, 17, 5535–5558. [Google Scholar] [CrossRef]
  9. Chávez-García, F.J.; Monsalve Jaramillo, H.; Gómez Cano, M.; Vila Ortega, J.J. Vulnerability and Site Effects in Earthquake Disasters in Armenia (Colombia). I—Site Effects. Geosciences 2018, 8, 254. [Google Scholar] [CrossRef]
  10. Panzera, F.; Lombardo, G.; Imposa, S.; Grassi, S.; Gresta, S.; Catalano, S.; Romagnoli, G.; Tortorici, G.; Patti, F.; Di Maio, E. Correlation between Earthquake Damage and Seismic Site Effects: The Study Case of Lentini and Carlentini, Italy. Eng. Geol. 2018, 240, 149–162. [Google Scholar] [CrossRef]
  11. Rainieri, C.; Fabbrocino, G. Estimating the Elastic Period of Masonry Towers. In Topics in Modal Analysis I, Volume 5: Proceedings of the 30th IMAC, A Conference on Structural Dynamics, 2012; Allemang, R., De Clerck, J., Niezrecki, C., Blough, J.R., Eds.; Springer: New York, NY, USA, 2012; pp. 243–248. [Google Scholar]
  12. D.M. 14/01/2008; Norme Tecniche per le Costruzioni (NTC08). Superior Council of Public Works, C.S. Official Gazette: Rome, Italy, 2008. (In Italian)
  13. Faccio, P.; Podestà, S.; Saetta, A. Venezia, Campanile Della Chiesa Di Sant’Antonin, Esempio 5, in Linee Guida per La Valutazione e Riduzione Del Rischio Sismico Del Patrimonio Culturale Allineate Alle Nuove Norme Tecniche per Le Costruzioni (D.M. 14/01/2008). Circolare 2011, 26, 2010. (In Italian) [Google Scholar]
  14. Doğangün, A.; Sezen, H. Seismic Vulnerability and Preservation of Historical Masonry Monumental Structures. Earthq. Struct. 2012, 3, 83–95. [Google Scholar] [CrossRef]
  15. Fayjaloun, R.; Negulescu, C.; Roullé, A.; Auclair, S.; Gehl, P.; Faravelli, M. Sensitivity of Earthquake Damage Estimation to the Input Data (Soil Characterization Maps and Building Exposure): Case Study in the Luchon Valley, France. Geosciences 2021, 11, 249. [Google Scholar] [CrossRef]
  16. Vessia, G.; Russo, S. Relevant Features of the Valley Seismic Response: The Case Study of Tuscan Northern Apennine Sector. Bull. Earthq. Eng. 2013, 11, 1633–1660. [Google Scholar] [CrossRef]
  17. Boncio, P.; Amoroso, S.; Vessia, G.; Francescone, M.; Nardone, M.; Monaco, P.; Famiani, D.; Di Naccio, D.; Mercuri, A.; Manuel, M.R.; et al. Evaluation of Liquefaction Potential in an Intermountain Quaternary Lacustrine Basin (Fucino Basin, Central Italy). Bull. Earthq. Eng. 2018, 16, 91–111. [Google Scholar] [CrossRef]
  18. Faraone, C.; Caravaggio, S.; Chávez, J.A.; Castillo Ramos, L.A.; Rainone, M.L.; Vessia, G. 2D FEM Numerical Prediction of Local Seismic Effects at San Salvador Municipality (El Salvador) Induced by 2001 Earthquakes. Geosciences 2023, 13, 116. [Google Scholar] [CrossRef]
  19. Evangelista, L.; Landolfi, L.; d’Onofrio, A.; Silvestri, F. The Influence of the 3D Morphology and Cavity Network on the Seismic Response of Castelnuovo Hill to the 2009 Abruzzo Earthquake. Bull. Earthq. Eng. 2016, 14, 3363–3387. [Google Scholar] [CrossRef]
  20. Zhang, Z.; Fleurisson, J.-A.; Pellet, F.L. A Case Study of Site Effects on Seismic Ground Motions at Xishan Park Ridge in Zigong, Sichuan, China. Eng. Geol. 2018, 243, 308–319. [Google Scholar] [CrossRef]
  21. Moczo, P.; Kristek, J.; Bard, P.-Y.; Stripajová, S.; Hollender, F.; Chovanová, Z.; Kristeková, M.; Sicilia, D. Key Structural Parameters Affecting Earthquake Ground Motion in 2D and 3D Sedimentary Structures. Bull. Earthq. Eng. 2018, 16, 2421–2450. [Google Scholar] [CrossRef]
  22. Ge, Z. Simulation of the Seismic Response of Sedimentary Basins with Constant-Gradient Velocity along Arbitrary Direction Using Boundary Element Method: SH Case. Earthq. Sci. 2010, 23, 149–155. [Google Scholar] [CrossRef]
  23. Semblat, J.F.; Duval, A.M.; Dangla, P. Seismic Site Effects in a Deep Alluvial Basin: Numerical Analysis by the Boundary Element Method. Comput. Geotech. 2002, 29, 573–585. [Google Scholar] [CrossRef]
  24. Álvarez-Rubio, S.; Benito, J.J.; Sánchez-Sesma, F.J.; Alarcón, E. The Use of Direct Boundary Element Method for Gaining Insight into Complex Seismic Site Response. Comput. Struct. 2005, 83, 821–835. [Google Scholar] [CrossRef]
  25. Chen, Z.; Huang, D.; Wang, G. A Regional Scale Coseismic Landslide Analysis Framework: Integrating Physics-Based Simulation with Flexible Sliding Analysis. Eng. Geol. 2023, 315, 107040. [Google Scholar] [CrossRef]
  26. Smerzini, C.; Vanini, M.; Paolucci, R.; Renault, P.; Traversa, P. Regional Physics-Based Simulation of Ground Motion within the Rhȏne Valley, France, during the MW 4.9 2019 Le Teil Earthquake. Bull. Earthq. Eng. 2023, 21, 1747–1774. [Google Scholar] [CrossRef]
  27. Ricci, A.; Romanelli, F.; Vaccari, F.; Boncio, P.; Venisti, N.; Faraone, C.; Vessia, G.; Panza, G.F. Comparison between the Neo-Deterministic Seismic Hazard and FEM Approach to Assessing 2D Local Seismic Response at Chieti’s City Site (Abruzzo, Italy). Eng. Geol. 2025, 347, 107891. [Google Scholar] [CrossRef]
  28. Gatmiri, B.; Arson, C.; Nguyen, K.V. Seismic Site Effects by an Optimized 2D BE/FE Method I. Theory, Numerical Optimization and Application to Topographical Irregularities. Soil Dyn. Earthq. Eng. 2008, 28, 632–645. [Google Scholar] [CrossRef]
  29. Brando, G.; Pagliaroli, A.; Cocco, G.; Di Buccio, F. Site Effects and Damage Scenarios: The Case Study of Two Historic Centers Following the 2016 Central Italy Earthquake. Eng. Geol. 2020, 272, 105647. [Google Scholar] [CrossRef]
  30. Grünthal, G. European Macroseismic Scale 1998—EMS98; Cahiers Du Centre Européen de Géodynamique et de Séismologie 15; Centre Européen de Géodynamique et de Séismologie: Luxembourg, 1998. [Google Scholar]
  31. Mancini, F.; D’Amico, S.; Vessia, G. Are Synthetic Accelerograms Suitable for Local Seismic Response Analyses at Near-Field Sites? Bull. Seismol. Soc. Am. 2021, 112, 992–1007. [Google Scholar] [CrossRef]
  32. Mancini, F. Definizione di Input Sintetici Nello Studio di Risposta Sismica Locale del Comune di Cortino (TE). Master’s Thesis, Università degli Studi Gabriele d’Annunzio, Chieti, Italy, 2018. [Google Scholar]
  33. Chieffo, N.; Formisano, A. Induced Seismic-Site Effects on the Vulnerability Assessment of a Historical Centre in the Molise Region of Italy: Analysis Method and Real Behaviour Calibration Based on 2002 Earthquake. Geosciences 2020, 10, 21. [Google Scholar] [CrossRef]
  34. Kottke, A.R.; Wang, X.; Rathje, E.M. Technical Manual of STRATA Geotechnical Engineering Center; University of Texas: Austin, TX, USA, 2013. [Google Scholar]
  35. Agostini, S. The Stratified Growth of Chieti from Roman Times to Tomorrow: A New, Geolo-Gy-Based Conscience in City Planning and Renewal. Alp. Mediterr. Quat. 2018, 31, 195–205. [Google Scholar] [CrossRef]
  36. Boncio, P.; Lavecchia, G.; Pace, B. Defining a Model of 3D Seismogenic Sources for Seismic Hazard Assessment Applications: The Case of Central Apennines (Italy). J. Seismol. 2004, 8, 407–425. [Google Scholar] [CrossRef]
  37. D’Agostino, N. Complete Seismic Release of Tectonic Strain and Earthquake Recurrence in the Apennines (Italy). Geophys. Res. Lett. 2014, 41, 1155–1162. [Google Scholar] [CrossRef]
  38. DISS Working Group. Database of Individual Seismogenic Sources (DISS), Version 3.3.0: A 759 Compilation of Potential Sources for Earthquakes Larger than M 5.5 in Italy and Surrounding Areas; Istituto 760 Nazionale Di Geofisica e Vulcanologia (INGV): Rome, Italy, 2021. [Google Scholar]
  39. Galli, P. Recurrence Times of Central-Southern Apennine Faults (Italy): Hints from Palaeoseismology. Terra Nova 2020, 32, 399–407. [Google Scholar] [CrossRef]
  40. Faure Walker, J.; Boncio, P.; Pace, B.; Roberts, G.; Benedetti, L.; Scotti, O.; Visini, F.; Peruzza, L. Fault2SHA Central Apennines Database and Structuring Active Fault Data for Seismic Hazard Assessment. Sci. Data 2021, 8, 87. [Google Scholar] [CrossRef]
  41. Rossetti, E.; Mazzei, A. Progetto di Microzonazione Sismica di Livello 1 del Comune di Chieti (CH)—(Indagini e Relazione Illustrativa), Chieti, Italy, 2015.
  42. Boncio, P.; Lavecchia, G. A Structural Model for Active Extension in Central Italy. J. Geodyn. 2000, 29, 233–244. [Google Scholar] [CrossRef]
  43. Rovida, A.; Locati, M.; Camassi, R.; Lolli, B.; Gasperini, P. The Italian Earthquake Catalogue CPTI15. Bull. Earthq. Eng. 2020, 18, 2953–2984. [Google Scholar] [CrossRef]
  44. Locati, M.; Camassi, R.; Rovida, A.; Ercolani, E.; Bernardini, F.; Castelli, V.; Caracciolo, C.H.; Tertulliani, A.; Rossi, A.; Azzaro, R.; et al. DBMI15, Versione 4.0. Database Macrosismico Italiano. Istituto Nazionale Di Geofisica e Vulcanologia (INGV): Rome, Italy, 2022.
  45. Galli, P.; Camassi, R. Rapporto Sugli Effetti del Terremoto Aquilano del 6 Aprile 2009; INGV: Rome, Italy, 2009. [Google Scholar] [CrossRef]
  46. De Deo, F.; Di Renzo, W. Riattazione e Miglioramento Sismico Della Sede Del Tribunale Di Chieti—Progetto Preliminare—Verifiche Di Vulnerabilità Sismica (A2), Chieti, Italy, 2010. (In Italian)
  47. ChietiToday. Decennale Del Terremoto Dell’Aquila: Le Vittime Della Provincia Di Chieti e i Danni in Città; ChietiToday: Chieti, Italy, 2019. [Google Scholar]
  48. Colantonio, F. Progetto di Riqualificazione Urbana e Sicurezza Delle Periferie “Ambito di Intervento A2 Riqualificazione Architettonica di Piazza San Giustino”—Relazione Geologica e Modellazione Sismica, Chieti, Italy, 2018. (In Italian)
  49. ISPRA. Note Illustrative Della Carta Geologica d’Italia Alla Scala 1:50.000. Foglio 361 Chieti; Istituto Superiore per la Protezione e la Ricerca Ambientale: Roma, Italy, 2010. (In Italian) [Google Scholar]
  50. Faraone, C. Valutazione Degli Effetti di Cavità Antropiche Nella Riposta Sismica Locale in Aree Urbane Della Città di Chieti. Master’s Thesis, Università degli Studi Gabriele d’Annunzio, Chieti, Italy, 2020. [Google Scholar]
  51. Azwin, I.N.; Saad, R.; Nordiana, M. Applying the Seismic Refraction Tomography for Site Characterization. APCBEE Procedia 2013, 5, 227–231. [Google Scholar] [CrossRef]
  52. Gizzi, F.T.; Loperte, A.; Satriani, A.; Lapenna, V.; Masini, N.; Proto, M. Georadar Investigations to Detect Cavities in a Historical Town Damaged by an Earthquake of the Past. Adv. Geosci. 2010, 24, 15–21. [Google Scholar] [CrossRef]
  53. Metwaly, M.; AlFouzan, F. Application of 2-D Geoelectrical Resistivity Tomography for Subsurface Cavity Detection in the Eastern Part of Saudi Arabia. Geosci. Front. 2013, 4, 469–476. [Google Scholar] [CrossRef]
  54. Hussain, Y.; Uagoda, R.; Borges, W.; Nunes, J.; Hamza, O.; Condori, C.; Aslam, K.; Dou, J.; Cárdenas-Soto, M. The Potential Use of Geophysical Methods to Identify Cavities, Sinkholes and Pathways for Water Infiltration. Water 2020, 12, 2289. [Google Scholar] [CrossRef]
  55. Putiška, R.; Nikolaj, M.; Dostál, I.; Kušnirák, D. Determination of Cavities Using Electrical Resistivity Tomography. Contrib. Geophys. Geod. 2012, 42, 201–211. [Google Scholar] [CrossRef]
  56. AlgoShake2D, v. 1.1.5. Software Agli Elementi Finiti per Analisi Di Risposta Sismica Locale 2D. Algoritmiqa s.r.l.: Sellia Marina, Italy, 2024.
  57. Kramer, S.L. Geotechnical Earthquake Engineering; Prentice Hall International Series: Hoboken, NJ, USA, 1996; ISBN 0-13-374943-6. [Google Scholar]
  58. Smith, W.D. The Application of Finite Element Analysis to Body Wave Propagation Problems. Geophys. J. Int. 1975, 42, 747–768. [Google Scholar] [CrossRef]
  59. SM Working Group. Guidelines for Seismic Microzonation. Conference of Regions and Autonomous Provinces of Italy, Civil Protection Department, Rome (original italian edition: Gruppo di lavoro MS, Indirizzi e Criteri per la Microzonazione Sismica, Conferenza delle Regioni e delle Province autonome—Dipartimento della protezione civile, Roma, 2008), 3. 2008. [Google Scholar]
  60. Iervolino, I.; Galasso, C.; Paolucci, R.; Pacor, F. Engineering Ground Motion Record Selection in the ITalian ACcelerometric Archive. Bull. Earthq. Eng. 2011, 9, 1761–1778. [Google Scholar] [CrossRef]
  61. Stucchi, M.; Meletti, C.; Montaldo, V.; Crowley, H.; Calvi, G.M.; Boschi, E. Seismic Hazard Assessment (2003–2009) for the Italian Building Code. Bull. Seismol. Soc. Am. 2011, 101, 1885–1911. [Google Scholar] [CrossRef]
  62. De Vito, S.; Maffei, A.; Bonifazi, M.; Colantonio, F. Realizzazione di un Parcheggio Multipiano in Piazza Carafa a Chieti Scalo e di un Parcheggio Multipiano in via Ciampoli, V Settore—Lavori Pubblici; Chieti, Italy, 2023. (In Italian)
  63. Gaudiosi, I.; Romagnoli, G.; Albarello, D.; Fortunato, C.; Imprescia, P.; Stigliano, F.; Moscatelli, M. Shear Modulus Reduction and Damping Ratios Curves Joined with Engineering Geological Units in Italy. Sci. Data 2023, 10, 625. [Google Scholar] [CrossRef]
  64. Amoroso, S.; Totani, F.; Totani, G. Site Characterization by Seismic Dilatometer (SDMT): The Justice Court of Chieti. In Proceedings of the 18th International Conference on Soil Mechanics and Geotechnical Engineering (18th ISCMGE), Paris, France, 2–6 September 2013; Volume 1, pp. 483–486. [Google Scholar]
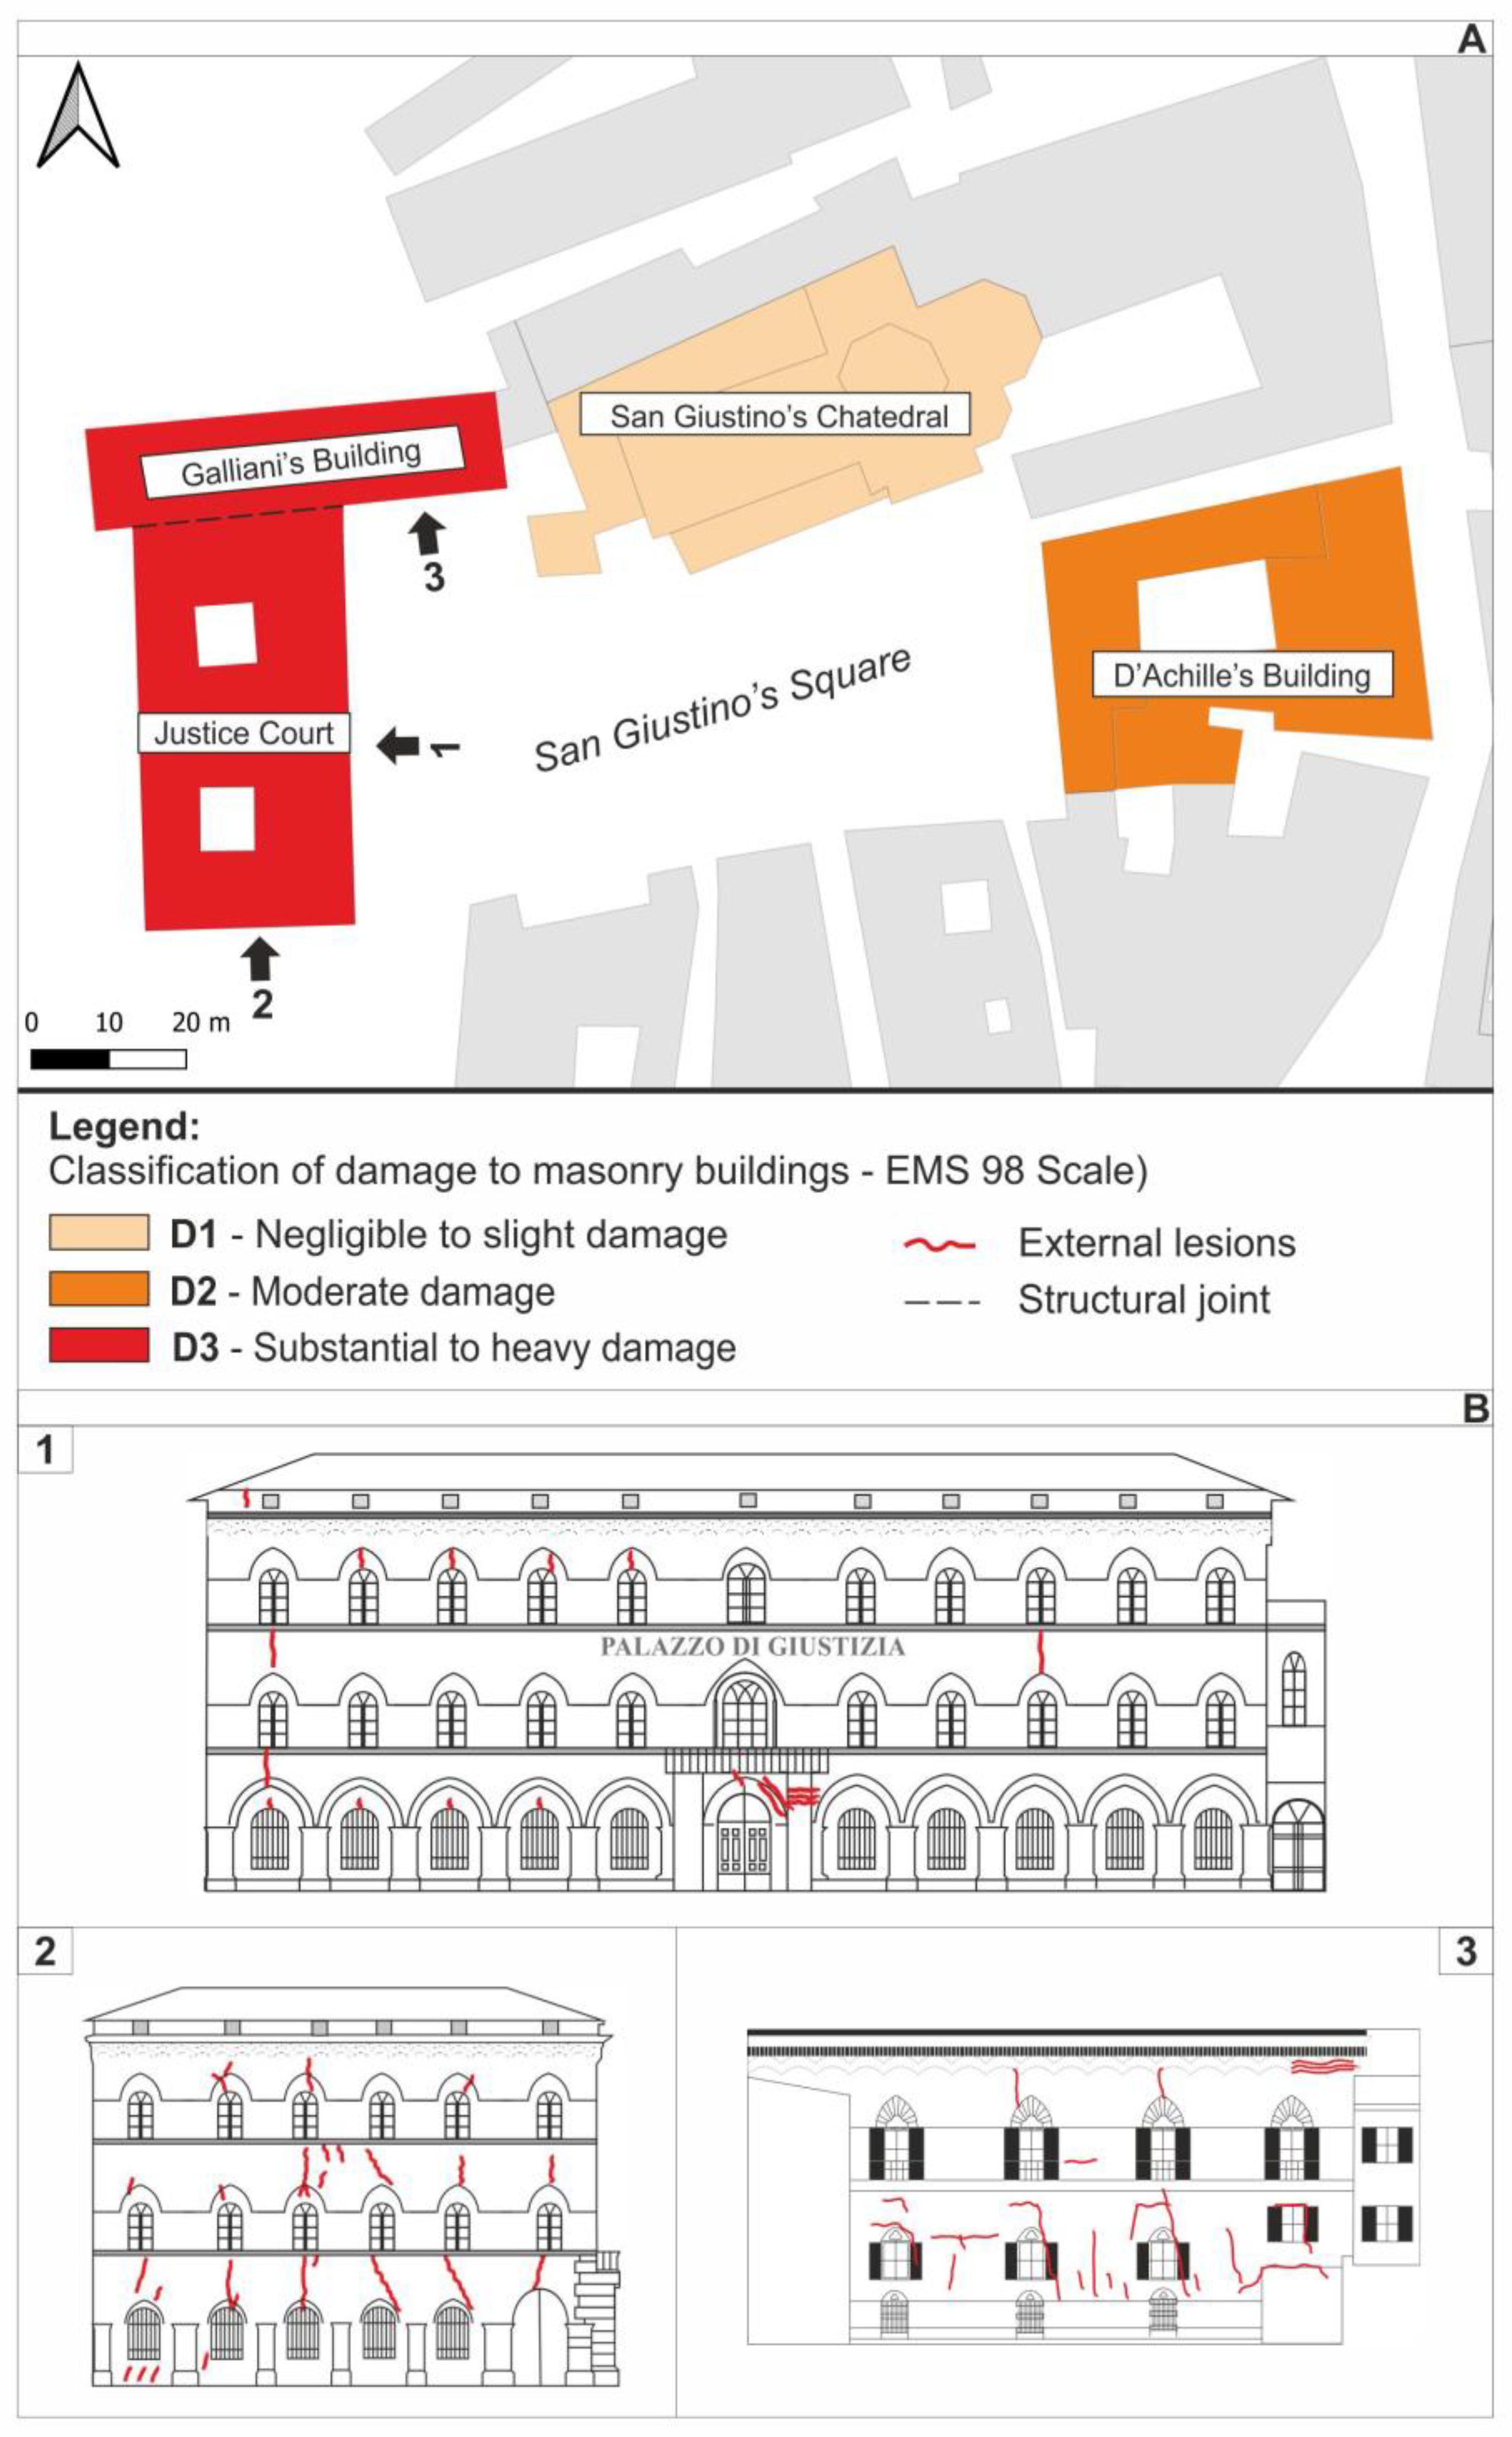
Figure 3. (A). Damage levels suffered by buildings in San Giustino’s Square due to the 2009 L’Aquila earthquake. External cracks in the front elevation (B1) and in the side elevation (B2) of the Justice Court and those related to the south elevation of the Galliani’s building (B3).
Geosciences 15 00076 g003
Figure 4. Geological subsoil model along A-A’ cross-section.
Geosciences 15 00076 g004
Figure 5. Interpretated geognostic boreholes located along the cross-section used for the reconstruction of the 2D subsoil model. For the ubication of the geognostic boreholes see Figure 1.
Geosciences 15 00076 g005
Figure 6. Location map of the geophysical survey in San Giustino’s Square.
Geosciences 15 00076 g006
Figure 7. (A) 2D Vp seismic refraction tomography; (B) 2D Vs seismic refraction tomography.
Geosciences 15 00076 g007
Figure 8. Two-dimensional GPR lines and related interpretations of the GPR survey carried out in San Giustino’s Square.
Geosciences 15 00076 g008
Figure 9. Some pictures taken in 2018 during the Cisternone’s cavity inspection by the speleological association named “SpeleoClub Chieti”.
Geosciences 15 00076 g009
Figure 10. Interpretated two-dimensional electrical tomographic sections.
Geosciences 15 00076 g010
Figure 11. Seven acceleration time histories and their acceleration response spectra, selected as input motions for the numerical simulation.
Geosciences 15 00076 g011
Figure 12. Two-dimensional numerical model with the related mesh pattern made by the AlgoShake2D software (v. 1.1.5.).
Geosciences 15 00076 g012
Figure 13. (A) G/G0 and (B) D(γ) curves used for A–A’ numerical model.
Geosciences 15 00076 g013
Figure 14. Acceleration response spectra calculated at selected points along the surface of the section (in Figure 4): (A) at the slope toe; (B) at the top of the slope; (C) in San Giustino’s Square.
Geosciences 15 00076 g014
Figure 15. The Amplification Factors calculated along the surface of the Chieti section (in Figure 4), according to three interval periods.
Geosciences 15 00076 g015
Figure 16. Acceleration spectra calculated at the surface of the section (in Figure 4) at four points (Pcav2, Pcav4, Pcav5, Pcav6) located at an increasing distance from the axis of symmetry of the Cisternone’s cavity.
Geosciences 15 00076 g016
Table 1. Historical earthquakes were felt at the Chieti city site [44].
DateEpicentral AreaLat.
(°)
Long
(°)
MwSI *
15 December 1456Central-Southern Apennine41.30214.7117.2VI
25 June 1688Sannio41.28314.5617.1VI
314 January 1703Valnerina42.70813.0717.0VII
43 November 1706Maiella42.07614.086.8VIII
510 September 1881Chietino42.23714.3355.4VI
612 February 1882Chietino42.29114.3475.3VII
713 January 1915Marsica42.01413.537.1VII
826 September 1933Maiella42.07914.0935.9VII
97 May 1984Meta mountains41.66714.0575.9VI
Mw = Moment Magnitude; SI * = Seismic Intensity (MCS).
Table 2. Range of S and P wave velocities of the five seismic layers identified by the SR survey.
Seismic LayerThickness (m)Vs (m/s)Vp (m/s)
15.5200–400400–900
210.5400–700900–1300
39.0700–8501300–2000
4Up to 30 m850–9002000–2700
5(-)>1000>2700
Table 3. Input accelerograms used for 2D numerical analysis.
Station CodeStation NameStation
Coordinates
(Lat°; Long°)
Event DateEvent Hour (hh:mm)Epicentral
Distance
(Km)
MWPGA
(g)
1CESMCesi Monte43.004665;
12.903332
14 October 199715:238.75.60.18
2CLOCastelluccio di Norcia42.829399;
13.206000
26 October 201619:1810.85.90.18
3CLOCastelluccio di Norcia42.829399;
13.206000
26 October 201619:1810.85.90.19
4MRMMormanno39.883205;
15.989555
25 October 201223:052.45.20.18
5MRMMormanno39.883205;
15.989555
25 October 201223:052.45.20.13
6ILLILipari38.445700;
14.948300
16 August 201012:5411.44.70.39
7T1245Castelluccio di Norcia42.856540;
13.187980
26 October 201621:425.64.50.19
Table 4. The 2D subsoil model’s geo-seismic–litho-technical proprieties [48,62].
MaterialID G(γ)/G0
Curve
Thickness of Each Material
(m)
γ
(kN/m3)
Vp
(m/s)
Vs
(m/s)
ν
(-)
Eluvial–colluvial depositEC3–10 197003150.37
Anthropogenic soilRI3–10196503000.36
Sandy–Conglomerate
Association
FMTd3–14 20900400–6000.37
Pelitic interlayer of FMTdFMTd-13–12 2111005000.37
Sandy–Pelitic
Association
FMTc15–28 2015807000.38
Pelitic Association (I)FMTa30 2120008000.40
Pelitic Association (II)FMTa3022.5320010000.45
Disclaimer/Publisher’s Note: The statements, opinions and data contained in all publications are solely those of the individual author(s) and contributor(s) and not of MDPI and/or the editor(s). MDPI and/or the editor(s) disclaim responsibility for any injury to people or property resulting from any ideas, methods, instructions or products referred to in the content.