Article

Effects of Rock Texture on Digital Image Correlation

Earth Science Department, Torino University, 10125 Torino, Italy
*
Author to whom correspondence should be addressed.
Geosciences 2025, 15(4), 145; https://doi.org/10.3390/geosciences15040145
Submission received: 21 February 2025 / Revised: 28 March 2025 / Accepted: 8 April 2025 / Published: 10 April 2025
(This article belongs to the Special Issue Digging Deeper: Insights and Innovations in Rock Mechanics)

Abstract

:
Digital image correlation (DIC) is a non-contact optical method that can provide high-resolution strain and displacement measurements, but its effectiveness depends on surface texture contrast. This study investigates the effects of surface characteristics on the quality of DIC results in tonalite and marble samples under Brazilian tests. Tonalite samples have a coarse texture with a heterogeneous mineral composition; therefore, DIC analysis was conducted without artificial speckle patterns. Marble, instead, poses a challenge due to its uniform fine texture and composition. Thus, using point and line grids to enhance surface contrast, artificial speckle patterns were applied to marble samples. A total of 39 disk samples (12 tonalite and 27 marble) were tested with video frames recorded during loading and analyzed using Ncorr software. The results confirmed that tonalite’s natural texture allows accurate strain mapping without artificial speckle patterns. In contrast, marbles without speckles are not effective in strain evolution mapping due to a lack of surface contrast. Marble with both point- and line-speckled patterns effectively mapped the strain evolution except for some distortion and directionality along speckles in displacement fields. This result suggests that the preparation of speckled surfaces need special attention for effective deformation evolution mapping in homogeneous materials.

1. Introduction

The mechanical characterization of rock materials is key for a wide range of engineering projects, including mitigation of geological risks, slope excavation, tunneling, mining, dam construction, and foundation engineering. The strong dependence of deformability and strength of rocks on their intrinsic heterogeneities affects the uncertainties related to these engineering projects. For this reason, understanding rock deformation and failure mechanisms and their relationship with rock-constituting properties is critical to ensure structural stability and operational safety.
Standard mechanical compression tests include the use of traditional techniques, such as strain gauges and linear variable differential transducers (LVDTs), to measure deformation occurring in rock samples during compression. However, these methods are limited in spatial coverage, making them inadequate for measuring full-field strain distribution, which is essential for the understanding of failure mechanisms [1,2].
For this reason, digital image correlation (DIC), a powerful non-contact optical method to measure high-resolution, full-field deformation in different materials during mechanical experiments, has been adopted to investigate the deformation behavior of rocks [3,4,5,6,7,8,9,10].
Since its beginning in the 1980s as a two-dimensional analysis method [11], DIC evolved to include three-dimensional applications in the 1990s [12]. By analyzing sequential images, DIC enables the precise measurement of relative displacements and strain distributions, providing prevalent insights into material deformation under loading.
Early qualitative analyses of crack propagation and coalescence in loaded samples highlighted the need for quantitative methods to better characterize the stress–strain relationship [13,14]. DIC is a possible approach to addressing this problem, offering a robust non-contact approach to measure displacement and strain fields [15]. Researchers have applied DIC to various rock types and loading conditions, including uniaxial compression [4,16,17] and Brazilian tests [5,7,18,19,20,21]. These studies highlight the versatility of DIC in capturing complex deformation behaviors and fracture mechanisms in heterogeneous materials.
The development of open source software such as Ncorr [15] has further enhanced the accessibility and use of DIC, enabling researchers to process images effectively and compare results with traditional load cell measurements. However, DIC is limited to surface measurements and cannot capture internal crack characteristics, making it unsuitable for complex structures requiring a triaxial apparatus. Moreover, flat surfaces are critical for minimizing image distortion and stress concentrations, especially in uniaxial compression loading [3,13]. Advanced techniques such as height digital image correlation (hDIC) and Adaptive Discontinuous Digital Image correlation (AD-DIC) improve crack detection by capturing out-of-plane displacements and tracking crack propagation [22,23]. Additionally, recent advancements in X-ray and neutron tomographic imaging have enabled three-dimensional deformation analysis, addressing some of DIC’s limitations [6,9]. Despite this, 2D DIC remains a cost-effective and valuable technique for deformation analysis in experimental rock mechanics.
Color contrast on the sample surface plays a crucial role in the effectiveness of DIC and its accuracy. Rocks with a homogeneous texture and composition often present challenges because their uniform surface lacks a distinct pattern for software tracking in sequential images. For example, let us consider two worldwide diffuse lithologies, granite and marble. The coarse texture and mineral contrast in granite naturally offer a varied surface, ideal for DIC analysis. In contrast, homogeneous marble, characterized by fine-grained, uniform surfaces, poses challenges. To address this, speckle patterns are often applied to enhance surface contrast. Previous studies have demonstrated the critical role of surface preparation and speckle pattern optimization [24]. References [25,26] demonstrate that speckle pattern characteristics, such as size and density, affect DIC results. Similarly, ref. [27] examined the effects of speckle density on the quality of DIC; it was found that as density increases, errors in DIC decrease. Nevertheless, the use of speckles has the main disadvantage of covering the natural heterogeneities of rock texture, preventing the DIC procedure by capturing elements that may help connect material characteristics to strain behavior.
In this context, the present study proposes an application of DIC methodology to a set of Brazilian tests on tonalite and marble samples to evaluate the feasibility and reliability of the outcomes. More specifically, the results obtained in the presence and the absence of natural and artificial color contrasts were compared. In addition, an evaluation of the capability of DIC to capture the anomalous strain concentrations created in the samples under non-standard testing conditions was performed.
The findings provide valuable insights into the impacts of color contrast in DIC analysis, with related suggestions about sample preparation, providing useful guidelines for the practical use of DIC analysis as an everyday experimental resource.
A sign convention for strains with negative compression and positive expansion is used throughout the text.

2. Materials and Methods

2.1. Sample Preparation

For this study, two isotropic rock types were selected (namely, Carrara marble and tonalite granite). The main difference between the two types of rocks is the distinct chromatic homogeneity of the marble when compared to the various colors of the crystals within the tonalite. The main physical (i.e., bulk density, P-wave velocity, and mean grain size) and mechanical (i.e., uniaxial compression strength—UCS) properties of the two rocks are listed in Table 1. The mean grain size, considered representative of the overall grain size distribution, was determined by analyzing photographic images of the samples. The size of the tonalite crystals varied from 0.2 mm to 5.5 mm, with an average of around 1.5 mm. In the marble samples, the calcite grains exhibited a relatively uniform size, averaging around 0.5 mm. The compressional wave velocity of both tonalite and marble was measured under dry conditions and environmental temperatures using the Portable Ultrasonic Non-Destructive Indicating Tester (PUNDIT Lab Plus instrument, Proceq SA, Schwerzenbach, Switzerland).
In total, 39 disk samples were prepared (12 for tonalite and 27 for marble). The heights and the diameters of each of them are reported in Table 2. As can be seen, for most of the samples, the height of the specimens was half of the diameter (i.e., with a diameter/height ratio of 2), following the ISRM-suggested methods [28]. However, two series of marble samples (samples 15 to 26 and 27 to 30, respectively) with different diameter/height ratios (1.5 and 2.5, respectively) were also prepared to evaluate the capability of DIC in identifying possible issues related to the deviation from the ISRM standards (Table 2).
After sample cutting, the surfaces of 8 out of 27 marble samples were prepared with row (Figure 1a) or point (Figure 1b) speckles to enhance the color contrasts and facilitate DIC analysis. The speckle pattern was drawn manually using a black permanent marker.

2.2. Experimental Procedure

Indirect tensile strength tests (i.e., Brazilian tests) were performed on all samples using a Matest uniaxial press (Arcore, Italy) with a high-stability frame (3000 kN capacity) and automatic servo control system (servo-plus progress). The machine was equipped with a Brazilian test apparatus from the Department of Earth Science of the University of Turin. The tests were performed in agreement with the ISRM-suggested methods [28]. The load was applied at a rate of 500 kN, with a preloading of 15 kN. The tensile stress was calculated as follows:
σt = 2P/πLD
where L and D are the thickness and diameter of the sample, respectively, whilst P is the applied stress.

2.3. Digital Image Correlation

During compressional tensile tests, a high-frequency optical camera was used to acquire videos at a frame rate of 70 frames per second of the frontal faces of the disk samples. The frames of each video were extracted using Free Video to JPG Converter software, version 5.2.3 (Digital Wave Ltd., DVDVideoSoft, London, UK).The extracted frames were processed using open source Ncorr v.1.2.2 [15], working in a MATLAB environment. The analysis was conducted with a Reliability Guided (RG) DIC radius of 65 mm, a strain radius of 15 mm, and a subset spacing of 5 mm.
The algorithm works through a comparison of progressive images with the reference one before deformation. After loading reference and deformed images into the MATLAB Ncorr software interface [15], a region of interest (ROI) is selected on the surface of the referenced image captured before loading. The ROI is then divided into small areas or pixel subsets. A correlation algorithm identifies the best match between each subset in the reference image and its corresponding position in the deformed image. The result of DIC analysis is a grid containing displacement data for each subset relative to the undeformed image, forming a displacement field. The displacement data from pixel-based units to real-world measurements are converted using a scale factor, which is determined through a graphical procedure, calculated as the ratio of a specific length measured on the image (in pixels) to the corresponding length measured in the real world (mm).
Strains are computed from displacement data through a least-squares plane fit applied to a local group of data points, often within a contiguous circular region. This method, based on Bing Pan’s work [26], derives displacement gradients from the plane parameters, which are then used to calculate Green–Lagrangian and Eulerian Almansi strains. For further details, refer to [15]. Once the strain field is obtained for all the video frames, the mean value of the horizontal strain of the central portion of the sample (i.e., the red line in Figure 2, where the light blue region represents the region of interest—ROI—for DIC analysis) was retrieved and plotted as a function of the calculated tensile stress (linearly proportional to the time). This process results in the generation of a tensile stress–horizontal strain curve for each performed test.

3. Results

3.1. Physical and Mechanical Tests
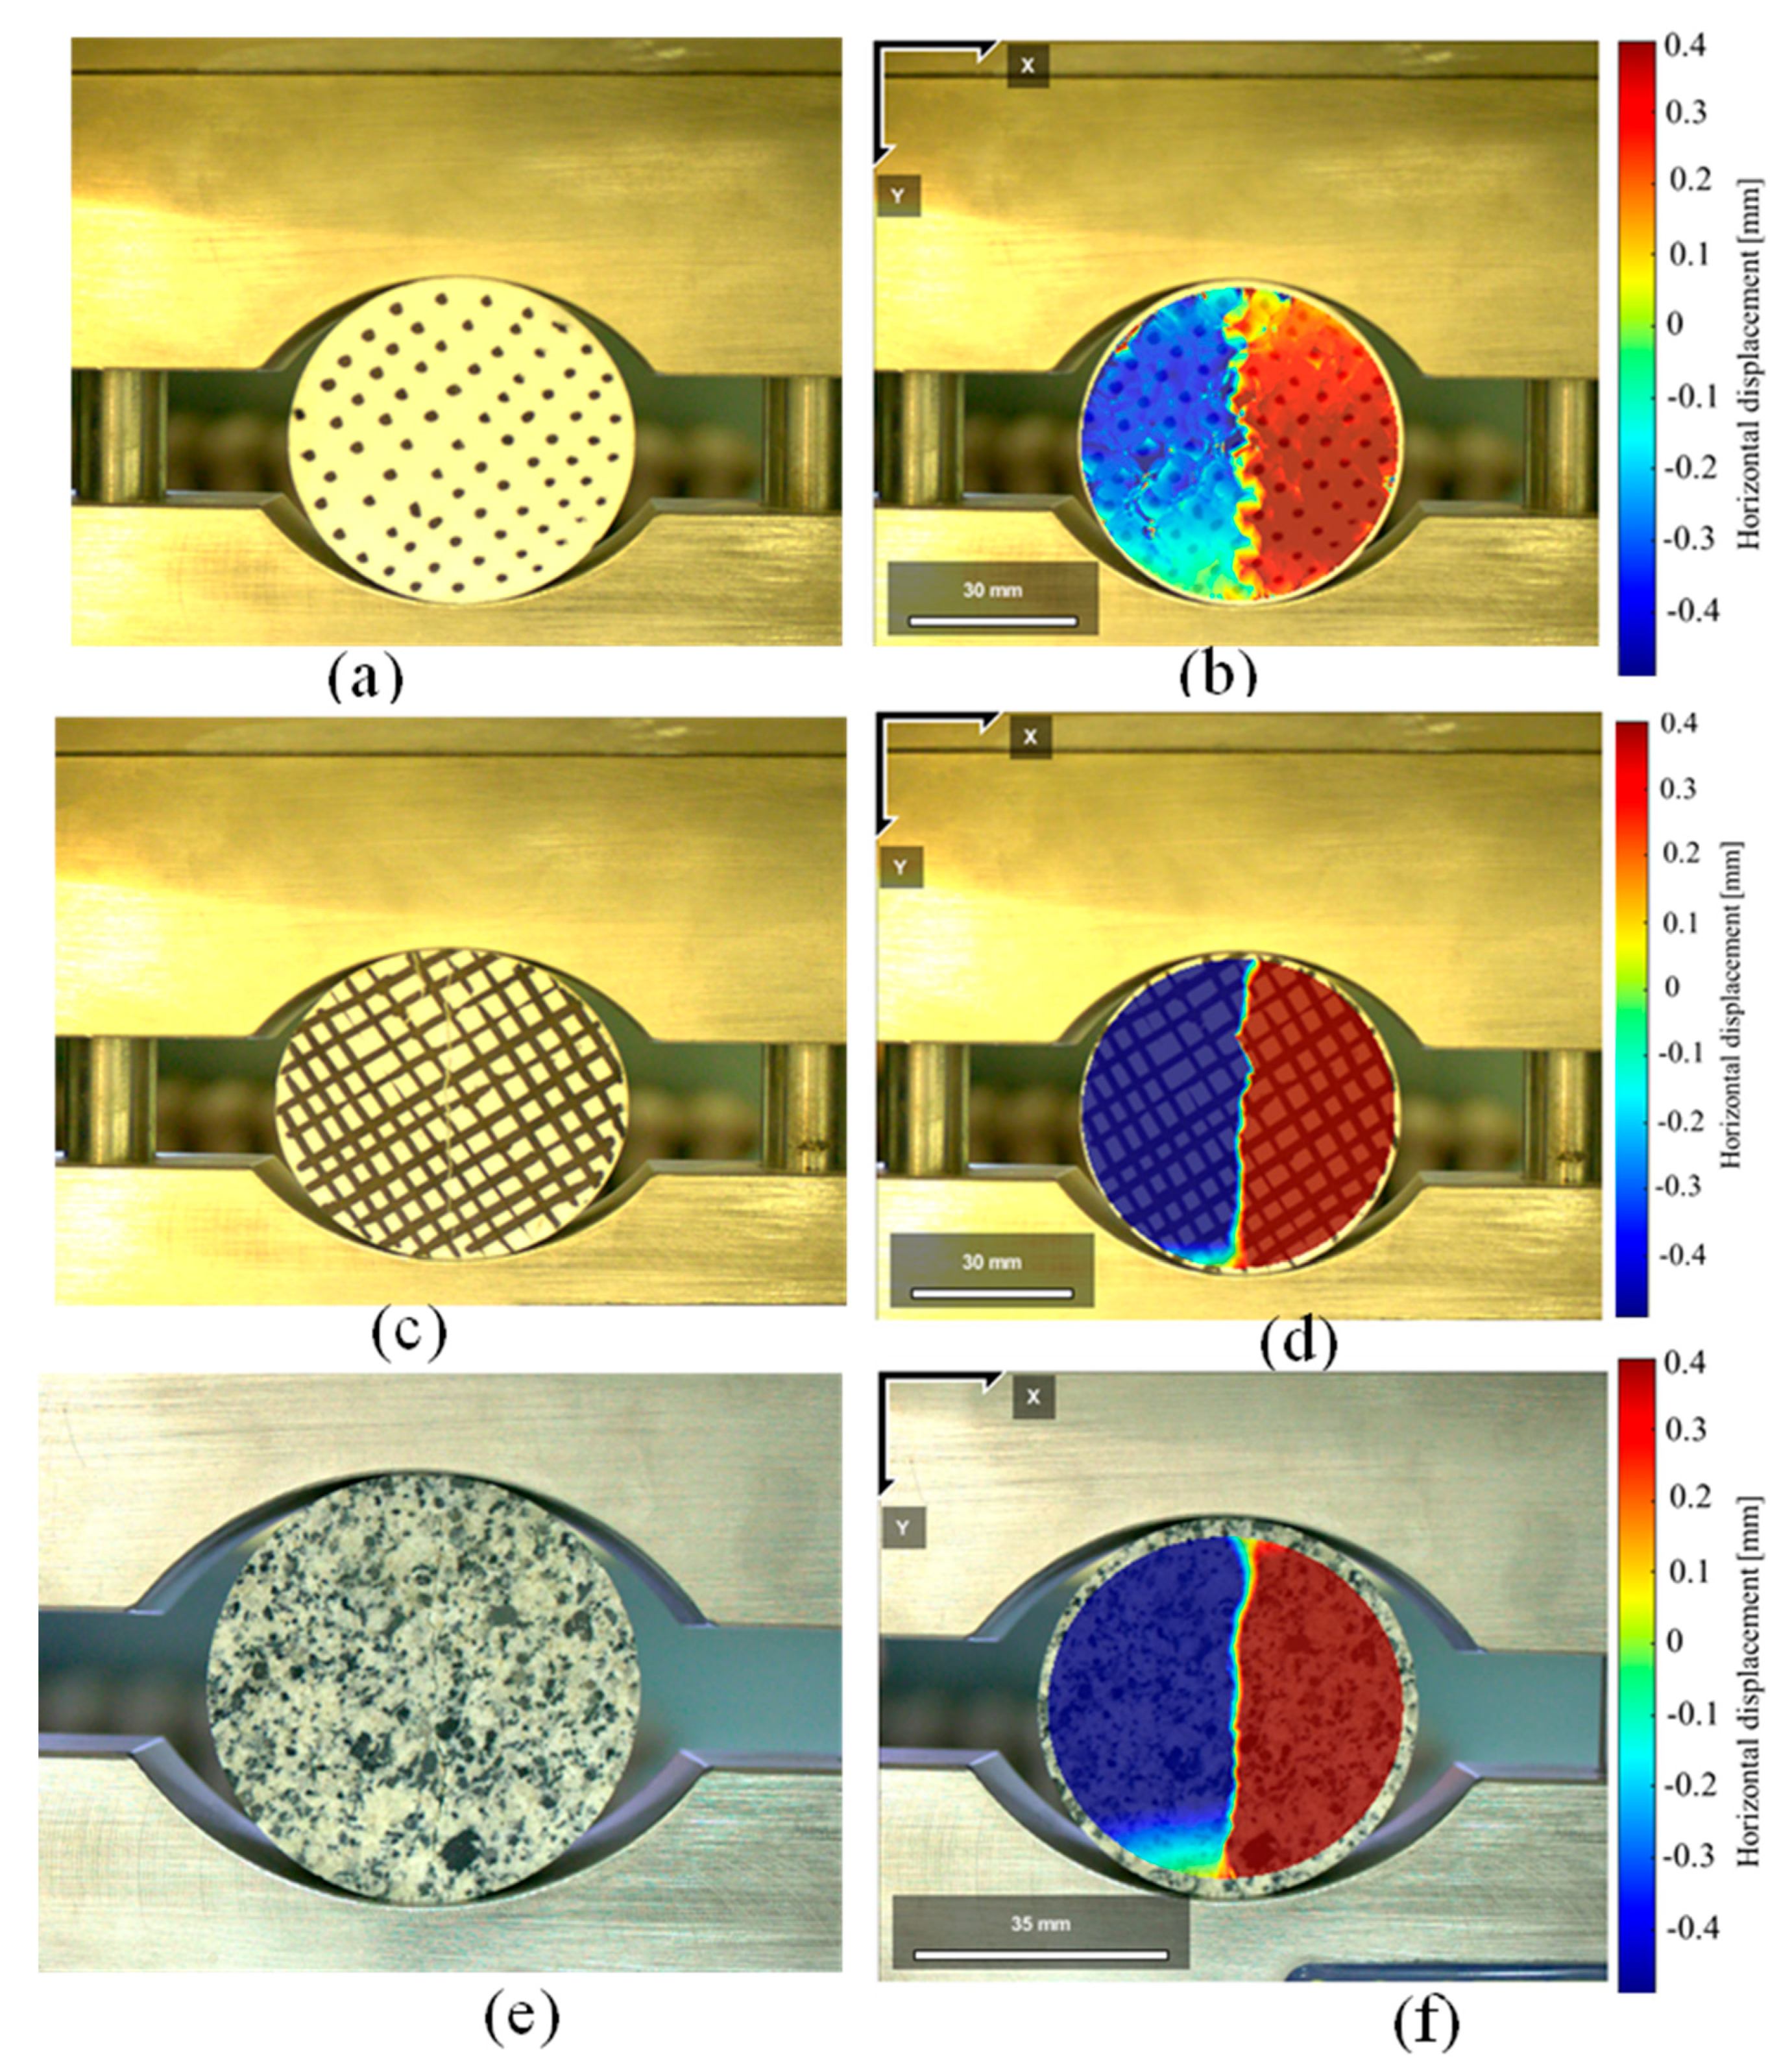
Table 2 presents the characteristics of all the tested samples in terms of measured density, outcomes of the Brazilian tensile strength test, and effectiveness of DIC analysis. As can be seen, the DIC analysis was performed on 36 samples, but it was successful on only 22 of them.
The average densities of marble and tonalite are 2724.8 kg/m3 and 2661.7 kg/m3, with standard deviations (σ) of 104.5 and 33.4, respectively.
Figure 3 shows the results of the Brazilian tensile strength tests as a function of the diameter-to-height ratio (d/h). The obtained results (Figure 3a) were also corrected using the empirical coefficients proposed by Packulak et al. [29] (Figure 3b). The blue and red crosses, representing the average values, respectively, correspond to the tensile strength of tonalite (blue cross, 4.76 MPa—corrected, 3.83 MPa) and marble (red cross, 5.82 MPa—corrected, 4.37 MPa). The results obtained on marble samples are consistent with literature values for Carrara marble [14].
As can be seen, the marble samples with a non-standard diameter-to-height ratio exhibit higher values of tensile strength (respectively, 9.00 MPa—corrected, 6.75 MPa—for the diameter-to-height ratio of 1.5 and 6.42 MPa—corrected, 4.82 MPa—for the diameter-to-height ratio of 2.5).

3.2. DIC Analysis

As shown in Table 2, the DIC success rates varied across different sample types. Tonalite achieved a 100% success rate due to its natural texture and mineral contrast. Non-speckled marble samples showed a much lower success rate of 31.6%, as the lack of surface contrast made strain analysis more challenging. Marble samples with line speckles had a success rate of 100%, while point-speckled samples were 75% successful. Overall, the DIC success rate across all samples was 61.1%, highlighting the significant role of surface preparation in ensuring reliable results. Representative DIC maps for granite, non-speckled marble, and point- and line-speckled marble are presented in the following sections.

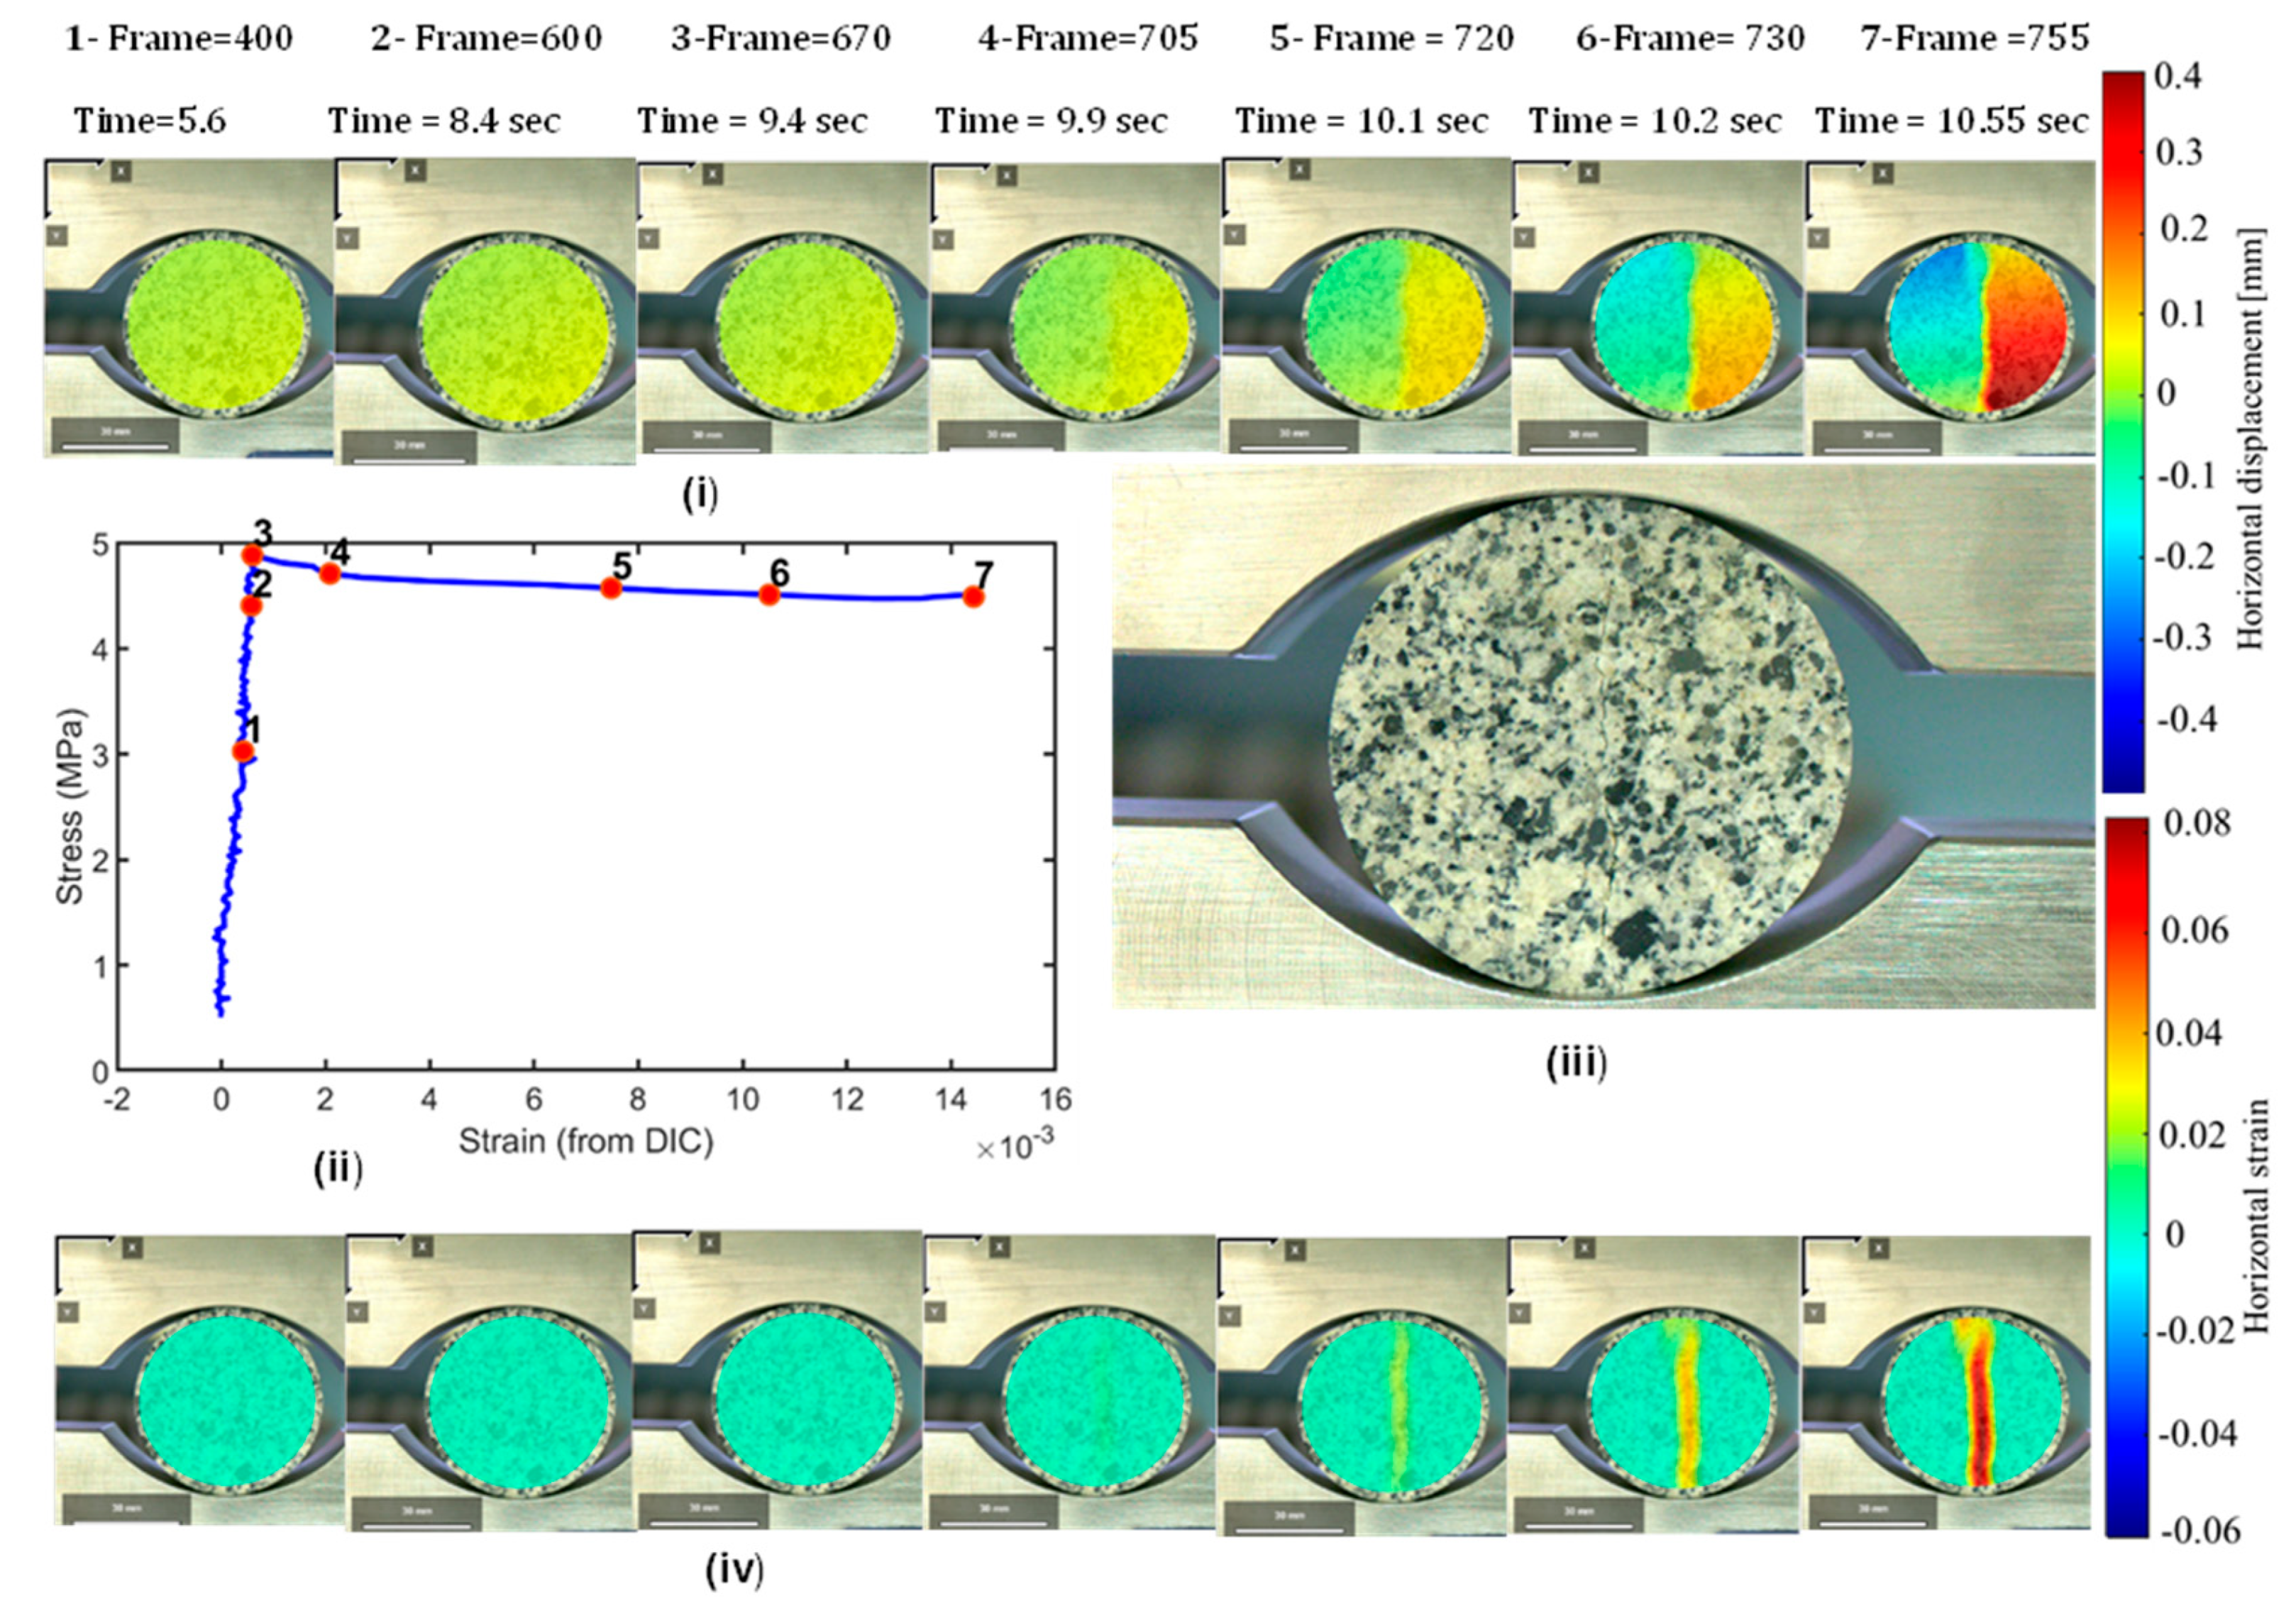
3.2.1. Tonalite Without Speckles

Figure 4ii shows the tensile strength versus horizontal strain curve obtained from DIC results for sample number 5 as a representative example of the results obtained on tonalite. The curve shows an initial steep part (up to point 3) that represents the elastic deformation experienced by the sample, reaching maximum values of about 5 × 10⁻⁴. At the peak, the sample reaches its maximum stress (around 5 MPa), indicating the material’s strength before failure. After peak stress, the stress drops, showing brittle failure.
The DIC maps in the top and bottom rows of Figure 4, respectively, show the evolution of displacements and strain maps over time (Figure 4i,iv). The displacement maps in the upper part of the figure (Figure 4i) show the evolution of displacement in the material. At early stages (points 1, 2, and 3), the displacement is low and uniformly distributed, representing elastic deformation. As loading progresses, the left and right portions of the sample start to move in opposite directions (e.g., visible gradients or high-displacement zones in yellow/red regions), suggesting the opening of a crack in the middle. At the final stages of points 6 and 7, displacement increases, suggesting material failure along a fracture.
The first three considered frames at points 1, 2, and 3 (frames number 400, 600, and 670, corresponding to times 5.6 s, 8.4 s, and 9.4 s, respectively) show evenly distributed strain (light blue-green areas in Figure 4iv). From frame 705 at second 9.9, a crack begins to appear in the center of the sample. In frame 720 (10.1 s), the strain becomes propagated, forming a high-intensity band (region) indicating an opening. This behavior aligns with the uniaxial tensile splitting failure mode, commonly seen in Brazilian tests, where cracks propagate under tensile stress. The crack around the center of the sample shows complete crack propagation (frame 730, at 10.2 s). In frame 755 (10.55 s), the crack is intensified, and the sample exhibits disintegration, particularly at the center of the disk sample. The high strain zones (red in the DIC map) indicate that the failure was initiated as a crack propagated rapidly. This pattern is consistent with rock mechanics theory, where cracks propagate rapidly once the tensile strength is exceeded. The high-speed nature of the failure is evident from the time spanning only around 1 s between crack propagation and post-failure stabilization. DIC provides a clear visualization of crack propagation, helping identify crack initiation and propagation zones. This rapid failure can be attributed to the material’s low fracture toughness, allowing for fast crack growth once the material reaches its critical tensile stress.
The photographic image of the sample at the end of the test (Figure 4iii) indicates the presence of a fracture at the center of the disk that splits the sample into two halves, consistent with the described strain and displacement maps.

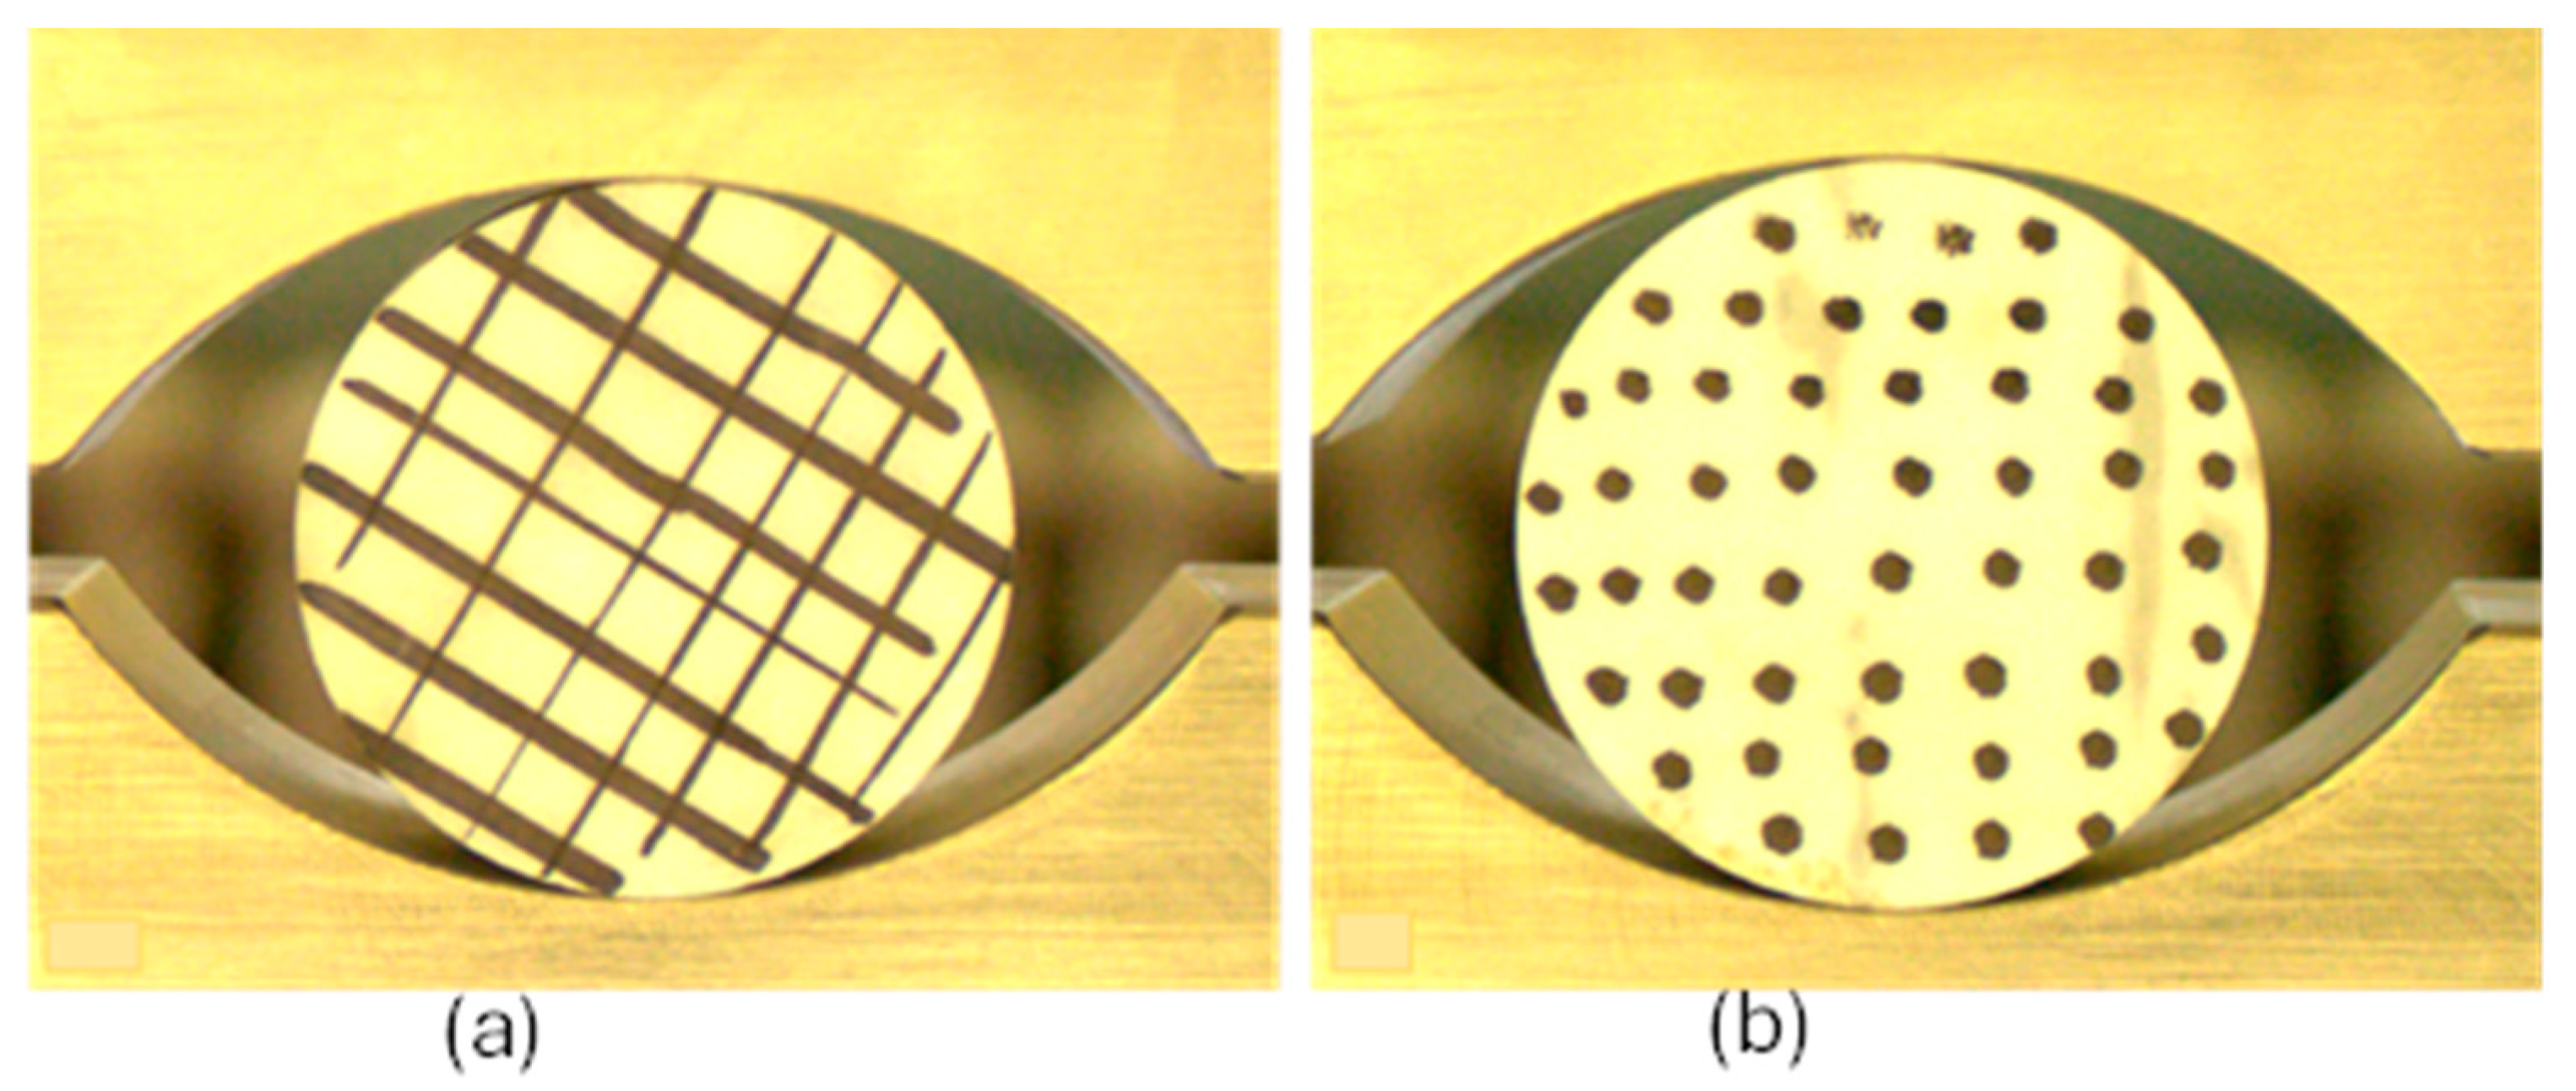
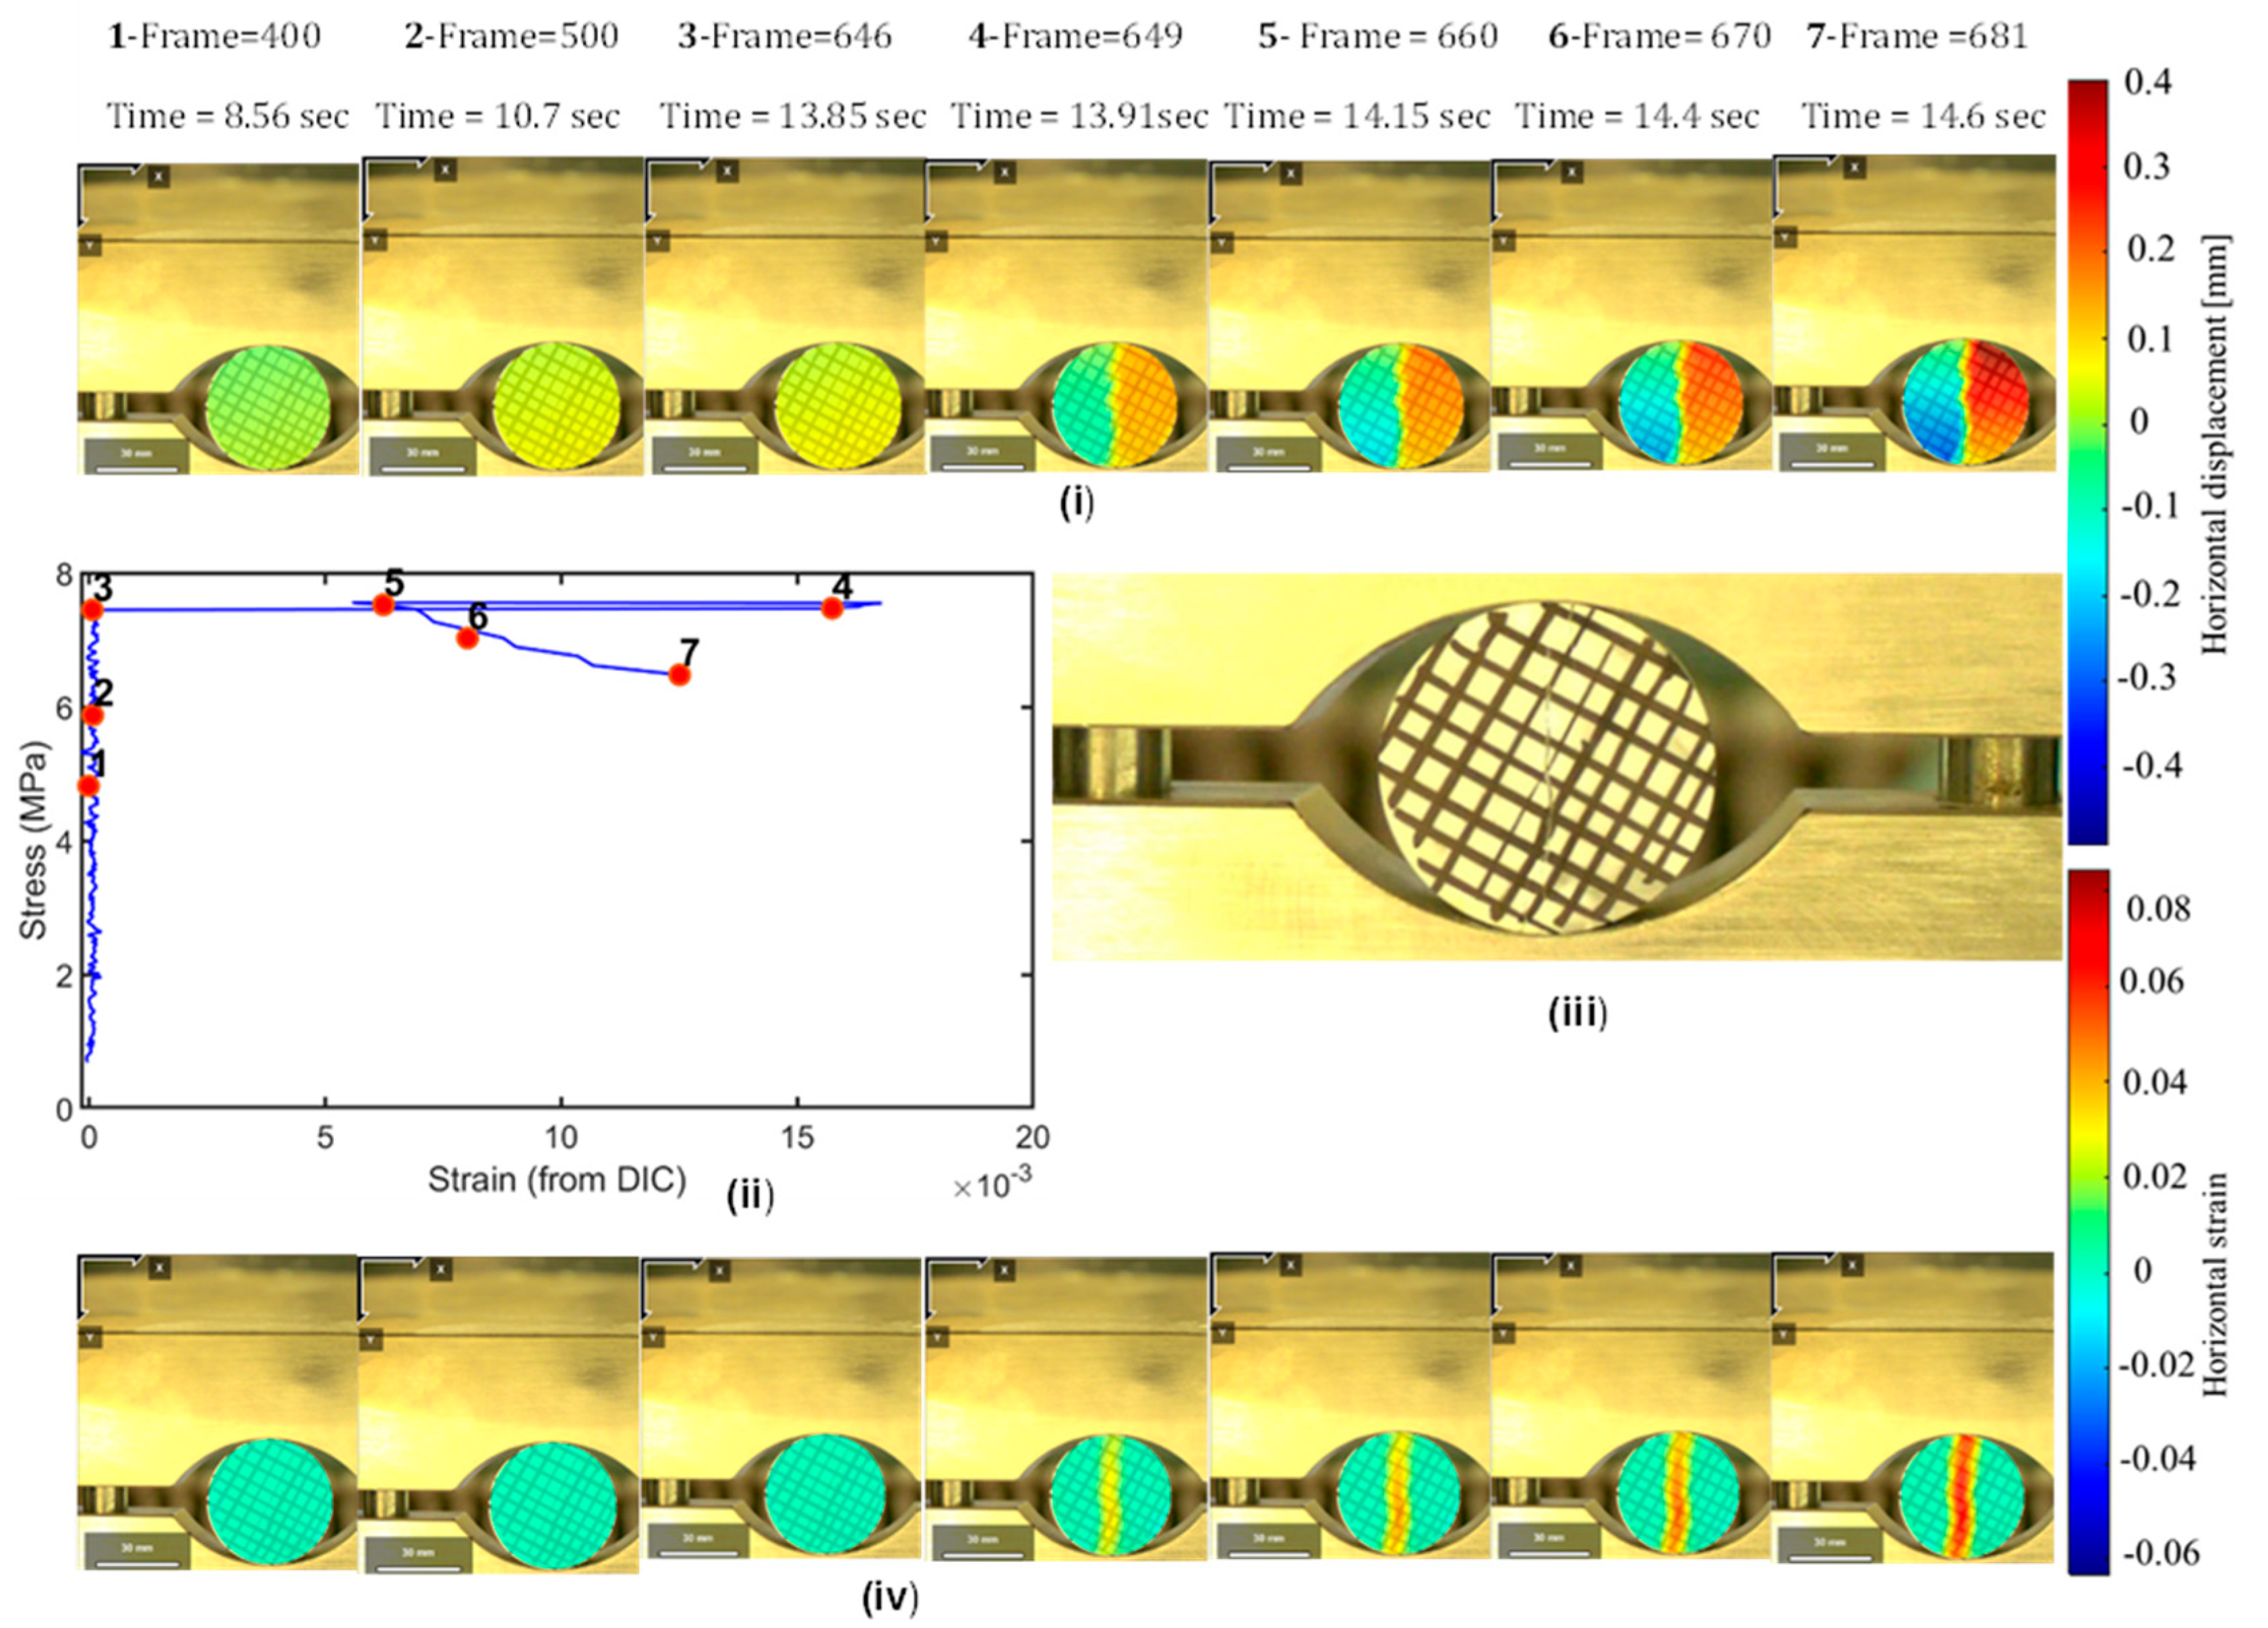
3.2.2. Marble with Line Speckles

Figure 5 shows the stress–strain curve (ii), displacement (i), and strain maps (iv) of sample number 34 as a representative example of marble samples with line spackles. The result shows how the sample behaves under tensile stress. As observed from the stress–strain curve, initially, a linear relationship increases between stress and strain, followed by peak stress around 8 MPa. After peak stress, stress relatively decreases with increasing strain.
The horizontal displacement and strain maps in Figure 5i,iv, respectively, illustrate the progression of displacement and deformation under tensile stress. As seen in the displacement maps (Figure 5i), before the stress peak is reached (points 1, 2, and 3), the displacement is uniform, with green and light green colors dominating, indicating that the entire sample is moving together. After stress progresses, in frame 649 at point 4 (13.91 s), displacement in the left and right portions of the sample starts to diverge. Displacement divergence becomes more pronounced in the following frames (660: 14.15 s and 670: 14.4 s), until reaching complete separation between the left and right portions of the sample at 14.6 s (frame 681 (point 7)).
The strain maps (iv) illustrate how deformation is distributed within the sample. At frames 400, 500, and 646, the strain is low and evenly distributed across the sample (light blue colors), reflecting the elastic phase. In frames 649 and 660, cracks start and propagate, with yellow and red zones appearing at the center. These indicate areas where material deformation is intensifying, likely due to crack development. In frames 670 and 681, the strain is highly increased along the vertical band, corresponding to the observed failure plane. In this area, the red color is dominant, confirming high crack widening that leads to splitting.

3.2.3. Marble with Point Speckles

Figure 6ii represents the stress–strain curve obtained from DIC analysis for sample 31. In the initial part of the stress–strain curve up to the peak before point 3 (frame 410, time—8.0 s), stress rises sharply, indicating elastic deformation. Then, the stress begins to plateau, suggesting the onset of microcracking in the sample at points 3 and 4 (frames 410 and 430, time—8.0 and 8.2 s, respectively). In point 4 (frame 440, time—8.56 s), a relative decrease in stress is observed, signifying sample failure.
In frames 300 and 350 (5.8 and 6.8 s), displacement and strain fields are uniform, with low displacement and strain, indicating an elastic regime. As the stress progresses in frames 410 (8.0 s) and 423 (8.2 s), minor strain (yellow color) starts to appear, signaling the onset of damage. In frame 430 (8.36 s), the strain becomes more evident (yellow with a little red color), with higher magnitudes around the center of the disk sample. The crack becomes wide in frame 440 (8.56 s), indicating a failure zone. At point 7 (frame 450 (8.7 s)), the strain becomes extreme, with strain zones aligning along the failure path. The actual sample photo corresponding to frame 450 confirms that the failure occurs through central splitting deformation (Figure 6iii).

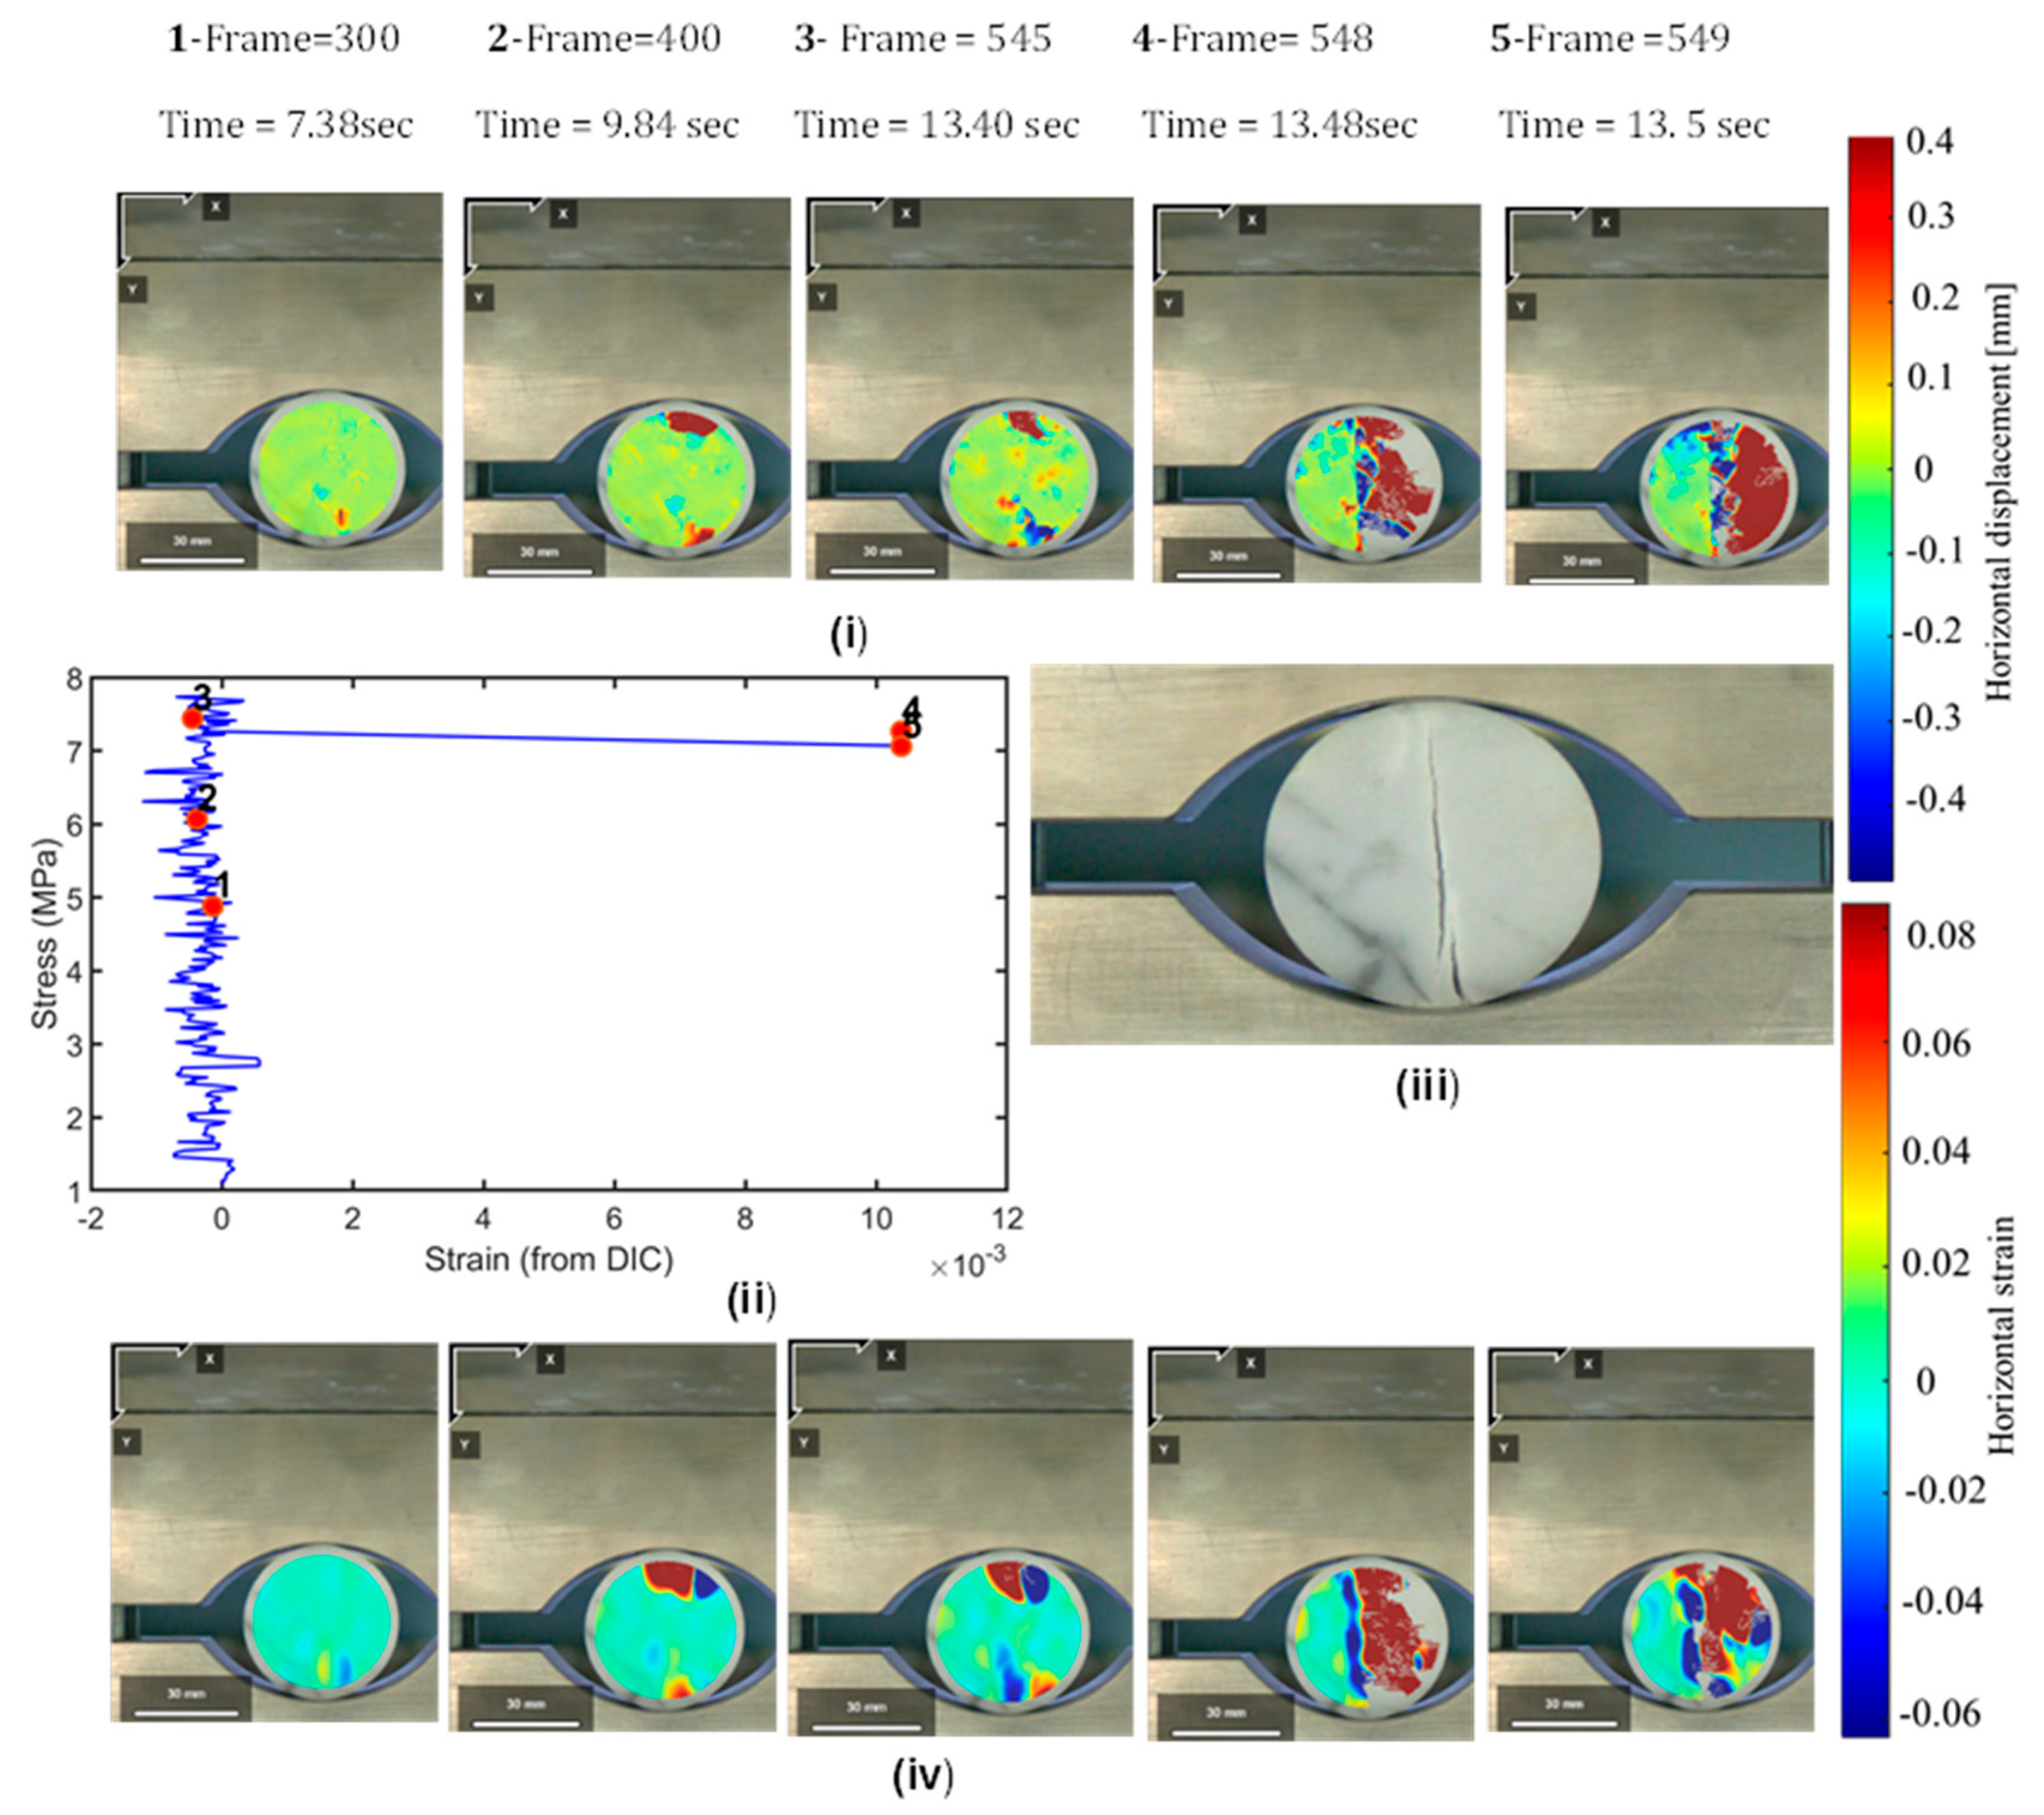
3.2.4. Marble Without Speckles

Figure 7 shows the stress–strain curve and the displacement and strain maps obtained by DIC analysis on sample 26 as a representative example of DIC results obtained on marble samples without speckles. Note that, as shown in Table 2, sample 26 had a diameter-to-height ratio of 1.5 (i.e., lower than the standard value of 2 in the ISRM-suggested methods).
The stress–strain curve (Figure 7ii), despite presenting higher noise with respect to Figure 4, Figure 5 and Figure 6, especially in the elastic portion (i.e., up to point 3), can still achieve the global trend of the test.
The displacement and strain maps (Figure 7i,iv) demonstrate the progression of deformation from points 1 to 5. Point 1 (7.38 s), which is in the elastic part of the curve, shows relatively low displacements with a relatively homogeneous distribution. However, with the increase in applied stress, some anomalous displacements are registered at the top and bottom of the sample (points 2 and 3). At point 4 (13.48), corresponding to a moment of the test after failure, the right portion of the sample shows distinct displacement toward positive values (right direction), consistent with the opening of a crack in the middle of the sample. At point 5 (13.5 s), divergent displacement is even more visible, with negative values of displacement (blue regions) in the left portion of the sample and positive values of displacement in the right portion of the sample (red regions).
Consistent with the displacement maps, the strain maps show an initial propagation of strain in the upper and lower parts of the sample (points 1 to 3) indicating that the failure occurring between points 3 and 4 did not originate from the core of the sample, as required by the ISRM-suggested methods for a valid result. This is indeed consistent with the fact that the sample geometry was out of standard.
At points 4 and 5, the strain becomes highly localized along the vertical and rightward bands (deep blue and red zones), corresponding to the visible crack in the actual sample image (Figure 7iii).

4. Discussion

The application of digital image correlation (DIC) for strain and displacement mapping is highly dependent on the surface texture of the analyzed materials. The natural color contrast provided by mineral grains or the application of artificial patterns (e.g., speckles) plays a crucial role in ensuring reliable results. In this study, DIC was performed on tonalite and homogeneous Carrara marble samples. Here, the results of the performance of DIC for tonalite and marble samples, both with and without artificial speckles, are compared and discussed.

4.1. DIC Results in the Absence of Artificial Speckles

The tonalite, with its heterogeneous mineral chromatic texture and composition, provided excellent natural contrast for DIC tracking. Distinct mineral grains such as quartz, plagioclase, and biotite create a textured surface that allows the accurate calculation of strain and displacement fields. In this experiment, DIC results for tonalite without speckles yielded clear and reliable strain and displacement maps. These maps proved coherent with the natural deformation behavior of the material, demonstrating that the intrinsic mineral contrast of tonalite is sufficient for high-quality DIC analysis without the need for artificial surface preparation. This reduces the complexity of sample preparation, making tonalite particularly suitable for DIC studies in its natural state.
On the other hand, the homogeneous mineralogy and fine texture of the marble samples lacked sufficient natural contrast, leading to noisy DIC outputs and the possibility of failure in DIC analysis altogether. Nevertheless, the presented results show how DIC analysis was able to capture interesting elements for the interpretation of strain evolution of materials under stress, even in the absence of artificial speckles. As described in Section 3.2.4, indeed, the results of DIC analysis on sample 26 allowed the identification of the development of anomalous strain concentration at the top and the bottom of the sample, consistent with the standard diameter-to-height ratio of that sample.

4.2. DIC Results in the Presence of Artificial Speckles

Artificial speckles can improve the quality of DIC analysis for materials with uniform color, like in the case of the marble samples. The speckles introduce a color contrast that allows the correct measurement of strain and displacement. Like tonalite samples, in the marble ones with speckle patterns, the deformation evolution was effectively registered. It must be stressed that although both point and line speckles provide reliable results, they can introduce bias and fail to capture complex deformation patterns. Furthermore, drawing speckles obscure the natural mineral features of the sample, which are important for understanding deformation processes. Thus, one should keep in mind that employing speckles will affect the obtained strain distribution and displacement fields.
Figure 8a, b, reporting a representative example of a displacement map retrieved on a marble sample with point speckles, shows that while the general trend of displacement is captured, the in-detail distribution does not correspond to the natural grain structure. The point grid speckles introduce irregularities in the displacement field, which shows a disturbed, non-uniform displacement gradient. This result indicates that point grids may fail to provide consistency in tracking features across the surface of the samples, leading to artifacts and misinterpretation. These irregularities can misrepresent the material’s actual deformation. This makes it challenging to interpret crack propagation. Possibly, this effect could be minimized by reducing the size and increasing the density of point speckles.
The line speckle grids also produce displacement fields that align with speckle lines. For example, in Figure 8d, the deep red areas follow the line grid pattern. This indicates that the speckle pattern affects the quality of the DIC displacement measurement. This highlights how artificial line speckle patterns can bias displacement tracking along the speckle geometry, which may misrepresent material deformation. Although the grid pattern enhances tracking accuracy, care must be taken when interpreting results, as the calculated displacements and strains may include artifacts from the speckle pattern.
In contrast, the natural texture in the tonalite sample provides an unbiased displacement field. Figure 8f shows consistent displacement of negative (leftward) and positive (rightward) shifts without directional bias. The natural textural and compositional contrast from mineral grains ensures smooth, reliable DIC measurements that correctly represent the material’s deformation.
Figure 9, reporting the Root Mean Square Error (RMSE) among all the displacement (Figure 9a–c) and strain (Figure 9b–d) values on the surface of the sample at time moments, respectively, equivalent to 25% and 50% of peak stress, proposes a quantitative comparison among the obtained results. Assuming that, during the elastic phase, the strain field is expected to be uniform, the RMSE may be indeed used as an index of the accuracy of the results (i.e., the lower the RMSE, the more accurate the analysis). As expected, non-speckled marble samples returned the highest values of RMSE for both displacement and strain, confirming the high noise obtained during the analyses. For the other samples, different trends can be observed for displacement and strain. In the former (the RMSE of the displacement), the tonalite returned higher values than spackled marble, consistent with the fact that the natural texture, homogenously covering the entire surface of the sample, returns displacement values that have a certain variability. However, after the homogenization process that is needed for the computation of strain, the RMSE trend is inverted, with tonalite showing the lowest values. This confirms that artificial speckles, despite being necessary to perform DIC analysis on homogenous white samples such as the considered marble, may introduce biases that reduce the accuracy of the results.

5. Conclusions

In this study, digital image correlation analysis during Brazilian tests was performed for tonalite and marble samples to compare the results with and without artificial speckle patterns. The results demonstrate the critical role of color characteristics of the sample surfaces in determining the quality of digital image correlation (DIC) analysis for tonalite and marble samples. The findings reveal the following:
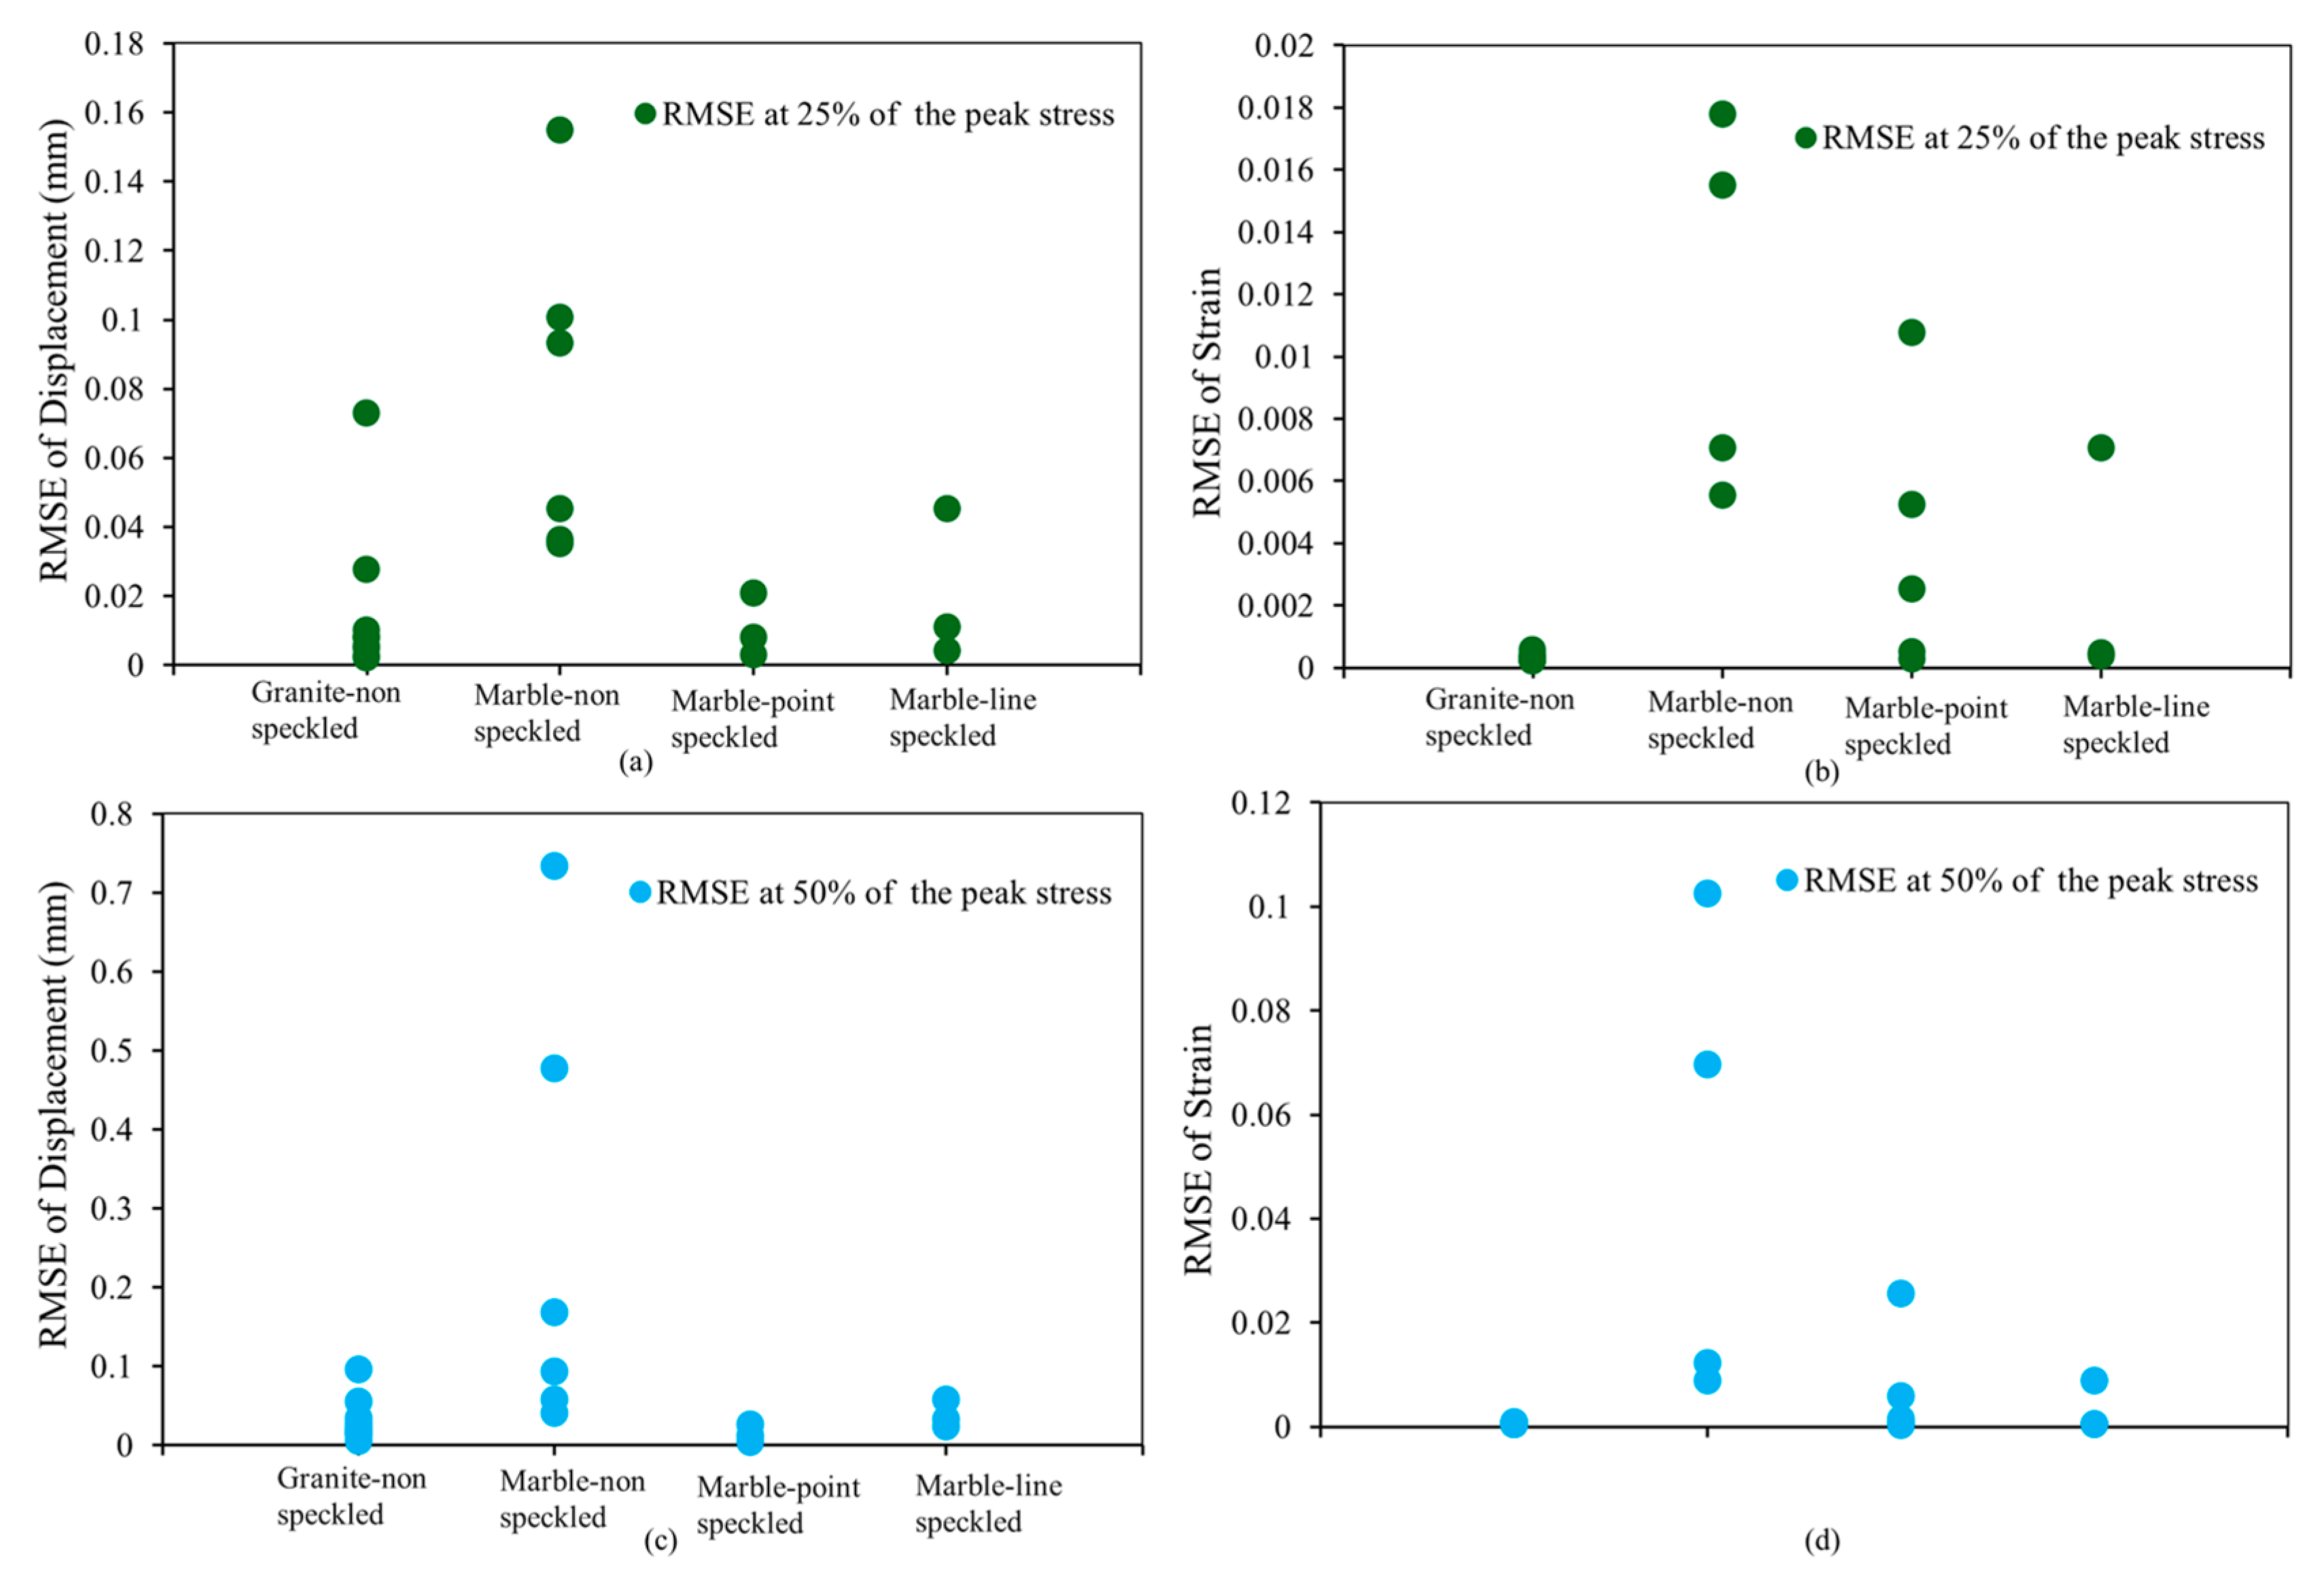
  • The natural textural and mineral contrast of the tonalite samples provides sufficient surface texture for DIC analysis without artificial speckle patterns, achieving a 100% success rate across tested samples.
  • Homogeneous marble without speckle patterns is challenging, and results may not be obtained due to a lack of adequate surface contrast. Nevertheless, the presented results highlight the capability of DIC to identify relevant features of strain distribution even in the absence of speckles. In this study, only 31.6% of non-speckled marble samples were successful in DIC analysis.
  • Marble samples with speckle patterns resulted in good deformation evolution, except for some distortion and directional bias. Line-speckled samples achieved a 100% success rate, while point-speckled samples succeeded in 75% of cases.
  • The overall DIC success rate across all samples was 61.1%, highlighting the importance of appropriate surface preparation for reliable results.
These results emphasize the need for careful speckle pattern optimization to balance sample surface contrast with minimum artifacts. Future research should focus on refining speckle design to maximize DIC accuracy while preserving the natural heterogeneities of rock samples. These insights provide valuable guidelines for the practical application of DIC in experimental rock mechanics and fracture studies.

Author Contributions

Conceptualization, C.C.; methodology, C.C. and A.W.; validation, G.U. and B.T.; formal analysis, A.W.; writing—original draft preparation, A.W.; writing—review and editing, C.C., A.W., B.T. and G.U.; visualization, A.W.; Investigation, C.C., A.W., B.T. and G.U.; supervision, G.U. All authors have read and agreed to the published version of the manuscript.

Funding

The present research was carried out thanks to the Grant n° 20224SZCJX, granted from the Italian MUR (D.D. n. 104 02-02-2022) and the European Union—Next Generation EU.

Data Availability Statement

The data will be available upon request from the corresponding author.

Conflicts of Interest

The authors declare no conflicts of interest.

References

  1. Yan, X.; Liu, Y.; Yang, S.; Jin, Y.; Chen, M. Experimental Investigation on Failure Characteristics of Pre-Holed Jointed Rock Mass Assisted with AE and DIC. Appl. Sci. 2024, 14, 7655. [Google Scholar] [CrossRef]
  2. Chen, F.; Wang, E.; Zhang, B.; Zhang, L.; Meng, F. Prediction of Fracture Damage of Sandstone Using Digital Image Correlation. Appl. Sci. 2020, 10, 1280. [Google Scholar] [CrossRef]
  3. Caselle, C.; Umili, G.; Bonetto, S.; Ferrero, A.M. Application of DIC Analysis Method to the Study of Failure Initiation in Gypsum Rocks. Geotech. Lett. 2019, 9, 35–45. [Google Scholar] [CrossRef]
  4. Chai, J.; Liu, Y.; Ouyang, Y.B.; Zhang, D.; Du, W. Application of Digital Image Correlation Technique for the Damage Characteristic of Rock-like Specimens under Uniaxial Compression. Adv. Civ. Eng. 2020, 2020, 8857495. [Google Scholar] [CrossRef]
  5. Li, D.; Li, B.; Han, Z.; Zhu, Q. Evaluation on Rock Tensile Failure of the Brazilian Discs under Different Loading Configurations by Digital Image Correlation. Appl. Sci. 2020, 10, 5513. [Google Scholar] [CrossRef]
  6. Tudisco, E.; Etxegarai, M.; Hall, S.A.; Charalampidou, E.M.; Couples, G.D.; Lewis, H.; Tengattini, A.; Kardjilov, N. Fast 4-D Imaging of Fluid Flow in Rock by High-Speed Neutron Tomography. J. Geophys. Res. Solid Earth 2019, 124, 3557–3569. [Google Scholar] [CrossRef]
  7. Yang, Z.; Wu, J.; Cui, Z.; Qiu, Y.; Song, G.; Ma, Y.; Feng, Z.; Du, M.; Geng, S.; Chen, S. Digital Image Correlation Analysis of Crack Initiation and Failure in Heat-Treated Granite during the Brazilian Test. Geothermics 2024, 121, 103042. [Google Scholar] [CrossRef]
  8. Yue, Z.; Song, Y.; Li, P.; Tian, S.; Ming, X.; Chen, Z. Applications of Digital Image Correlation (DIC) and the Strain Gage Method for Measuring Dynamic Mode I Fracture Parameters of the White Marble Specimen. Rock Mech. Rock Eng. 2019, 52, 4203–4216. [Google Scholar] [CrossRef]
  9. Zambrano, M.; Hameed, F.; Anders, K.; Mancini, L.; Tondi, E. Implementation of Dynamic Neutron Radiography and Integrated X-Ray and Neutron Tomography in Porous Carbonate Reservoir Rocks. Front. Earth Sci. 2019, 7, 329. [Google Scholar] [CrossRef]
  10. Reu, P.L.; Blaysat, B.; Andó, E.; Bhattacharya, K.; Couture, C.; Couty, V.; Deb, D.; Fayad, S.S.; Iadicola, M.A.; Jaminion, S.; et al. DIC Challenge 2.0: Developing Images and Guidelines for Evaluating Accuracy and Resolution of 2D Analyses: Focus on the Metrological Efficiency Indicator. Exp. Mech. 2022, 62, 639–654. [Google Scholar] [CrossRef]
  11. Chu, T.C.; Ranson, W.F.; Sutton, M.A. Applications of Digital-Image-Correlation Techniques to Experimental Mechanics. Exp. Mech. 1985, 25, 232–244. [Google Scholar] [CrossRef]
  12. Bay, B.K.; Smith, T.S.; Fyhrie, D.P.; Saad, M. Digital Volume Correlation: Three-Dimensional Strain Mapping Using X-Ray Tomography. Exp. Mech. 1999, 39, 217–226. [Google Scholar] [CrossRef]
  13. Caselle, C.; Bonetto, S.; Costanzo, D. Crack Coalescence and Strain Accommodation in Gypsum Rock. Frat. Ed Integrita Strutt. 2020, 14, 247–255. [Google Scholar] [CrossRef]
  14. Wong, L.N.Y.; Zou, C.; Cheng, Y. Fracturing and Failure Behavior of Carrara Marble in Quasistatic and Dynamic Brazilian Disc Tests. Rock Mech. Rock Eng. 2014, 47, 1117–1133. [Google Scholar] [CrossRef]
  15. Blaber, J.; Adair, B.; Antoniou, A. Ncorr: Open-Source 2D Digital Image Correlation Matlab Software. Exp. Mech. 2015, 55, 1105–1122. [Google Scholar] [CrossRef]
  16. Ferrero, A.M.; Migliazza, M.R. Theoretical and Numerical Study on Uniaxial Compressive Behaviour of Marl. Mech. Mater. 2009, 41, 561–572. [Google Scholar] [CrossRef]
  17. Xing, T.; Zhu, H.; Song, Y. Experimental Study on Rock Deformation Localization Using Digital Image Correlation and Acoustic Emission. Appl. Sci. 2024, 14, 5355. [Google Scholar] [CrossRef]
  18. Luo, L.; Li, X.; Qiu, J.; Zhu, Q. Study on Fracture Initiation and Propagation in a Brazilian Disc with a Preexisting Crack by Digital Image Correlation Method. Adv. Mater. Sci. Eng. 2017, 2017, 2493921. [Google Scholar] [CrossRef]
  19. Stirling, R.A.; Simpson, D.J.; Davie, C.T. The Application of Digital Image Correlation to Brazilian Testing of Sandstone. Int. J. Rock Mech. Min. Sci. 2013, 60, 26. [Google Scholar] [CrossRef]
  20. Shams, G.; Rivard, P.; Moradian, O. Micro-Scale Fracturing Mechanisms in Rocks During Tensile Failure. Rock Mech. Rock Eng. 2023, 56, 4019–4041. [Google Scholar] [CrossRef]
  21. Li, G.; Liu, S.Q.; Ma, F.S.; Guo, J. A Multilevel Parallel Bonded-Grain Based Model (Multi Pb-GBM) Accounting for Microstructure Failures of Typical Crystalline Rocks. Bull. Eng. Geol. Environ. 2022, 81, 475. [Google Scholar] [CrossRef]
  22. Uzun, F.; Korsunsky, A.M. The Height Digital Image Correlation (hDIC) Technique for the Identification of Triaxial Surface Deformations. Int. J. Mech. Sci. 2019, 159, 417–423. [Google Scholar] [CrossRef]
  23. Tian, Y.; Zhao, C.; Xing, J.; Niu, J.; Qian, Y. A New Digital Image Correlation Method for Discontinuous Measurement in Fracture Analysis. Theor. Appl. Fract. Mech. 2024, 130, 104299. [Google Scholar] [CrossRef]
  24. Park, J.; Yoon, S.; Kwon, T.H.; Park, K. Assessment of Speckle-Pattern Quality in Digital Image Correlation Based on Gray Intensity and Speckle Morphology. Opt. Lasers Eng. 2017, 91, 62–72. [Google Scholar] [CrossRef]
  25. Hua, T.; Xie, H.; Wang, S.; Hu, Z.; Chen, P.; Zhang, Q. Evaluation of the Quality of a Speckle Pattern in the Digital Image Correlation Method by Mean Subset Fluctuation. Opt. Laser Technol. 2011, 43, 9–13. [Google Scholar] [CrossRef]
  26. Pan, B.; Asundi, A.; Xie, H.; Gao, J. Digital Image Correlation Using Iterative Least Squares and Pointwise Least Squares for Displacement Field and Strain Field Measurements. Opt. Lasers Eng. 2009, 47, 865–874. [Google Scholar] [CrossRef]
  27. Junyao, S.; Zibin, L.; Chuan, L. Studies on the Influence of Speckle Density on the Accuracy of Digital Image Correlation Method Based on Numerical Simulation; IOP Publishing Ltd.: Bristol, UK, 2021; Volume 1971. [Google Scholar]
  28. Bieniawski, Z.T.; Hawkes, I. Suggested Methods for Determining Tensile Strength of Rock Materials. Int. J. Rock Mech. Min. Sci. Geomech. Abstr. 1978, 15, 99–103. [Google Scholar] [CrossRef]
  29. Packulak, T.R.M.; Day, J.J.; McDonald, M.R.; Jacksteit, A.C.; Diederichs, M.S. Measurement of True Tensile Strength from Brazilian Tensile Strength Laboratory Tests. Can. Geotech. J. 2024, 62, 1–14. [Google Scholar] [CrossRef]
Figure 1. Row (a) and point (b) speckles drawn on selected marble samples.
Geosciences 15 00145 g001
Figure 2. An example of a strain map obtained from the DIC analysis. The red line represents the region of the sample used for the calculation of strain for the stress–strain curves.
Geosciences 15 00145 g002
Figure 3. Relationship between tensile strength and diameter to height ratio (a) uncorrected and (b) corrected Brazilian tensile strength.
Geosciences 15 00145 g003
Figure 4. Results of DIC analysis on tonalite sample 5. (i) Displacement maps; (ii) stress–strain curve calculated using DIC strain; (iii) photographic image of the sample corresponding to the last strain maps; (iv) strain maps.
Geosciences 15 00145 g004
Figure 5. Results of DIC analysis on marble sample 34. (ii) Stress–strain curve; (i) displacement maps; (iv) strain maps; (iii) actual physical samples corresponding to the last strain maps of marble with line grid speckles.
Geosciences 15 00145 g005
Figure 6. Results of DIC analysis on marble sample 31. (ii) Stress–strain curve; (i) displacement maps; (iv) strain maps; (iii) actual physical samples corresponding to the last strain maps of marble with point grid speckles.
Geosciences 15 00145 g006
Figure 7. Results of DIC analysis on marble sample 34. (ii) Stress–strain curve; (i) displacement maps; (iv) strain maps; (iii) actual physical samples corresponding to the last strain maps of marble without speckles.
Geosciences 15 00145 g007
Figure 8. (a) Marble with point grid speckles; (b) displacement map; (c) marble with line grid speckles; (d) displacement map; (e) tonalite sample; (f) tonalite displacement map.
Geosciences 15 00145 g008
Figure 9. (a) RMSE of displacement at 25% of the peak stress; (b) RMSE of strain at 25% of the peak stress; (c) RMSE of displacement at 50% of the peak stress; (d) RMSE of strain at 50% of the peak stress.
Geosciences 15 00145 g009
Table 1. Physical and mechanical properties of the two rocks used for the experiments described in this paper.
UCS [MPa]Density [kg/m3]P Wave Velocity [m/s]Mean Grain Size [mm]
Tonalite1302661.739201.5
Carrara Marble752724.847400.5
Table 2. Physical and mechanical properties of tonalite and marble samples.
Specimen n°Rock TypeVideo RecordingDrawn PatternSuccessful DICDiameter [mm]Height [mm]Ratio [d/h]Mass [g]Bulk Density [kg/m3]σt [MPa]Corrected σt [MPa]
1TonaliteNoNo---5026.21.9139.027107.05.7
2TonaliteNoNo---5025.32.0132.026505.24.2
3TonaliteNoNo---5025.02.0131.026704.83.9
4TonaliteYesNoYes5023.02.2122.027004.83.9
5TonaliteYesNoYes5026.21.9138.527004.94.0
6TonaliteYesNoYes5027.71.8145.026704.73.8
7TonaliteYesNoYes5026.51.9141.027105.24.2
8TonaliteYesNoYes5026.71.9143.527403.83.1
9TonaliteYesNoYes5025.22.0134.027105.04.0
10TonaliteYesNoYes5024.72.0130.026804.63.7
11TonaliteYesNoYes5028.41.8130.523404.13.3
12TonaliteYesNoYes5023.32.1122.026604.33.3
13MarbleYesNoNo4316.02.764.027604.43.3
14MarbleYesNoYes4319.62.278.027408.56.3
15MarbleYesNoYes4316.42.665.027307.15.3
16MarbleYesNoNo4316.92.566.026805.54.1
17MarbleYesNoYes4317.12.568.027408.66.4
18MarbleYesNoNo4317.02.568.027506.54.9
19MarbleYesNoNo4317.02.568.027507.45.6
20MarbleYesNoYes4317.42.568.027006.64.9
21MarbleYesNoNo4317.12.569.027806.75.0
22MarbleYesNoNo4317.32.568.027105.23.9
23MarbleYesNoYes4316.92.567.027205.23.9
24MarbleYesNoNo4316.52.666.027605.74.3
25MarbleYesNoNo4316.82.666.027107.15.3
26MarbleYesNoYes4315.02.960.027507.85.8
27MarbleYesPointsYes40.628.81.4101.0271010.47.8
28MarbleYesNoNo40.428.71.4101.527605.03.8
29MarbleYesNoNo40.627.21.596.027308.46.3
30MarbleYesRowsYes40.428.41.4101.027709.67.2
31MarbleYesPointsYes43.321.22.083.526704.53.4
32MarbleYesRowsYes43.321.52.088.027806.95.2
33MarbleYesPointsNo43.121.62.085.527104.93.6
34MarbleYesRowsYes43.321.52.084.526707.45.6
35MarbleYesNoNo43.021.22.084.027305.23.9
36MarbleYesNoNo43.221.52.085.027005.94.4
37MarbleYesNoNo57.629.71.9209.027005.64.2
38MarbleYesRowsYes57.629.42.0205.026805.03.7
39MarbleYesPointsYes57.629.52.0206.026805.74.3
Tonalite mean2661.74.93.9
St Dev104.50.80.7
Marble mean2724.86.54.9
St Dev33.41.61.2
Disclaimer/Publisher’s Note: The statements, opinions and data contained in all publications are solely those of the individual author(s) and contributor(s) and not of MDPI and/or the editor(s). MDPI and/or the editor(s) disclaim responsibility for any injury to people or property resulting from any ideas, methods, instructions or products referred to in the content.

