


Sedimentary Diversity of Tsunami Deposits in a River Channel Associated with the 2024 Noto Peninsula Earthquake, Central Japan


Abstract
1. Introduction
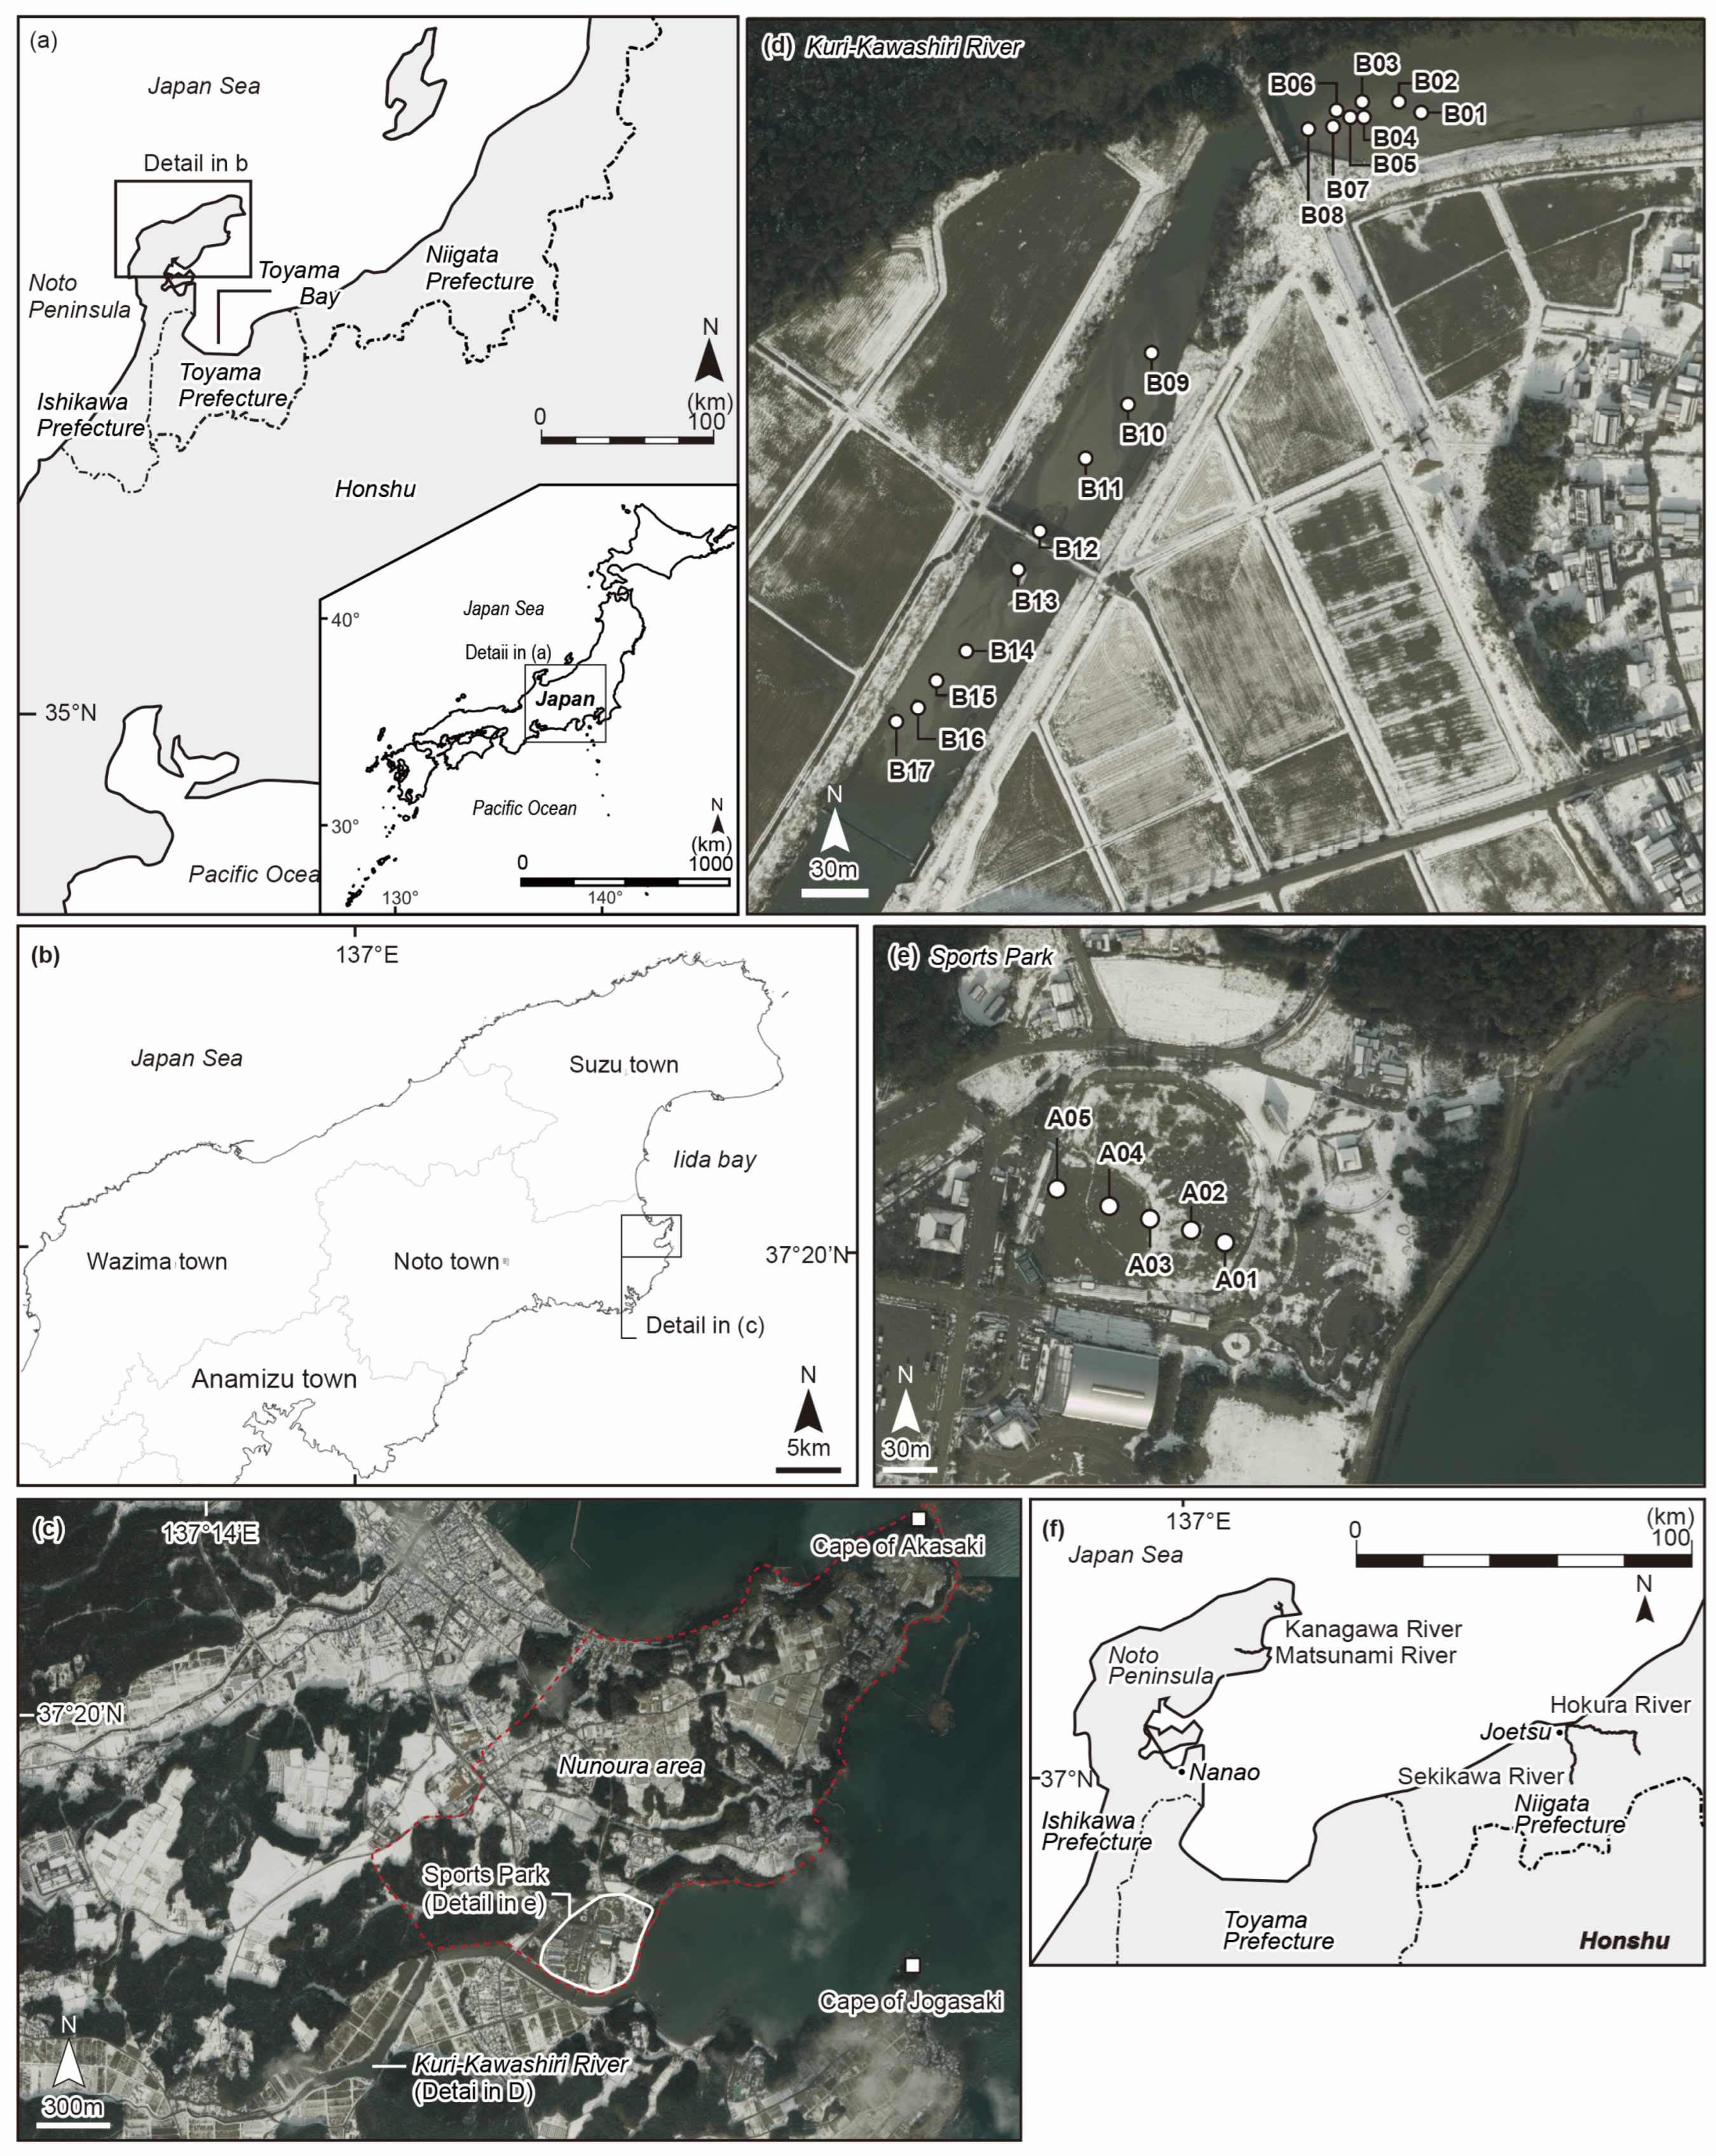
2. Regional Setting
2.1. Geological Background
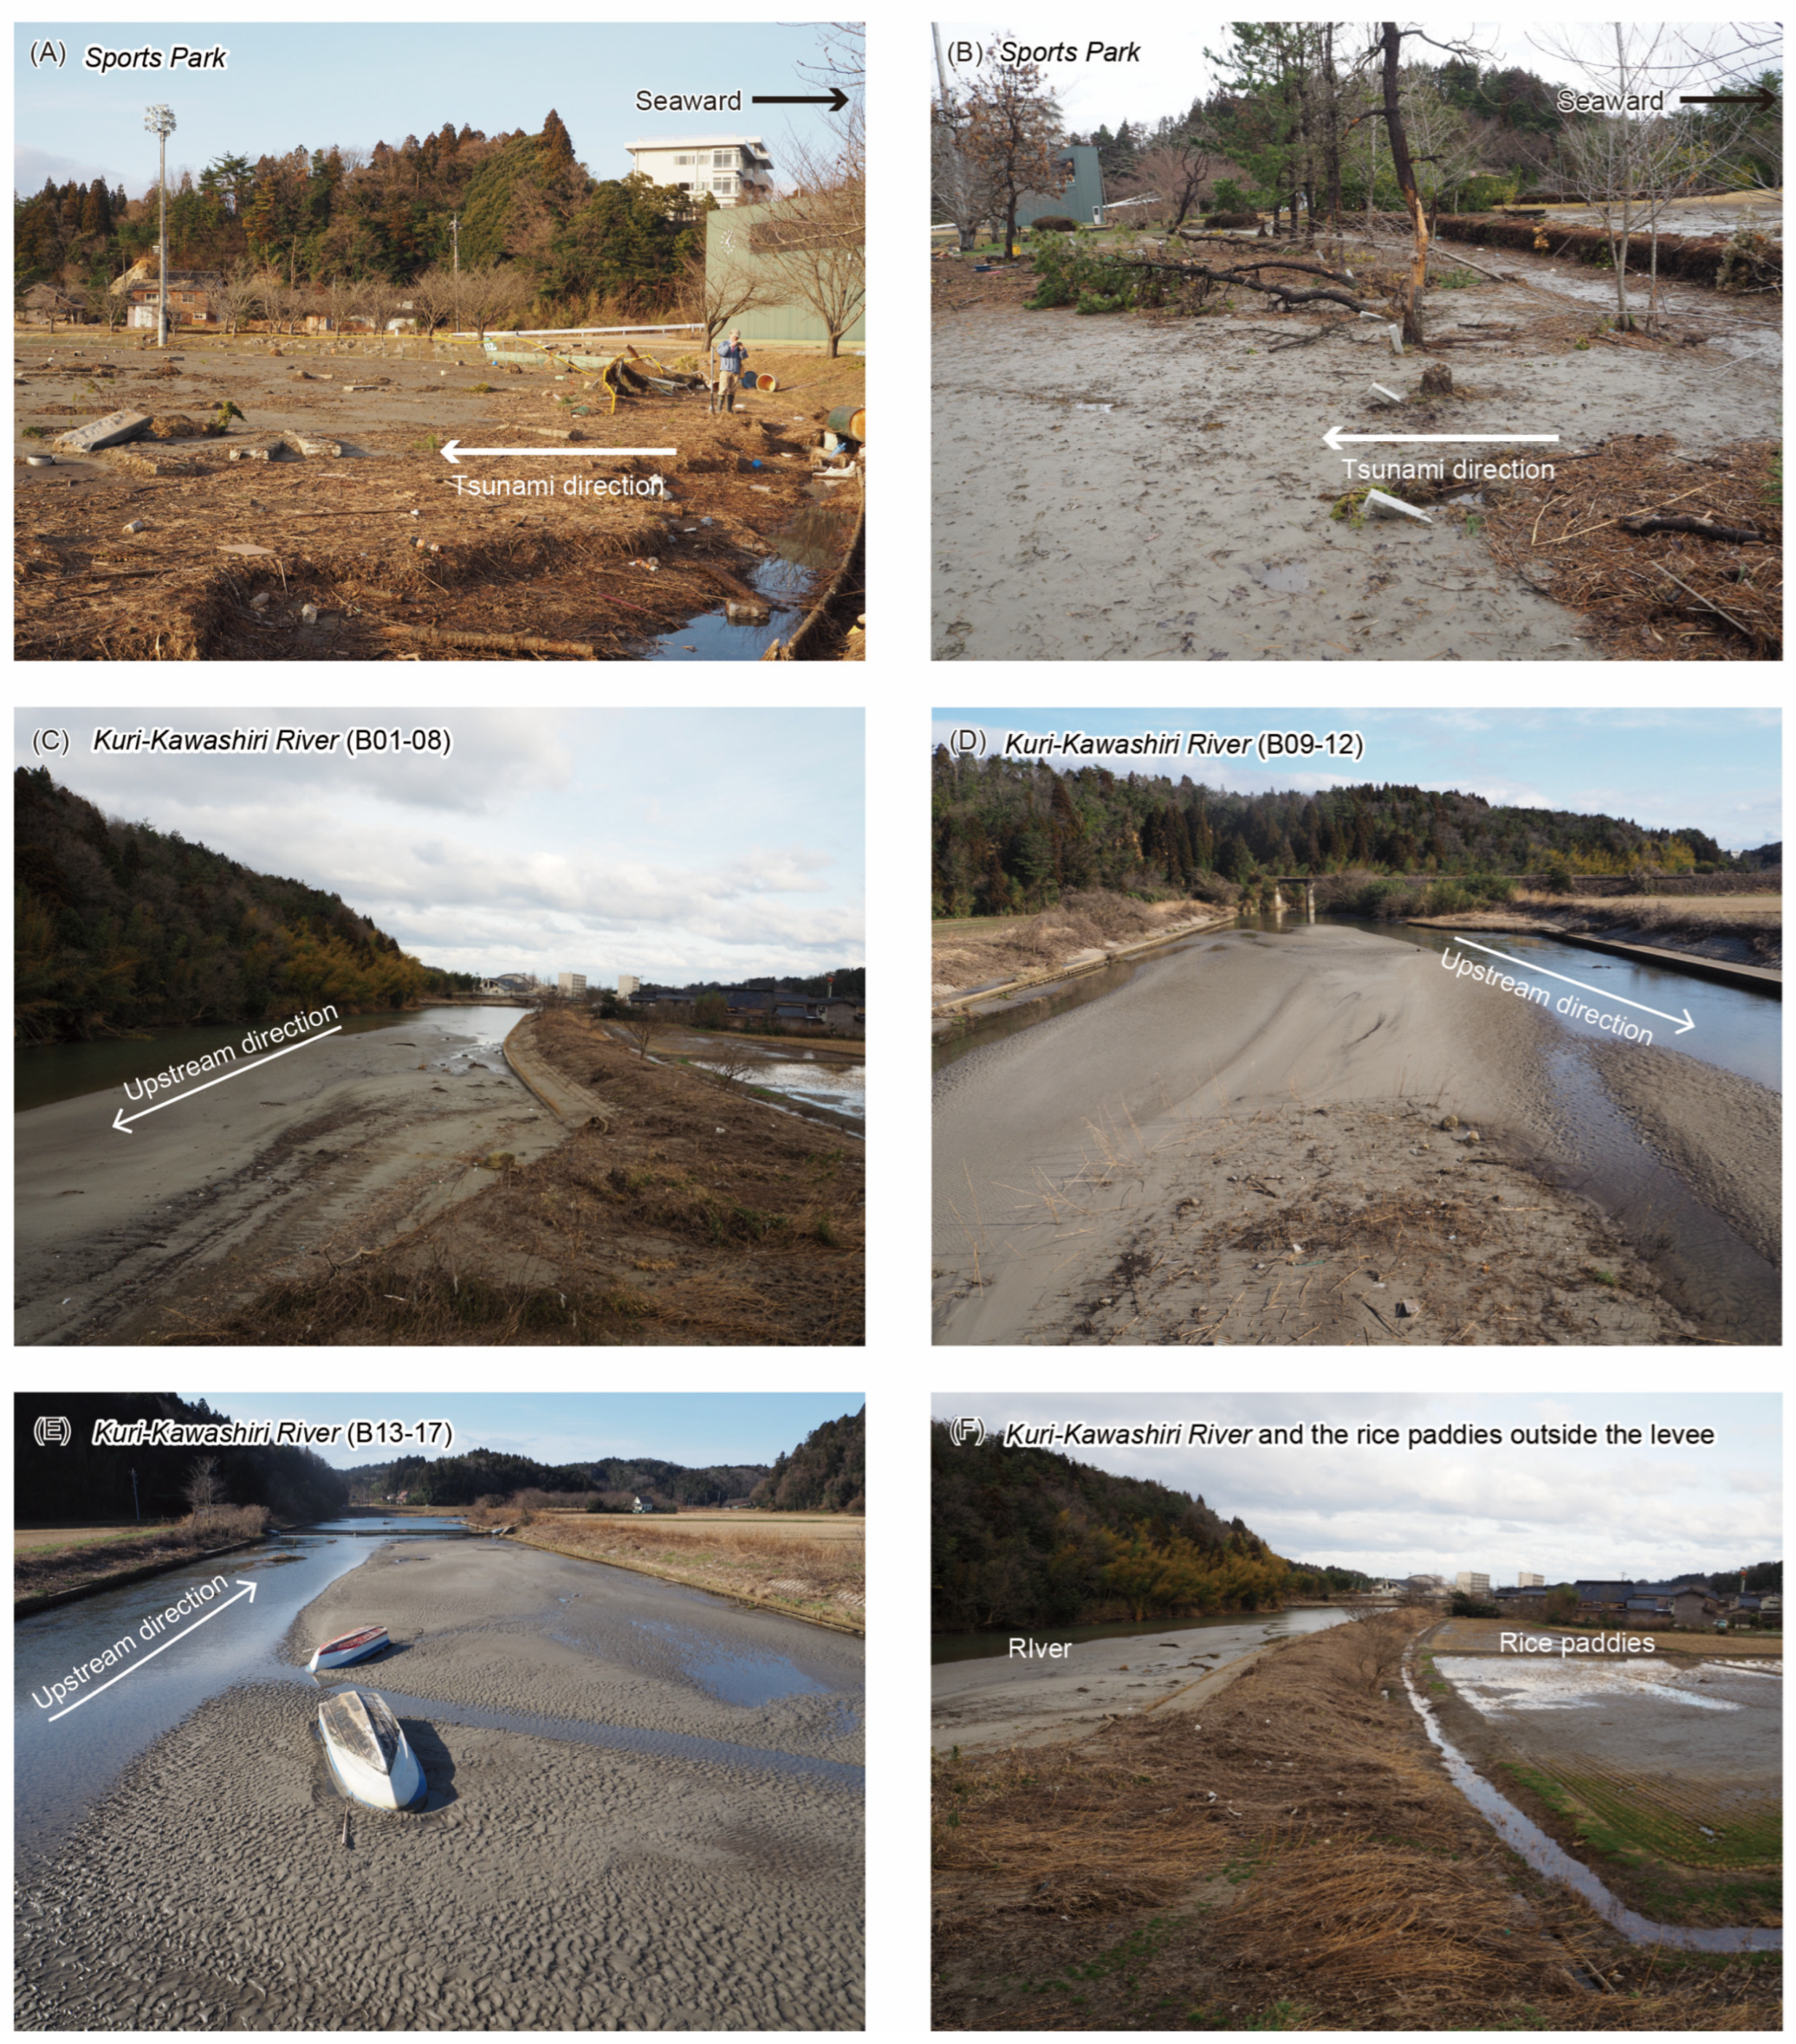
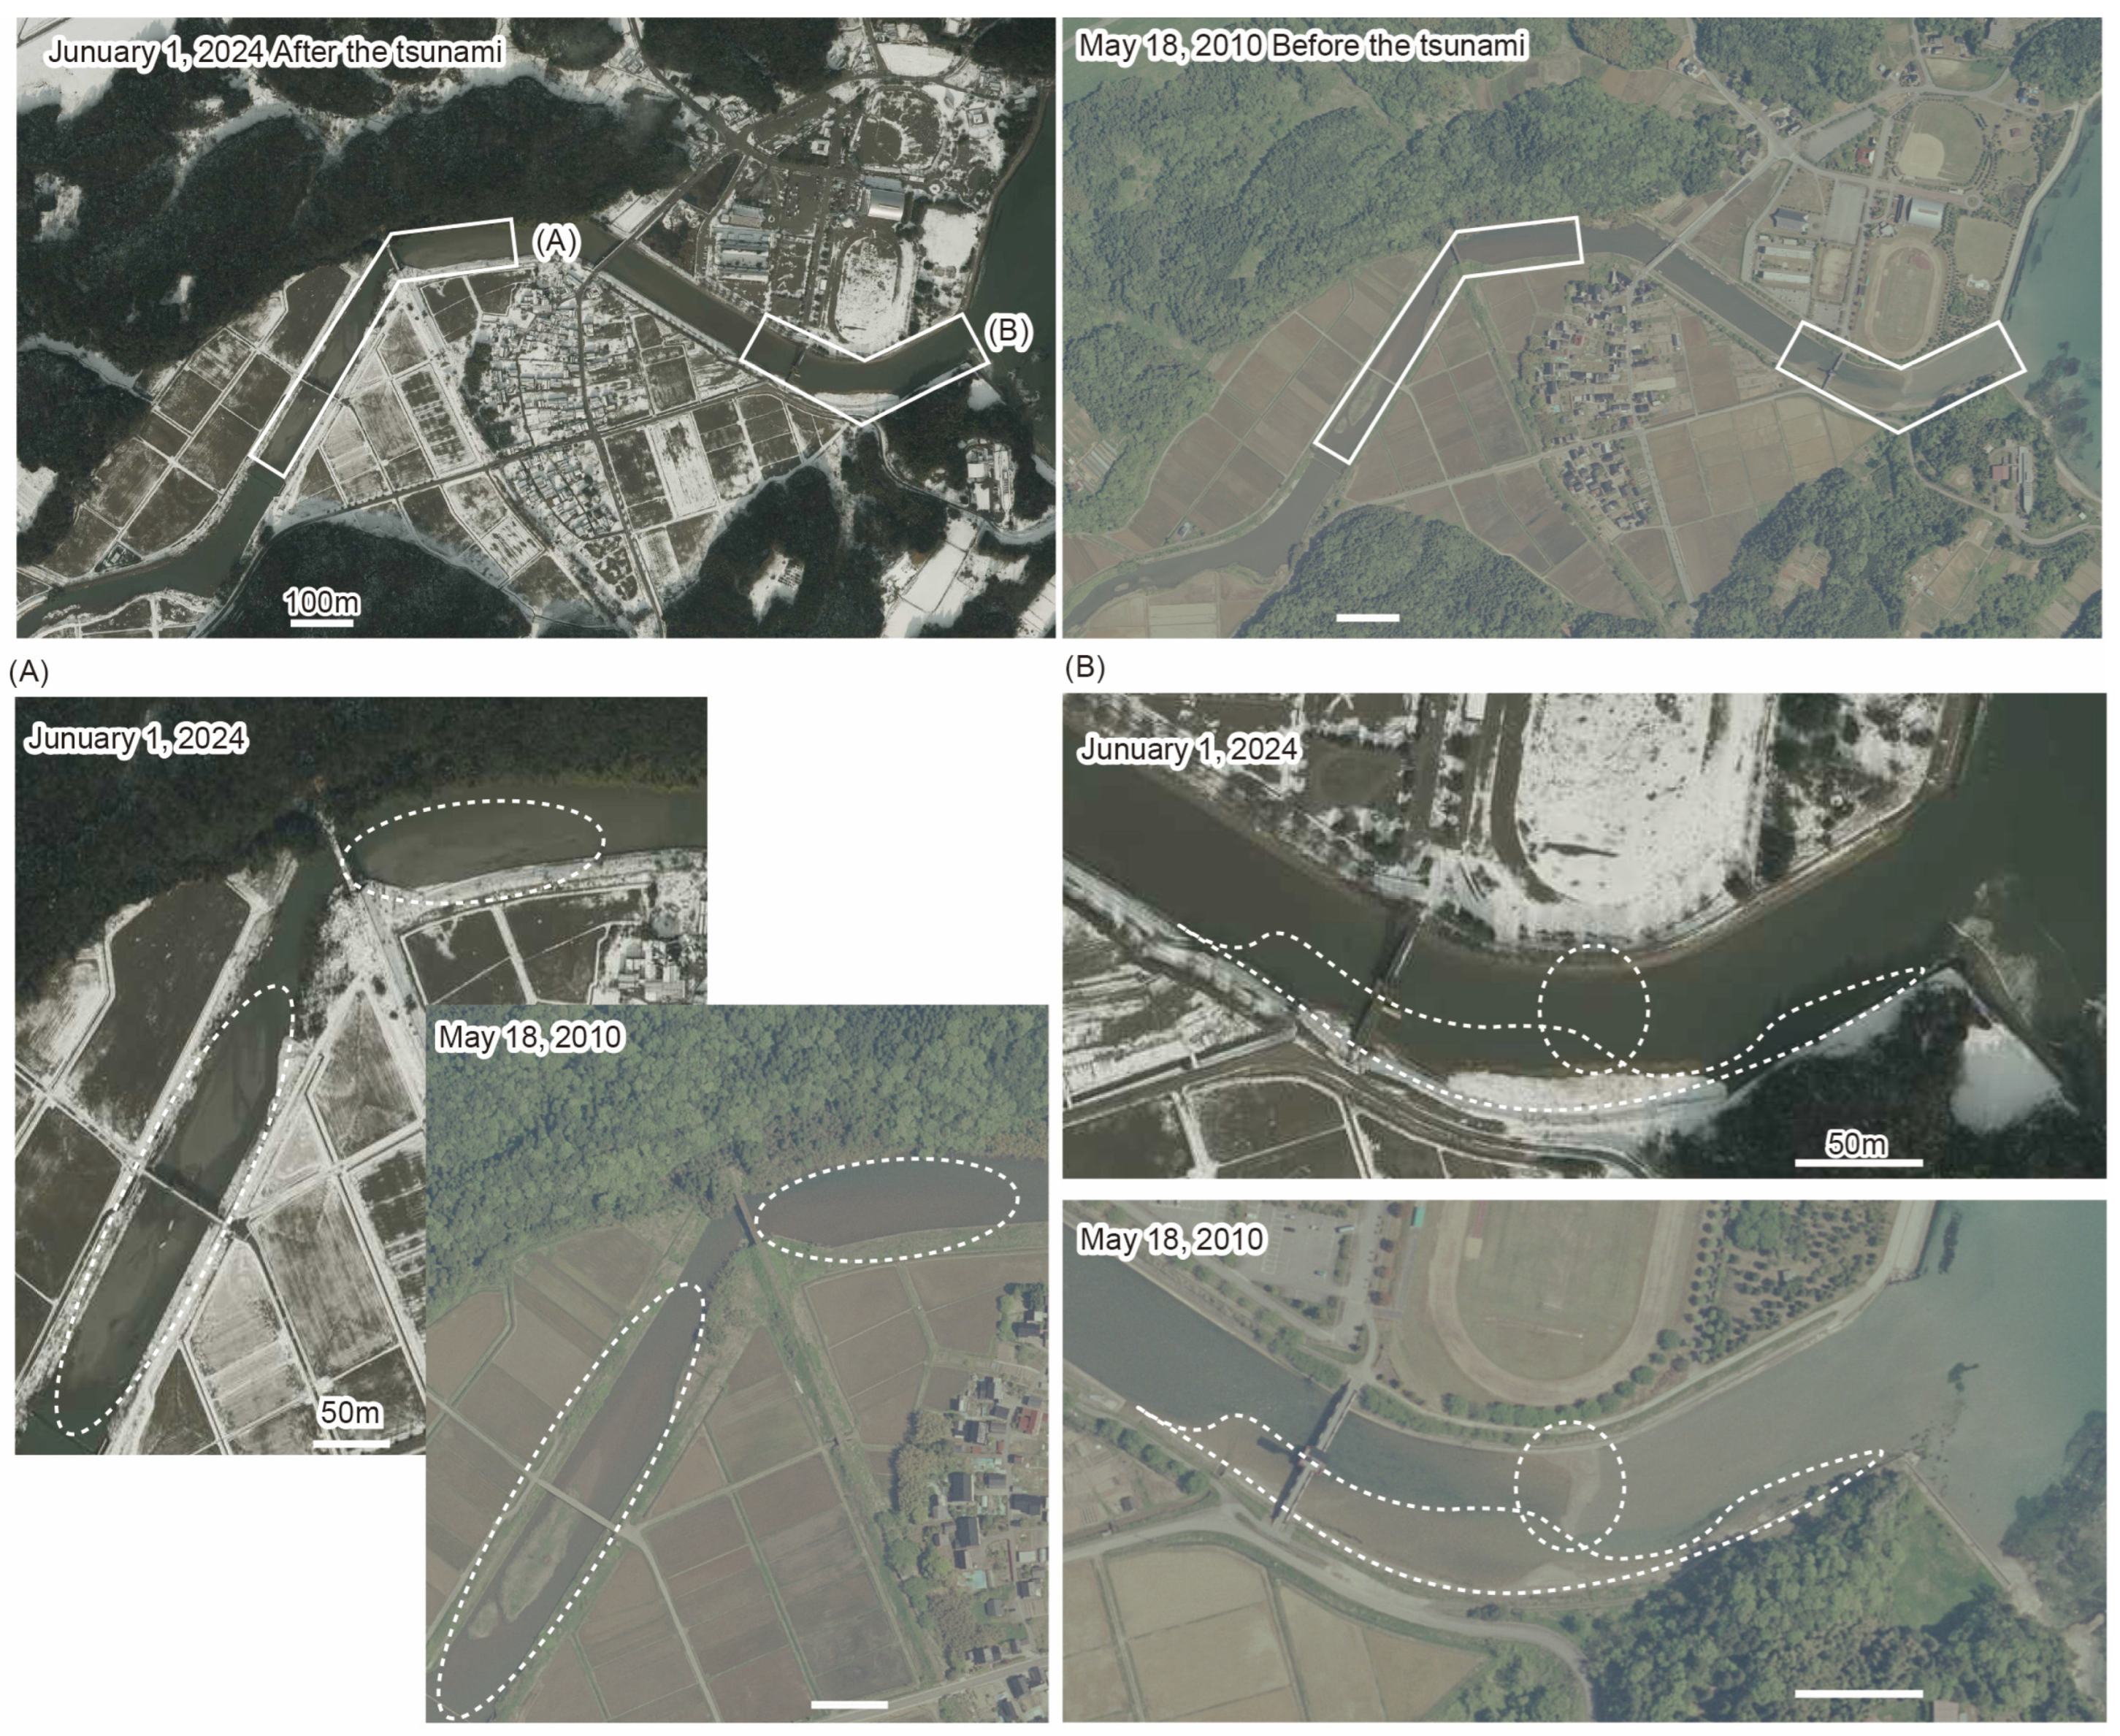
2.2. Tsunami Inundation
3. Methodology
3.1. Field Survey
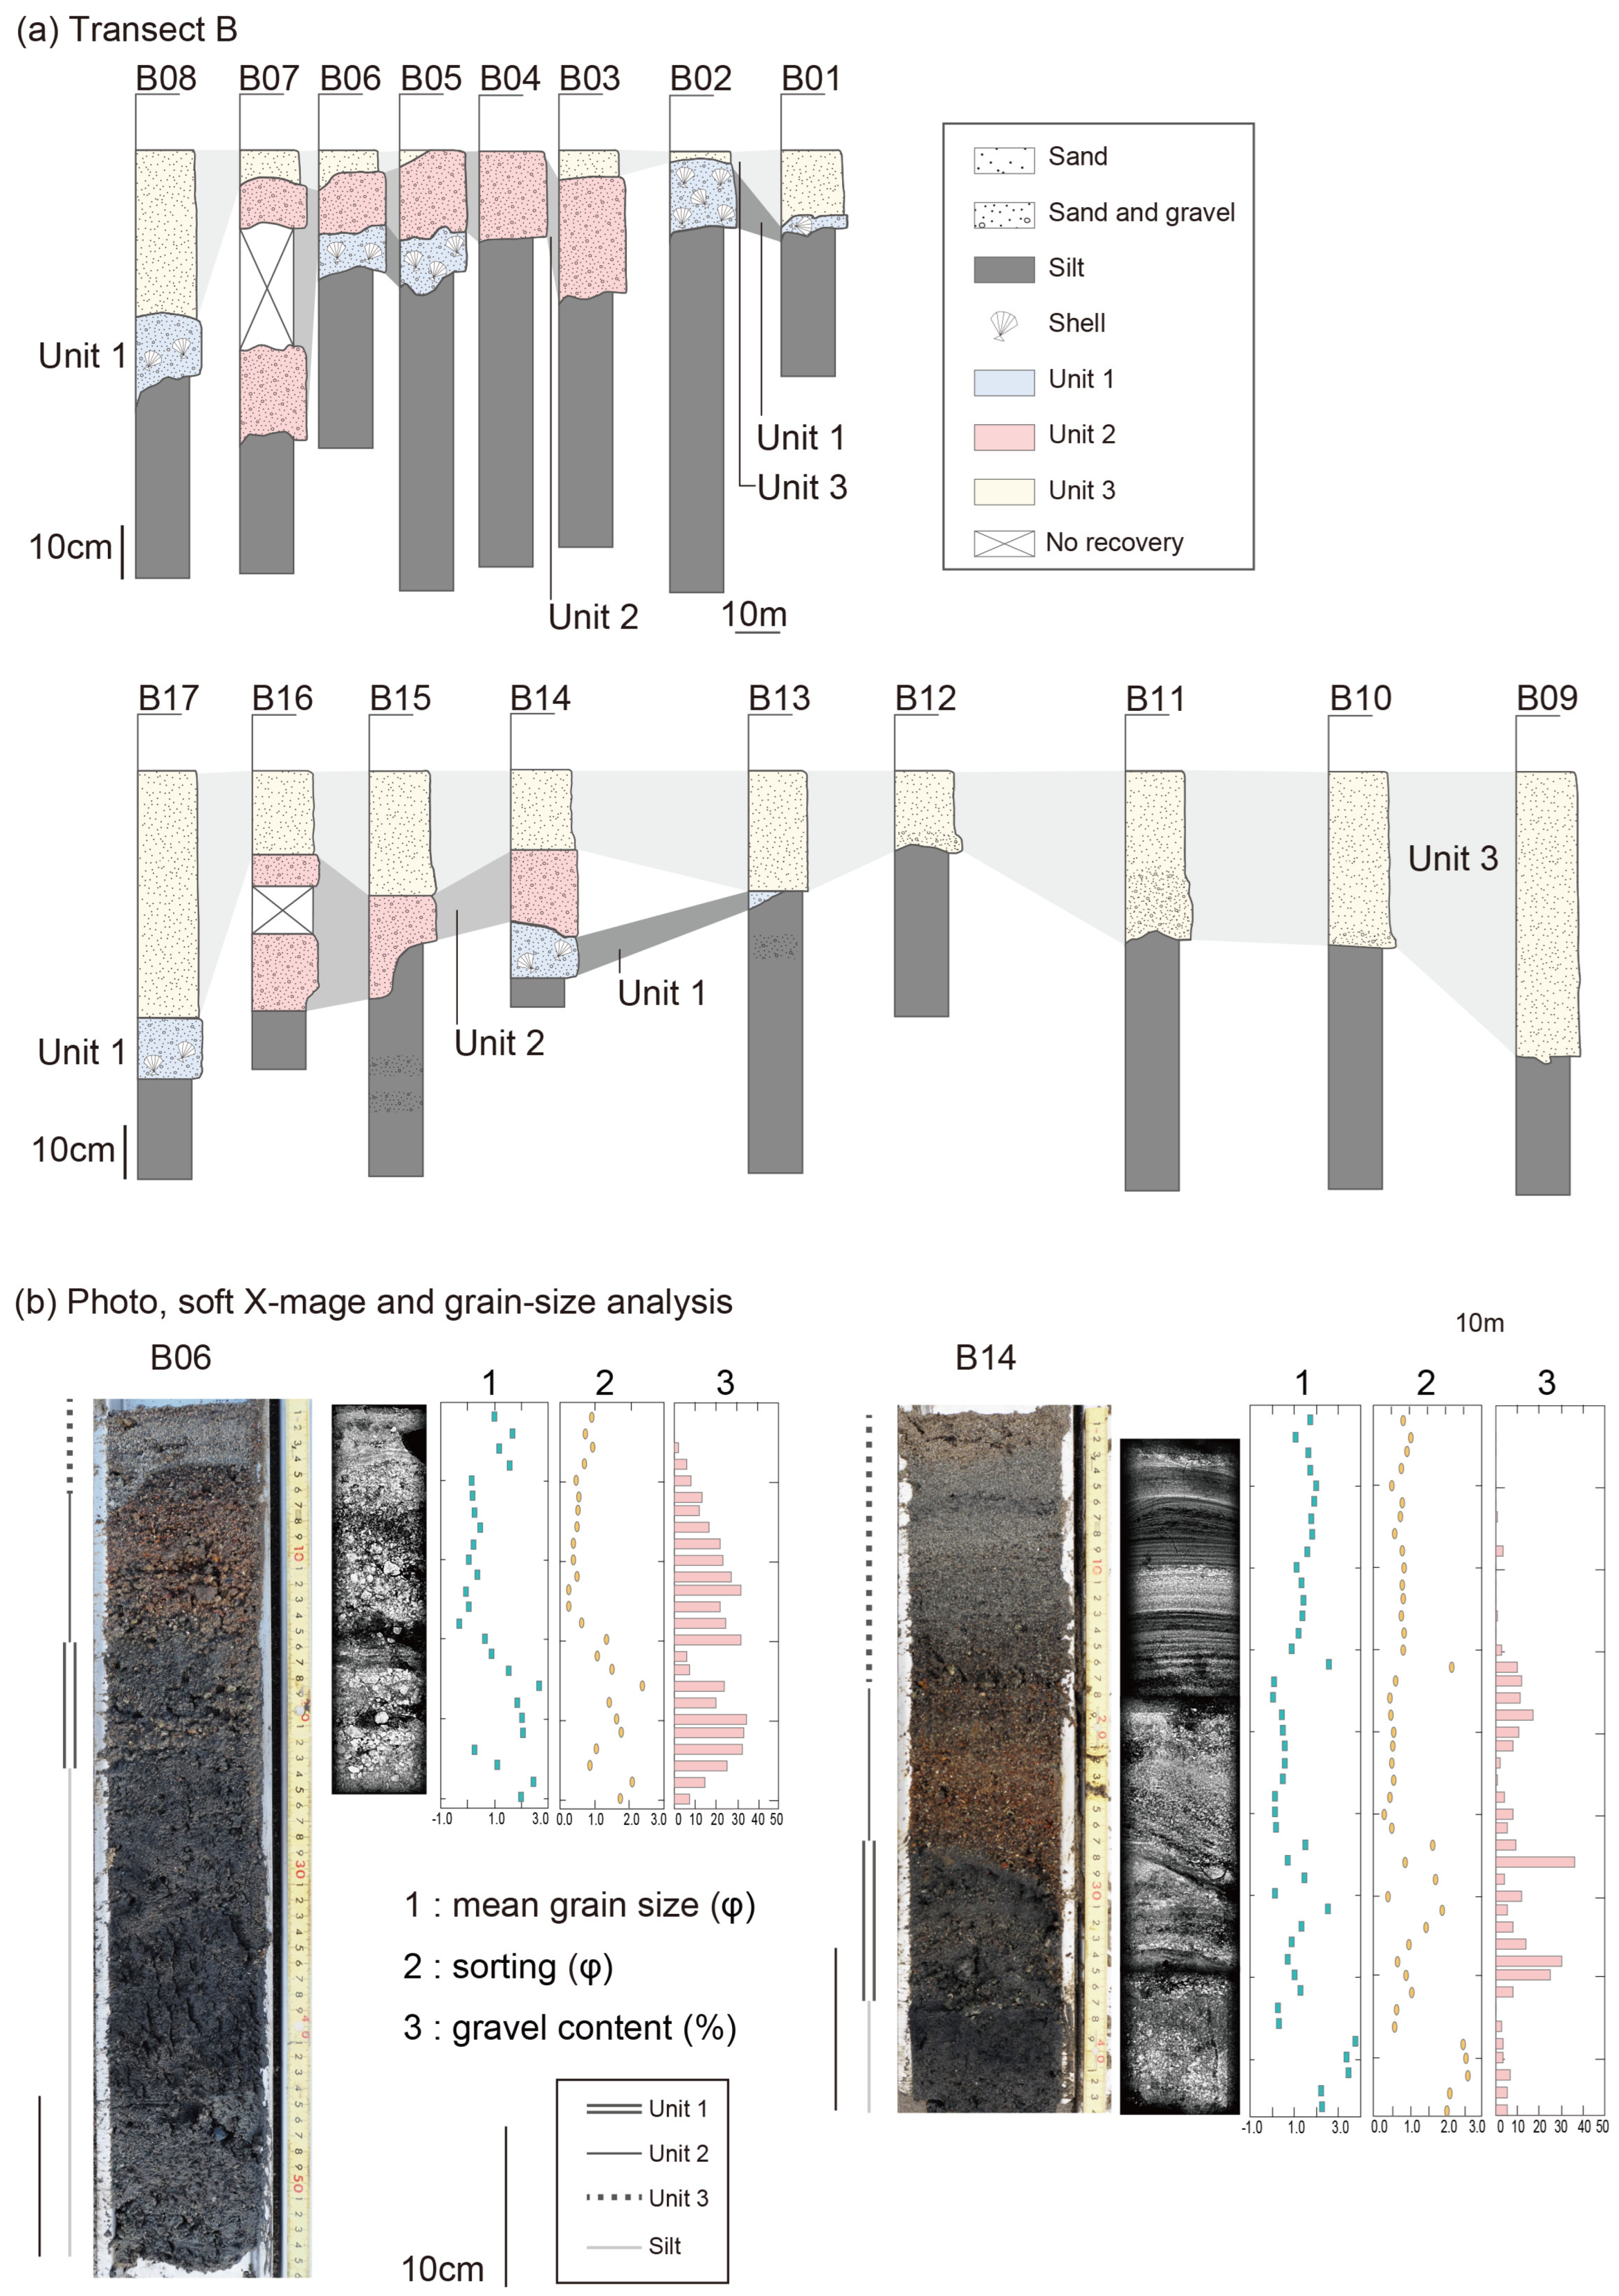
3.2. Sediment Descriptions
3.3. Grain-Size Analysis
3.4. Sedimentary Structure
4. Results
4.1. Transect A
4.2. Transect B
5. Discussion and Conclusions
5.1. Sedimentary Diversity of Tsunami Deposits in the Kuri-Kawashiri River
5.2. Discrepancies Between Sedimentary Structures of Tsunami Deposits in Terrestrial and Riverine Settings
Supplementary Materials
Author Contributions
Funding
Data Availability Statement
Acknowledgments
Conflicts of Interest
References
- Tolkova, E.; Tanaka, H. Tsunami Bores in Kitakami River. Pure Appl. Geophys. 2016, 173, 4039–4054. [Google Scholar] [CrossRef]
- Fritz, H.M.; Petroff, C.M.; Catalán, P.A.; Cienfuegos, R.; Winckler, P.; Kalligeris, N.; Weiss, R.; Barrientos, S.; Meneses, G.; Valderas-Bermejo, C.; et al. Field Survey of the 27 February 2010 Chile Tsunami. Pure Appl. Geophys. 2011, 168, 1989–2010. [Google Scholar] [CrossRef]
- Tajima, Y.; Matsuba, Y.; Yamanaka, Y.; Shimazono, T.; Kato, F. Estimation of tsunami characteristics under rough wind waves in the 2024 Noto Peninsula Earthquake. Coast. Eng. J. 2024, 66, 419–433. [Google Scholar] [CrossRef]
- Yuhi, M.; Umeda, S.; Arita, M.; Ninomiya, J.; Gokon, H.; Arikawa, T.; Baba, T.; Imamura, F.; Kumagai, K.; Kure, S.; et al. Post-event survey of the 2024 Noto Peninsula earthquake tsunami in Japan. Coastal Eng. J. 2024, 66, 405–418. [Google Scholar] [CrossRef]
- Yuhi, M.; Umeda, S.; Arita, M.; Ninomiya, J.; Gokon, H.; Arikawa Baba, T.; Imamura, F.; Kumagai, K.; Kure, S.; Miyashita, T.; et al. Dataset of Post-Event Survey of the 2024 Noto Peninsula Earthquake Tsunami in Japan. Sci. Data 2024, 11, 786. [Google Scholar] [CrossRef] [PubMed]
- Goff, J.; Chagué-Goff, C.; Nichol, S.; Jaffe, B.; Dominey-Howes, D. Progress in palaeotsunami research. Sediment. Geol. 2012, 243, 70–88. [Google Scholar] [CrossRef]
- Jaffe, B.E.; Gelfenbuam, G. A simple model for calculating tsunami flow speed from tsunami deposits. Sediment. Geol. 2007, 200, 347–361. [Google Scholar] [CrossRef]
- Atwater, B.F. Evidence for great Holocene earthquakes along the outer coast of Washington state. Science 1987, 236, 942–944. [Google Scholar] [CrossRef]
- Shanmugam, G. Process-sedimentological challenges in distinguishing paleo-tsunami deposits. Nat. Hazards 2012, 63, 5–30. [Google Scholar] [CrossRef]
- Goto, K.; Chagué-Goff, C.; Goff, J.; Jaffe, B. The future of tsunami research following the 2011 Tohoku-oki event. Sediment. Geol. 2012, 282, 1–13. [Google Scholar] [CrossRef]
- Fujino, S.; Naruse, H.; Matsumoto, D.; Sakakura, N.; Suphawajruksakul, A.; Jarupongsakul, T. Detailed measurements of thickness and grain size of a widespread onshore tsunami deposit in Phang-nga Province, southwestern Thailand. Isl. Arc. 2010, 19, 389–398. [Google Scholar] [CrossRef]
- Oota, K.; Sagayama, T.; Inui, T.; Hoyanagi, K. Depositional process in response to waveform of the 2011 Tohoku oki tsunami in-undated the Atsuma gawa River in Hokkaido, Northern Japan. J. Geol. Soc. Jpn. 2017, 123, 551–566. [Google Scholar] [CrossRef]
- Switzer, A.D.; Jones, B.G. Large-scale washover sedimentation in a freshwater lagoon from the southeast Australian coast: Sea-level change, tsunami or exceptionally large storm? Holocene 2008, 18, 787–803. [Google Scholar] [CrossRef]
- Kato, H. FOSSA MAGNA—A masked border region separating southwest and northeast Japan. Bull. Geol. Surv. Jpn. 1992, 43, 1–30. [Google Scholar]
- Geological Survey of Japan; AIST. Seamless Digital Geological Map of Japan V2 1:200,000 [Dataset]. 2022. Available online: https://gbank.gsj.jp/seamless/ (accessed on 15 January 2024).
- Ozaki, M. 1:200,000 Geological Map of the Northern Part of Noto Peninsula. In S-1. Seamless Geoinformation of Coastal Zone “Northern Coastal Zone of Noto Peninsula”. 2010, p. 13. Available online: https://www.gsj.jp/data/coastal-geology/GSJ_DGM_S1_2010_02_b.pdf (accessed on 15 January 2024).
- Ushiyama, M.; Sugamura, K.; Yokomaku, S. Tsunami Casualties Caused by the Noto Peninsula Earthquake of 2024. J. JSNDS 2024, 43, 187–206, (In Japanese with English Abstract). [Google Scholar]
- Shimada, Y.; Matsumoto, D.; Tanigawa, K.; Sawai, Y. Sedimentological and micropaleontological characteristics of tsunami deposits associated with the 2024 Noto Peninsula earthquake. Sci. Rep. 2024. submitted. [Google Scholar] [CrossRef]
- The Flood Monitoring System in Rivers. Available online: https://k.river.go.jp (accessed on 26 February 2024).
- Liu, H.; Shimozono, T.; Takazawa, T.; Okayasu, A.; Fritz, H.M.; Sato, S.; Tajima, Y. The 11 March 2011 Tohoku Tsunami Survey in Rikuzentakata and Comparison with Historical Events. Pure Appl. Geophys. 2013, 170, 1033–1046. [Google Scholar] [CrossRef]
- Takada, K.; Atwater, B.F. Evidence for Liquefaction Identified in Peeled Slices of Holocene Deposits along the Lower Columbia River, Washington. Bull. Seismol. Soc. Am. 2004, 94, 550–575. [Google Scholar] [CrossRef]
- Folk, R.L.; Ward, W.C. Brazos River bar; a study in the significance of grain size parameters. J. Sediment. Res. 1957, 27, 3–26. [Google Scholar] [CrossRef]
- Yamada, M.; Naruse, H.; Ishimura, D.; Nakanishi, R.; Maehashi, K.; Kiyozuka, Y. Tsunami deposits formed in Suzu City and Noto Town by the 2024 Noto Peninsula earthquake. In Proceedings of the Japan Geoscience Union Meeting 2024, Chiba, Japan, 26–31 May 2024. U15-P73, abstract. [Google Scholar]
- Choowong, M.; Murakoshi, N.; Hisada, K.; Charusiri, P.; Charoentitirat, T.; Chutakositkanon, V.; Jankaew, K.; Kanjanapayont, P.; Phantuwongraj, S. 2004 Indian Ocean tsunami inflow and outflow at Phuket, Thailand. Mar. Geol. 2008, 248, 179–192. [Google Scholar] [CrossRef]
- Umitsu, M.; Tanavud, C.; Patanakanog, B. Effects of landforms on tsunami flow in the plains of Banda Aceh, Indonesia, and Nam Khem, Thailand. Mar. Geol. 2007, 242, 141–153. [Google Scholar] [CrossRef]
- Kon’no, E. (Ed.) Geological Observation of the Sanriku Coastal Region Damaged by the Tsunami Due to the Chile Earthquake in 1960; Contribution of Institute of Geology and Paleontology, Tohoku University: Sendai, Japan, 1961; Volume 52, pp. 1–45, (In Japanese with English Abstract). [Google Scholar]
- Bridge, J.S.; Best, J.L. Flow, sediment transport and bedform dynamics over the transition from dunes to upper-stage plane beds: Implications for the formation of planar laminae. Sedimentology 1988, 35, 753–763. [Google Scholar] [CrossRef]
- Masuda, H.; Sugawara, D.; Cheng, A.; Suppasri, A.; Shigihara, Y.; Kure, S.; Imamura, F. Modeling the 2024 Noto Peninsula earthquake tsunami: Implications for tsunami sources in the eastern margin of the Japan Sea. Geosci. Lett. 2024, 11, 29. [Google Scholar] [CrossRef]


| Transect A | ||||||||
| Location name | Distance from the coastline (m) | Grain-size analysis | Soft-X image | Thickness of tsunami deposits (cm) | ||||
| Unit 1 | Unit 2 | Total | ||||||
| A01 | 117 | 〇 | - | 4.5 | 1.0 | 5.5 | ||
| A02 | 138 | 〇 | - | 4.5 | 0.5 | 5.0 | ||
| A03 | 160 | 〇 | - | 5.0 | 0.5 | 5.5 | ||
| A04 | 184 | 〇 | - | 3.0 | 0.3 | 3.3 | ||
| A05 | 213 | 〇 | - | 3.0 | 0.5 | 3.5 | ||
| Transect B | ||||||||
| Location name | Distance from the coastline (m) | Grain-size analysis | Soft-X image | Thickness of tsunami deposits (cm) | ||||
| Unit 1 | Unit 2 | Unit 3 | Total | |||||
| B01 | 795 | 〇 | 〇 | 3 | - | 12 | 15 | |
| B02 | 824 | - | - | 11 | - | 1 | 12 | |
| B03 | 842 | - | - | 5 | 19 | 5 | 29 | |
| B04 | 848 | - | - | - | 15 | - | 15 | |
| B05 | 852 | - | - | 11 | 15 | 1 | 27 | |
| B06 | 859 | 〇 | 〇 | 7 | 11 | 4 | 22 | |
| B07 | 863 | - | - | - | 23 | 6 | 29 | |
| B08 | 870 | 〇 | 〇 | 12 | - | 29 | 41 | |
| B09 | 1000 | - | - | - | - | 51 | 51 | |
| B10 | 1020 | - | - | - | - | 30 | 30 | |
| B11 | 1060 | 〇 | 〇 | - | - | 28 | 28 | |
| B12 | 1100 | 〇 | 〇 | - | - | 14 | 14 | |
| B13 | 1120 | - | - | 2 | - | 20 | 22 | |
| B14 | 1160 | 〇 | 〇 | - | 15 | 15 | 30 | |
| B15 | 1180 | 〇 | 〇 | - | 10 | 23 | 33 | |
| B16 | 1190 | - | - | - | 19 | 18 | 37 | |
| B17 | 1200 | 〇 | 〇 | 11 | - | 44 | 55 | |
Disclaimer/Publisher’s Note: The statements, opinions and data contained in all publications are solely those of the individual author(s) and contributor(s) and not of MDPI and/or the editor(s). MDPI and/or the editor(s) disclaim responsibility for any injury to people or property resulting from any ideas, methods, instructions or products referred to in the content. |
© 2025 by the authors. Licensee MDPI, Basel, Switzerland. This article is an open access article distributed under the terms and conditions of the Creative Commons Attribution (CC BY) license (https://creativecommons.org/licenses/by/4.0/).
Share and Cite
Okada, R.; Umeda, K.; Motegi, K.; Kamataki, T.; Amano, T. Sedimentary Diversity of Tsunami Deposits in a River Channel Associated with the 2024 Noto Peninsula Earthquake, Central Japan. Geosciences 2025, 15, 153. https://doi.org/10.3390/geosciences15040153
Okada R, Umeda K, Motegi K, Kamataki T, Amano T. Sedimentary Diversity of Tsunami Deposits in a River Channel Associated with the 2024 Noto Peninsula Earthquake, Central Japan. Geosciences. 2025; 15(4):153. https://doi.org/10.3390/geosciences15040153
Chicago/Turabian StyleOkada, Rina, Koji Umeda, Keigo Motegi, Takanobu Kamataki, and Tadashi Amano. 2025. "Sedimentary Diversity of Tsunami Deposits in a River Channel Associated with the 2024 Noto Peninsula Earthquake, Central Japan" Geosciences 15, no. 4: 153. https://doi.org/10.3390/geosciences15040153
APA StyleOkada, R., Umeda, K., Motegi, K., Kamataki, T., & Amano, T. (2025). Sedimentary Diversity of Tsunami Deposits in a River Channel Associated with the 2024 Noto Peninsula Earthquake, Central Japan. Geosciences, 15(4), 153. https://doi.org/10.3390/geosciences15040153