Article

Ballasted Flocs Capture Pelagic Primary Production and Alter the Local Sediment Characteristics in the Coastal German Bight (North Sea)

1
Institut für Küstenforschung, Helmholtz-Zentrum Geesthacht, 21502 Geesthacht, Germany
2
Marine Geologie, Alfred-Wegener-Institut für Polar-und Meeresforschung, 27570 Bremerhaven, Germany
3
Institut für Geologie, Universität Hamburg, 21073 Hamburg, Germany
*
Author to whom correspondence should be addressed.
Geosciences 2019, 9(8), 344; https://doi.org/10.3390/geosciences9080344
Submission received: 27 June 2019 / Revised: 23 July 2019 / Accepted: 3 August 2019 / Published: 7 August 2019
(This article belongs to the Section Biogeosciences)

Abstract

:
Suspended, organic matter, especially in the form of adhesive extracellular polymers (EPS), tends to form flocs, which may also incorporate suspended lithogenic particles in coastal environments. With an increased settling velocity, these ballasted flocs form in a narrow zone along the coast and potentially represent a major source of pelagic primary production for the benthic community. We sought support for this hypothesis by examining our measurements of the mud content, porosity, permeability, pigment content, and specific respiration rate of sediment from the German Bight (North Sea) for signs that the pelagic zone of ballasted floc formation is affecting the local sediment characteristics. Based on a simple bottom-shear stress model and by employing empirical correlations of sediment characteristics we were able to find strong indications that this is actually the case. Our results demonstrate how ballasted flocs contribute to the benthic pelagic coupling in a high turbulence environment.

1. Introduction

Virtually the whole bottom of the German Bight in the south-eastern North Sea is covered with sediment, which by definition are particles that were deposited after transport. The youngest sediment includes the suspended particulate matter (SPM, see notations & abbreviations) that has settled last from the water column. This ongoing sedimentation process provides mineral particles to build up the bulk sediment, but it also includes bio-available organic matter to fuel the benthic nutrient turnover. Interestingly, the suspended organic particles (POM), such as living plankton organisms, detritus, and faeces, have an intimate link with fine lithogenic particles such as silt and clay, as they have similar settling velocities. Various studies report settling velocities of live and dead organic matter in the range of 20 to 300 m d−1 [1,2,3,4], although some estimates are as low as 0.2–0.9 m d−1 [5], and some plankton species are buoyant (e.g., Noctiluca sp.). Employing the Stokes equation for the terminal sinking velocity of spheres, the settling velocities of particulate organic matter correspond to the settling velocities of quartz spheres with diameters in the range of 4–70 µm. This size corresponds well to silt with a 4–63 µm grain size [6] and consequently, silt particles and POM settle under similar hydrodynamic conditions. Moreover, it has been shown that POM can capture fine mineral particles into flocs [2,7], especially when extracellular polymeric substances (EPS) are present, and that these organic-inorganic flocs may settle faster than pure POM or silt [8,9,10].
This coupled sedimentation of POM and fine mineral particles also affects the surface sediment. In particular, the sticky EPS increases the shear resistance of the sediment and thereby substantially reduces the sediment mobility [11,12]. In the absence of EPS, the sediment mobilization and transportation can be described with the Shields Curve. Its dimensional form (Figure 1A) shows the critical bed shear stress for the mobilization of a specific grain size and clearly illustrates that finer sediment particles of a given kind (quartz in Figure 1A) generally require less bottom shear stress for mobilization than coarser particles of the same material. By assuming typical values for the characteristics of the sediment and water column in the German Bight, the dimensional Shields Curve further illustrates that the thresholds for the motion and suspension of fine particles < 63 µm (silt & clay) are very close. Thus, fines should be washed away as soon as the sediment is mobilized. The winnowing of fine particles from mixed sediment has been described, e.g., by Baas et al. [13]. In sand size and coarser sediment, the thresholds for motion and suspension are substantially apart, which enables these coarser sediments to be transported as bed load to form migrating bed forms.
Floc sedimentation is opposed by resuspension and lateral transport. The total bed shear stress evoked by the wave orbitals and tidal current as calculated with the TRIM model (coastMap, see [16]) in our study area exceeds the critical shear stress for the mobilization of the < 63 µm fraction (τ ≈ 0.12 N m−2) in water depths shallower than 30 m (Figure 1B). The bed shear stress at the 15 m mark is approximately 1 N m−2, which corresponds to a critical grain size of 1800 µm. From these simplistic considerations, one would even more simplistically expect that fine mineral particles accumulate in deeper parts of the German Bight, where the bed shear stress is sufficiently low to form muddy sediments. The local depot center of the coastal German Bight is the Helgoland Mud Area. Likewise, the high-energy environment in shallow water depth should remove fine particles, whereby the remaining coarser particles form well-sorted sands with a high permeability and low content of fine material.
However, the presence of sticky EPS in the sediment may change the situation, as it significantly increases the particle adhesion and thus increases the critical shear stress for particle mobilization. Therefore, as suggested by the study of Maerz et al. [10], coastal areas with an increased rate of floc formation and deposition would affect the sediment by delivering plankton biomass and fine mineral particles as sticky flocs. The sedimentation of these flocs in shallow coastal water might be discernible as a deviation from the pattern described above, where coarse, permeable sediment occurs in high-energy, shallow water while fine-grained, muddy sediment builds up in low-energy, deeper water.

Motivation for This Study

Two recent publications gave the impetus for the present study. The first one is by Maerz et al. [10], where the authors described a distinct zone of intensive floc formation and sedimentation along the coast. The second study, by Schartau et al. [17], disentangles the organic and mineral fractions of the suspended matter in the same area, and identifies a transition zone along the coast where organics and minerals contribute equally to SPM to form ballasted flocs. The authors discussed that the increased particle flux from this transition zone provides organic matter for the benthic community and affects sediment dynamics due to the stickiness of the deposited flocs.
It appears plausible that the coupled flux of organics and silt-sized minerals toward the sediment results in local sediment characteristics that deviate from the expectations based on the simplistic model described above. Thus, we examined our measurements of the mud content, porosity, permeability, contents of chlorophyll-a and its degradation product phaeophytin-a (chlorin in the following), and specific respiration rate to find linkages and patterns that support these considerations. This study aims to examine our measurements of sediment characteristics for the putative impact of ballasted flocs.

2. Materials and Methods

2.1. Working Area and Samples

The surface sediment in the German Bight was sampled during several cruises of research vessel RV Heincke in the period 2013–2016 (Figure 2, Table 1). The sediment samples were retrieved mainly from HELCOM grab samples, box cores, and multicores. Once on-board, the sediment subcores with lengths of 4 to 6 cm and a diameter of 3.3 cm were immediately taken with acrylic (Polymethyl methacrylate, PMMA) liners. These sediment cores were visually inspected, and cores with holes, bubbles, burrows, and other perturbations were rejected. Sediment cores were also rejected when all of the overlying water percolated through the sediment, because the re-wetting of such cores might entrap bubbles and thereby alter the permeability. Additional samples were taken for the measurement of the grain size, porosity, and pigment content.

2.2. Grain Size

The sediment was sampled directly from the surface sediment layer during the cruises HE-411, 412, 432, 447, 454, and 470 and were analyzed with a laser diffraction method. The samples intended for the laser-diffraction analysis were stored in the dark and refrigerated at 5 °C. The samples were then measured with a laser-diffraction particle sizer (Cilas 1180L for HE-411, 412, 432, 447; Fritsch Analysette 22 for HE-454, 470) without processing except sonication and sodium pyrophosphate prior to the analysis. An exception is the sediment of HE-411, where organic and calcareous sediment components were removed with acetic acid and hydrogen peroxide according to Hass et al. [18]. However, the HE-411 sediment was mostly well-sorted sand, and the chemical treatment had virtually no effect on the results of the grain size analysis (see [19] for details).

2.3. Porosity

The samples were taken from the surface sediment using cut-off syringes to recover the sediment without a loss of pore water. The piston core samples integrate the upper 3 cm of the sediment. The samples were then transferred into pre-weighted tubes and stored in the dark at −20 °C. The frozen samples were freeze-dried and stored in a frozen state until pigment extraction (see below). The porosity was calculated from the weight loss after the freeze-drying of a known sediment volume.

2.4. Permeability

Permeability was measured in subcores from the surface sediment of approximately 5 cm length using the falling head method [20]. The results of three respective measurements were averaged. The permeameter was calibrated with columns of glass beads with 25/150/500/875/3120 µm sizes, which had a known permeability [21]. A subset of the permeability measurements of the cruises HE-394/411/412/432/433/447, along with the 15th and 50th percentile grain sizes, are published in [19].

2.5. Chlorins

The freeze-dried samples from the porosity determination were then used for chlorin analyses. Chlorophyll-a and its primary degradation product phaeophytin-a were extracted with 90% acetone (5 °C, 24 h) and measured by means of spectrophotometry (Hach-Lange DR-6000) according to the method of Lorenzen [22]. The chlorin content was calculated as the sum of chlorophyll-a and phaeophytin-a. The porosity was normalized via ccorrected = c (1–Φ), and the resulting concentration unit µg cm−3 refers to the volume of bulk sediment.

2.6. Specific Respiration Rate

The specific respiration rate of the sediment was measured on intact cores using the percolation method of de Beer et al. [23]. The percolation method was applied consecutively to the permeability measurement on the same cores. A tapered oxygen microoptode (Pyroscience) with a 50 µm tip size was positioned in a 5 mm sediment depth by means of a micromanipulator. Then, oxygen-saturated station water was percolated through the core to oxygenize the pore space. After stopping the percolation, the oxygen concentration was recorded in a time series to calculate the respiration rate as ∆CO2/∆t. The respiration rates of at least three different locations within each core were averaged to account for the inevitable spatial heterogeneity. The specific respiration rate was normalized to 10 °C using the Q10 method, because 10 °C is approximately the long-term average temperature of German Bight bottom water. The Q10 value of 2.0 was chosen based on reported Q10 values of benthic respiration in the range 1.7–2.2 [24,25,26]. The porosity was normalized via Rcorrected = R Φ, and the resulting specific respiration rate in nmol cm−3 s−1 refers to the volume of bulk sediment.

2.7. Data Availability

The measurement results used for this study are available online as Supplementary Materials. Additional information of the individual sampling cruises are hosted by the Pangaea data center, the results of the TRIM model are available via the coastMap data portal.

3. Results

3.1. Grain Size Analysis and Sediment Description

The sampled sediment comprised fine-grained, muddy sediment with a modal grain size < 40 µm as found in the Helgoland Mud Area, sandy mud and muddy sand, and it comprised well-sorted coarse sand with a modal grain size > 700 µm as found along the coast. The most common sediment type was medium sand with a median grain size of 215 µm and variable but low contents of mud and gravel. Virtually all samples had a fraction of variable size in the clay and silt size range (Figure 3, size distribution curves), which we address as mud below.
Normalizing the grainsize relative to the size of the dominant mode (DI/Dmode) highlights that most sand-type samples had a small but distinct mode at 1/3 of the grain size of the dominant mode (Figure 3, stacked grainsize curves). This size ratio corresponds well with the ratios of interstitial void radii of tetrahedral (ri/rgrain = 0.23) and hexahedral (ri/rgrain = 0.41) packed unimodal spheres. The grain size distribution of finer, muddier sediment generally had no distinct mode at 1/3 of the size of the dominant mode.
The lowest porosity, 0.30–0.35, was observed in relatively well-sorted, coarse sand, which was accompanied with a high permeability exceeding 10−11 m2. Fine-grained, muddy sediment had a substantially higher porosity of up to 0.60 and a lower permeability of less than 10−14 m2.

3.2. Specific Respiration Rate and Pigment Content

The respiration measurements in the sense of the oxygen consumption rate were performed using the percolation method, and a typical result is shown in Figure 4. While the oxygen consumption rates commonly refer to the flux of oxygen from the water column to the sediment (flux unit: amount of oxygen per sediment surface area and time), we measured specific respiration rates, which refer to the oxygen consumption per sediment volume (unit: amount of oxygen consumption per sediment volume and time). The advantage of the specific respiration rate is that this rate is independent from the benthic exchange process (e.g., molecular diffusion, pore water advection, bio-irrigation) and is thus an intrinsic characteristic of the sediment.
Coarse, sandy sediment generally had specific respiration rates as low as 0.002 nmol cm−3 s−1. Fine sediment with a lower permeability tended to have higher specific respiration rates of up to 0.14 nmol cm−3 s−1. However, the percolation technique is limited to sediment that enables a sufficient influx of aerated water to oxidize the sediment in 5 mm depth. The seepage velocity can become so low in impermeable sediment that a substantial share of the initial oxygen content is already consumed by the upper sediment layer, so that the sediment in 5 mm depth cannot be oxidized to full saturation. In very few cases, the percolation rate was too low to compensate for the respiration of the upper sediment layer by providing any oxygen to the 5 mm layer. This situation occurred in the stations HE-432/9, HE-432/15, and HE-447/100, where the permeability was under 3 × 10⁻¹³ m2.
The specific respiration rates measured at the in-situ temperature were normalized to the long-term average bottom-water temperature of 10 °C using the Q10 method. The lowest temperature in our dataset is 11.2 °C (HE-411), which corresponds to the temperature correction of the in-situ respiration rate by the factor 0.92. The highest temperature of 19.6 °C was measured during HE-470, corresponding to a temperature correction factor of 0.51.
We analyzed the sedimentary content of chlorophyll-a and its degradation product phaeophytin-a as a proxy for the presence of phytoplankton-derived biomass. Since fresh biomass along with detritus (e.g., from fecal pellets) might be resuspended multiple times until it is worked into the sediment, we used the chlorin content in what follows, which we calculated as the sum of chlorophyll and phaeophytin. Analogous to the specific respiration rate, the chlorin contents were as low as 0.01 µg cm−3 in coarse sand, while the chlorin content was higher in finer and muddier sediment. The chlorin content peaked in the sediment of the Helgoland Mud Area with 2.36 µg cm−3. The general correlation of the chlorin content and specific respiration rate is shown in Table 2 (regression results).

4. Discussion

4.1. A Continuum of Sediment Types

Our initial assumption was that silt-sized lithogenic particles settle together with organic particles as ballasted flocs. Since the organic particles are mostly derived from phytoplankton, we measured the chlorin content (chlorophyll-a & phaeophytin-a) as a proxy for fresh, particulate organic matter. Our measurements indeed show a significant correlation of the mud content with the chlorin content (ρs = 0.69, p < 0.01), as illustrated in Figure 5a.
Pelagic suspended POM comprises labile compounds such as proteins, lipids, and polysaccharides, which results in a high bio-availability and enables high degradation rates. Here, we used the specific respiration rate as a proxy for the degradation rate and expected a pattern similar to the correlation of mud and chlorin. As shown in Figure 5b, this is indeed the case (ρs = 0.36, p < 0.01), although the correlation with the mud content appears weaker. However, a closer inspection reveals that the data of the individual cruises group along individual trends, with the same slope as the complete data, but with individual offsets. As an example, the correlations of the respiration rate and mud content for cruise HE-411 (ρs = 0.48, p < 0.01) or HE-447 (ρs = 0.68, p < 0.01) are much better than the correlation of all the combined samples (ρs = 0.36, p < 0.01). The same pattern is consistently mirrored in the chlorin data (Figure 5a), which implies a variation of the chlorin-to-mud ratio during the different cruises. Since the SPM composition varies spatially and seasonally [17], the same should be true for the degradability of the SPM and thus the specific respiration rate of the sediment once the SPM is deposited. Additional parameters such as the water depth or distance from the coast may contribute to the observed variability. As the most obvious example, the samples of HE-411 and HE-412 were taken within 4 weeks but in different working areas, and both datasets differ significantly in chlorin content and specific respiration rate.
The sediment is not only affected by the organic part of the ballasted flocs, but also by the clay- and silt-sized lithogenic part. The mud content should affect the permeability of the sediment, as the small particles may clog the pore throats and interstices of unconsolidated sediment, whereby the effective pore size decreases and the tortuosity increases. Thus, we assume an inverse correlation of the permeability with the mud content, and we show this significant correlation (ρs = −0.70, p < 0.01) in Figure 5d. In addition to the permeability, the fine particles also affect the sediment porosity, as these fine particles have a high specific surface with a substantial surface charge, which binds water to the particles. The same is true for hydrophilic POM, especially in the case of gelatinous, suspended POM. As a result, we assume a correlation of the mud content with the water content, which is expressed here as the porosity. Figure 5c shows that this is the case (ρs = 0.57, p < 0.01).
In addition to the mud content, we use the permeability as a predictor for sediment characteristics, and we chose sigmoid curves to describe the relation of the permeability with the mud content, chlorin content, and specific respiration rate. This approach is not very obvious and thus needs some explanation. For a start, in our measurements from the surface sediment, an upper threshold at a mud volume fraction of 0.15 appears (Figure 6a), which corresponds to a porosity of 0.85. This upper margin represents the porosity of mud that is just sufficiently consolidated to become sediment and is not frequently resuspended as a fluid mud. This is in good agreement with actually measured porosities (Figure 5c). The mud content is very low at the high permeability end but did not approach zero. Since the permeability might still increase as the grain size increases further (k > 1 × 10⁻⁹ m−2 corresponds to well-sorted, coarse sand with a 1 mm grain size), we also assume a lower threshold.
Due to the monotonic correlations between the mud content, chlorin content, and specific respiration rate (Figure 5a,b, Figure 6b) we fitted similar sigmoid curves for the chlorin and respiration rate to retain consistency (Figure 6a,c,d). The correlation of the specific respiration rate with the permeability is clearer (ρs = −0.62, p < 0.01) than with the mud content (ρs = 0.36, p < 0.01), which might be due to spatial heterogeneity, since the permeability and specific respiration were measured on the same sample, while the grain size and chlorin were measured on separate subsamples. However, all the measured reaction rates of the sediment with k < 10−12 m2 fall below this maximum. This might be attributed to differences in the substrate quality, or it might indicate that the percolation method we have employed for the measurement of specific respiration rates is less suited to impermeable sediment.
We interpret the low respiration rates of the highly permeable sediment as a sign of the substrate limitation of respiration. This would be the case when either the import of fresh POM is very low compared to the remineralisation rate, or when the resuspension is intense enough for a constant removal of settled particles. By contrast, if the particle flux toward the sediment compensates for remineralisation and resuspension, then the sediment accumulates mud and POM, and becomes less permeable. The substrate limitation of respiration is reduced in this accumulating sediment, and the specific respiration rate increases sharply in the permeability interval 10−12 < k <10−11 m2 (Figure 6).
In summary, we found significant and plausible correlations of the examined sediment characteristics. With an increasing water depth, the sediment changes gradually from permeable sand with low values for chlorin, mud, and the respiration rate toward impermeable silt-sand mixtures with high values for mud, chlorin, and the respiration rate. These correlations of the sediment characteristics will be employed below to detect the benthic effects of ballasted flocs.

4.2. Can We Detect a Benthic Effect of Ballasted Flocs?

Our motivation for this study was to examine the available data on sediment characteristics for indications that the intense formation of ballasted flocs, as described by Maerz et al. [10], affects the sediment, as discussed by Schartau et al. [17]. Both studies argue that the flocculation of POM with mineral particles is most intense in the region around 15 m water depth just off the Wadden Sea barrier islands and that these ballasted flocs result in an elevated settling velocity. However, since the coastal North Sea is very turbulent with frequent sediment resuspension, an elevated particle settling velocity does not necessarily result in an actual net flux of particles from the water column to the sediment. For the same reason, sediment trap observations from this area are unavailable. However, in case ballasted flocs with an elevated settling velocity result in an elevated particle flux to the sediment, this should become discernible as a local deviation from the overall spatial pattern of sediment characteristics. This directly raises the questions: What is the overall pattern, and which sediment characteristics would we actually expect?
To establish the spatial pattern for the null hypothesis that the ballasted flocs have no effect on the sediment, we treat the measured sediment characteristics as a function of the water depth because Maerz et al. [10] and Schartau et al. [17] suggest that the zone of optimum flocculation is a relatively narrow band along the coast in 12–15 m water depth. Next, we use sediment permeability as the starting point for a number of reasons. First, permeability is the parameter with the highest number of measurements and the best spatial coverage, while observation gaps exist in the other parameters (see Table 1). The second reason is that permeability can be linked to the bottom shear stress and critical grain size, which will be addressed later in this discussion. Finally, permeability is a complex sediment characteristic, which is sensitive to changes in the grain size, porosity, and even to traces of gelatinous particles that clog the sediment pores.
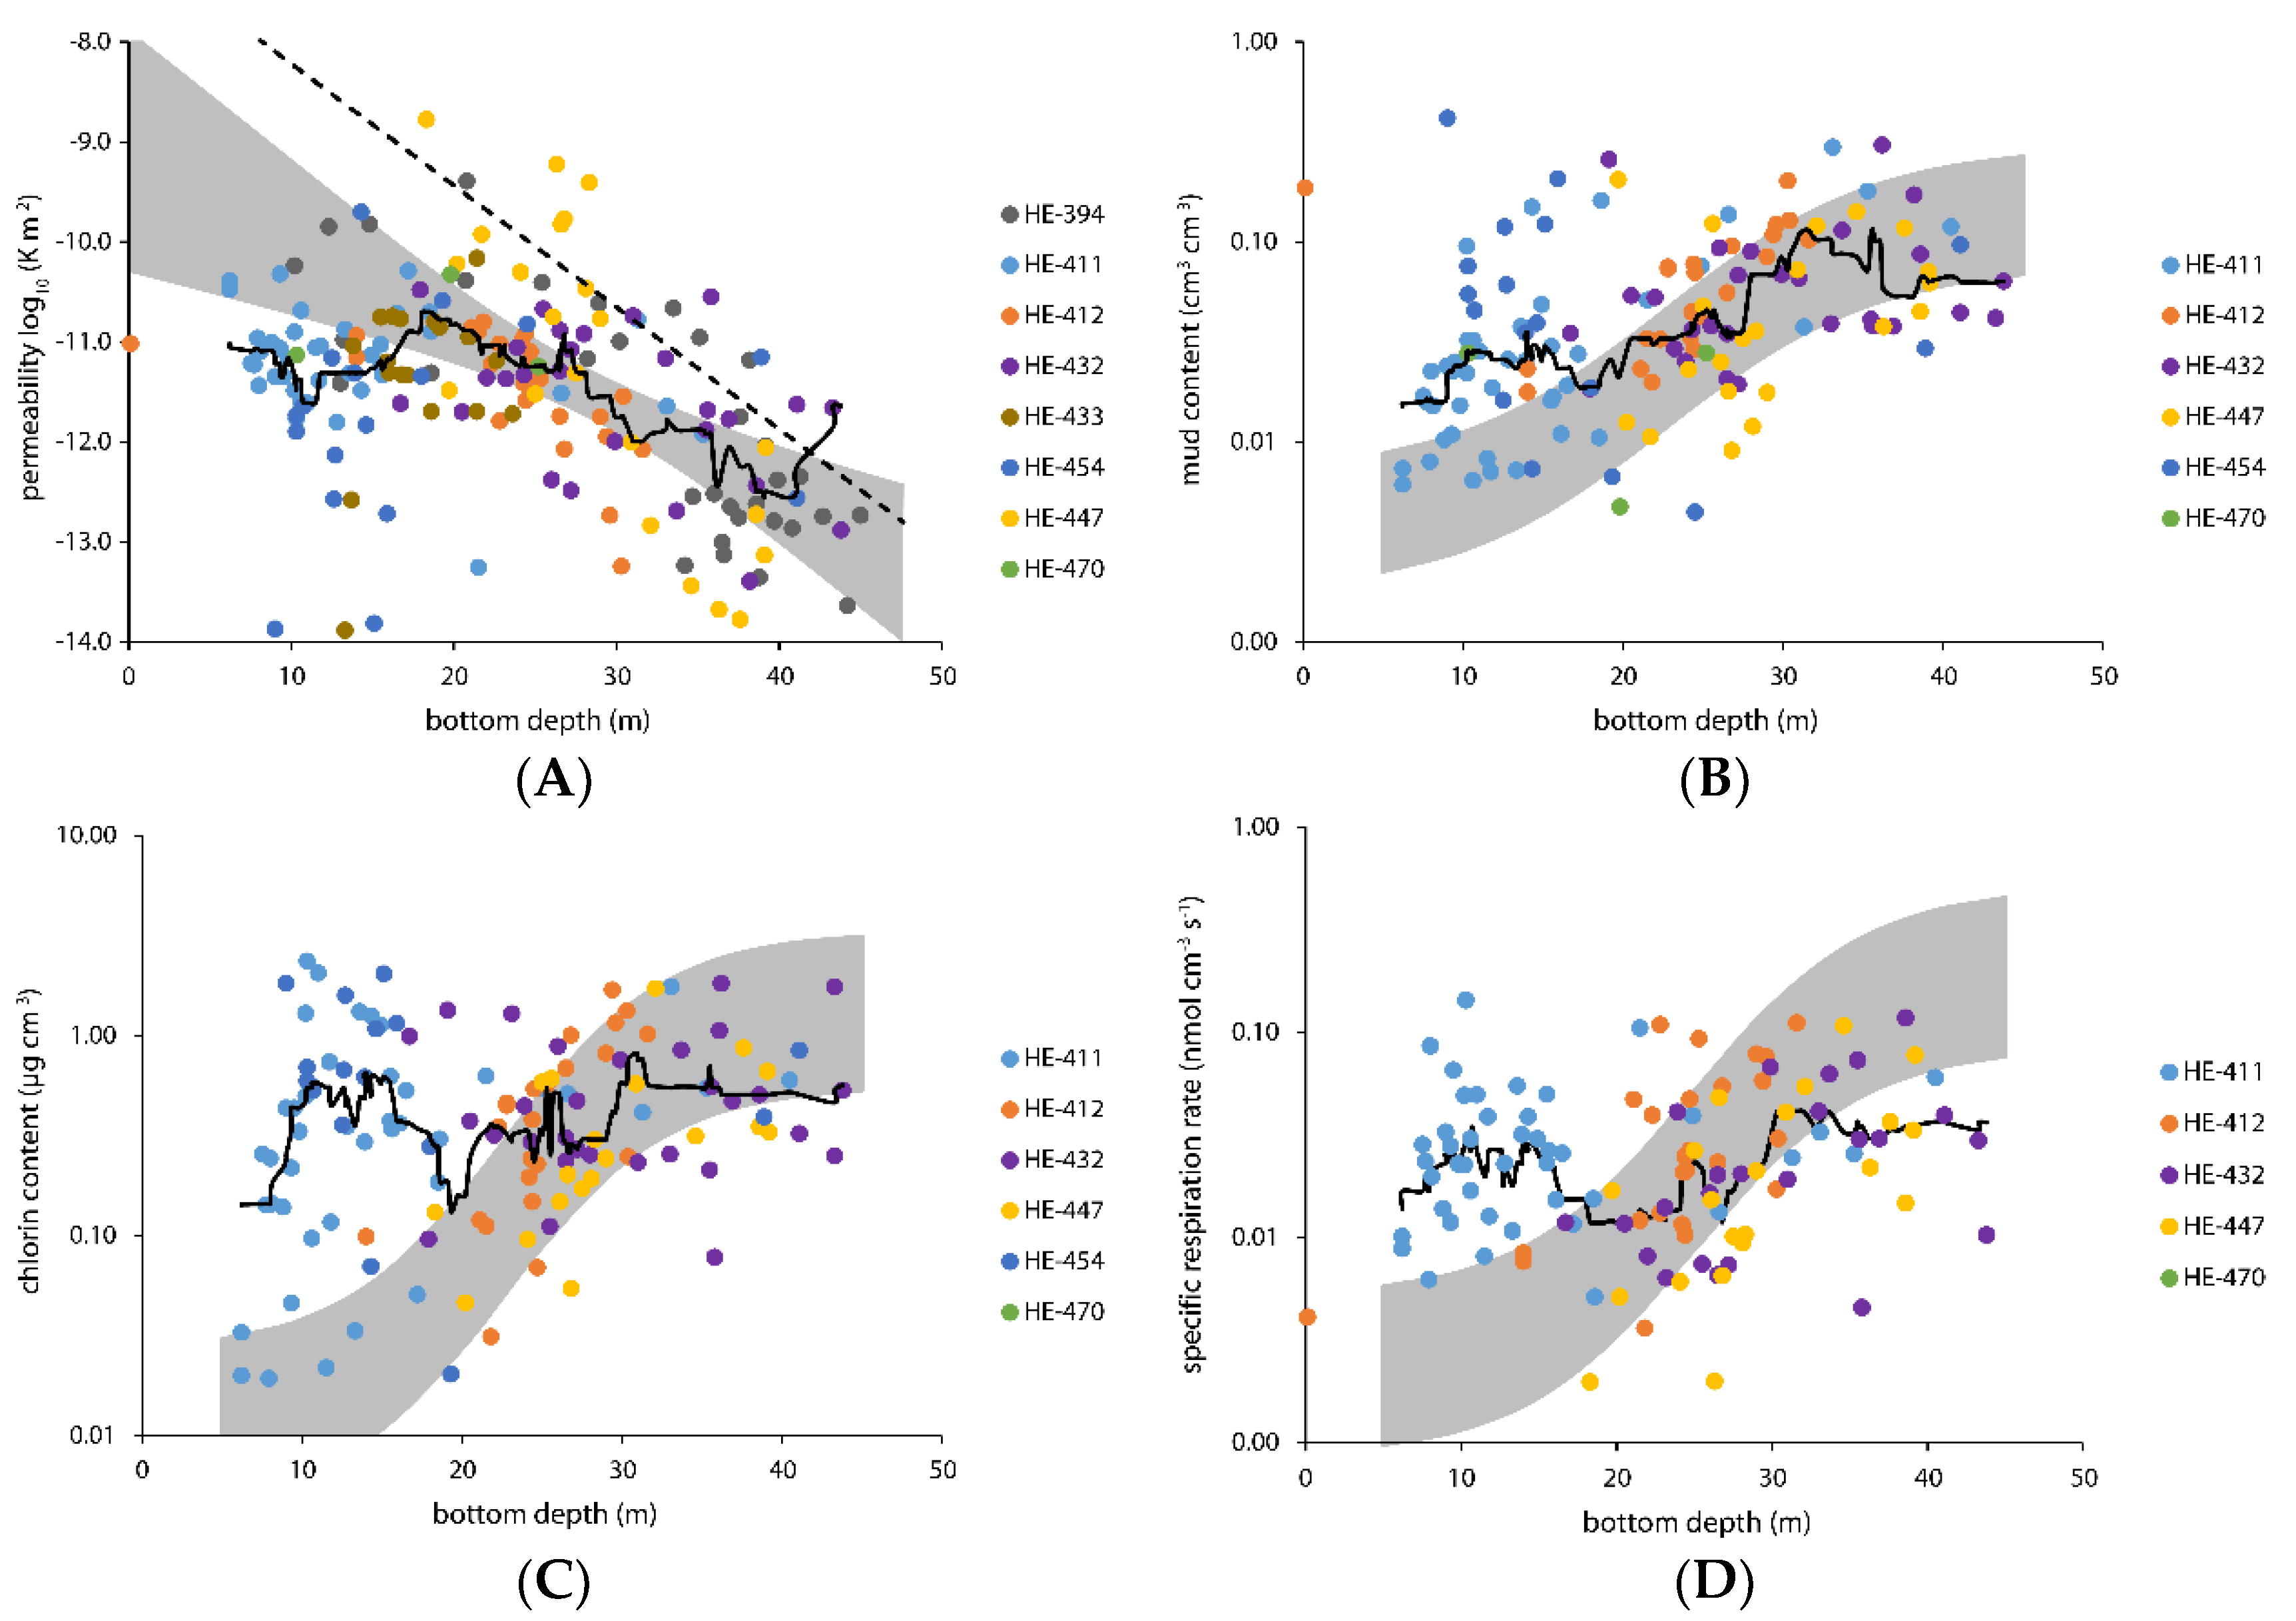
By means of a linear interpolation of the permeability measurements from the 20–45 m depth interval (Figure 7A, grey band), for which we assume that ballasted flocs have no effect, we established the expected permeability trend for the 5–20 m depth interval, for which we assume an effect of flocs. The resulting trend suggests a high permeability in shallow water and a monotonic decrease of the permeability toward deeper water. For additional support, we picked values of the annual mean bottom shear stress at our sampled locations from the TRIM model (model results from [16]) and calculated the critical grain diameter for particle mobilization [14]. We subsequently calculated the permeability of this hypothetical steady-state sediment with the Revil-Glover-Pezard -Zamora (RGPZ) permeability model [21]. Although the shear-stress based permeability estimates are at the upper end of the actually observed permeability range, the trend is similar: a high permeability in shallow water and a low permeability in deeper water (Figure 7A, dotted line).
It turns out that the running median of the observed permeability in the 5–15 m depth interval deviates substantially from the extrapolated trend and that most observations fall below the confidence band, which indicates that the permeability in the 5–15 m depth is indeed substantially lower than the null hypothesis suggests (Figure 7A). Since the permeability trend of the 20–45 m interval agrees reasonably well with the rather simple shear stress consideration, we expand this approach for the other three parameters: the specific respiration rate, mud content, and chlorin content. By employing Equations (2), (6), and (7) (Table 2), we estimated additional sediment characteristics for the null hypothesis and plotted these versus the water depth (Figure 7B–D). If the null hypothesis were true and no local process affects the sediment characteristics, then a significant share of data points should fall within the respective confidence bands (Figure 7B–D).
Our measurements on the mud content agree well with the expected trend for water depths greater than 20 m, and the running median (Figure 7B, solid line) falls within the confidence band. Around a 10 m water depth, the running median deviates significantly from the expected trend, and the mud content of the sediment appears approximately twofold higher than that expected via the bed shear stress considerations. However, the deviation is small, and there is no mud belt along the 10 m water depth. Likewise, the observed chlorin contents and respiration rates agree with the expected trends for water depths greater than 20 m. Furthermore, the running median deviates again from the expected trends at water depths of around 10 m, where the measurements exceed the expected trend tenfold in chlorin and threefold in the respiration rate (Figure 7C,D). Beside these general trends, Figure 7 also shows that individual samples may deviate substantially from these trends. This noise is an expression of the fact that the sediment parameters examined here are potentially affected by additional local processes such as bioturbation.
For a summary of the overall pattern, we found impermeable, muddy sediment with a high chlorin content and high respiration rates in the deeper parts of the study area, where a low bed shear stress (<0.2 N m−2; Figure 1B) and a low sediment mobilization (TRIM model suggests < 5% of the time) enable the sedimentation of fine material. At a 20–30 m water depth, the effect of the surface waves grows substantially, and the modelled ripple frequency increases. With sedimentation decreasing and resuspension increasing in this area, the sediment becomes significantly more permeable and concomitantly less active, as expressed by the specific respiration rate. Towards the shore, the wave-induced bed shear stress increases further, and the TRIM model predicts an even higher sediment mobility that exceeds a 25% ripple migration probability at a 10 m depth. As a result, the sediment should be even more permeable and contain less mud and chlorin due to a low sedimentation and high resuspension. However, our measurements indicate that this is not the case. Instead, we found a significant reduction in the permeability, increased contents of chlorin and mud, and higher respiration rates. The bed shear stress does not explain this pattern, but since this area is in the same depth interval as the zone of optimum floc formation, we assume that this is an effect of the settling of ballasted flocs. The outlined potential discrepancy between the model prediction (TRIM model) and the true sediment mobility offers an opportunity to test our conclusion: If our interpretation is correct, then the measurements of the bedform migration rates should be substantially below the prediction of the TRIM model due to an enhanced sediment cohesion by means of sticky EPS from settled flocs. Unfortunately, no systematic observations of bedform migration are yet available for this specific area. The reduced sediment mobility might at least explain the observation that excavations at the coastal sand removal sites Westerland I–III just off the island Sylt in 10–20 m water depth are not refilling with the otherwise abundant sand (F. Mielk & H.-C. Hass, pers. comm.). Future studies may also employ in-situ measurements, such as the particle settling velocity (LISST-ST) or acoustic backscatter profiles (ADCP), to verify that ballasted flocs enhance the particle flux toward the sediment.

4.3. After the Flocs Have Settled

The next question is: what happens to the flocs once they have settled at the sediment surface? A clue might be provided by the grain size distributions of the sampled sediment. By normalizing the most frequent grain size (1st mode) to unity, a second mode becomes apparent, which consistently has a grain size of approximately one third of the most frequent grain size. This size corresponds well to the size ratios of the interstitial void (ri) and grain diameter (rgrain) of unimodal spheres that are packed in a tetrahedral (ri/rgrain = 0.23) or hexahedral (ri/rgrain = 0.41) arrangement (Figure 3, black arrows). That means that grains with the size of the second mode just fit into the voids between quasi-spherical sand grains, while they are too big to pass through the pore throats (rpore/rgrain = 0.16, [21]), as indicated in Figure 3 by the white arrow.
This implies that the fine particles are unlikely to be deposited within the sand interstices from the particle-loaded bottom water that is percolating through a stationary bed (sand filter), since particles of the second mode size are too big to pass through the pores of the sand. Instead, a kind of particle mixing is necessary to explain how the finer second-mode sized particles are placed within the interstices of the larger first-mode sized grains. One such particle-mixing mechanism is the migration of ripples and sand waves. However, this sediment mobilization tends to remove fine particles from the sand [13]. Assuming that the sticky EPS from settled flocs might glue the fine particles to the coarser sediment to prevent the winnowing is not a solution, as this sticky EPS also tends to suppress bedform migration [11], thereby hampering particle mixing. Contrariwise, the distinct second mode is absent in cohesive, muddy sediment, which does not form migrating bedforms. A second process of benthic particle mixing is bioturbation, where burrowing and foraging animals mix the surface sediment and thereby incorporate epibenthic floc deposits into the sediment. In this case, the sticky, organic EPS not only promotes the deposition of flocs at the sediment surface but also attracts bioturbating, benthic organisms that nourish on this EPS.
Although our limited data does not enable us to conclude on the process that mixes the second-mode sized particles into the sediment, it appears plausible that the same process might be assumed for the larger flocs and that the EPS is here also significantly involved.

5. Conclusions

We have compiled our recent measurements of sediment characteristics for a range of typical sediment types from the German Bight, and established empirical equations of the interrelationships of respiration, permeability, porosity, chlorin content, and mud content. On the basis of a simple bed sheer stress model and by employing our empirical equations, we found a strong indication that ballasted flocs with a high settling velocity alter the local sediment characteristics in 10–15 m water depth. In this area, the sediment is less permeable, has higher contents of mud and chlorins, and has higher specific respiration rates as a result of the accumulation of settled organic matter. Additionally, we identified the sediment mobility as an opportunity to test our conclusions.

Supplementary Materials

The following are available online at https://www.mdpi.com/2076-3263/9/8/344/s1, Table S1: Data supplemental for Neumann et al. Ballasted flocs capture pelagic primary production and alter the local sediment characteristics in the coastal German Bight (North Sea).

Author Contributions

Conceptualization, A.N.; formal analysis, A.N.; investigation, A.N., H.C.H., J.M. and C.N.; writing – original draft, A.N., H.C.H., J.M. and C.N.

Funding

This study contributes to the project ‘North Sea observation and assessment of habitats’ (NOAH) and received financial support by the FONA program of the German Federal Ministry for Education and Research (03F0670A).

Acknowledgments

We are grateful for the excellent support of the crew of the RV Heincke and the scientific parties during our sampling cruises. We acknowledge the contributions of two anonymous reviewers in improving our manuscript.

Conflicts of Interest

The authors declare no conflict of interest. The funding agency had no role in the design of the study; in the collection, analyses, or interpretation of data; in the writing of the manuscript; or in the decision to publish the results.

Appendix A. Notation and Abbreviations

CO2oxygen concentration (µmol L−1)
Chlchlorin content per sediment bulk volume (µg cm−3)
Di, Dmodegrain size (µm)
EPSExtracellular, polymeric substance
kpermeability (m2)
MREmedian of relative error
mudLvolume fraction of mud content measured by laser-diffraction (cm3 cm−3)
P17, P8317th and 83rd percentile of relative error distribution
pprobability of null-hypothesis
POMparticulate organic matter
φporosity
Rspecific respiration rate per sediment bulk volume (nmol cm−3 s−2), temperature-normalized to 10 °C.
ρsSpearman’s rank correlation coefficient
SPMsuspended particulate matter
ttime (s)
τbed shear stress (N m−2)

References

  1. Alldredge, A.L.; Gotschalk, C. In situ settling behavior of marine snow. Limnol. Oceanogr. 1988, 33, 339–351. [Google Scholar] [CrossRef]
  2. Hamm, C.E. Interactive aggregation and sedimentation of diatoms and clay-sized lithogenic material. Limnol. Oceanogr. 2002, 47, 1790–1795. [Google Scholar] [CrossRef]
  3. Peterson, M.L.; Wakeham, S.G.; Lee, C.; Askea, M.A.; Miquel, J.C. Novel techniques for collection of sinking particles in the ocean and determining their settling rates. Limnol. Oceanogr. 2005, 3, 520–532. [Google Scholar] [CrossRef]
  4. Claessens, M.; Prast, M. Concentration of fixed plankton samples via settling: How long is long enough? J. Plankton Res. 2008, 30, 57–64. [Google Scholar] [CrossRef]
  5. Ptacnik, R.; Diehl, S.; Berger, S. Performance of sinking and nonsinking phytoplankton taxa in a gradient of mixing depths. Limnol. Oceanogr. 2003, 5, 1903–1912. [Google Scholar] [CrossRef]
  6. Wentworth, C.K. A scale of grade and class terms for clastic sediments. J. Geol. 1922, 30, 377–392. [Google Scholar] [CrossRef]
  7. Fettweis, M.; Baeye, M.; Van der Zande, D.; Van den Eynde, D.; Lee, B.J. Seasonality of floc strength in the southern North Sea. J. Geophys. Res. Oceans 2014, 119, 1911–1926. [Google Scholar] [CrossRef]
  8. Eisma, D. Flocculation and de-flocculation of suspended matter in estuaries. J. Sea Res. 1986, 20, 183–199. [Google Scholar] [CrossRef]
  9. De La Rocha, C.; Passow, U. Factors influencing the sinking of POC and the efficiency of the biological carbon pump. Deep Sea Res. II 2007, 54, 639–658. [Google Scholar] [CrossRef] [Green Version]
  10. Maerz, J.; Hofmeister, R.; van der Lee, E.M.; Gräwe, U.; Riethmüller, R.; Wirtz, K.W. Maximum sinking velocities of suspended particulate matter in a coastal transition zone. Biogeosciences 2016, 13, 4863–4876. [Google Scholar] [CrossRef] [Green Version]
  11. Malarkey, J.; Baas, J.H.; Hope, J.A.; Aspden, R.J.; Parsons, D.R.; Peakall, J.; Paterson, D.M.; Schindler, R.J.; Ye, L.; Lichtman, I.D.; et al. The pervasive role of biological cohesion in bedform development. Nat. Commun. 2015, 6, 6257. [Google Scholar] [CrossRef] [PubMed]
  12. Parsons, D.R.; Schindler, R.J.; Hope, J.A.; Malarkey, J.; Baas, J.H.; Peakall, J.; Manning, A.J.; Ye, L.; Simmons, S.; Paterson, D.M.; et al. The role of biophysical cohesion on subaqueous bed form size. Geophys. Res. Lett. 2016, 43, 1566–1573. [Google Scholar] [CrossRef] [PubMed] [Green Version]
  13. Baas, J.H.; Davies, A.G.; Malarkey, J. Bedform development in mixed sand–mud: The contrasting role of cohesive forces in flow and bed. Geomorphology 2013, 182, 19–32. [Google Scholar] [CrossRef]
  14. Soulsby, R. Dynamics of Marine Sands; Thomas Telford: London, UK, 1997; ISBN 978-0-7277-2584-4. [Google Scholar]
  15. Van Rijn, L.C. Principles of Sediment Transport in Rivers, Estuaries and Coastal Areas; Aqua Publications: Amsterdam, The Netherlands, 1993; ISBN 90-800356-2-9. [Google Scholar]
  16. CoastMap Data Portal. Available online: www.hzg.de/institutes_platforms/coastmap/index.php.en (accessed on 27 June 2019).
  17. Schartau, M.; Riethmüller, R.; Flöser, G.; van Beusekom, J.E.E.; Krasemann, H.; Hofmeister, R.; Wirtz, K. On the separation between inorganic and organic fractions of suspended matter in a marine coastal environment. Prog. Oceanogr. 2019, 171, 231–250. [Google Scholar] [CrossRef]
  18. Hass, H.C.; Kuhn, G.; Monien, P.; Brumsack, H.-J.; Forwick, M. Climate fluctuations during the past two millennia as recorded in sediments from Maxwell Bay, South Shetland Islands, West Antarctica. In Fjordic Depositional Systems and Archives; Howe, J., Austin, W.E.N., Paetzel, M., Forwick, M., Eds.; Geological Society of London: London, UK, 2010; pp. 243–260. [Google Scholar]
  19. Neumann, A.; Möbius, J.; Hass, H.C.; Puls, W.; Friedrich, J. Empirical model to estimate permeability of surface sediments in the German Bight (North Sea). J. Sea Res. 2016, 127, 36–45. [Google Scholar] [CrossRef]
  20. Bear, J. Dynamics of Fluids in Porous Media; American Elsevier Publishing Company: New York, NY, USA, 1972. [Google Scholar]
  21. Glover, P.W.; Walker, E. Grain-size to effective pore-size transformation derived from electrokinetic theory. Geophysics 2009, 74, E17–E29. [Google Scholar] [CrossRef]
  22. Lorenzen, C.J. Determination of chlorophyll and pheo-pigments: spectrophotometric equations. Limnol. Oceanogr. 1967, 12, 343–346. [Google Scholar] [CrossRef]
  23. de Beer, D.; Wenzhöfer, F.; Ferdelman, T.G.; Boehme, S.E.; Huettel, M.; van Beusekom, J.E.E.; Böttcher, M.E.; Musat, N.; Dubilier, N. Transport and mineralization rates in North Sea sandy intertidal sediments, Sylt-Rømø Basin, Wadden Sea. Limnol. Oceanogr. 2005, 50, 113–127. [Google Scholar] [CrossRef]
  24. Thamdrup, B.; Hansen, J.W.; Jørgensen, B.B. Temperature dependence of aerobic respiration in a coastal sediment. FEMS Microbiol. Ecol. 1998, 25, 189–200. [Google Scholar] [CrossRef]
  25. Hancke, K.; Glud, R.N. Temperature effects on respiration and photosynthesis in three diatom-dominated benthic communities. Aquat. Microb. Ecol. 2004, 37, 265–281. [Google Scholar] [CrossRef] [Green Version]
  26. Provoost, P.; Braeckman, U.; Van Gansbeke, D.; Moodley, L.; Soetaert, K.; Middelburg, J.J.; Vanaverbeke, J. Modelling benthic oxygen consumption and benthic-pelagic coupling at a shallow station in the southern North Sea. Estuar. Coast. Shelf Sci. 2013, 120, 1–11. [Google Scholar] [CrossRef]
Figure 1. (A) Dimensional Shields Curve for spherical quartz grains (density: 2.65 g cm−3) sheared by seawater (salinity: 33 PSU, temperature: 10 °C). The solid curve indicates the critical bottom shear stress for the initiation of motion [14]; the dashed curve indicates the threshold for suspension [15]. (B) Annual average of the total bed shear stress due to wave orbitals and the residual current at the sampled locations, as estimated by the TRIM (Tidal, Residual, Intertidal Mudflat) model (coastMap).
Geosciences 09 00344 g001
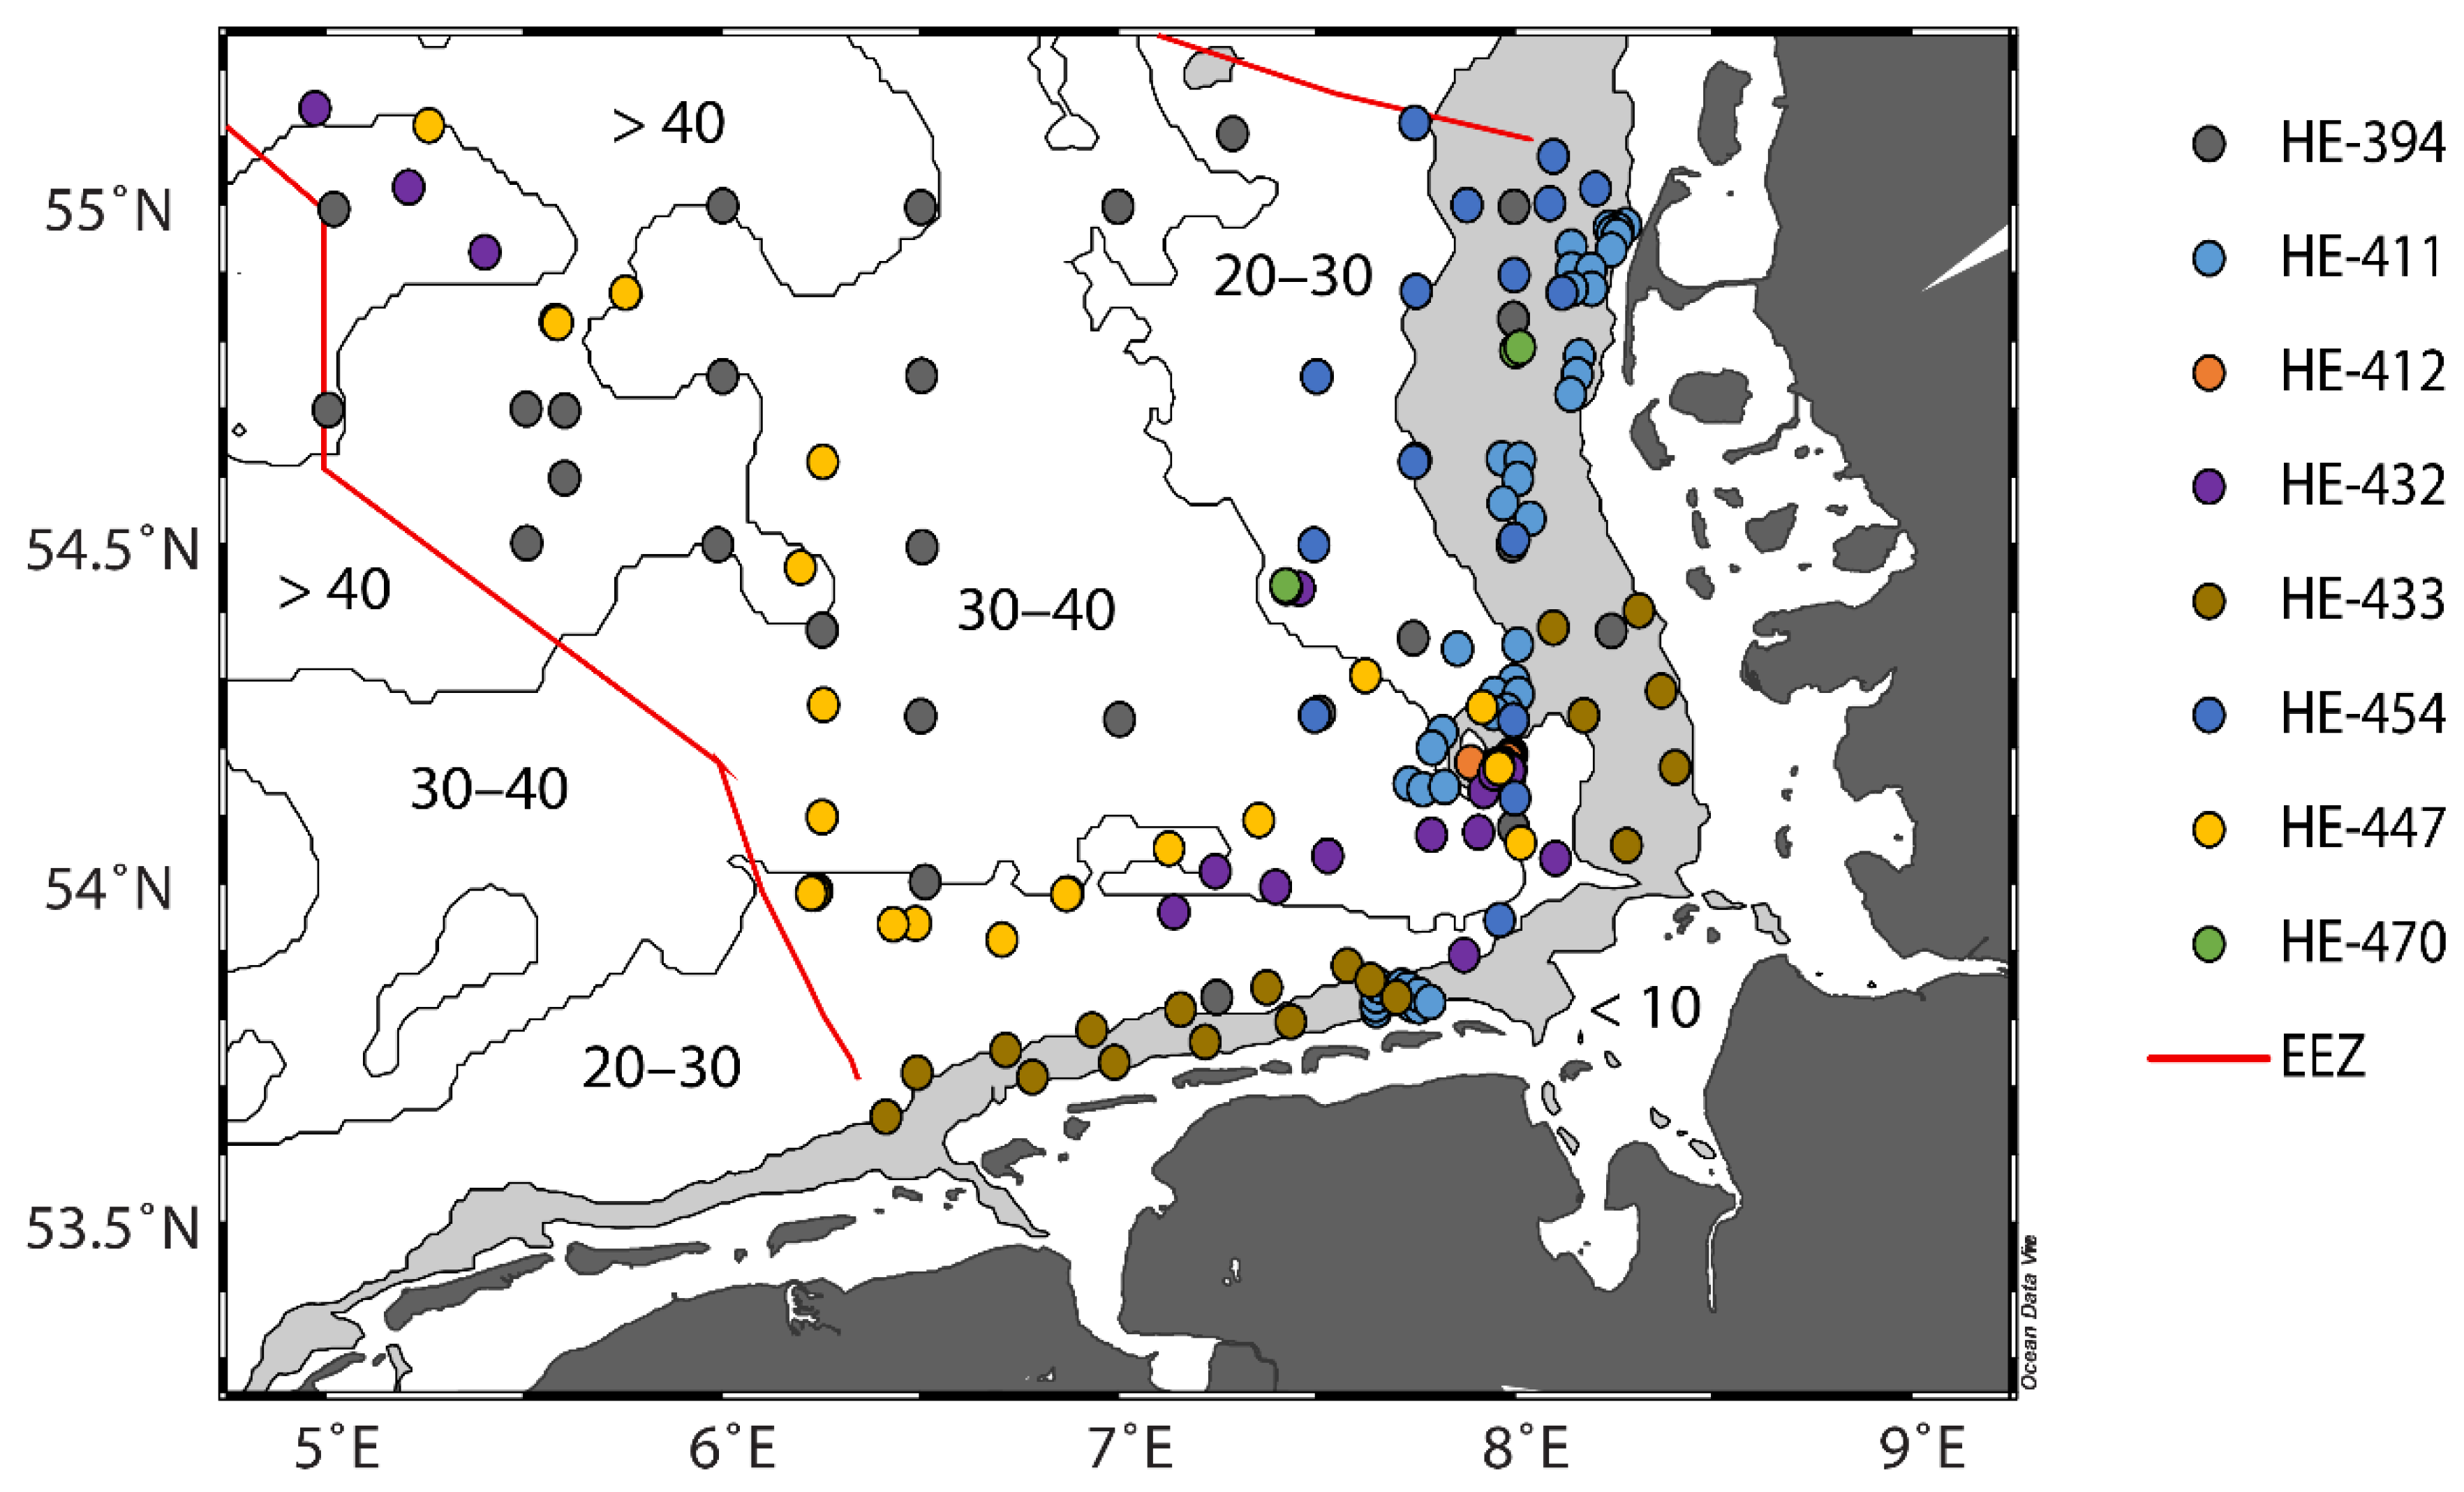
Figure 2. Sampled stations in the German Bight of the southern North Sea. The colors of the circles indicate the individual sampling cruises. The light-grey band indicates the 10–20 m depth interval in which the zone of ballasted flocs is suspected. The red outlines mark the German Exclusive Economic Zone (EEZ).
Geosciences 09 00344 g002
Figure 3. Distribution of relative grain sizes. The dominant modal grain size equals unity. N = 200 distributions (HE-411, 412, 432, 447). Individual distributions are plotted semi-transparent for improved readability; the tone is darker where multiple lines overlap. The white arrow indicates the non-dimensional size of pore throats; the black arrows indicate void radii for tetrahedral and hexahedral packing. The dimensional (raw) grain size distributions are shown in the insert.
Geosciences 09 00344 g003
Figure 4. Typical respiration measurement with the percolation method; RO2 = 0.14 ± 0.02 nmol cm−3 s−1 (HE-447/52). The light-grey background indicates core flushing with oxygenated water; the white background indicates the respiration measurement with stagnant pore water.
Geosciences 09 00344 g004
Figure 5. Correlation of the fine mineral particles (< 63 µm, mud) content with the (a) chlorin content, (b) specific respiration rate, (c) porosity, and (d) permeability. The solid lines indicate he -fit regression, grey bands indicate confidence intervals, and colours indicate the individual sampling cruises.
Geosciences 09 00344 g005
Figure 6. (a) Correlation of the fine mineral particles (mud) content from laser diffraction with the permeability. (b) Correlation of the specific respiration rate with the chlorin content. Correlation of the permeability with (c) the chlorin content, and (d) the specific respiration rate. The solid lines indicate the best-fit regression, grey bands indicate confidence intervals, and colours indicate the individual sampling cruises.
Geosciences 09 00344 g006
Figure 7. The correlation of the bottom depth with the (A) permeability, (B) mud content measured by laser diffraction, (C) chlorin content, and (D) specific respiration rate. The black line represents a 15-point running median. The black, dashed line in (A) indicates the assumed trend based on the grain size and bed shear stress considerations (see discussion). The gray bands indicate the confidence intervals of the null-hypotheses. The colors indicate the individual sampling cruises.
Geosciences 09 00344 g007
Table 1. Cruises of RV Heincke with contributions to this study. Abbreviations: grain size from the laser diffraction (gr-ld), permeability (perm), porosity (poro), chlorin (chl), and specific respiration rate (resp).
CruiseDateSamples
HE-3943/2013perm
HE-41110/2013gr-ld, perm, poro, chl, resp
HE-41210/2013gr-ld, perm, poro, chl, resp
HE-4329/2014gr-ld, perm, poro, chl, resp
HE-43310/2014perm
HE-4476/2015gr-ld, perm, poro, chl, resp
HE-45411/2015gr-ld, perm, poro, chl
HE-4708/2016gr-ld, perm, poro, chl, resp
Table 2. Compiled regression equations. The distributions of the relative errors are indicated as the 17th percentile (P17), median of relative errors (MRE), and 83th percentile (P83). Please refer to Appendix A for abbreviations and units.
EquationFormulaP17MREP83
1 Φ = 2.448   l o g 10 m u d L 0.478 ( l o g 10 m u d L ) 2 4.299   l o g 10 m u d L 1.022 0.060.010.11
2 l o g 10 k = 0.259   ( l o g 10 m u d L ) 2 2.210   l o g 10 m u d L 14.050 0.740.021.61
3 l o g 10 C h l = 0.378   ( l o g 10 m u d L ) 2 0.201   l o g 10 m u d L + 0.046 0.44−0.080.92
4 l o g 10 R = 1.232   l o g 10 m u d L + 0.185 0.610.072.38
5 Φ = 0.133   E x p ( 0.101   l o g 10 k ) 0.060.020.10
6 l o g 10 C h l = 2.1 1 + E x p ( 2.3   ( l o g 10 k + 11.0 ) ) 1.9 0.64−0.061.07
7 l o g 10 R = 2.0 1 + E x p ( 2.1   ( l o g 10 k + 11.2 ) ) 2.7 0.560.021.53