1. Introduction
Since the industrial revolution, enterprises have adopted a production model with high resource consumption and high turnover, which has increased the pressure on the ecological environment. To coordinate the relationship between economic development and ecological environment protection, the concept of green development came into being [
1]. China [
2], the UK [
3], and Japan [
4], among others, are actively promoting green development to achieve a comprehensive green transformation of economic and social development. Green development has now been adopted by many industries, including construction and finance, and has become a global consensus [
5]. Total global carbon emissions in 2020 were 5.15% lower than in 2019 [
6]. In the context of economic globalization, it is extremely urgent for enterprises to practice green and low-carbon development and achieve green transformation. According to the literature [
7,
8,
9], enterprise green development behavior (EGDB) in this study is referred to as behaviors that seek to achieve their own green development goals, where enterprises adopt an organizational behavior that is conducive to both environmental protection and enterprise development. As an integral part of green development practices, EGDB receives attention from participants such as government, society, and enterprise decision makers—each playing an active role in addressing environmental issues. For example, to improve the level of enterprise green development in various fields (traditional industries and emerging e-commerce industries, etc.), the Chinese government has made efforts to create a fair competitive market environment by improving environmental and economic policy measures. The Chinese government has also incorporated the issue of combating environmental pollution into its national economic and social development plans (e.g., the 13th Five-Year Plan and the 14th Five-Year Plan). Non-governmental organizations (NGOs) play the role of assisting in monitoring and enforcing the law in the process of environmental issues [
10]. From the perspective of enterprise organizations, different degrees of green preferences among enterprise decision makers can also make a difference in the extent of EGDB. It is not difficult to find that, in a realistic background, EGDB as an organizational behavior is generally influenced by multiple factors inside and outside the organization. Although some studies have revealed the influencing factors of EGDB [
11,
12], there is a lack of systematically revealing and validating the influencing factors and the degree of influence of EGDB.
Theoretically, the field of enterprise green development is flourishing. Academia has conducted a series of relevant studies and verifications on green development of enterprises from different industries, such as industry [
13] and manufacturing industry [
14], from different perspectives, such as environmental regulation [
15] and the green tendency of organizational decision makers [
16]. Although existing studies have demonstrated the influencing factors of enterprise green development in different industries, most of them focus on one-sided aspects, such as government environmental regulation, to study influencing factors of enterprise green development. It cannot fundamentally reveal the factors that affect EGDB in a general sense. Therefore, unlike previous studies [
11,
12], this study constructs and verifies a theoretical model of the factors influencing EGDB, and systematically sorted out the empirical research related to EGDB using meta-analysis methods. This research attempts to answer the following scientific questions: What are the influencing factors of EGDB? What is the corresponding degree of influence? Can different moderating variables play a moderating role in EGDB and its influencing factors? How can the level of EGDB be improved?
The innovation of this research is that it introduces meta-analysis into the research field of EGDB, which provides a new research idea for enhancing the level of EGDB. In addition, this research integrates the research on the influencing factors of EGDB from multiple scenarios and perspectives, which further expands the research scope of EGDB and reveals a new theoretical model of EGDB. Based on 33 empirical studies of different scenarios, published in global academic journals from 2006 to 2021, this research uses meta-analysis to construct and verify the influencing factors model of EGDB. Furthermore, this research explores potential moderating variables. As a quantitative research method, meta-analysis extracts reliable information from existing literature for analysis. This method has a high degree of objectivity, which makes the research conclusion more comprehensive and reliable. By looking into the relevant research on the existing literature of EGDB, it was found that previous researchers chose a single research object and mostly focused on industrial enterprises. Therefore, meta-analysis is urgently needed to systematically integrate the existing research on EGDB. Moreover, this study expands the research in the field of green development and organizational behavior to provide detailed suggestions and guidance for enterprise managers when they practice green development behavior. It also provides an effective reference for the government to make guiding policies on the green development of enterprises.
2. Theoretical Basis and Model Construction
Li believes that the main problem facing green development at present is the lack of top-level design of governance to guide and coordinate the green development behaviors of all subjects [
17]. Meanwhile, the researchers found, during the literature search, that the research literature on EGDB is still scarce. Fortunately, the GDBP–IE (green development behavior and performance of industry enterprise) theory explains the influence factors on the relationship between EGDB and performance, which was proposed and validated by Li et al. [
7]. The GDBP–IE theory states that, to achieve their own green development goals, industrial enterprises exist in organizations in the form of green development behaviors. In practice, industrial enterprises will form two specific organizational behaviors—green supply chain management practices (GSCMP) and cleaner production behaviors (CPB)—to achieve green development of enterprises [
7]. This type of behavior is a green behavior at the organizational level, and is closely related to people’s food, clothing, housing, and transportation [
18]. Compared with agriculture and service industries, the types of enterprises involved in the production and operation of industrial enterprises are more complex. Therefore, this study adopts the GDBP–IE theory.
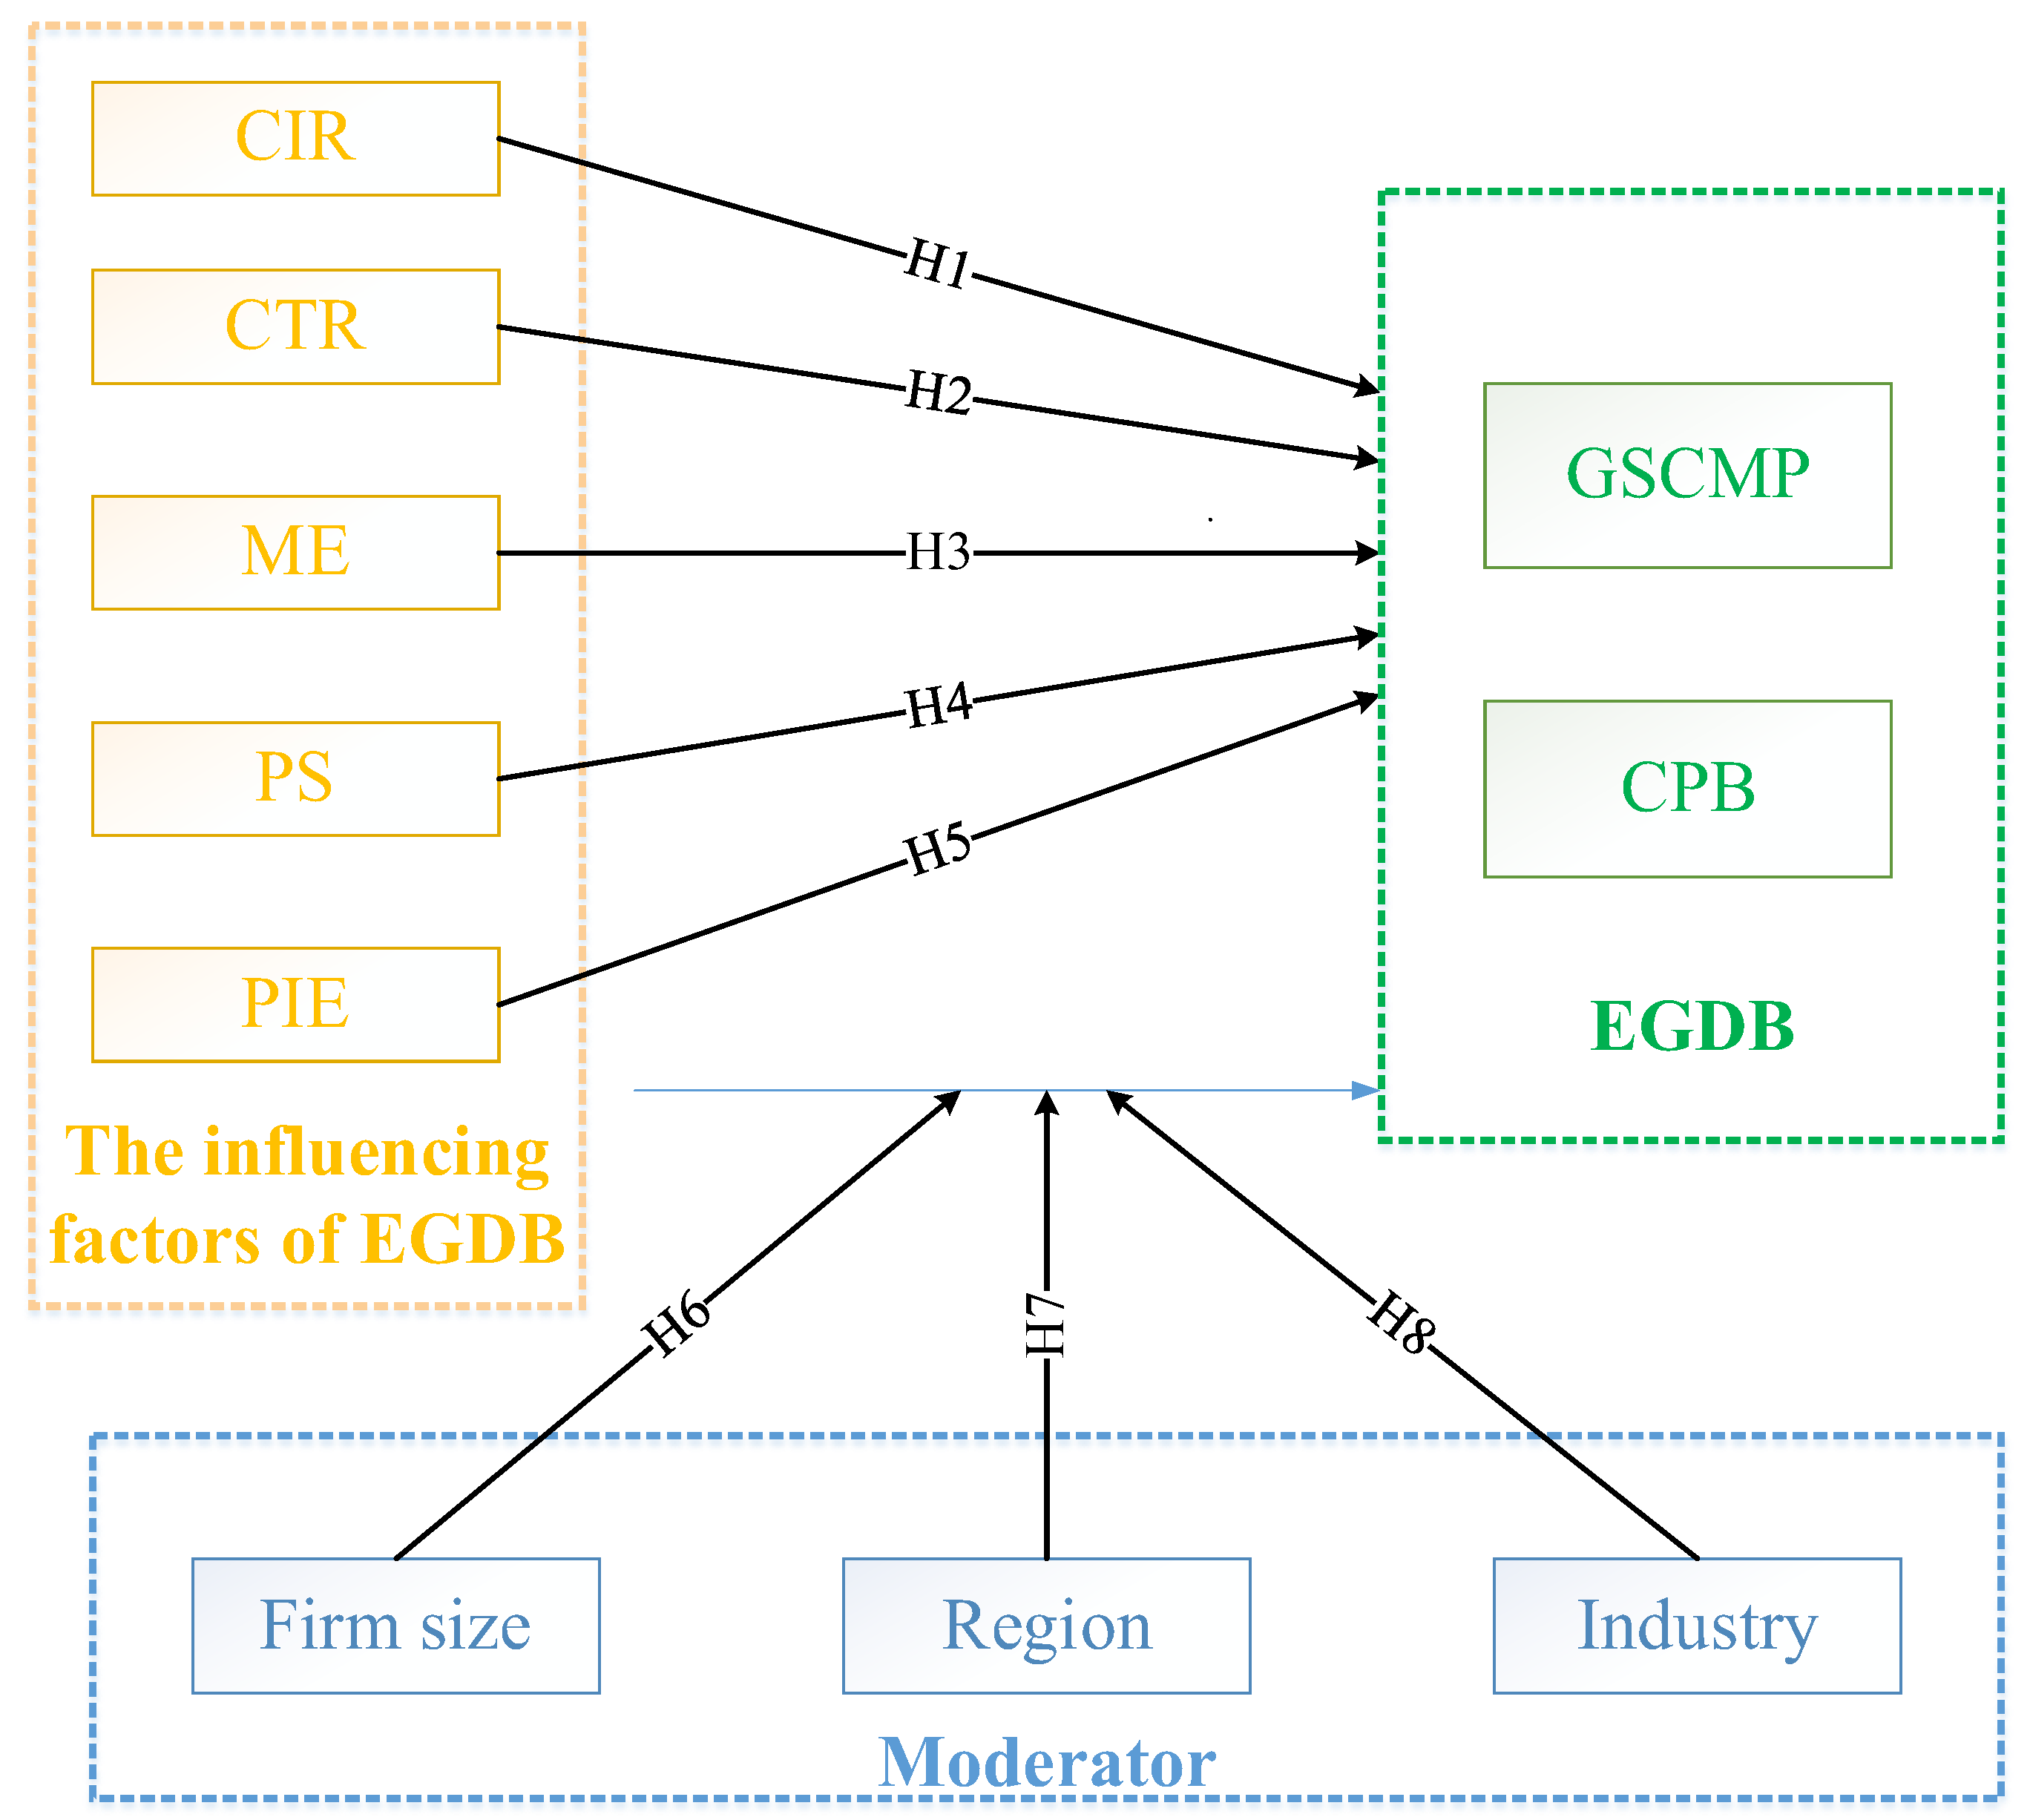
Based on the GDBP–IE theory, the influencing factors of EGDB can be divided into two levels: internal influencing factors and external influencing factors [
8]. The internal influencing factors include intangible resources and tangible resources. The external influencing factors of enterprises include market environment, public supervision, and policy and institutional environments.
2.1. Corporate Intangible Resources (CIR) and Corporate Tangible Resources (CTR)
Resource-based theory states that both tangible and intangible resources are business resources. Corporate tangible resources are used by enterprises as resources for producing output and earning profits, including financial capital, manufacturing capital, and natural capital used for the operation of the organization [
19]. Enterprises usually weigh their costs and benefits before deciding. Enterprises choose to implement only when the costs of implementation are less than the benefits of implementation [
19,
20]. Therefore, this research proposes the following hypothesis:
Hypothesis 1 (H1). CTR has a positive and significant influence on EGDB.
Contrary to corporate tangible resources, corporate intangible resources are non-physical resources, which play a key role in sustainable competitive advantage [
21]. Oprean-Stan et al. [
22] divide corporate intangible resources into two levels—knowledge resources, at the individual level, and intangible resources, at the organizational level. Based on the strategic layout of the enterprise formed by the combination of the enterprise employees’ knowledge resources and the enterprise organizational resource, innovative management strategies [
23] and other measures are adopted to promote EGDB. In addition, as the core of the organization, the background and experience of the senior managers of the enterprise will drive EGDB [
24]. Therefore, this research proposes the following hypothesis:
Hypothesis 2 (H2). CIR has a positive and significant influence on EGDB.
2.2. Market Environment (ME)
Enterprises are always in a market environment characterized by consumer purchasing preferences, competition among peer enterprises, and cooperation between upstream and downstream enterprises in the supply chain. In addition, the decision making of enterprises also needs to be based on certain market conditions, and it is impractical to make decisions based on specific circumstances [
25]. Due to the consideration of environmental and economic benefits, the market positioning of enterprises can promote cleaner production behavior [
26]. Under the pressure of customers’ demand for green products, manufacturers have to coordinate their environmental goals with development strategies [
27]. Therefore, this research proposes the following hypothesis:
Hypothesis 3 (H3). ME has a positive and significant influence on EGDB.
2.3. Public Supervision (PS)
Public supervision is mainly enacted by residents, the media, and NGOs, etc. The theory of environmental public believes that citizens have the right to monitor social environmental resources, as they are the common property of all citizens. The public has achieved the effect of supervising the environmental behavior of enterprises by exerting indirect pressure on them [
28]. Zhao [
29] believes that the participation of public supervision on environmental protection has a significant impact on the implementation of green development behavior by enterprises in the region. Therefore, this research proposes the following hypothesis:
Hypothesis 4 (H4). PS has a positive and significant influence on EGDB.
2.4. Policy and Institutional Environment (PIE)
To reduce environmental pollution problems, governments are actively introducing policies to guide enterprises to improve their green behavior. Furthermore, some enterprises with foreign trade businesses need to comply with local environmental requirements and regulations, such as through attaining ISO14001 environmental certification [
30]. Enterprises are the main target subjects of environmental regulation, and the government can indicate the direction of R&D for enterprise innovation through environmental regulation [
31]. Therefore, this research proposes the following hypothesis:
Hypothesis 5 (H5). PIE has a positive and significant influence on EGDB.
2.5. Moderator
In the meta-analysis, as the third variable, the moderator affects the direction or strength of the relationship between EGDB (independent variable) and the influencing factors of EGDB (dependent variable) [
32]. The moderators in meta-analyses are usually extracted from the control variables in the empirical study [
33]. Considering that larger enterprises have more resources than small-scale enterprises, there may be situations where the enterprise size can directly affect the results of the implementation of EGDB [
34]. The economic development level of the selected sample object and the inconsistency of the industry will also affect the practice results of green supply chain management [
35]. Therefore, the moderators are determined by the size, region, and industry of the enterprise; the following hypotheses are put forward:
Hypothesis 6 (H6). Firm size plays a moderating role between EGDB and its influencing factors.
Hypothesis 7 (H7). The region where the enterprise is located plays a moderating role between EGDB and its influencing factors.
Hypothesis 8 (H8). The industry in which the enterprise is located plays a moderating role between EGDB and its influencing factors.
The research framework is shown in
Figure 1 to guide the subsequent research process based on the above discussion.
3. Materials and Methods
3.1. Meta-Analysis
The classical definition of the meta-analysis by Glass is the statistical analysis of a large number of analyses from individual studies to integrate the results of the studies [
36]. Contrary to traditional methods, a meta-analysis uses more objective data collection and numerical analysis. Existing quantitative studies on EGDB influencing factors meet the basic requirements of meta-analysis, based on the amount of empirical literature.
3.2. Retrieval Strategy
To collect related research on EGDB, GSCMP, and CPB, this study took December 2020 as the cut-off point and retrieved the literature published before the cut-off point. We use the electronic data platforms Science Direct, Web of Science, Springer, Google scholar, Wiley, IEEE, ProQuest Dissertations, and Theses Global database, using “enterprise green development behavior”, “firm green development behavior”, “company green development behavior”, “ corporate green development behavior”, “green supply chain management practice”, and “cleaner production behavior” as keywords to search for related journal articles—determining that each keyword must appear in the title or abstract of the complete field. The retrieved results found that the number of target literature retrieved was insufficient to meet the study criteria due to the newness of the field. Therefore, keywords such as “green development behavior”, “green supply chain management”, and “cleaner production” were searched, based on saving these documents, and appeared as a complete field in the title or abstract. To reduce the study’s bias, the researchers used the same search method, adding more studies over a time span from December 2020 to May 2021. So, as of 6 June 2021, the researchers had collected a total of 1677 articles.
3.3. Sample Screening
Since the collected studies include repetitive studies that can be searched in multiple databases, duplicate studies were eliminated, leaving 1373 articles.
3.4. Inclusion Criteria
To screen out the samples needed for meta-analysis, based on discussions between the authoritative literature and researchers on multiple meta-analysis methods, the following inclusion criteria were formulated: (1) research objects are enterprises; (2) research contents include the influencing factors of EGDB, green supply chain management, GSCMP, sustainable supply chain management, CPB, or cleaner production; (3) the research form is empirical research, excluding literature reviews and case studies; (4) studies must report the effect size (Pearson correlation coefficient r, Cohen’s d, Fisher’s z, or Hedge’s g, etc.) and sample size.
First, the researchers read the title and abstract of each study, excluding literature reviews and studies that were not company-specific, leaving a total of 337 studies. Then, the researchers went through the full text of the 337 studies, excluding studies that did not include factors affecting EGDB and those that did not report effect sizes and sample sizes, leaving 33 studies at the end. The specific selection process is shown in
Figure 2.
3.5. Studies Code
To extract the various data required for the final target studies, the researchers coded the final target studies. Due to a large amount of data extraction, and to avoid coding errors, this study used a predesigned data extraction table, to have relevant data extracted by one researcher and have it reviewed by another researcher.
The effect size can reflect the importance of the effect and is the most frequently applied research indicator in meta-analyses [
37]. During the extraction of the data, the effect sizes were found to be mostly described by correlation coefficients. Since the correlation coefficient r is not an equidistant scale, it does not simply average. Therefore, Fisher’s z was used as the effect size in the research. Based on the results of Borenstein et al. [
37], the remaining effect sizes from all the included studies were subjected to Fisher’s z transformation. Then, the obtained Fisher’s z was taken as the final effect value, and the calculation formula of the conversion is shown in Formula (1), as follows:
The encoding table is shown in
Table 1. In the research, CMA 3.0 (Comprehensive Meta-Analysis V3 Software) was used for the meta-analysis, and the data in the coding table was entered CMA 3.0.
4. Analysis and Results
To better display the results of the meta-analysis, the researchers divided the results into six parts: bias test, heterogeneity test, outlier test, sensitivity analysis, main effect test, and moderator test.
4.1. Bias Test
Due to the existence of gray literature, unpublished literature, and non-English language literature, etc. [
65], the ideal situation that all the literature meeting the criteria is included in the study was not possible in the realization process.
According to the funnel plot
Figure 3, it can be observed that the research literature is not completely symmetrically distributed on both sides of the total effect size, which indicates that the influencing factors of EGDB and EGDB may be biased. However, the funnel plot is only a preliminary check for publication bias from a subjective point of view. Next, Rosenthal’s fail-safe N, the Begg and Mazumdar rank correlation, and Egger’s regression intercept are required for more accurate bias tests.
The publication bias test results obtained by CMA 3.0 software are shown in
Table 2. In Rosenthal’s fail-safe number, when α = 0.05, z-value > 1.96,
p < 0.001—that is, there is no bias in this study. In the Begg and Mazumdar rank correlation,
p-value > 0.05, and the level of significance is not reached, indicating that there is no bias. In Egger’s regression intercept,
p-value > 0.05—the level of significance is not reached, indicating that there is no bias. According to the above four bias tests, this study showed no bias.
4.2. Heterogeneity Test
Due to the different research designs of the sample subjects, the different sources of bias, and the inconsistency of research quality, the heterogeneity of the research was considered. Therefore, this study used 2 heterogeneity testing methods, the Q test and the I
2 test.
Table 3 is the result of the heterogeneity test in this study.
The Q test is the weighted sum of squared deviations of the effect size. According to
Table 3,
p < 0.001, Q > df corresponding to the overall sample can be obtained, indicating that the research is significant and heterogeneous.
The statistics, I
2, reflect the proportion of the heterogeneity part in the total variation of the effect size. Higgins et al. [
66] pointed out that the tentative standards for the division of I
2 are as follows: 25%, 50%, and 75%, which represent the low, medium, and high degrees of heterogeneity, respectively. The I
2 corresponding to the overall sample in
Table 3 is 93.878%, which means that the research sample is highly heterogeneous. τ² reflects the true size of the study interval. The meta-analysis results showed that τ² is close to 0, indicating that the true range of the effect size is small [
65].
When there was heterogeneity, this study used a random effects model for analysis [
65]. When faced with different research objects, the measurement results will be different.
4.3. Outlier Test
The forest plot can reflect the effect of each study and the 95% confidence interval. In
Figure 4, the PIE forest plot, the effective values of Singh et al. [
23] and Khan et al. [
42] crossed the zero-dividing line at the 95% confidence interval, namely, the 2 outliers of this study. To improve the accuracy of this study, these two samples were deleted, and the PIE forest plot after the deletion is shown in
Figure 5.
4.4. Sensitivity Analysis
To identify studies with abnormal effect sizes, this study required a sensitivity analysis to determine if the effect size was abnormal by excluding one target study at a time.
To identify studies with abnormal effect sizes, the research required a sensitivity analysis to determine if the effect size was abnormal by excluding one included study at a time.
In the 3 studies that deleted the CTR one by one, Fisher’s Z changed from 0.528 to 0.603, and I
2 changed from 78.841% to 0, so the effect size corresponding to the study of de Oliveira et al. [
64] is abnormal and should be eliminated. In the 29 studies that deleted the CIR one by one, it was found that the effect size and heterogeneity have not changed significantly, indicating that the research results are relatively stable. In the 7 studies that deleted the ME one by one, Fisher’s Z changed from 0.618 to 0.630, and I
2 changed from 47.909% to 29.743%, so the effect size corresponding to the study of Mohanty et al. [
53] is abnormal and should be eliminated. In the 7 studies that deleted the PIE one by one, Fisher’s Z changed from 0.612 to 0.562, I
2 changed from 74.103% to 44.408%, so the PIE effect size corresponding to the study of Somjai et al. [
41] is abnormal and should be eliminated. In the 3 studies that deleted the PS one by one, Fisher’s Z changed from 0.625 to 0.596, I
2 changed from 79.659% to 0, so the PS effect size corresponds to the study of Somjai et al. [
41] is abnormal and should be eliminated.
4.5. Main Effect Test
Table 4 is the meta-analysis results of EGBD and the five dimensions of influencing factors. After excluding the heterogeneous and unqualified studies, there were 2 studies in the target literature that reported the correlation coefficient between CTR and EGBD. The results of random effects model analysis showed the effective degree of CTR and EGBD, Fisher’s Z = 0.603 (
p < 0.001). A total of 29 studies reported the effect size of CIR and EGBD, Fisher’s Z = 0.700 (
p < 0.001). A total of 6 studies reported the effect size of ME and EGBD, Fisher’s Z = 0.630 (
p < 0.001). A total of 7 studies reported the effect size of PIE and EGBD, Fisher’s Z = 0.562 (
p < 0.001). A total of 2 studies reported the effect size of PS and EGBD, Fisher’s Z = 0.596 (
p < 0.001). The results of the meta-analysis showed that there was a significant correlation between EGBD and the five influencing factors in the meta-analysis results. Therefore, H1–H5 are all supported.
4.6. Moderating Effect Test
This study analyzes the moderators of enterprise size, region, and industry on the effect size, as shown in
Table 5. Enterprise size was divided into three groups—ALL, S&M and L. ALL includes micro, small, medium, and large enterprises. S&M includes micro, small, and medium enterprises. L represents large enterprises. Among them, S&M corresponds to the effect size of 0.706 is greater than that of L and ALL, and the moderate effect is more significant and statistically significant (
p < 0.001). Therefore, H6 is supported. Regions also have a moderating effect. Thailand’s corresponding effect size of 0.914 is greater than that of other regions, and the moderating effect is significant. The conclusion supports H7.
Among the industries included in this study, the effect size of the automobile manufacturing industry (1.012) and textile industry (0.698) were both larger than the overall effect size. Therefore, H8 was supported.
5. Discussion
The research results show that hypotheses H1–H5 are all established, indicating that EGDB is affected by the corporate intangible resources, corporate tangible resources, public supervision, policy and institutional environment, and market environment. Moreover, each item has had a significant positive impact on EGDB. Li et al. [
9] verified the results consistent with this study by constructing a least squares structural equation model. In this regard, this study further explores the results of the study by comparing the intensity of each factor.
Research shows that the degree of influence of internal driving factors (0.693) is greater than that of external driving factors (0.602). Possible reasons for this situation follow. From the perspective of internal factors, corporate resources are closely linked to the enterprise. Compared with stereotypes, profit-seeking behavior is the most important factor for enterprises to implement various strategies. For example, as one of the developing countries, China uses its low-cost competitive advantage as the main weapon for Chinese manufacturing to participate in global competition [
67]. External factors act on the enterprise in the form of pressure, causing the enterprise to choose different levels of compliance in consideration of pressure. Zhao [
29] obtained, by analyzing panel data, that government regulations and public participation in environmental protection can improve the compliance level of enterprises. The effects of various external influence factors have slight differences, but they are all important positive factors. Therefore, this study argues that there is still a need to focus on such external drivers.
There are different degrees of influence among the factors that influence the green development behavior of various enterprises. Research shows that the degree of influence of enterprise intangible resource factors (0.700) is significantly greater than the other 4 factors. This is consistent with the results of other researchers [
68]. The possible reasons for this are the following: (1) excessive dependence on traditional material resources can no longer provide a clear competitive advantage [
22]; (2) intangible assets, as the foundation of enterprise resources [
69], are directly related to enterprise development. Therefore, to better realize EGDB, enterprises need to start from the organizational level. For example, improve the enterprise’s top-level design and formulate a clear enterprise green development strategy around organizational behavior.
In addition, the research results show that the size of an enterprise can adjust its green development behavior. Compared with smaller enterprises, large enterprises are unwilling to take the initiative to change due to the smaller risk they face [
70,
71]. Therefore, the moderating role of small, medium, and micro enterprises is more obvious. In the process of collecting samples, the researchers found that most of the countries studied for green supply chain management practices and cleaner production behaviors are developing countries, of which the Asian region accounts for a larger proportion. This is related to the earlier attention paid to environmental issues in developed countries, and it has been very mature in the field of green supply chain management practices and cleaner production behaviors. Many enterprises in developed countries choose to use the role of multinational enterprises to transfer product manufacturing to developing countries [
72].
In the manufacturing process of enterprises, due to the lack of attention to the environment in the early stage, many environmental pollution incidents have occurred. This also makes the government and society pay more attention to EGDB. From an internal perspective, the corresponding levels of attention and support from different countries and regions will also play a moderating role in the implementation of EGDB. Externally, multinational enterprises have to cater to the needs of target countries and regions and comply with local policies and the wishes of the people. The study found that a total of 28 target studies used research objects covering all walks of life. In addition, different industries have different regulatory effects. Compared with other industries, the automobile manufacturing industry has the greatest impact. The automobile manufacturing process is complex, and many links are full of the possibility of environmental pollution. China’s ecological environment department even promulgated the “Technical Guidelines for Pollution Source Intensity Accounting-Automobile Manufacturing” for the ecological environment standard for the automobile manufacturing industry.
Although this research provides a new perspective of meta-analysis for EGDB, it is also inevitable that some limitations cannot be avoided, like most studies. In the process of data retrieval, to comply with the requirements of the meta-analysis method, it was necessary to use the literature reporting the relevant effect size as the target sample. Therefore, the research on the reported effect size mainly focuses on the literature using the structural equation modeling method. Filtering for a single research method may lead to the omission of related research. Furthermore, despite a large number of searches in multiple databases, empirical research related to public supervision and corporate intangible resources is not yet abundant, resulting in high heterogeneity of research. Future studies can conduct more empirical research on the green development behavior of enterprises based on specific industry backgrounds and pass more industry tests for the research on the green development behavior of enterprises.
6. Conclusions
Based on the five dimensions that influence the green development of industrial enterprises divided by GDBP–IE theory, this study constructed a model of the influencing factors of EGDB. Through meta-analysis of 33 empirical studies published in important global academic journals from 2006 to 2021. The meta-analysis method validated the model. In addition, this study explored potential moderator variables, in order to obtain more comprehensive and credible conclusions than similar studies.
The study found the following:
- (1)
Corporate intangible resources, corporate tangible resources, public supervision, policy and institutional environment, and market environment all play a positive role in enterprise green development behavior.
- (2)
Corporate intangible resources have the most significant positive impact on enterprise green development behavior.
- (3)
The enterprise size, region, and industry all play a regulatory role in EGDB.
From the perspective of theoretical contribution, this research enriches the research field of GDBP–IE theory. The GDBP–IE theory was originally based on industrial enterprises as a starting point to discuss green development behaviors to improve the performance of industrial enterprises. Based on the GDBP–IE theory, this research discusses its influencing factors and applicability in multiple industries, including manufacturing and service industries, and the research conclusions can be applied to relevant research on corporate green development behavior. In this regard, this study uses meta-analysis to systematically integrate the relevant research on EGDB to provide a new understanding of the GDBP–IE theory. In addition, organizational behavior relies on scientific research methods to solve practical problems, and the essence of EGDB still belongs to organizational behavior. Therefore, this research expands the research on EGDB, enriches relevant research on organizational behavior, and provides a basis for researchers to further study EGDB for specific industries.
The contributions of this research to the enlightenment of management practices are as follows: the conclusion proves that improving the level of enterprise green development is inseparable from the efforts of society, enterprises, and the government. To improve the level of green development of an enterprise, it is necessary to expand from the inside to the outside, with the inside of the enterprise as the core. The influence of internal factors of the enterprise is large, so it is necessary to actively utilize the internal resources of the enterprise. By actively creating an atmosphere of green development awareness, enterprise managers structurally influence all levels of enterprise organizational structure, thereby exerting their subjective initiative and regulating corporate tangible resources and corporate intangible resources. The development of an enterprise’s strategy should be based on intangible resources and supplemented by tangible resources. Enterprises actively start from organizational structure, brand reputation, enterprise culture, technological innovation, etc., formulating relevant EGDB, and improving employees’ various levels of behavior—including willingness and abilities on a personal level. Besides, enterprises actively respond to the calls of policies and systems, establish an environmentally friendly social image of the enterprise, make the strategy transparent to the public supervision path, actively use green enterprise strategies to enhance their competitiveness in the market, and value their size, industry, and region. Advantages in these areas thereby enhance the level of green development of the enterprise. The public strengthens the supervision of EGDB, the government attaches importance to the policy and institutional environment, and the market environment is constantly in line with the green development atmosphere, which can positively promote EGDB. Under the influence of the market environment and public supervision, consumers, cooperative enterprises, and competitive enterprises will continue to force enterprises to face a green transformation—the fittest will continue to survive. At the same time, the government provides reasonable rewards and subsidies for EGDB, and strictly punishes enterprises for non-green development behaviors. A series of combined rewards and punishment policies and an institutional environment will promote the formation of a benign ecological environment for EGDB. In addition, according to the size, region, and industry of a given enterprise, it is possible to adjust EGDB. Therefore, the process of implementing EGDB needs to consider the characteristics of its enterprise.
Author Contributions
Conceptualization, X.L. (Xingwei Li) and Q.S.; methodology, X.L. (Xingwei Li) and J.D.; writing—original draft preparation, X.L. (Xingwei Li) and J.D.; supervision, X.L. (Xingwei Li) and Q.S.; project administration, X.L. (Xingwei Li); validation, J.D.; formal analysis, J.D.; investigation, J.D.; resources, J.D.; data curation, J.D.; visualization, J.D.; writing—review and editing, J.D., J.L., J.H., X.L. (Xiang Liu) and Y.H. All authors have read and agreed to the published version of the manuscript.
Funding
This work was funded by Special Funds of the National Social Science Fund of China (grant number 18VSJ038), the Scientific Research Startup Foundation for Introducing Talents of Sichuan Agricultural University (grant number 2122996022), the Social Science Special Project of Sichuan Agricultural University Disciplinary Construction Dual Support Program (grant number 2021SYYB05), the Undergraduate Training Program for Innovation and Entrepreneurship of Sichuan Agricultural University (grant number 202110626136), and the Sichuan Students’ Platform for Innovation and Entrepreneurship training program (grant number S202110626136).
Institutional Review Board Statement
Not applicable.
Informed Consent Statement
Not applicable.
Data Availability Statement
Not applicable.
Conflicts of Interest
The authors declare no conflict of interest.
References
- Zhou, L.; Zhou, C.; Che, L.; Wang, B. Spatio-temporal evolution and influencing factors of urban green development efficiency in China. J. Geogr. Sci. 2020, 30, 724–742. [Google Scholar] [CrossRef]
- Bei, A. Promoting Green as the Undertone of Development—Talk on Establishing and Improving the Green, Low-Carbon and Circular Development Economic System from the National Development and Reform Commission; The Xinhua News Agency: Beijing, China, 2021. [Google Scholar]
- Department For Business, E.I.S. The Ten Point Plan for a Green Industrial Revolution. Available online: https://www.gov.uk/government/publications/the-ten-point-plan-for-a-green-industrial-revolution (accessed on 26 January 2022).
- The Ministry of Economy, T.A.I. “Green Growth Strategy Through Achieving Carbon Neutrality in 2050” Formulated. Available online: https://www.meti.go.jp/english/press/2020/1225_001.html (accessed on 26 January 2022).
- Wang, Y.; Chen, H.; Long, R.; Liu, B.; Jiang, S.; Yang, X.; Yang, M. Evaluating green development level of mineral resource-listed companies: Based on a “dark green” assessment framework. Resour. Policy 2021, 71, 1–11. [Google Scholar] [CrossRef]
- Ritchie, H.; Roser, M. CO2 and Greenhouse Gas Emissions. Available online: https://ourworldindata.org/co2-and-other-greenhouse-gas-emissions (accessed on 18 December 2021).
- Li, X.; Du, J.; Long, H. Green development behavior and performance of industrial enterprises based on grounded theory study: Evidence from China. Sustainability 2019, 11, 4133. [Google Scholar] [CrossRef] [Green Version]
- Li, X.; Du, J.; Long, H. Understanding the green development behavior and performance of industrial enterprises (GDBP-IE): Scale development and validation. Int. J. Environ. Res. Public Health 2020, 17, 1716. [Google Scholar] [CrossRef] [PubMed] [Green Version]
- Li, X.; Du, J.; Long, H. Mechanism for green development behavior and performance of industrial enterprises (GDBP-IE) using partial least squares structural equation modeling (PLS-SEM). Int. J. Environ. Res. Public Health 2020, 17, 8450. [Google Scholar] [CrossRef]
- Debbarma, J.; Choi, Y. A taxonomy of green governance: A qualitative and quantitative analysis towards sustainable development. Sustain. Cities Soc. 2022, 79, 103693. [Google Scholar] [CrossRef]
- Micheli, G.J.L.; Cagno, E.; Mustillo, G.; Trianni, A. Green supply chain management drivers, practices and performance: A comprehensive study on the moderators. J. Clean. Prod. 2020, 259, 121024. [Google Scholar] [CrossRef]
- Bag, S.; Gupta, S.; Kumar, S.; Sivarajah, U. Role of technological dimensions of green supply chain management practices on firm performance. J. Enterp. Inf. Manag. 2021, 34, 1–27. [Google Scholar] [CrossRef]
- Long, R.; Li, H.; Wu, M.; Li, W. Dynamic evaluation of the green development level of China’s coal-resource-based cities using the TOPSIS method. Resour. Policy 2021, 74, 102415. [Google Scholar] [CrossRef]
- Rehman Khan, S.A.; Yu, Z. Assessing the eco-environmental performance: An PLS-SEM approach with practice-based view. Int. J. Logist. Res. Appl. 2021, 24, 303–321. [Google Scholar] [CrossRef]
- Gao, D.; Li, G.; Li, Y.; Gao, K. Does FDI improve green total factor energy efficiency under heterogeneous environmental regulation? Evidence from China. Environ. Sci. Pollut. Res. 2021, 1–14. [Google Scholar] [CrossRef] [PubMed]
- Shahzad, F.; Du, J.; Khan, I.; Shahbaz, M.; Murad, M.; Khan, M.A.S. Untangling the influence of organizational compatibility on green supply chain management efforts to boost organizational performance through information technology capabilities. J. Clean. Prod. 2020, 266, 1–23. [Google Scholar] [CrossRef]
- Li, W. Comply with the needs of green development and formulate green governance guidelines. Nankai Bus. Rev. 2017, 1. (In Chinese) [Google Scholar]
- Li, X.; Du, J.; Long, H. Theoretical framework and formation mechanism of the green development system model in China. Environ. Dev. 2019, 32, 100465. [Google Scholar] [CrossRef]
- Becker, G.S. Crime and Punishment: An Economic Approach. In The Economic Dimensions of Crime; Fielding, N.G., Clarke, A., Witt, R., Eds.; Palgrave Macmillan UK: London, UK, 2000; pp. 13–68. [Google Scholar]
- Stigler, G.J. The optimum enforcement of laws. J. Polit. Econ. 1970, 78, 526–536. [Google Scholar] [CrossRef] [Green Version]
- Molodchik, M.A.; Shakina, E.A.; Barajas, A. Metrics for the elements of intellectual capital in an economy driven by knowledge. J. Intellect. Cap. 2014, 15, 206–226. [Google Scholar] [CrossRef]
- Oprean-Stan, C.; Stan, S.; Brătian, V. Corporate sustainability and intangible resources binomial: New proposal on intangible resources recognition and evaluation. Sustainability 2020, 12, 4150. [Google Scholar] [CrossRef]
- Singh, J.; Singh, H.; Kumar, A. Impact of lean practices on organizational sustainability through green supply chain management–an empirical investigation. Int. J. Lean Six Sigma 2020, 11, 1035–1068. [Google Scholar] [CrossRef]
- Ilyas, S.; Hu, Z.; Wiwattanakornwong, K. Unleashing the role of top management and government support in green supply chain management and sustainable development goals. Environ. Sci. Pollut. Res. 2020, 27, 8210–8223. [Google Scholar] [CrossRef]
- Yang, F. Market environment and R&D investment—Evidence from GEM listed companies. Stud. Sci. Sci. 2016, 34, 896–905. [Google Scholar] [CrossRef]
- Kohli, A.K.; Jaworski, B.J. Market orientation: The construct, research propositions, and managerial implications. J. Mark. 1990, 54, 1–18. [Google Scholar] [CrossRef] [Green Version]
- Lin, R. Using fuzzy DEMATEL to evaluate the green supply chain management practices. J. Clean. Prod. 2013, 40, 32–39. [Google Scholar] [CrossRef]
- Chen, C.; Long, H. Public Participation in Water Environment Control: The Status and Experience of Shenzhen, Southern China. Meteorol. Environ. Res. 2018, 9, 70–79. [Google Scholar]
- Zhao, W. The Impact of Public Supervision on Environmental Regulatory Compliance of Enterprises. J. Environ. Econ. 2017, 2, 72–92. [Google Scholar] [CrossRef]
- Savita, K.S.; Dominic, P.; Ramayah, T. The drivers, practices and outcomes of green supply chain management: Insights from ISO14001 manufacturing firms in Malaysia. Int. J. Inf. Syst. Supply Chain. Manag. 2016, 9, 35–60. [Google Scholar] [CrossRef] [Green Version]
- Wu, J. Can Environmental Regulation Promote Industry’s Creative Destruction—From Perspective of New Schumpeterism’s Theory. Finance Econ. 2018, 67–78. [Google Scholar] [CrossRef]
- Hunter, J.E.; Schmidt, F.L. Methods of Meta-Analysis: Correcting Error and Bias in Research Findings; Sage: Newcastle upon Tyne, UK, 2004. [Google Scholar]
- Golicic, S.L.; Smith, C.D. A meta-analysis of environmentally sustainable supply chain management practices and firm performance. J. Supply Chain Manag. 2013, 49, 78–95. [Google Scholar] [CrossRef]
- González-Benito, J.; González-Benito, Ó. Environmental proactivity and business performance: An empirical analysis. Omega 2005, 33, 1–15. [Google Scholar] [CrossRef]
- Zhang, X.; Ma, Z.; Tian, D.; Xue, G. Meta-analysis on the affecting factors of green supply chain management practices. China Popul. Resour. Environ. 2017, 27, 183–195. [Google Scholar] [CrossRef]
- Glass, G.V. Primary, secondary, and meta-analysis of research. Educ. Res. 1976, 5, 3–8. [Google Scholar] [CrossRef]
- Borenstein, M.; Hedges, L.V.; Higgins, J.P.; Rothstein, H.R. Introduction to Meta-Analysis; John Wiley & Sons: Hoboken, NJ, USA, 2021. [Google Scholar]
- Tseng, M.; Chiu, A.S.; Lin, Y.; Chinag, J. The relationship of continuous improvement and cleaner production on operational performance: An empirical study in electronic manufacturing firms, Taiwan China. Int. J. Manag. Sci. Eng. Manag. 2006, 1, 71–80. [Google Scholar] [CrossRef]
- Chu, S.H.; Yang, H.; Lee, M.; Park, S. The impact of institutional pressures on green supply chain management and firm performance: Top management roles and social capital. Sustainability 2017, 9, 764. [Google Scholar] [CrossRef] [Green Version]
- Habib, M.A.; Bao, Y.; Ilmudeen, A. The impact of green entrepreneurial orientation, market orientation and green supply chain management practices on sustainable firm performance. Cogent Bus. Manag. 2020, 7, 7. [Google Scholar] [CrossRef]
- Somjai, S.; Jermsittiparsert, K. Role of Pressures and Green Supply Chain Management Practices in Enhancing the Operational Efficiency of Firms: Evidence from Thailand. Int. J. Supply Chain. Manag. 2019, 8, 437–445. [Google Scholar]
- Khan, A.; Tao, M.; Ahmad, H.; Shafique, M.N.; Nawaz, M.Z. Revisiting Green Supply Chain Management Practices: The Mediating Role of Emotional Intelligence. SAGE Open 2020, 10, 1–13. [Google Scholar] [CrossRef]
- Habib, M.; Bao, Y.; Nabi, N.; Dulal, M.; Asha, A.A.; Islam, M. Impact of Strategic Orientations on the Implementation of Green Supply Chain Management Practices and Sustainable Firm Performance. Sustainability 2021, 13, 340. [Google Scholar] [CrossRef]
- de Sousa Jabbour, A.B.L.; Jabbour, C.J.C.; Latan, H.; Teixeira, A.A.; de Oliveira, J.H.C. Quality management, environmental management maturity, green supply chain practices and green performance of Brazilian companies with ISO 14001 certification: Direct and indirect effects. Transp. Res. Part E Logist. Transp. Rev. 2014, 67, 39–51. [Google Scholar] [CrossRef]
- Do, A.D.; Nguyen, Q.V.; LE, Q.H.; TA, V.L. Green supply chain management in vietnam industrial zone: Province-level evidence. J. Asian Financ. Econ. Bus. 2020, 7, 403–412. [Google Scholar] [CrossRef]
- Ta, V.L.; Bui, H.N.; Canh, C.D.; Dang, T.D.; Do, A.D. Green Supply Chain Management Practice of FDI Companies in Vietnam. J. Asian Financ. Econ. Bus. 2020, 7, 1025–1034. [Google Scholar] [CrossRef]
- Aslam, H.; Rashid, K.; Wahla, A.R.; Tahira, U. Drivers of green supply chain management practices and their impact on firm performance: A developing country perspective. J. Quant. Methods 2018, 2, 87–113. [Google Scholar] [CrossRef]
- de Guimaraes, J.C.F.; Severo, E.A.; de Vasconcelos, C.R.M. The influence of entrepreneurial, market, knowledge management orientations on cleaner production and the sustainable competitive advantage. J. Clean. Prod. 2018, 174, 1653–1663. [Google Scholar] [CrossRef]
- Nadeem, K.; Siddiqui, D.A. The Effect of Strategic Orientation on Green Supply Chain Practices and Performance: A Case of Manufacturing Companies in Pakistan. Asian Bus. Rev. 2017, 7, 59–70. [Google Scholar] [CrossRef]
- Jermsittiparsert, K.; Siriattakul, P.; Sangperm, N. Predictors of environmental performance: Mediating role of green supply chain management practices. Int. J. Supply Chain. Manag. 2019, 8, 877–888. [Google Scholar]
- Nguyet, B.T.M.; Huyen, V.N.; Oanh, T.T.K.; Phuong, N.T.M.; Hang, N.P.T.; Uan, T.B. Operation management and performance: A mediating role of green supply chain management practices in MNCs. Pol. J. Manag. Stud. 2020, 2, P309–P323. [Google Scholar] [CrossRef]
- Jermsittiparsert, K.; Namdej, P.; Sriyakul, T. Impact of quality management techniques and system effectiveness on the green supply chain management practices. Int. J. Supply Chain. Manag. 2019, 8, 120–130. [Google Scholar]
- Mohanty, R.P.; Prakash, A. Green supply chain management practices in India: An empirical study. Prod. Plan. Control 2014, 25, 1322–1337. [Google Scholar] [CrossRef]
- Wang, C.; Zhang, Q.; Zhang, W. Corporate social responsibility, Green supply chain management and firm performance: The moderating role of big-data analytics capability. Res. Transp. Bus. Manag. 2020, 37, 1–10. [Google Scholar] [CrossRef]
- Nasrollahi, M. The Impact of Firm’s Social Media Applications on Green Supply Chain Management. Int. J. Supply Chain. Manag. 2018, 7, 16–24. [Google Scholar]
- Shabbir, M.S.; Kassim, N.M. Supply chain management drivers and sustainability of green initiatives in manufacturing enterprises: A case in Pakistan. Int. J. Entrep. 2018, 22, 1–19. [Google Scholar]
- Liu, S.; Eweje, G.; He, Q.; Lin, Z. Turning motivation into action: A strategic orientation model for green. Bus. Strat. Environ. 2019, 2908–2918. [Google Scholar] [CrossRef]
- Phawitpiriyakliti, C.; Keawkunti, B.; Saisama, C.; Sangma, W. Towards environmental sustainability: A case study of green supply chain management practice. J. Secur. Sustain. Issues 2020, 9, 747–763. [Google Scholar] [CrossRef]
- Chavez, R.; Yu, W.; Feng, M.; Wiengarten, F. The effect of customer-centric green supply chain management on operational performance and customer satisfaction. Bus. Strategy Environ. 2016, 25, 205–220. [Google Scholar] [CrossRef]
- Khan, N.U.; Anwar, M.; Li, S.; Khattak, M.S. Intellectual capital, financial resources, and green supply chain management as predictors of financial and environmental performance. Environ. Sci Pollut. Res. 2021, 28, 19755–19767. [Google Scholar] [CrossRef]
- Kim, M.; Chai, S. Implementing environmental practices for accomplishing sustainable green supply chain management. Sustainability 2017, 9, 1192. [Google Scholar] [CrossRef] [Green Version]
- Habib, A.; Bao, Y. Impact of knowledge management capability and green supply chain management practices on firm performance. Int. J. Res. Bus. Soc. Sci. 2019, 8, 240–255. [Google Scholar] [CrossRef] [Green Version]
- De Guimarães, J.C.F.; Severo, E.A.; Vieira, P.S. Cleaner production, project management and strategic drivers: An empirical study. J. Clean. Prod. 2017, 141, 881–890. [Google Scholar] [CrossRef]
- Augusto De Oliveira, J.; Lopes Silva, D.A.; Devós Ganga, G.M.; Filho, M.G.; Ferreira, A.A.; Esposto, K.F.; Ometto, A.R. Cleaner Production practices, motivators and performance in the Brazilian industrial companies. J. Clean. Prod. 2019, 231, 359–369. [Google Scholar] [CrossRef]
- Lipsey, M.W.; Wilson, D.B. Practical Meta-Analysis; SAGE Publications, Inc: Thousand Oaks, CA, USA, 2001. [Google Scholar]
- Higgins, J.P.; Thompson, S.G.; Deeks, J.J.; Altman, D.G. Measuring inconsistency in meta-analyses. Br. Med. J. 2003, 327, 557–560. [Google Scholar] [CrossRef] [Green Version]
- Lu, X.; Wu, J.; Huang, H. The Trend of Cost Management Used by Companies in China Based on the Analysis of Literature Data. J. Ind. Eng. Eng. Manag. 2014, 28, 8–16. [Google Scholar] [CrossRef]
- Drumwright, M.E. Socially responsible organizational buying: Environmental concern as a noneconomic buying criterion. J. Mark. 1994, 58, 1–19. [Google Scholar] [CrossRef]
- Liu, T. A Review of Related Researches on Enterprise Intangible Resources. Friends Account. 2014, 27–30. (In Chinese) [Google Scholar]
- Behl, A. Antecedents to firm performance and competitiveness using the lens of big data analytics: A cross-cultural study. Manag. Decis. 2020, 60, 1–31. [Google Scholar] [CrossRef]
- Ma, H.; Xiao, B.; Wang, C. The Driving Factors and Outcomes of Big Data Capabilities: Research Based on Meta-analysis. Nankai Bus. Rev. 2021, 1–19. [Google Scholar]
- Geng, R.; Mansouri, S.A.; Aktas, E. The relationship between green supply chain management and performance: A meta-analysis of empirical evidences in Asian emerging economies. Int. J. Prod. Econ. 2017, 183, 245–258. [Google Scholar] [CrossRef] [Green Version]
| Publisher’s Note: MDPI stays neutral with regard to jurisdictional claims in published maps and institutional affiliations. |
© 2022 by the authors. Licensee MDPI, Basel, Switzerland. This article is an open access article distributed under the terms and conditions of the Creative Commons Attribution (CC BY) license (https://creativecommons.org/licenses/by/4.0/).


