Abstract
Object: Numerous studies show that depression and anxiety have an adverse effect on life satisfaction among college students. Moreover, neuroticism affects depression, anxiety, and life satisfaction. Comparing the low-neuroticism and high-neuroticism groups, the current study used network analysis to examine the relationship between depression, anxiety, and life satisfaction among college students. Methods: A sample consisted of 1233 college students from China who completed the Big Five Inventory-2 (BFI-2), Self-rating Anxiety Scale (SAS), Self-rating Depression Scale (SDS), and Satisfaction With Life Scale (SWLS).All students were divided into two groups according to levels of neuroticism. Depression-anxiety symptom networks and flow networks were formed. Results: “Insomnia” (SAS19) and “Sleep disturbance” (SDS4) are bridge symptoms of groups with varying neuroticism. In addition, compared to the group with low levels of neuroticism, the group with high levels of neuroticism showed more depression symptoms in bridge symptoms and greater global strength. Many depression-anxiety symptoms are negatively associated with life satisfaction, and “Emptiness” (SDS18) is an important symptom in the high-neuroticism group’s flow network. Conclusion: This study contributes to our understanding of the connection between depression, anxiety, neuroticism, and life satisfaction. In addition, the current study identified the essential symptoms to target in depression and anxiety intervention and life satisfaction enhancement among college students.
1. Introduction
With the development of positive psychology there is burgeoning literature focused on life satisfaction. Life satisfaction, a significant indicator of mental health [1], is an individual’s cognitive and global evaluation of their happiness with life [2]. Numerous studies have documented the relationship between life satisfaction and positive social, interpersonal, and intrapersonal outcomes [1,3]. Life satisfaction is also important for college students because college is a pivotal time when they face personal development challenges and must make numerous life-altering decisions [4,5]. For college students, literature shows that life satisfaction is positively associated with academic performance [6], self-esteem [7], physical activity [8], and mental health [9]. Thus, improvement of the level of life satisfaction of college students is conducive to their healthy growth.
To improve college students’ life satisfaction, we cannot ignore the effect of psychopathological variables on life satisfaction [1], particularly depression and anxiety. According to a study of 200 college students, those who experienced depression, anxiety, and stress were more susceptible to low life satisfaction [10]. Consistent with this study, abundant previous research has widely documented that depression and anxiety are negative predictors of life satisfaction [11,12,13]. Also worth noting is the prevalence of depression and anxiety among college students. Depression and anxiety are the most common mental problems among youth [14]. A meta-analysis involving 89 studies with 1,441,828 higher education students reported the prevalence of depressive symptoms and anxiety symptoms as 34% and 32%, respectively [15], a statistic that warrants attention.
Considering the detrimental effect of depression and anxiety on life satisfaction and the high prevalence of depression and anxiety among college students, how to effectively intervene as well as improve life satisfaction for college students is a crucial research question warranting further exploration. However, despite the abundance of research examining the relationship between depression, anxiety, and life satisfaction, most studies are based on latent variable models that treat anxiety and depression as unidimensional variables [16,17] and may ignore the interaction between different symptoms of depression and anxiety [18]. Thus, in this study, we conduct a network analysis to examine the nuanced and comprehensive relationship between depression, anxiety, and life satisfaction by symptom level. Using network analysis, we can identify the bridge symptoms (i.e., symptoms that connect two mental disorders) [19] in the network, which can provide us with fresh insights to develop effective interventions that target the key symptoms in the network. This approach may enhance interventions for depression and anxiety and improve the life satisfaction of college students.
Within influential factors that affect depression and anxiety, personality variables have been identified as key factors [20,21]. Among the various personality theories, the Big Five personality theory is one of the most popular and widely used theories today and comprises the five factors of extraversion, openness, agreeableness, conscientiousness, and neuroticism [22,23]. Among these five factors, neuroticism is a special risk factor for a wide range of mental disorders [24]. Neuroticism is a stable personality trait that is defined as the tendency for people to experience negative emotions, such as anger, sad mood, and worry [25,26]. People with high level of neuroticism tend to be more sensitive to environmental stressors [27] and pay more attention to negative life events resulting in evocation of more negative emotions [28]. Higher levels of neuroticism are associated with higher risk of developing internalizing psychopathology [25,29] across the stages of childhood [30], adolescence [31], adulthood [28,32], and later life [33]. One study aimed at exploring the relationship between personality traits and psychological consequences of COVID-19, found that higher neuroticism was related to higher scores of stress and loneliness and that, although the other four factors of Big Five personality were significantly correlated with loneliness and stress, the effect sizes were small [34]. Previous research found that extraversion, openness, agreeableness, and conscientiousness are negatively associated with depression and anxiety while neuroticism showed a positive association [29,35,36] highlighting the peculiarities of neuroticism. Additionally, numerous studies have identified depression and anxiety susceptibility among people with high levels of neuroticism [37,38,39] which may be associated with lower life satisfaction [40,41]. Even though the negative relationship between neuroticism, depression, anxiety, and life satisfaction is well-established, the interaction between symptoms of depression, anxiety, and life satisfaction in groups with different levels of neuroticism has gone relatively unexplored. Therefore, to explore the relationship between depression, anxiety, and life satisfaction more comprehensively, we need to take neuroticism into account.
Considering all the above, in the current study we applied network analysis to examine the relationship between depression, anxiety, and life satisfaction among college students, comparing the low-neuroticism group and the high-neuroticism group. The current study has three objectives. Firstly, we aim to examine the interaction between symptoms of anxiety and depression, identifying the bridge symptoms of the anxiety-depression network. Secondly, we constructed flow networks to investigate the direct or indirect relationship between the comorbidity of depression-anxiety and life satisfaction. Lastly, we compared the networks of the low-neuroticism group and high-neuroticism group to explore the difference between the two groups.
2. Method
2.1. Participants
Participants (N = 1238) in the current study were recruited from a university in Harbin, China. In 2021, participants completed the questionnaire through the Wenjuanxing online questionnaire platform (https://www.wjx.cn/, accessed on 9 June 2023). As Sawyer et al. [42] suggested defining the age range of 10–24 years as adolescence, in this study, five participants who did not meet the above age criteria were excluded and 1233 subjects (female = 618, Meanage =18.29, SDage = 0.78) were included in later analysis. Using the mean score of the neuroticism subscale (Meanneuroticism = 32.38, SDneuroticism = 8.26), we divided the subjects into two groups. A total of 685 subjects (female = 361, Meanage = 18.30, SDage = 0.75) with scores above the mean score on the neuroticism subscale divided into the high-neuroticism group, and 548 subjects (female = 257, Meanage =18.30, SDage = 0.80) were divided into the low-neuroticism group. The research was examined and approved by the ethics committee of Beijing Normal University (Reference number: 202112220084).
2.2. Measures
2.2.1. Big Five Inventory-2 (BFI-2)
We used the sub-dimension of the neuroticism of BFI-2 in Chinese to measure the neuroticism of participants [43]. The sub-dimension of neuroticism contains 12 items, each scored on a 5-point Likert scale. Higher scores on the sub-dimension of neuroticism mean that the individuals show higher levels of neuroticism. The BFI-2 has good reliability and validity in China [43]. In the current study, the Cronbach’s α score of neuroticism sub-dimension was 0.872.
2.2.2. Self-Rating Anxiety Scale (SAS)
The Self-rating Anxiety Scale (SAS), which was designed by Zung [44], was used in this research to measure the anxiety level of participants. The Chinese version is widely used and has solid reliability and validity [45]. This inventory has 20 items and each is scored on a 4-point Likert scale ranging from “1” (no or little time) to “4” (most or all of the time). After reversing the score of 5 items, the anxiety level of participants can be measured by the total score of all items, and a higher score means that the individual has a higher level of anxiety. This inventory shows a high level of internal consistency in the current study with a Cronbach’s α score of 0.890.
2.2.3. Self-Rating Depression Scale (SDS)
The Self-rating Depression Scale (SDS) in Chinese was used to measure the level of depression [46,47]. This inventory has 20 items with 10 items that are reverse scored; each item is graded from “1” (no or little time) to “4” (most or all of the time). Participants with high total scores on this inventory may show higher levels of depression. The SDS has a Cronbach’s α score of 0.863, showing great internal consistency in the current study.
2.2.4. Satisfaction with Life Scale (SWLS)
The SWLS was developed by Diener et al. [48] and was used to measure the level of life satisfaction. This scale contains five items and is graded from “1” to “7”. Each item score is added up to a total score for the SWLS with a higher total score in this inventory corresponding with higher levels of life satisfaction. The reliability and validity of the SWLS in China have been established by a previous study [49]. In this study, the Cronbach’s α score of SWLS was 0.878.
2.3. Data Analysis
In this study, all data were analyzed using R (Version 4.3.0) [50]. As a first step, we calculated the Means, standard deviations (SDs), skewness, and kurtosis of all SAS, SDS, and SWLS items. Additionally, we used the function descrTable of the R package compareGroups to compare the scores of items between the high-neuroticism group and low-neuroticism group [51].
Secondly, we used the R package qgraph [52] to estimate and visualize the anxiety-depression symptom network of all people—the low-neuroticism group and the high-neuroticism group, respectively. In this process, a Gaussian Graphical Model (GGM) was used to estimate associations between different symptoms and to construct the network between different symptoms [53]. Consequently, the Extended Bayesian Information Criteria (EBIC) and graphical least absolute shrinkage and selection operator (LASSO) models were used to regularize the GGM [54,55]. In the network, each node represents a symptom and each edge represents the regularized partial correlation between two nodes. Additionally, as to the edge, green lines mean that two nodes have positive correlations, red lines denote negative correlations, and thicker edges represent stronger relationships.
To explore the significance of each symptom within the network, previous studies usually used the centrality index strength (i.e., the sum of the absolute edge weights connected to a specific node) which purports to be the most reliable centrality index [56,57]. However, Robinaugh et al. [58] suggested that strength may not be a reliable indicator when the network contains both positive and negative edges and that Expected Influence (EI) may prove a more reliable index. Thus, we used EI in the current study to measure the importance of each symptom within the network. We also used the R package mgm [57] to calculate the predictability (i.e., R2) of each node which represents the variance with which a node can be explained by neighboring nodes [59]. To identify the bridge symptoms in the networks—the overlapping symptoms of two disorders [60,61]—we calculated the bridge-expected influence (1-step) [58]. As in previous research, we set the standardized values of the bridge EI ≥ 1 as the criterion of bridge symptoms [19].
To compare the difference between the high-neuroticism group and low-neuroticism group, we used the R package NetworkComparisonTest [62] to conduct the Network Comparison Test (NCT). Additionally, we also conducted a bootstrap procedure to ensure that the networks constructed were robust via the R package bootnet [54]. Firstly, we conducted a nonparametric bootstrap, calculating the bootstrapped confidence intervals (95% CIs) to test the accuracy of edges in networks [54]. Secondly, we evaluated the differences between edge weights and centrality indices by utilizing bootstrapped difference tests. Lastly, we computed the correlation stability coefficient (CS-C) through case-dropping bootstrapping to examine the stability of the network model. The value of CS-C should be at least higher than 0.25 and preferably higher than 0.5 [54].
Finally, we used the function flow to plot a flow diagram and further explore the relationship between life satisfaction and other symptoms. The flow diagram places the node life satisfaction on the left side, then revealing direct and indirect relationships between life satisfaction and other symptoms.
3. Results
The Means and standard deviations (SD) of all items, and the results of t-tests between the high-neuroticism group and the low-neuroticism group are reported in Table 1. Table 1 shows that except for “Dyspnea” (SAS13) and Age, the scores of other symptoms show significant differences between the low-neuroticism group and the high-neuroticism group.

Table 1.
Descriptive statistics for the low-neuroticism and high-neuroticism group and the p-values of t-tests between the two groups.
3.1. Network Structure
The anxiety-depression symptom networks of different groups are shown in Figure 1. Part A of Figure 1 shows the network of all participants. This network has 40 nodes and 780 edges with 330 non-zero (42.31%) edges. Among all edges in this network, “Confusion” (SDS11) and “Psychomotor retardation” (SDS12) show the strongest correlation, followed by the correlation between “Personal devaluation” (SDS17) and “Emptiness” (SDS18), and the correlation between “Panic” (SAS3) and “Fear” (SAS2) (refer to Table S1).
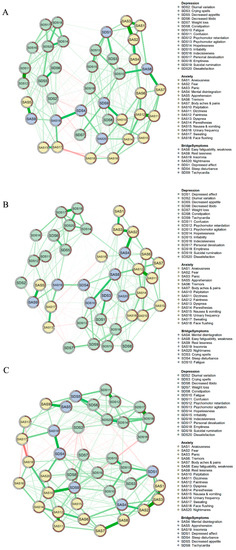
Figure 1.
Network structures. (A), Network of all participants. (B), Network of the low-neuroticism group. (C), Network of the high-neuroticism group.
As shown in Part B of Figure 1, in the anxiety-depression network of the low-neuroticism group, there are 40 nodes and 276 non-zero edges (35.38%). The correlation between “Confusion” (SDS11) and “Psychomotor retardation” (SDS12) is the strongest one. We also found that the correlation between “Dizziness” (SAS11) and “Faintness” (SAS12) as well as the correlation between “Fear” (SAS2) and “Panic” (SAS3) displays strongly in this network (refer to Table S2).
The anxiety-depression symptom network of the high-neuroticism group is shown in Part C of Figure 1. The network of the high-neuroticism group has 40 edges and 313 non-zero edges (40.13%). Among all edges in this network, the edge between “Personal devaluation” (SDS17) and “Emptiness” (SDS18), the edge between “Fear” (SAS2) and “Panic” (SAS3), and the edge between “Dizziness” (SAS11) and “Faintness” (SAS12) are the three strongest edges (refer to Table S3).
Figure 2 shows the standardized EI of all symptoms for all participants (Part A)—the low-neuroticism group (Part B), and the high-neuroticism group (Part C). The symptoms with a high standardized EI may be considered central symptoms. In the network of all participants, the standardized EI of “Faintness” (SAS12), “Paresthesias” (SAS14), and “Depressed affect” (SDS1) ranked in the top three. Among these three nodes, “Faintness” (SAS12) was also the node with the highest standardized EI in the high-neuroticism group, and “Paresthesias” (SAS14) also had a high standardized EI in the low-neuroticism group. Additionally, in the low-neuroticism group network, “Dissatisfaction” (SDS20) and “Dizziness” (SAS11) also showed high standardized EI. In the high-neuroticism group, “Hopelessness” (SDS14) and “Mental disintegration” (SAS4) revealed high standardized EI. The results of standardized strength were shown in Figure S1.
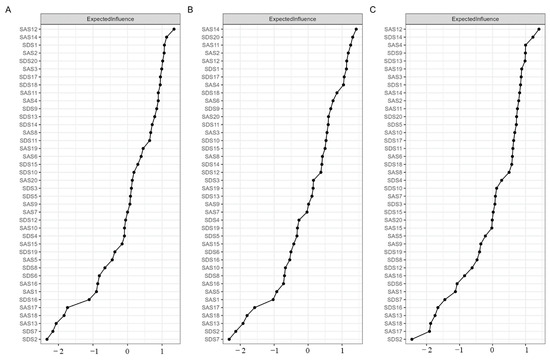
Figure 2.
Centrality value. (A), Standardized EI among all participants. (B), Standardized EI of the low-neuroticism group. (C), Standardized EI of the high-neuroticism group.
The bridge symptoms of different networks are shown in Figure 3. Across three networks, “Insomnia” (SAS19) was the symptom with the highest standardized bridge EI. The standardized bridge EI “Sleep disturbance” (SDS4) was also ranked in the top three across three networks. Additionally, in the network of all participants, “Easy fatiguability & weakness” (SAS8), “Restlessness” (SAS9), “Nightmares” (SAS20), “Depressed affect” (SDS1), and “Tachycardia” (SDS9) were also bridge symptoms. In the network of low-neuroticism, other symptoms revealing high standardized bridge EI were “Mental disintegration” (SAS4), “Easy fatiguability & weakness” (SAS8), “Restlessness” (SAS9), “Nightmares” (SAS20), “Crying spells” (SDS3), and “Fatigue” (SDS10). In the network of high-neuroticism, “Mental disintegration” (SAS4), “Apprehension” (SAS5), “Depressed affect” (SDS1), “Decreased appetite” (SDS5), and “Tachycardia” (SDS9) were symptoms for which standardized bridge EI was higher than 1.
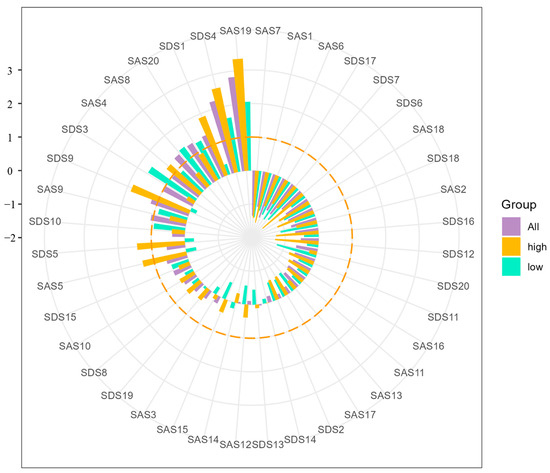
Figure 3.
Bridge symptoms of all participants, low-neuroticism group, and high-neuroticism group (orange dotted line represents the bridge EI of 1 (standardized)).
The flow networks of all participants (Part A), the low-neuroticism group (Part B), and high-neuroticism group (Part C) are shown in Figure 4. In Figure 4 we find that, among all symptoms directly related to life satisfaction, “Emptiness” (SDS18) was the symptom most highly associated with life satisfaction for all three groups and a higher level of emptiness corresponded with lower life satisfaction.. Additionally, in the low-neuroticism group, the relationship between “Easy fatiguability & weakness” (SAS8) and life satisfaction was as strong as the relationship between “Emptiness” (SDS18) and life satisfaction. In the high-neuroticism group, “Weight loss” (SDS7) was the second strongest symptom associated with life satisfaction, and greater weight loss corresponded with greater life satisfaction.
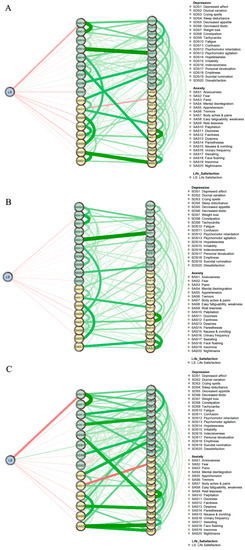
Figure 4.
Flow network of life satisfaction. (A), Flow network of all participants. (B), Flow network of the low-neuroticism group. (C), Flow network of the high-neuroticism group.
3.2. Network Comparison
The results of the network comparison are shown in Figure 5. Part A in Figure 5 shows the difference in the distribution of edge weights between the low-neuroticism group and the high-neuroticism group as non-significant (M = 0.192, p = 0.193). Part B in Figure 5 shows a significant difference between the global strength of the two groups (S = 1.068, p = 0.015).
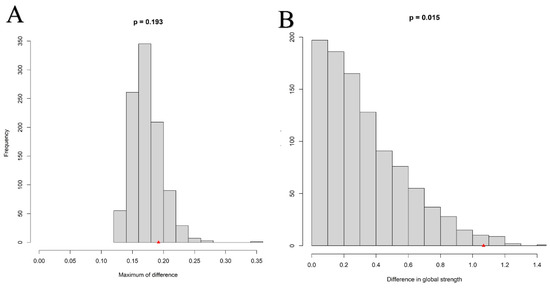
Figure 5.
Network comparison between the low-neuroticism group and high-neuroticism group. (A) Edge weights invariance. (B) Global strength invariance.
3.3. Network Accuracy and Stability
To ensure the networks in the current study were accurate and stable, we conducted a bootstrap procedure. As Figure S2, the 95% CIs are narrow across the groups of all participants (Part A), the low-neuroticism group (Part B), and the high-neuroticism group (Part C). As seen in Figures S3 and S4, results show that most comparisons between edge weights and centrality indices were significant. Figure S5 reports the results of the case-dropping bootstrap, the CS-C values of all participants, the low-neuroticism group, and the high-neuroticism group are 0.7, 0.7, and 0.7, respectively.
4. Discussion
The current research conducted network analysis to investigate the relationship between depression, anxiety, and life satisfaction, factoring in level of neuroticism. Our study identified anxiety or depression symptoms associated with life satisfaction. Our study also identified the difference in global strength and bridge symptoms between the low-neuroticism group and the high-neuroticism group. Several significant findings require further discussion.
4.1. Bridge Symptoms of Depression-Anxiety Networks between the Low and High Neuroticism Groups
The bridge symptoms of the two groups reveal both similarities and differences. Specifically, the commonality between the two groups is that “Insomnia” (SAS19) and “Sleep disturbance” (SDS4) are bridge symptoms within both groups. These two symptoms are associated with sleep, an indispensable process in our daily life. Studies focused on sleep in adolescence document that sleep plays a crucial role in learning, attention, and cognitive processes [63]. Additionally, previous research also finds that sleep has a significant effect on mental health [64]. One study measured and followed up on the sleep quality and the mental health of college students, finding that poor sleep quality was associated with mental health problems (i.e., depression, anxiety, and stress) [65]. Consistent with this, research also finds that sleep loss is associated with heightened emotional reactivity to visual stimuli and changes in emotional memory processing [63,66,67], further supporting the notion that sleep is a significant indicator of mental health difficulties [68,69,70,71]. As for the relationship between sleep, depression, and anxiety, sleep problems are identified as common symptoms of both depression [72,73] and anxiety [74,75]. Furthermore, the relationship between depression, anxiety, and sleep may be bidirectional, which means that not only are people with anxiety and depression prone to having sleep problems, but people with sleep problems are also susceptible to developing other symptoms of anxiety and depression [76,77]. Presenting in the networks, sleep-related symptoms may serve as bridge symptoms in the anxiety-depression networks of the low-neuroticism group and the high-neuroticism group, consistent with the results of the current study.
The difference between the bridge symptoms of the two groups is that the high-neuroticism group reveals more symptoms of depression in bridge symptoms. Specifically, in the high-neuroticism group, there are four bridge symptoms related to depression and three bridge symptoms related to anxiety. In the low-neuroticism group, there are three bridge symptoms related to depression and five symptoms related to anxiety. Although anxiety and depression are both related to negative affect and stressful life events—their overlapping features—several studies also suggest that they have distinctive features [25,78]. As to their relationship with affect, compared to anxiety, depression is more associated with the absence of positive affect (i.e., happiness, interest, energy, and confidence) [79,80]. Supporting the difference between anxiety and depression, Khazanov and Ruscio [81] conducted a meta-analysis of longitudinal studies to examine the relationship between positive affect, anxiety, and depression and results showed that higher level of depression and anxiety is associated with less positive affect, but the relationship between positive affect and depression was greater. Additionally, neuroticism is also a factor that is related to positive affect, supported by the findings of Hisler et al. [82], who found that neuroticism has a negative influence on the average level of positive affect. Similarly, results of other research also documented the relationship between high levels of neuroticism and a decrease in positive affect [83]. Thus, we may infer that people with high levels of neuroticism, experiencing less positive affect, will be more susceptible to developing depression symptoms, and that the symptoms of depression may further activate other symptoms of depression or symptoms of anxiety [84]. However, these results must be interpreted with caution because, in the data, discrepancies still existed in the relationship between neuroticism and positive affect [82,85]. Future studies may further examine the effect of neuroticism on positive affect as well as the mechanisms by which neuroticism influences depression and anxiety.
4.2. Difference in Global Strength between the High-Neuroticism Group and Low-Neuroticism Group
Our study found that the global strength of the high-neuroticism group was higher than that of the low-neuroticism group. In other words, tighter connectivity existed between the symptoms in the high-neuroticism group, which may contribute to the vulnerability of individuals with high neuroticism to develop or maintain anxiety and depression symptoms [86]. Research by Smith et al. [87] found that neuroticism significantly predicted depression and anxiety and suggested that cognitive biases may explain the detrimental effect of neuroticism. Other studies likewise provide supportive evidence for the negative effects of neuroticism on anxiety and depression and are consistent with results of the current study [38,39]. Additionally, a review of neuroticism shows that neuroticism has its biological (i.e., autonomic nervous system) and psychological basis (i.e., cognitive processing of emotional information) [88] helping us understand the effect of neuroticism on depression and anxiety as well as the possible mechanisms behind this effect. According to these findings, at least, more studies are needed to investigate and to verify through which mechanisms neuroticism affects anxiety and depression, and to determine methods for the delivery of timely and effective interventions for highly neurotic college students with depression or anxiety.
4.3. Flow Network between the Low and High Neuroticism Groups
As seen in the results of the flow network, in the high-neuroticism group and low-neuroticism group, most symptoms of depression and anxiety were directly or indirectly negatively correlated with life satisfaction. Significantly, our study identified the significant relationship between the symptoms of “Emptiness” (SDS18) and life satisfaction in the high-neuroticism group. “Emptiness” (SDS18) reflects whether the individual thinks “My life is meaningless” [89]. Similar to the findings of the current study, Ritchie et al. [90] investigated the relationship between neuroticism, meaninglessness, subjective well-being, and self-concept clarity and results showed that meaninglessness was positively associated with neuroticism while it was negatively related to life satisfaction. Furthermore, the implication of this finding is that among neurotic people with depression or anxiety, meaninglessness may be the key symptom to target to improve life satisfaction. Julom and de Guzmán [91] conducted a Logotherapy program, an existential therapy founded by Frankl [92], to intervene in the meaninglessness felt by paralyzed in-patients; the intervention ultimately decreased the meaninglessness felt by the experimental group. Consistent with prior research, several studies have also demonstrated the effectiveness of logotherapy in college students [93,94]. Notably, group logotherapy has been found to effectively alleviate depression and enhance life satisfaction among college students [93]. However, it is necessary to further investigate whether logotherapy can effectively address feelings of meaninglessness and enhance life satisfaction specifically in neurotic college students experiencing depression or anxiety.
These findings can be understood from the perspective of different facets of happiness, namely hedonic well-being and eudaimonic well-being [95,96]. Hedonic well-being principles encompass notions such as pleasure, enjoyment, and satisfaction, emphasizing the significance of life satisfaction and affective components [95,96]. In contrast, eudaimonic well-being focuses on optimal psychological functioning, encompassing concepts like personal growth, purpose in life, and a sense of autonomy [95]. Our study revealed a negative association between most depression and anxiety symptoms and scores on the Satisfaction with Life Scale (SWLS), which reflects hedonic well-being [97]. This result can potentially be explained by the physiological mechanisms underlying anxiety and depression, as changes in these mechanisms may influence an individual’s emotional perception [98]. Furthermore, the prominent role of “Emptiness” (SDS18) observed in the high-neuroticism group may indicate the impairment of eudaimonic well-being in neurotic individuals, as feelings of meaninglessness and depression are often associated with lower levels of eudaimonic well-being [99]. However, it is important to note that our study did not directly measure eudaimonic well-being, thus necessitating future research to further explore this hypothesis.
4.4. Limitations and Conclusions
Despite the significant findings, the present study has several weaknesses. Firstly, the current results are based on cross-sectional data. Therefore, the directed and causal relationship between symptoms of life satisfaction, neuroticism, depression, and anxiety is still largely unknown. Future studies may collect longitudinal data and use statistical methods such as cross-lagged panel network analysis (CLPN) to explore the directed or predictive relationship between symptoms and these variables. Secondly, the current study used self-report questionnaire to measure the level of life satisfaction, neuroticism, depression, and anxiety, which was mainly subjective. Future research should use behavioral experiments and use other objective neurophysiological indicators (i.e., fMRI, EEG) to test the results of the current study. Thirdly, the participants of this study were all from a university in China and results may not be generalizable to all cultures and all populations. Cross-cultural and cross-group research is needed to further examine the results of our study. The present research conducted network analysis and analyzed the relationship between life satisfaction and the comorbidity of depression and anxiety in groups with different levels of neuroticism. In this study, we found that the depression-anxiety networks between the high-neuroticism group and the low-neuroticism group have similarities; “Insomnia” (SAS19) and “Sleep disturbance” (SDS4) are bridge symptoms of both groups. As for the difference between the two groups, our study found that the high-neuroticism group has higher global strength and shows more symptoms of depression in bridge symptoms. Furthermore, in addition to finding that most symptoms of depression and anxiety have direct or indirect negative effects on life satisfaction, this study also identified “Emptiness” (SDS18) as an important symptom that is negatively associated with life satisfaction in the high-neuroticism group. Despite its limitations, the present study adds to the understanding of the relationship between depression, anxiety, neuroticism, and life satisfaction, generating fresh insights from the perspective of network analysis into the interventions for depression and anxiety as well as the improvement of life satisfaction among people with different levels of neuroticism.
Supplementary Materials
The following supporting information can be downloaded at: https://www.mdpi.com/article/10.3390/bs13080641/s1.
Author Contributions
Conceptualization: G.L. and Y.T.; methodology and writing: Q.T.; review and editing: X.L., X.H. and Y.T.; data collecting: L.Z. All authors have read and agreed to the published version of the manuscript.
Funding
This research received no external funding.
Institutional Review Board Statement
This study was reviewed and approved by the ethical committee of Beijing Normal University (Reference number: 202112220084).
Informed Consent Statement
Informed consent was obtained from all subjects involved in the study.
Data Availability Statement
The data presented in this study are available on request from the corresponding author.
Conflicts of Interest
The authors declare no conflict of interest.
References
- Proctor, C.; Linley, P.A.; Maltby, J.; Port, G. Life satisfaction. Encycl. Adolesc. 2017, 2, s2165–s2176. [Google Scholar]
- Suldo, S.M.; Riley, K.N.; Shaffer, E.J. Academic Correlates of Children and Adolescents’ Life Satisfaction. Sch. Psychol. Int. 2006, 27, 567–582. [Google Scholar] [CrossRef]
- Proctor, C.L.; Linley, P.A.; Maltby, J. Youth Life Satisfaction: A Review of the Literature. J. Happiness Stud. 2009, 10, 583–630. [Google Scholar] [CrossRef]
- Yalçın, İ. Social Support and Optimism as Predictors of Life Satisfaction of College Students. Int. J. Adv. Couns. 2011, 33, 79–87. [Google Scholar] [CrossRef]
- Stevic, C.R.; Ward, R.M. Initiating Personal Growth: The Role of Recognition and Life Satisfaction on the Development of College Students. Soc. Indic. Res. 2008, 89, 523–534. [Google Scholar] [CrossRef]
- Antaramian, S. The importance of very high life satisfaction for students’ academic success. Cogent Educ. 2017, 4, 1307622. [Google Scholar] [CrossRef]
- Hawi, N.S.; Samaha, M. The Relations Among Social Media Addiction, Self-Esteem, and Life Satisfaction in University Students. Soc. Sci. Comput. Rev. 2016, 35, 576–586. [Google Scholar] [CrossRef]
- Pengpid, S.; Peltzer, K. Sedentary Behaviour, Physical Activity and Life Satisfaction, Happiness and Perceived Health Status in University Students from 24 Countries. Int. J. Environ. Res. Public Health 2019, 16, 2084. [Google Scholar] [CrossRef]
- Kumar, H.; Shaheen, A.; Rasool, I.; Shafi, M. Psychological Distress and Life Satisfaction among University Students. J. Psychol. Clin. Psychiatry 2016, 5, 00283. [Google Scholar] [CrossRef]
- Bukhari, S.R.; Saba, F. Depression, anxiety and stress as negative predictors of life satisfaction in university students. Rawal. Med. J. 2017, 42, 255–257. [Google Scholar]
- Serin, N.B.; Serin, O.; Özbaş, L.F. Predicting university students’ life satisfaction by their anxiety and depression level. Procedia Soc. Behav. Sci. 2010, 9, 579–582. [Google Scholar] [CrossRef]
- Gigantesco, A.; Fagnani, C.; Toccaceli, V.; Stazi, M.A.; Lucidi, F.; Violani, C.; Picardi, A. The Relationship Between Satisfaction With Life and Depression Symptoms by Gender. Front. Psychiatry 2019, 10, 00419. [Google Scholar] [CrossRef] [PubMed]
- Goryczka, A.; Dębski, P.; Gogola, A.M.; Gorczyca, P.; Piegza, M. Depressive and Anxiety Symptoms and Their Relationships with Ego-Resiliency and Life Satisfaction among Well-Educated, Young Polish Citizens during the COVID-19 Pandemic. Int. J. Environ. Res. Public Health 2022, 19, 10364. [Google Scholar] [CrossRef]
- Al Omari, O.; Al Sabei, S.; Al Rawajfah, O.; Abu Sharour, L.; Aljohani, K.; Alomari, K.; Shkman, L.; Al Dameery, K.; Saifan, A.; Al Zubidi, B.; et al. Prevalence and Predictors of Depression, Anxiety, and Stress among Youth at the Time of COVID-19: An Online Cross-Sectional Multicountry Study. Depress. Res. Treat. 2020, 2020, 8887727. [Google Scholar] [CrossRef]
- Deng, J.; Zhou, F.; Hou, W.; Silver, Z.; Wong, C.Y.; Chang, O.; Drakos, A.; Zuo, Q.K.; Huang, E. The prevalence of depressive symptoms, anxiety symptoms and sleep disturbance in higher education students during the COVID-19 pandemic: A systematic review and meta-analysis. Psychiatry Res. 2021, 301, 113863. [Google Scholar] [CrossRef]
- Lopes, A.R.; Nihei, O.K. Depression, anxiety and stress symptoms in Brazilian university students during the COVID-19 pandemic: Predictors and association with life satisfaction, psychological well-being and coping strategies. PLoS ONE 2021, 16, e0258493. [Google Scholar] [CrossRef]
- Wang, S.; Li, H.; Chen, X.; Yan, N.; Wen, D. The mediating role of psychological capital in the association between life satisfaction and depressive and anxiety symptoms among Chinese medical students during the COVID-19 pandemic: A cross-sectional study. BMC Psychiatry 2023, 23, 398. [Google Scholar] [CrossRef]
- Borsboom, D.; Cramer, A.O. Network analysis: An integrative approach to the structure of psychopathology. Annu. Rev. Clin. Psychol. 2013, 9, 91–121. [Google Scholar] [CrossRef] [PubMed]
- Jones, P.J.; Ma, R.; McNally, R.J. Bridge Centrality: A Network Approach to Understanding Comorbidity. Multivar. Behav. Res. 2021, 56, 353–367. [Google Scholar] [CrossRef]
- Lyon, K.A.; Juhasz, G.; Brown, L.J.E.; Elliott, R. Big Five personality facets explaining variance in anxiety and depressive symptoms in a community sample. J. Affect. Disord. 2020, 274, 515–521. [Google Scholar] [CrossRef]
- Prince, E.J.; Siegel, D.J.; Carroll, C.P.; Sher, K.J.; Bienvenu, O.J. A longitudinal study of personality traits, anxiety, and depressive disorders in young adults. Anxiety Stress Coping 2021, 34, 299–307. [Google Scholar] [CrossRef] [PubMed]
- Digman, J.M. Personality structure: Emergence of the five-factor model. Annu. Rev. Psychol. 1990, 41, 417–440. [Google Scholar] [CrossRef]
- Gosling, S.D.; Rentfrow, P.J.; Swann, W.B. A very brief measure of the Big-Five personality domains. J. Res. Pers. 2003, 37, 504–528. [Google Scholar] [CrossRef]
- Zhang, F. Neuroticism. In The Wiley Encyclopedia of Personality and Individual Differences; Wiley: Hoboken, NJ, USA, 2020; pp. 281–286. [Google Scholar]
- Griffith, J.W.; Zinbarg, R.E.; Craske, M.G.; Mineka, S.; Rose, R.D.; Waters, A.M.; Sutton, J.M. Neuroticism as a common dimension in the internalizing disorders. Psychol. Med. 2010, 40, 1125–1136. [Google Scholar] [CrossRef]
- Pereira-Morales, A.J.; Adan, A.; Forero, D.A. Perceived Stress as a Mediator of the Relationship between Neuroticism and Depression and Anxiety Symptoms. Curr. Psychol. 2019, 38, 66–74. [Google Scholar] [CrossRef]
- Jeronimus, B.F.; Ormel, J.; Aleman, A.; Penninx, B.W.J.H.; Riese, H. Negative and positive life events are associated with small but lasting change in neuroticism. Psychol. Med. 2013, 43, 2403–2415. [Google Scholar] [CrossRef]
- Chen, X.; Pu, J.; Shi, W.; Zhou, Y. The Impact of Neuroticism on Symptoms of Anxiety and Depression in Elderly Adults: The Mediating Role of Rumination. Curr. Psychol. 2020, 39, 42–50. [Google Scholar] [CrossRef]
- Lyon, K.A.; Elliott, R.; Ware, K.; Juhasz, G.; Brown, L.J.E. Associations between Facets and Aspects of Big Five Personality and Affective Disorders:A Systematic Review and Best Evidence Synthesis. J. Affect. Disord. 2021, 288, 175–188. [Google Scholar] [CrossRef]
- Brandes, C.M.; Herzhoff, K.; Smack, A.J.; Tackett, J.L. The p Factor and the n Factor: Associations Between the General Factors of Psychopathology and Neuroticism in Children. Clin. Psychol. Sci. 2019, 7, 1266–1284. [Google Scholar] [CrossRef]
- Williams, A.L.; Craske, M.G.; Mineka, S.; Zinbarg, R.E. Neuroticism and the longitudinal trajectories of anxiety and depressive symptoms in older adolescents. J. Abnorm. Psychol. 2021, 130, 126–140. [Google Scholar] [CrossRef]
- Wang, X.; Lin, J.; Liu, Q.; Lv, X.; Wang, G.; Wei, J.; Zhu, G.; Chen, Q.; Tian, H.; Zhang, K.; et al. Major depressive disorder comorbid with general anxiety disorder: Associations among neuroticism, adult stress, and the inflammatory index. J. Psychiatr. Res. 2022, 148, 307–314. [Google Scholar] [CrossRef] [PubMed]
- Banjongrewadee, M.; Wongpakaran, N.; Wongpakaran, T.; Pipanmekaporn, T.; Punjasawadwong, Y.; Mueankwan, S. The role of perceived stress and cognitive function on the relationship between neuroticism and depression among the elderly: A structural equation model approach. BMC Psychiatry 2020, 20, 25. [Google Scholar] [CrossRef] [PubMed]
- Ikizer, G.; Kowal, M.; Aldemir, İ.D.; Jeftić, A.; Memisoglu-Sanli, A.; Najmussaqib, A.; Lacko, D.; Eichel, K.; Turk, F.; Chrona, S.; et al. Big Five traits predict stress and loneliness during the COVID-19 pandemic: Evidence for the role of neuroticism. Pers. Individ. Differ. 2022, 190, 111531. [Google Scholar] [CrossRef]
- Hakulinen, C.; Elovainio, M.; Pulkki-Råback, L.; Virtanen, M.; Kivimäki, M.; Jokela, M. Personality and depressive symptoms: Individual participant meta-analysis of 10 cohort studies. Depress. Anxiety 2015, 32, 461–470. [Google Scholar] [CrossRef]
- Vreeke, L.J.; Muris, P. Relations Between Behavioral Inhibition, Big Five Personality Factors, and Anxiety Disorder Symptoms in Non-Clinical and Clinically Anxious Children. Child Psychiat. Hum. Dev. 2012, 43, 884–894. [Google Scholar] [CrossRef]
- Vittengl, J.R. Who pays the price for high neuroticism? Moderators of longitudinal risks for depression and anxiety. Psychol. Med. 2017, 47, 1794–1805. [Google Scholar] [CrossRef]
- Aldinger, M.; Stopsack, M.; Ulrich, I.; Appel, K.; Reinelt, E.; Wolff, S.; Grabe, H.J.; Lang, S.; Barnow, S. Neuroticism developmental courses—Implications for depression, anxiety and everyday emotional experience; a prospective study from adolescence to young adulthood. BMC Psychiatry 2014, 14, 210. [Google Scholar] [CrossRef] [PubMed]
- Vinograd, M.; Williams, A.; Sun, M.; Bobova, L.; Wolitzky-Taylor, K.B.; Vrshek-Schallhorn, S.; Mineka, S.; Zinbarg, R.E.; Craske, M.G. Neuroticism and Interpretive Bias as Risk Factors for Anxiety and Depression. Clin. Psychol. Sci. 2020, 8, 641–656. [Google Scholar] [CrossRef]
- Schunk, F.; Trommsdorff, G. Longitudinal associations of neuroticism with life satisfaction and social adaptation in a nationally representative adult sample. J. Pers. 2022, 00, 1–15. [Google Scholar] [CrossRef]
- Wang, C.; Havewala, M.; Zhu, Q. COVID-19 stressful life events and mental health: Personality and coping styles as moderators. J. Am. Coll. Health 2022, 26, 1–10. [Google Scholar] [CrossRef]
- Sawyer, S.M.; Azzopardi, P.S.; Wickremarathne, D.; Patton, G.C. The age of adolescence. Lancet Child Adolesc. Health 2018, 2, 223–228. [Google Scholar] [CrossRef] [PubMed]
- Zhang, B.; Li, Y.M.; Li, J.; Luo, J.; Ye, Y.; Yin, L.; Chen, Z.; Soto, C.J.; John, O.P. The Big Five Inventory–2 in China: A Comprehensive Psychometric Evaluation in Four Diverse Samples. Assessment 2021, 29, 1262–1284. [Google Scholar] [CrossRef] [PubMed]
- Zung, W.W. A rating instrument for anxiety disorders. Psychosom. J. Consult. Liaison Psychiatry 1971, 12, 371–379. [Google Scholar] [CrossRef]
- Phillips, M. Evaluation and revision of translated Western scales. In Rating Scales for Mental Health; Chinese Mental Health: Shanghai, China, 1993; pp. 343–351. [Google Scholar]
- Zung, W.W.K. A Self-Rating Depression Scale. Arch. Gen. Psychiatry 1965, 12, 63–70. [Google Scholar] [CrossRef] [PubMed]
- Wang, X.D.; Wang, X.L.; Ma, H. Handbook of mental health assessment scale. Chin. Ment. Health J. 1999, 13, 31–35. [Google Scholar]
- Diener, E.; Emmons, R.A.; Larsen, R.J.; Griffin, S. The Satisfaction With Life Scale. J. Pers. Assess. 1985, 49, 71–75. [Google Scholar] [CrossRef] [PubMed]
- Xiong, C.; Xu, Y. Reliability and validity of the satisfaction with life scale for Chinese demos. China J. Health Psychol. 2009, 17, 948–949. [Google Scholar] [CrossRef]
- R Core Team. R: A Language and Environment for Statistical Computing, 4.3.0. 2023. Available online: https://www.r-project.org/ (accessed on 9 June 2023).
- Subirana, I.; Sanz, H.; Vila, J. Building bivariate tables: The compareGroups package for R. J. Stat. Softw. 2014, 57, 1–16. [Google Scholar] [CrossRef]
- Epskamp, S.; Cramer, A.O.J.; Waldorp, L.J.; Schmittmann, V.D.; Borsboom, D. qgraph: Network Visualizations of Relationships in Psychometric Data. J. Stat. Softw. 2012, 48, 1–18. [Google Scholar] [CrossRef]
- Epskamp, S.; Waldorp, L.J.; Mõttus, R.; Borsboom, D. The Gaussian Graphical Model in Cross-Sectional and Time-Series Data. Multivar. Behav. Res. 2018, 53, 453–480. [Google Scholar] [CrossRef]
- Epskamp, S.; Borsboom, D.; Fried, E.I. Estimating psychological networks and their accuracy: A tutorial paper. Behav. Res. Methods 2018, 50, 195–212. [Google Scholar] [CrossRef]
- Epskamp, S.; Fried, E.I. A tutorial on regularized partial correlation networks. Psychol. Methods 2018, 23, 617–634. [Google Scholar] [CrossRef]
- Wei, Z.; Ren, L.; Yang, L.; Liu, C.; Cao, M.; Yang, Q.; Liu, X.; Liu, Y.; Deng, Y. The relationship between social anxiety and felt stigma in patients with epilepsy: A network analysis. Seizure 2021, 92, 76–81. [Google Scholar] [CrossRef]
- Haslbeck, J.M.B.; Waldorp, L.J. mgm: Estimating Time-Varying Mixed Graphical Models in High-Dimensional Data. J. Stat. Softw. 2020, 93, 1–46. [Google Scholar] [CrossRef]
- Robinaugh, D.J.; Millner, A.J.; McNally, R.J. Identifying highly influential nodes in the complicated grief network. J. Abnorm. Psychol. 2016, 125, 747–757. [Google Scholar] [CrossRef]
- Haslbeck, J.M.B.; Fried, E.I. How predictable are symptoms in psychopathological networks? A reanalysis of 18 published datasets. Psychol. Med. 2017, 47, 2767–2776. [Google Scholar] [CrossRef] [PubMed]
- Elliott, H.; Jones, P.J.; Schmidt, U. Central symptoms predict posttreatment outcomes and clinical impairment in anorexia nervosa: A network analysis. Clin. Psychol. Sci. 2020, 8, 139–154. [Google Scholar] [CrossRef]
- Kaiser, T.; Herzog, P.; Voderholzer, U.; Brakemeier, E.-L. Unraveling the comorbidity of depression and anxiety in a large inpatient sample: Network analysis to examine bridge symptoms. Depress. Anxiety 2021, 38, 307–317. [Google Scholar] [CrossRef] [PubMed]
- van Borkulo, C.D.; van Bork, R.; Boschloo, L.; Kossakowski, J.J.; Tio, P.; Schoevers, R.A.; Borsboom, D.; Waldorp, L.J. Comparing network structures on three aspects: A permutation test. Psychol. Methods 2022. [Google Scholar] [CrossRef]
- Tarokh, L.; Saletin, J.M.; Carskadon, M.A. Sleep in adolescence: Physiology, cognition and mental health. Neurosci. Biobehav. Rev. 2016, 70, 182–188. [Google Scholar] [CrossRef] [PubMed]
- Miletínová, E.; Bušková, J. Functions of Sleep. Physiol. Res. 2021, 70, 177–182. [Google Scholar] [CrossRef]
- Zou, P.; Wang, X.; Sun, L.; Liu, K.; Hou, G.; Yang, W.; Liu, C.; Yang, H.; Zhou, N.; Zhang, G.; et al. Poorer sleep quality correlated with mental health problems in college students: A longitudinal observational study among 686 males. J. Psychosomat. Res. 2020, 136, 110177. [Google Scholar] [CrossRef] [PubMed]
- Altena, E.; Micoulaud-Franchi, J.-A.; Geoffroy, P.-A.; Sanz-Arigita, E.; Bioulac, S.; Philip, P. The bidirectional relation between emotional reactivity and sleep: From disruption to recovery. Behav. Neurosci. 2016, 130, 336–350. [Google Scholar] [CrossRef]
- Tempesta, D.; Socci, V.; De Gennaro, L.; Ferrara, M. Sleep and emotional processing. Sleep Med. Rev. 2018, 40, 183–195. [Google Scholar] [CrossRef]
- João, K.A.D.R.; Jesus, S.N.d.; Carmo, C.; Pinto, P. The impact of sleep quality on the mental health of a non-clinical population. Sleep Med. 2018, 46, 69–73. [Google Scholar] [CrossRef]
- Milojevich, H.M.; Lukowski, A.F. Sleep and mental health in undergraduate students with generally healthy sleep habits. PLoS ONE 2016, 11, e0156372. [Google Scholar] [CrossRef] [PubMed]
- Wang, S.; Hou, W.; Tao, Y.; Ma, Z.; Li, K.; Wang, Y.; Liu, X.; Zhang, L. Mapping Network Connection Among Symptoms of Anxiety, Depression, and Sleep Disturbance in Chinese High School Students. Front. Public Health 2022, 10, 1015166. [Google Scholar] [CrossRef]
- Ma, Z.; Wang, D.; Chen, Y.; Tao, Y.; Yang, Z.; Zhang, Y.; Huang, S.; Bu, L.; Wang, C.; Wu, L.; et al. Network structure of insomnia and depressive symptoms among shift workers in China. Sleep Med. 2022, 100, 150–156. [Google Scholar] [CrossRef]
- Nutt, D.; Wilson, S.; Paterson, L. Sleep disorders as core symptoms of depression. Dialogues Clin. Neurosci. 2008, 10, 329–336. [Google Scholar] [CrossRef] [PubMed]
- Riemann, D.; Krone, L.B.; Wulff, K.; Nissen, C. Sleep, insomnia, and depression. Neuropsychopharmacology 2020, 45, 74–89. [Google Scholar] [CrossRef]
- Staner, L. Sleep and anxiety disorders. Dialogues Clin. Neurosci. 2003, 5, 249–258. [Google Scholar] [CrossRef]
- Chellappa, S.L.; Aeschbach, D. Sleep and anxiety: From mechanisms to interventions. Sleep Med. Rev. 2022, 61, 101583. [Google Scholar] [CrossRef]
- Uhde, T.W.; Cortese, B.M.; Vedeniapin, A. Anxiety and sleep problems: Emerging concepts and theoretical treatment implications. Curr. Psychiatry Rep. 2009, 11, 269–276. [Google Scholar] [CrossRef]
- Fang, H.; Tu, S.; Sheng, J.; Shao, A. Depression in sleep disturbance: A review on a bidirectional relationship, mechanisms and treatment. J. Cell. Mol. Med. 2019, 23, 2324–2332. [Google Scholar] [CrossRef] [PubMed]
- Eysenck, M.W.; Fajkowska, M. Anxiety and depression: Toward overlapping and distinctive features. Cogn. Emot. 2018, 32, 1391–1400. [Google Scholar] [CrossRef]
- Clark, L.A.; Watson, D. Tripartite model of anxiety and depression: Psychometric evidence and taxonomic implications. J. Abnorm. Psychol. 1991, 100, 316–336. [Google Scholar] [CrossRef]
- Mineka, S.; Watson, D.; Clark, L.A. Comorbidity of anxiety and unipolar mood disorders. Annu. Rev. Psychol. 1998, 49, 377–412. [Google Scholar] [CrossRef]
- Khazanov, G.K.; Ruscio, A.M. Is low positive emotionality a specific risk factor for depression? A meta-analysis of longitudinal studies. Psychol. Bull. 2016, 142, 991–1015. [Google Scholar] [CrossRef]
- Hisler, G.C.; Krizan, Z.; DeHart, T.; Wright, A.G.C. Neuroticism as the intensity, reactivity, and variability in day-to-day affect. J. Res. Pers. 2020, 87, 103964. [Google Scholar] [CrossRef]
- Williams, D.G. Effects of psychoticism, extraversion, and neuroticism in current mood: A statistical review of six studies. Pers. Individ. Differ. 1990, 11, 615–630. [Google Scholar] [CrossRef]
- Tao, Y.; Hou, W.; Niu, H.; Ma, Z.; Shuang, Z.; Zhang, L.; Liu, X. Centrality and bridge symptoms of anxiety, depression, and sleep disturbance among college students during the COVID-19 pandemic—A network analysis. Curr. Psychol. 2022, 41, 1–12. [Google Scholar] [CrossRef] [PubMed]
- Ng, W. Clarifying the relation between neuroticism and positive emotions. Pers. Individ. Differ. 2009, 47, 69–72. [Google Scholar] [CrossRef]
- McNally, R.J. Networks and Nosology in Posttraumatic Stress Disorder. JAMA Psychiatry 2017, 74, 124–125. [Google Scholar] [CrossRef] [PubMed]
- Smith, E.M.; Reynolds, S.; Orchard, F.; Whalley, H.C.; Chan, S.W.Y. Cognitive biases predict symptoms of depression, anxiety and wellbeing above and beyond neuroticism in adolescence. J. Affect. Disord. 2018, 241, 446–453. [Google Scholar] [CrossRef]
- Ormel, J.; Bastiaansen, A.; Riese, H.; Bos, E.H.; Servaas, M.; Ellenbogen, M.; Rosmalen, J.G.M.; Aleman, A. The biological and psychological basis of neuroticism: Current status and future directions. Neurosci. Biobehav. Rev. 2013, 37, 59–72. [Google Scholar] [CrossRef]
- He, M.; Li, K.; Tan, X.; Zhang, L.; Su, C.; Luo, K.; Luo, X.; Liu, C.; Zhao, M.; Zhan, X.; et al. Association of burnout with depression in pharmacists: A network analysis. Front. Psychiatry 2023, 14, 1145606. [Google Scholar] [CrossRef]
- Ritchie, T.D.; Sedikides, C.; Wildschut, T.; Arndt, J.; Gidron, Y. Self-concept Clarity Mediates the Relation between Stress and Subjective Well-being. Self Identity 2011, 10, 493–508. [Google Scholar] [CrossRef]
- Julom, A.M.; de Guzmán, R. The effectiveness of logotherapy program in alleviating the sense of meaninglessness of paralyzed in-patients. Int. J. Psychol. Psychol. Ther. 2013, 13, 357–371. [Google Scholar]
- Frankl, V.E. Man’s Search for Meaning; Simon and Schuster: New York, NY, USA, 1985. [Google Scholar]
- Robatmili, S.; Sohrabi, F.; Shahrak, M.A.; Talepasand, S.; Nokani, M.; Hasani, M. The Effect of Group Logotherapy on Meaning in Life and Depression Levels of Iranian Students. Int. J. Adv. Couns. 2015, 37, 54–62. [Google Scholar] [CrossRef]
- Sun, F.-K.; Chiu, N.-M.; Yao, Y.; Wu, M.-K.; Hung, C.-F.; Chen, C.-C.; Lee, Y.-H.; Chiang, C.-Y. The effects of logotherapy on meaning in life, depression, hopelessness, and suicidal ideation, in patients with depression: An intervention study. Perspect. Psychiatr. Care 2022, 58, 1891–1899. [Google Scholar] [CrossRef]
- Hervás, G.; Vázquez, C. Construction and validation of a measure of integrative well-being in seven languages: The Pemberton Happiness Index. Health Qual. Life Outcomes 2013, 11, 66. [Google Scholar] [CrossRef] [PubMed]
- Huta, V. An overview of hedonic and eudaimonic well-being concepts. In Handbook of Media Use and Well-Being; Routledge: New York, NY, USA, 2016; Volume 2. [Google Scholar]
- Delle Fave, A.; Brdar, I.; Freire, T.; Vella-Brodrick, D.; Wissing, M.P. The Eudaimonic and Hedonic Components of Happiness: Qualitative and Quantitative Findings. Soc. Indic. Res. 2011, 100, 185–207. [Google Scholar] [CrossRef]
- Wenzler, S.; Hagen, M.; Tarvainen, M.P.; Hilke, M.; Ghirmai, N.; Huthmacher, A.-C.; Trettin, M.; van Dick, R.; Reif, A.; Oertel-Knöchel, V. Intensified emotion perception in depression: Differences in physiological arousal and subjective perceptions. Psychiatry Res. 2017, 253, 303–310. [Google Scholar] [CrossRef] [PubMed]
- Brandel, M.; Vescovelli, F.; Ruini, C. Beyond Ryff’s scale: Comprehensive measures of eudaimonic well-being in clinical populations. A systematic review. Clin. Psychol. Psychother. 2017, 24, O1524–O1546. [Google Scholar] [CrossRef] [PubMed]


Disclaimer/Publisher’s Note: The statements, opinions and data contained in all publications are solely those of the individual author(s) and contributor(s) and not of MDPI and/or the editor(s). MDPI and/or the editor(s) disclaim responsibility for any injury to people or property resulting from any ideas, methods, instructions or products referred to in the content. |
© 2023 by the authors. Licensee MDPI, Basel, Switzerland. This article is an open access article distributed under the terms and conditions of the Creative Commons Attribution (CC BY) license (https://creativecommons.org/licenses/by/4.0/).