


Adaptation and Validation of the Spanish Version of the Smartphone Application-Based Addiction Scale (SABAS)

 , , and
Abstract
:1. Introduction
2. Materials and Methods
2.1. Participants and Procedure
2.2. Translation and Adaptation
2.3. Measurements
2.4. Data Analysis
3. Results
4. Discussion
Author Contributions
Funding
Institutional Review Board Statement
Informed Consent Statement
Data Availability Statement
Conflicts of Interest
References
- Abbey, J. D., & Meloy, M. G. (2017). Attention by design: Using attention checks to detect inattentive respondents and improve data quality. Journal of Operations Management, 53, 63–70. [Google Scholar] [CrossRef]
- Al-Qarni, M. S., & El Keshky, M. E. (2022). Psychometric properties of the Arabic short version of the Smartphone Addiction Scale (SAS-SV) in Saudi Arabia. Journal of King Abdulaziz University Arts and Humanities, 30(2), 407–420. [Google Scholar] [CrossRef]
- Andrade, A. L. M., Scatena, A., Martins, G. D. G., de O. Pinheiro, B., Becker da Silva, A., Enes, C. C., de Oliveira, W. A., & Kim, D.-J. (2020). Validation of smartphone addiction scale—Short version (SAS-SV) in Brazilian adolescents. Addictive Behaviors, 110, 106540. [Google Scholar] [CrossRef] [PubMed]
- Arenz, A., & Schnauber-Stockmann, A. (2024). Who “phubs”? A systematic meta-analytic review of phubbing predictors. Mobile Media & Communication, 12(3), 637–661. [Google Scholar] [CrossRef]
- Banskota, S., Healy, M., & Goldberg, E. M. (2020). 15 smartphone apps for older adults to use while in isolation during the COVID-19 pandemic. Western Journal of Emergency Medicine, 21(3), 514–525. [Google Scholar] [CrossRef] [PubMed]
- Billieux, J., Maurage, P., Lopez-Fernandez, O., Kuss, D. J., & Griffiths, M. D. (2015a). Can disordered mobile phone use be considered a behavioral addiction? An update on current evidence and a comprehensive model for future research. Current Addiction Reports, 2(2), 156–162. [Google Scholar] [CrossRef]
- Billieux, J., Schimmenti, A., Khazaal, Y., Maurage, P., & Heeren, A. (2015b). Are we overpathologizing everyday life? A tenable blueprint for behavioral addiction research. Journal of Behavioral Addictions, 4(3), 119–123. [Google Scholar] [CrossRef]
- Busch, P. A., & McCarthy, S. (2021). Antecedents and consequences of problematic smartphone use: A systematic literature review of an emerging research area. Computers in Human Behavior, 114, 106414. [Google Scholar] [CrossRef]
- Byrne, B. M. (2010). Structural equation modeling with AMOS: Basic concepts, applications, and programming. Taylor and Francis Group Publication. [Google Scholar]
- Candussi, C. J., Kabir, R., & Sivasubramanian, M. (2023). Problematic smartphone usage, prevalence and patterns among university students: A systematic review. Journal of Affective Disorders Reports, 14, 100643. [Google Scholar] [CrossRef]
- Chandran, V. P., Balakrishnan, A., Rashid, M., Pai Kulyadi, G., Khan, S., Devi, E. S., Nair, S., & Thunga, G. (2022). Mobile applications in medical education: A systematic review and meta-analysis. PLoS ONE, 17(3), e0265927. [Google Scholar] [CrossRef]
- Chen, I. H., Ahorsu, D. K., Pakpour, A. H., Griffiths, M. D., Lin, C. Y., & Chen, C. Y. (2020). Psychometric properties of three simplified Chinese online-related addictive behavior instruments among mainland Chinese primary school students. Frontiers in Psychiatry, 11, 875. [Google Scholar] [CrossRef]
- Chóliz, M. (2010). Mobile phone addiction: A point of issue. Addiction, 105(2), 373–374. [Google Scholar] [CrossRef] [PubMed]
- Comrey, A. L., & Lee, H. B. (1992). A first course in factor analysis (2nd ed.). Lawrence Erlbaum Associates. [Google Scholar]
- Coyne, S. M., Stockdale, L., & Summers, K. (2019). Problematic cell phone use, depression, anxiety, and self-regulation: Evidence from a three year longitudinal study from adolescence to emerging adulthood. Computers in Human Behavior, 96, 78–84. [Google Scholar] [CrossRef]
- Csibi, S., Demetrovics, Z., & Szabo, A. (2016). Hungarian adaptation and psychometric characteristics of Brief Addiction to Smartphone Scale (BASS). Psychiatria Hungarica, 31(1), 71–77. [Google Scholar]
- Csibi, S., Griffiths, M. D., Cook, B., Demetrovics, Z., & Szabo, A. (2018). The psychometric properties of the smartphone application-based addiction scale (SABAS). International Journal of Mental Health and Addiction, 16(2), 393–403. [Google Scholar] [CrossRef]
- Daza, P., Novy, D. M., Stanley, M. A., & Averill, P. (2002). The depression anxiety stress scale-21: Spanish translation and validation with a Hispanic sample. Journal of Psychopathology and Behavioral Assessment, 24, 195–205. [Google Scholar] [CrossRef]
- DeVellis, R. F. (2016). Scale development: Theory and applications (4th ed.). SAGE. [Google Scholar]
- Ding, Y., Huang, H., Zhang, Y., Peng, Q., Yu, J., Lu, G., Wu, H., & Chen, C. (2022). Correlations between smartphone addiction and alexithymia, attachment style, and subjective well-being: A meta-analysis. Frontiers in Psychology, 13, 971735. [Google Scholar] [CrossRef]
- Dodou, D., & de Winter, J. C. (2014). Social desirability is the same in offline, online, and paper surveys: A meta-analysis. Computers in Human Behavior, 36, 487–495. [Google Scholar] [CrossRef]
- Elhai, J. D., Levine, J. C., & Hall, B. J. (2019). The relationship between anxiety symptom severity and problematic smartphone use: A review of the literature and conceptual frameworks. Journal of Anxiety Disorders, 62, 45–52. [Google Scholar] [CrossRef]
- Elhai, J. D., Yang, H., & Montag, C. (2020). Fear of missing out (FOMO): Overview, theoretical underpinnings, and literature review on relations with severity of negative affectivity and problematic technology use. Brazilian Journal of Psychiatry, 43(2), 203–209. [Google Scholar] [CrossRef]
- EORTC Quality of Life Group. (2017). Translation procedure. Available online: https://www.eortc.org/app/uploads/sites/2/2018/02/translation_manual_2017.pdf (accessed on 11 March 2025).
- Ge, M. W., Hu, F. H., Jia, Y. J., Tang, W., Zhang, W. Q., Zhao, D. Y., Shen, W. Q., & Chen, H. L. (2023). The relationship between loneliness and internet or smartphone addiction among adolescents: A systematic review and meta-analysis. Psychological Reports. [Google Scholar] [CrossRef] [PubMed]
- Gignac, G. E., & Szodorai, E. T. (2016). Effect size guidelines for individual differences researchers. Personality and Individual Differences, 102, 74–78. [Google Scholar] [CrossRef]
- Gil, F., Oberst, U., Del Valle, G., & Chamarro, A. (2015). Nuevas tecnologías—¿Nuevas patologías? El Smartphone y el fear of missing out. Aloma: Revista de Psicologia, Ciències de l’Educació i de l’Esport, 33(2), 77–83. [Google Scholar] [CrossRef]
- Griffiths, M. (2005). A ‘components’ model of addiction within a biopsychosocial framework. Journal of Substance Use, 10(4), 191–197. [Google Scholar] [CrossRef]
- Hair, J. F., Black, W. C., Babin, B. J., & Anderson, R. E. (2010). Multivariate data analysis: A global perspective. Prentice Hall. [Google Scholar]
- Hall, D. A., Zaragoza Domingo, S., Hamdache, L. Z., Manchaiah, V., Thammaiah, S., Evans, C., & Wong, L. L. N. (2017). A good practice guide for translating and adapting hearing-related questionnaires for different languages and cultures. International Journal of Audiology, 57(3), 161–175. [Google Scholar] [CrossRef] [PubMed]
- Harris, B., McCredie, M., & Fields, S. (2020a). Examining the psychometric properties of the smartphone addiction scale and its short version for use with emerging adults in the US. Computers in Human Behavior Reports, 1, 100011. [Google Scholar] [CrossRef]
- Harris, B., Regan, T., Schueler, J., & Fields, S. A. (2020b). Problematic mobile phone and smartphone use scales: A systematic review. Frontiers in Psychology, 11, 672. [Google Scholar] [CrossRef]
- Hidalgo-Fuentes, S. (2022). Problematic smartphone use and procrastination in the academic setting: A meta-analysis. Electronic Journal of Research in Educational Psychology, 20(57), 449–468. [Google Scholar] [CrossRef]
- Hidalgo-Fuentes, S. (2023a). La relación entre el uso problemático del smartphone y el fear of missing out: Un meta-análisis. Revista Psicodebate: Psicología, Cultura y Sociedad, 23(1), 23–34. [Google Scholar] [CrossRef]
- Hidalgo-Fuentes, S. (2023b). Smartphone application-based addiction scale: Un meta-análisis de generalización de la fiabilidad. European Journal of Education and Psychology, 16(1), 1–20. [Google Scholar] [CrossRef]
- Horwood, S., & Anglim, J. (2018). Personality and problematic smartphone use: A facet-level analysis using the five factor model and HEXACO frameworks. Computers in Human Behavior, 85, 349–359. [Google Scholar] [CrossRef]
- Hu, L. T., & Bentler, P. M. (1999). Cutoff criteria for fit indices in covariance structure model: Conventional criteria versus new alternatives. Structural Equation Modeling, 6(1), 1–55. [Google Scholar] [CrossRef]
- Huang, S., Lai, X., Ke, L., Qin, X., Yan, J. J., Xie, Y., Dai, X., & Wang, Y. (2023). Coping styles among Chinese adolescents: The development and validation of a smartphone coping style scale. Journal of Children and Media, 17(4), 488–505. [Google Scholar] [CrossRef]
- INE. (2024). Encuesta sobre equipamiento y uso de tecnologías de la información y comunicación (TIC) en los hogares. Año 2024. Available online: https://www.ine.es/dyngs/Prensa/es/TICH2024.htm (accessed on 17 December 2024).
- Islam, S., Sujan, S. H., Tasnim, R., Mohona, R. A., Ferdous, M. Z., Kamruzzaman, S., Toma, T. Y., Sakib, N., Pinky, K. N., Islam, R., Siddique, A. B., Anter, F. S., Hossain, A., Hossen, I., Sikder, T., & Pontes, H. M. (2021). Problematic smartphone and social media use among Bangladeshi college and university students amid COVID-19: The role of psychological well-being and pandemic related factors. Frontiers in Psychiatry, 12, 647386. [Google Scholar] [CrossRef]
- Kardefelt-Winther, D. (2017). Conceptualizing internet use disorders: Addiction or coping process? Psychiatry and Clinical Neurosciences, 71(7), 459–466. [Google Scholar] [CrossRef] [PubMed]
- Kim, E., & Koh, E. (2018). Avoidant attachment and smartphone addiction in college students: The mediating effects of anxiety and self-esteem. Computers in Human Behavior, 84, 264–271. [Google Scholar] [CrossRef]
- Knekta, E., Runyon, C., & Eddy, S. (2019). One size doesn’t fit all: Using factor analysis to gather validity evidence when using surveys in your research. CBE—Life Sciences Education, 18(1), rm1. [Google Scholar] [CrossRef]
- Koller, M., Aaronson, N. K., Blazeby, J., Bottomley, A., Dewolf, L., Fayers, P., Johnson, C., Ramage, J., Scott, N., & West, K. (2007). Translation procedures for standardised quality of life questionnaires: The European Organisation for Research and Treatment of Cancer (EORTC) approach. European Journal of Cancer, 43(12), 1810–1820. [Google Scholar] [CrossRef]
- Korkmaz, S., Goksuluk, D., & Zararsiz, G. (2014). MVN: An R package for assessing multivariate normality. The R Journal, 6(2), 151–162. [Google Scholar] [CrossRef]
- Kwon, M., Kim, D. J., Cho, H., & Yang, S. (2013a). The smartphone addiction scale: Development and validation of a short version for adolescents. PLoS ONE, 8(12), e83558. [Google Scholar] [CrossRef]
- Kwon, M., Lee, J. Y., Won, W. Y., Park, J. W., Min, J. A., Hahn, C., Gu, X., Choi, J. Y., & Kim, D. J. (2013b). Development and validation of a smartphone addiction scale (SAS). PLoS ONE, 8(2), e56936. [Google Scholar] [CrossRef] [PubMed]
- Lee, S.-Y., Lee, D., Nam, C. R., Kim, D. Y., Park, S., Kwon, J.-G., Kweon, Y.-S., Lee, Y., Kim, D. J., & Choi, J.-S. (2018). Distinct patterns of internet and smartphone-related problems among adolescents by gender: Latent class analysis. Journal of Behavioral Addictions, 7(2), 454–465. [Google Scholar] [CrossRef] [PubMed]
- Leow, M. Q. H., Chiang, J., Chua, T. J. X., Wang, S., & Tan, N. C. (2023). The relationship between smartphone addiction and sleep among medical students: A systematic review and meta-analysis. PLoS ONE, 18(9), e0290724. [Google Scholar] [CrossRef]
- Leung, H., Pakpour, A. H., Strong, C., Lin, Y.-C., Tsai, M.-C., Griffiths, M. D., Lin, C.-Y., & Chen, I.-H. (2020). Measurement invariance across young adults from Hong Kong and Taiwan among three internet-related addiction scales: Bergen Social Media Addiction Scale (BSMAS), Smartphone Application-Based Addiction Scale (SABAS), and Internet Gaming Disorder Scale-Short Form (IGDS-SF9) (study part A). Addictive Behaviors, 101, 105969. [Google Scholar] [CrossRef]
- Leung, L. (2008). Linking psychological attributes to addiction and improper use of the mobile phone among adolescents in Hong Kong. Journal of Children and Media, 2(2), 93–113. [Google Scholar] [CrossRef]
- Lin, C. Y., Imani, V., Broström, A., Nilsen, P., Fung, X. C., Griffiths, M. D., & Pakpour, A. H. (2019). Smartphone application-based addiction among Iranian adolescents: A psychometric study. International Journal of Mental Health and Addiction, 17, 765–780. [Google Scholar] [CrossRef]
- Lin, Y. H., Chang, L. R., Lee, Y. H., Tseng, H. W., Kuo, T. B., & Chen, S. H. (2014). Development and validation of the Smartphone Addiction Inventory (SPAI). PLoS ONE, 9(6), e98312. [Google Scholar] [CrossRef]
- Lopez-Fernandez, O. (2017). Short version of the Smartphone Addiction Scale adapted to Spanish and French: Towards a cross-cultural research in problematic mobile phone use. Addictive Behaviors, 64, 275–280. [Google Scholar] [CrossRef]
- Lovibond, P. F., & Lovibond, S. H. (1995). The structure of negative emotional states: Comparison of the Depression Anxiety Stress Scales (DASS) with the Beck Depression and Anxiety Inventories. Behaviour Research and Therapy, 33(3), 335–343. [Google Scholar] [CrossRef]
- Lowe-Calverley, E., & Pontes, H. M. (2020). Challenging the concept of smartphone addiction: An empirical pilot study of smartphone usage patterns and psychological well-being. Cyberpsychology, Behavior, and Social Networking, 23(8), 550–556. [Google Scholar] [CrossRef]
- Luk, T. T., Wang, M. P., Shen, C., Wan, A., Chau, P. H., Oliffe, J., Viswanath, K., Chan, S. S., & Lam, T. H. (2018). Short version of the Smartphone Addiction Scale in Chinese adults: Psychometric properties, sociodemographic, and health behavioral correlates. Journal of Behavioral Addictions, 7(4), 1157–1165. [Google Scholar] [CrossRef] [PubMed]
- Mahajan, R., Gupta, R., & Bakhshi, A. (2017). Personality, loneliness and subjective well-being as predictors of problematic mobile phone usage. International Journal of Applied Social Science, 4, 472–482. [Google Scholar]
- Mardia, K. V. (1970). Measures of multivariate skewness and kurtosis with applications. Biometrika, 57(3), 519–530. [Google Scholar] [CrossRef]
- Martínez, M. R., Hernández, M. J., & Hernández, M. V. (2014). Psicometría. Alianza Editorial. [Google Scholar]
- Mason, A., Winter, T., Riordan, B. C., Griffiths, M. D., & Scarf, D. (2022). Evaluation of the English version of the Smartphone Application-Based Addiction Scale (SABAS) among an adolescent sample. Psych, 4(4), 961–968. [Google Scholar] [CrossRef]
- McHorney, C. A., & Tarlov, A. R. (1995). Individual-patient monitoring in clinical practice: Are available health status surveys adequate? Quality of Life Research, 4(4), 293–307. [Google Scholar] [CrossRef] [PubMed]
- Meade, A. W. (2005, April 2–5). Sample size and tests of measurement invariance. Annual Conference of the Society for Industrial and Organizational Psychology, Los Angeles, CA, USA. [Google Scholar]
- Meng, S.-Q., Cheng, J.-L., Li, Y.-Y., Yang, X.-Q., Zheng, J.-W., Chang, X.-W., Shi, Y., Chen, Y., Lu, L., Sun, Y., Bao, Y.-P., & Shi, J. (2022). Global prevalence of digital addiction in general population: A systematic review and meta-analysis. Clinical Psychology Review, 92, 102128. [Google Scholar] [CrossRef]
- Ministry of Science, Innovation and Universities. (2025). Integrated University Information System (SIIU). Available online: https://estadisticas.universidades.gob.es/jaxiPx/Datos.htm?path=/Universitaria/Alumnado/EEU_2024/GradoCiclo/Matriculados//l0/&file=3_9_Mat_Sex_Ded_Campo_Univ.px (accessed on 10 March 2025).
- Montag, C., Wegmann, E., Sariyska, R., Demetrovics, Z., & Brand, M. (2021). How to overcome taxonomical problems in the study of internet use disorders and what to do with “smartphone addiction”? Journal of Behavioral Addictions, 9(4), 908–914. [Google Scholar] [CrossRef]
- Moses, J. C., Adibi, S., Shariful Islam, S. M., Wickramasinghe, N., & Nguyen, L. (2021). Application of smartphone technologies in disease monitoring: A systematic review. Healthcare, 9(7), 889. [Google Scholar] [CrossRef]
- Muñiz, J., Elosua, P., & y Hambleton, R. K. (2013). Directrices para la traducción y adaptación de los tests: Segunda edición. Psicothema, 25(2), 151–157. [Google Scholar] [CrossRef]
- Nawaz, S., Bhowmik, J., Linden, T., & Mitchell, M. (2024). Validation of a modified problematic use of mobile phones scale to examine problematic smartphone use and dependence. Heliyon, 10(2), e24832. [Google Scholar] [CrossRef]
- Nichols, A. L., & Edlund, J. E. (2020). Why don’t we care more about carelessness? Understanding the causes and consequences of careless participants. International Journal of Social Research Methodology, 23(6), 625–638. [Google Scholar] [CrossRef]
- Nikolic, A., Bukurov, B., Kocic, I., Soldatovic, I., Mihajlovic, S., Nesic, D., Vukovic, M., Ladjevic, N., & Grujicic, S. S. (2022). The validity and reliability of the Serbian version of the Smartphone Addiction Scale—Short version. International Journal of Environmental Research and Public Health, 19(3), 1245. [Google Scholar] [CrossRef] [PubMed]
- Nunnally, J. C., & Bernstein, I. H. (1994). Psychometric theory (3rd ed.). McGraw-Hill. [Google Scholar]
- Nurmala, I., Nadhiroh, S. R., Pramukti, I., Tyas, L. W., Zari, A. P., Griffiths, M. D., & Lin, C. Y. (2022). Reliability and validity study of the Indonesian Smartphone Application-Based Addiction Scale (SABAS) among college students. Heliyon, 8(8), e10403. [Google Scholar] [CrossRef] [PubMed]
- Olson, J. A., Sandra, D. A., Colucci, É. S., Al Bikaii, A., Chmoulevitch, D., Nahas, J., Raz, A., & Veissière, S. P. L. (2022). Smartphone addiction is increasing across the world: A meta-analysis of 24 countries. Computers in Human Behavior, 129, 107138. [Google Scholar] [CrossRef]
- Osorio-Molina, C., Martos-Cabrera, M. B., Membrive-Jiménez, M. J., Vargas-Roman, K., Suleiman-Martos, N., Ortega-Campos, E., & Gómez-Urquiza, J. L. (2021). Smartphone addiction, risk factors and its adverse effects in nursing students: A systematic review and meta-analysis. Nurse Education Today, 98, 104741. [Google Scholar] [CrossRef]
- Panova, T., & Carbonell, X. (2018). Is smartphone addiction really an addiction? Journal of Behavioral Addictions, 7(2), 252–259. [Google Scholar] [CrossRef]
- Przybylski, A. K., Murayama, K., DeHaan, C. R., & Gladwell, V. (2013). Motivational, emotional, and behavioral correlates of fear of missing out. Computers in Human Behavior, 29(4), 1841–1848. [Google Scholar] [CrossRef]
- Ran, G., Li, J., Zhang, Q., & Niu, X. (2022). The association between social anxiety and mobile phone addiction: A three-level meta-analysis. Computers in Human Behavior, 130, 107198. [Google Scholar] [CrossRef]
- Randjelovic, P., Stojiljkovic, N., Radulovic, N., Stojanovic, N., & Ilic, I. (2021). Problematic smartphone use, screen time and chronotype correlations in university students. European Addiction Research, 27(1), 67–74. [Google Scholar] [CrossRef]
- Ratan, Z. A., Parrish, A. M., Zaman, S. B., Alotaibi, M. S., & Hosseinzadeh, H. (2021). Smartphone addiction and associated health outcomes in adult populations: A systematic review. International Journal of Environmental Research and Public Health, 18(22), 12257. [Google Scholar] [CrossRef]
- Revelle, W. (2021). psych: Procedures for psychological, psychometric, and personality research [Computer software]. Available online: https://personality-project.org/r/psych-manual.pdf (accessed on 17 December 2024).
- Rosseel, Y. (2012). Lavaan: An R package for structural equation modeling. Journal of Statistical Software, 48(2), 1–36. [Google Scholar] [CrossRef]
- Ruckwongpatr, K., Paratthakonkun, C., Sangtongdee, U., Pramukti, I., Nurmala, I., Angkasith, K., Thanachaisakul, W., Ketchatturat, J., Griffiths, M. D., Kao, Y.-K., & Lin, C.-Y. (2024). Validity, reliability, and measurement invariance of the Thai smartphone application-based addiction scale and Bergen Social Media Addiction Scale. International Journal of Mental Health Promotion, 26(4), 293–302. [Google Scholar] [CrossRef]
- Ryding, F. C., & Kuss, D. J. (2020). Passive objective measures in the assessment of problematic smartphone use: A systematic review. Addictive Behaviors Reports, 11, 100257. [Google Scholar] [CrossRef]
- Santander-Hernández, F. M., Peralta, C. I., Guevara-Morales, M. A., Díaz-Vélez, C., & Valladares-Garrido, M. J. (2022). Smartphone overuse, depression & anxiety in medical students during the COVID-19 pandemic. PLoS ONE, 17(8), e0273575. [Google Scholar] [CrossRef]
- Servidio, R., Griffiths, M. D., Di Nuovo, S., Sinatra, M., & Monacis, L. (2023). Further exploration of the psychometric properties of the revised version of the Italian Smartphone Addiction Scale–Short Version (SAS-SV). Current Psychology, 42(31), 27245–27258. [Google Scholar] [CrossRef]
- Shi, X., Wang, A., & Zhu, Y. (2023). Longitudinal associations among smartphone addiction, loneliness, and depressive symptoms in college students: Disentangling between–and within–person associations. Addictive Behaviors, 142, 107676. [Google Scholar] [CrossRef] [PubMed]
- Soraci, P., Ferrari, A., Antonino, U., & Griffiths, M. D. (2021). Psychometric properties of the Italian version of the Smartphone Application-Based Addiction Scale (SABAS). International Journal of Mental Health and Addiction, 19, 1261–1273. [Google Scholar] [CrossRef]
- Statista. (2024). Number of smartphone users worldwide from 2014 to 2029. Available online: https://www.statista.com/forecasts/1143723/smartphone-users-in-the-world (accessed on 17 December 2024).
- Sunday, O. J., Adesope, O. O., & Maarhuis, P. L. (2021). The effects of smartphone addiction on learning: A meta-analysis. Computers in Human Behavior Reports, 4, 100114. [Google Scholar] [CrossRef]
- Taplin, R. H. (2024). Quantifying data quality after removing respondents who fail data quality checks. Current Issues in Tourism, 1–12. [Google Scholar] [CrossRef]
- Thomée, S. (2018). Mobile phone use and mental health. A review of the research that takes a psychological perspective on exposure. International Journal of Environmental Research and Public Health, 15(12), 2692. [Google Scholar] [CrossRef]
- Timmers, T., Janssen, L., Kool, R. B., & Kremer, J. A. (2020). Educating patients by providing timely information using smartphone and tablet apps: Systematic review. Journal of Medical Internet Research, 22(4), e17342. [Google Scholar] [CrossRef] [PubMed]
- Tung, S., Gan, W., Chen, J.-S., Ruckwongpatr, K., Pramukti, I., Nadhiroh, S., Chang, Y.-L., Lin, C.-C., Pakpour, A., Lin, C.-Y., & Griffiths, M. (2022). Internet-related instruments (Bergen Social Media Addiction Scale, Smartphone Application-Based Addiction Scale, Internet Gaming Disorder Scale-Short Form, and Nomophobia Questionnaire) and their associations with distress among Malaysian university students. Healthcare, 10(8), 1448. [Google Scholar] [CrossRef]
- Turner, A. (2024). Smartphone addiction facts & phone usage statistics: The definitive guide (2020–2024 update). Available online: https://www.bankmycell.com/blog/smartphone-addiction/ (accessed on 17 December 2024).
- Ullman, J. B. (2014). Structural equation modeling. In B. G. Tabachnick, & L. S. Fidell (Eds.), Using multivariate statistics (6th ed.). Pearson Education. [Google Scholar]
- Vally, Z., & Alowais, A. (2020). Assessing risk for smartphone addiction: Validation of an Arabic version of the Smartphone Application-Based Addiction Scale. International Journal of Mental Health and Addiction, 20(2), 691–703. [Google Scholar] [CrossRef]
- Vujić, A., Volarov, M., Latas, M., Griffiths, M. D., & Szabo, A. (2023). Psychometric properties of the Serbian Smartphone Application-Based Addiction Scale (SABAS) and validation of the English version among non-native English speakers. International Journal of Mental Health and Addiction, 22, 2682–2705. [Google Scholar] [CrossRef]
- Ward, M. K., & Meade, A. W. (2023). Dealing with careless responding in survey data: Prevention, identification, and recommended best practices. Annual Review of Psychology, 74(1), 577–596. [Google Scholar] [CrossRef]
- Ward, M. K., Meade, A. W., Allred, C. M., Pappalardo, G., & Stoughton, J. W. (2017). Careless response and attrition as sources of bias in online survey assessments of personality traits and performance. Computers in Human Behavior, 76, 417–430. [Google Scholar] [CrossRef]
- Wegmann, E., Schiebener, J., & Brand, M. (2023). Social-networks use as adaptive or maladaptive strategy for coping with stress. Scientific Reports, 13(1), 11895. [Google Scholar] [CrossRef]
- Wolniewicz, C. A., Tiamiyu, M. F., Weeks, J. W., & Elhai, J. D. (2018). Problematic smartphone use and relations with negative affect, fear of missing out, and fear of negative and positive evaluation. Psychiatry Research, 262, 618–623. [Google Scholar] [CrossRef]
- World Health Organization. (2015). Public health implications of excessive use of the internet, computers, smartphones and similar electronic devices: Meeting report. Available online: http://apps.who.int/iris/bitstream/10665/184264/1/9789241509367_eng.pdf (accessed on 17 December 2024).
- Yam, C.-W., Pakpour, A. H., Griffiths, M. D., Yau, W.-Y., Lo, C.-L. M., Ng, J. M. T., Lin, C.-Y., & Leung, H. (2018). Psychometric testing of three Chinese online-related addictive behavior instruments among Hong Kong university students. Psychiatric Quarterly, 90(1), 117–128. [Google Scholar] [CrossRef]
- Yang, J., Fu, X., Liao, X., & Li, Y. (2020). Association of problematic smartphone use with poor sleep quality, depression, and anxiety: A systematic review and meta-analysis. Psychiatry Research, 284, 112686. [Google Scholar] [CrossRef]
- Yue, H., Yue, X., Liu, B., Li, X., Dong, Y., & Bao, H. (2023). Short version of the smartphone addiction scale: Measurement invariance across gender. PLoS ONE, 18(3), e0283256. [Google Scholar] [CrossRef] [PubMed]
- Zhong, Y., Ma, H., Liang, Y. F., Liao, C. J., Zhang, C. C., & Jiang, W. J. (2022). Prevalence of smartphone addiction among Asian medical students: A meta-analysis of multinational observational studies. International Journal of Social Psychiatry, 68(6), 1171–1183. [Google Scholar] [CrossRef] [PubMed]
- Zhou, H., Dang, L., Lam, L. W., Zhang, M. X., & Wu, A. M. (2021). A cross-lagged panel model for testing the bidirectional relationship between depression and smartphone addiction and the influences of maladaptive metacognition on them in Chinese adolescents. Addictive Behaviors, 120, 106978. [Google Scholar] [CrossRef] [PubMed]

| Variables | M | SD | n | % |
|---|---|---|---|---|
| Age | 20.88 | 4.58 | ||
| Gender | ||||
| Man | 222 | 74.75 | ||
| Woman | 75 | 25.25 | ||
| SABAS | 16.63 | 5.12 | ||
| SAS-SV | 25.43 | 8.21 | ||
| DASS-21 depression | 3.73 | 4.30 | ||
| DASS-21 anxiety | 4.09 | 4.39 | ||
| DASS-21 stress | 5.90 | 4.98 | ||
| FoMO | 21.81 | 7.06 | ||
| Daily hours spent using smartphones | ||||
| Less than 1 h | 1 | 0.3 | ||
| From 1 to 2 h | 11 | 3.7 | ||
| From 2 to 3 h | 33 | 11.1 | ||
| From 3 to 4 h | 68 | 22.9 | ||
| From 4 to 5 h | 89 | 30 | ||
| From 5 to 6 h | 50 | 16.8 | ||
| More than 6 h | 45 | 15.2 |
| Item | Statement | M | SD | Skew | Kurtosis | Corrected Item–Total Correlation | Cronbach’s Alpha If Item Deleted | McDonalds’s Omega If Item Deleted |
|---|---|---|---|---|---|---|---|---|
| 1 | ENG: My smartphone is the most important thing in my life ESP: Mi smartphone es la cosa más importante en mi vida | 2.64 | 1.23 | 0.36 | −0.41 | 0.42 | 0.69 | 0.70 |
| 2 | ENG: Conflicts have arisen between me and my family (or friends) because of my smartphone use ESP: Mi uso del smartphone ha provocado discusiones con mi familia (o amigos) | 2.35 | 1.36 | 0.89 | −0.01 | 0.34 | 0.72 | 0.72 |
| 3 | ENG: Preoccupying myself with my smartphone is a way of changing my mood (I get a buzz, or I can escape or get away, if I need to) ESP: Centrarme en mi smartphone es una forma de cambiar mi estado de ánimo (me anima, o puedo escapar o desconectarme si lo necesito) | 3.41 | 1.39 | −0.07 | −0.87 | 0.50 | 0.67 | 0.69 |
| 4 | ENG: Over time, I fiddle around more and more with my smartphone ESP: A lo largo del tiempo, jugueteo cada vez más con mi smartphone | 3.04 | 1.34 | 0.16 | −0.75 | 0.44 | 0.69 | 0.70 |
| 5 | ENG: If I cannot use or access my smartphone when I feel like, I feel sad, moody, or irritable ESP: Me siento triste, de mal humor o irritable cuando no puedo usar mi smartphone | 2.22 | 1.18 | 0.82 | 0.01 | 0.60 | 0.65 | 0.65 |
| 6 | ENG: If I try to cut the time I use my smartphone, I manage to do so for a while, but then I end up using it as much or more than before ESP: Si intento reducir el tiempo que uso mi smartphone, lo consigo por un tiempo, pero después termino usándolo igual o más que antes | 2.97 | 1.42 | 0.36 | −0.63 | 0.47 | 0.68 | 0.69 |
| Model | χ2 | df | p | RMSEA (90%IC) | SRMR | CFI |
|---|---|---|---|---|---|---|
| Model 1 (unidimensional) | 19.725 | 9 | 0.020 | 0.068 [0.026; 0.110] | 0.043 | 0.957 |
| Model 2 (unidimensional with MI) | 10.285 | 8 | 0.246 | 0.034 [0.000; 0.086] | 0.030 | 0.991 |
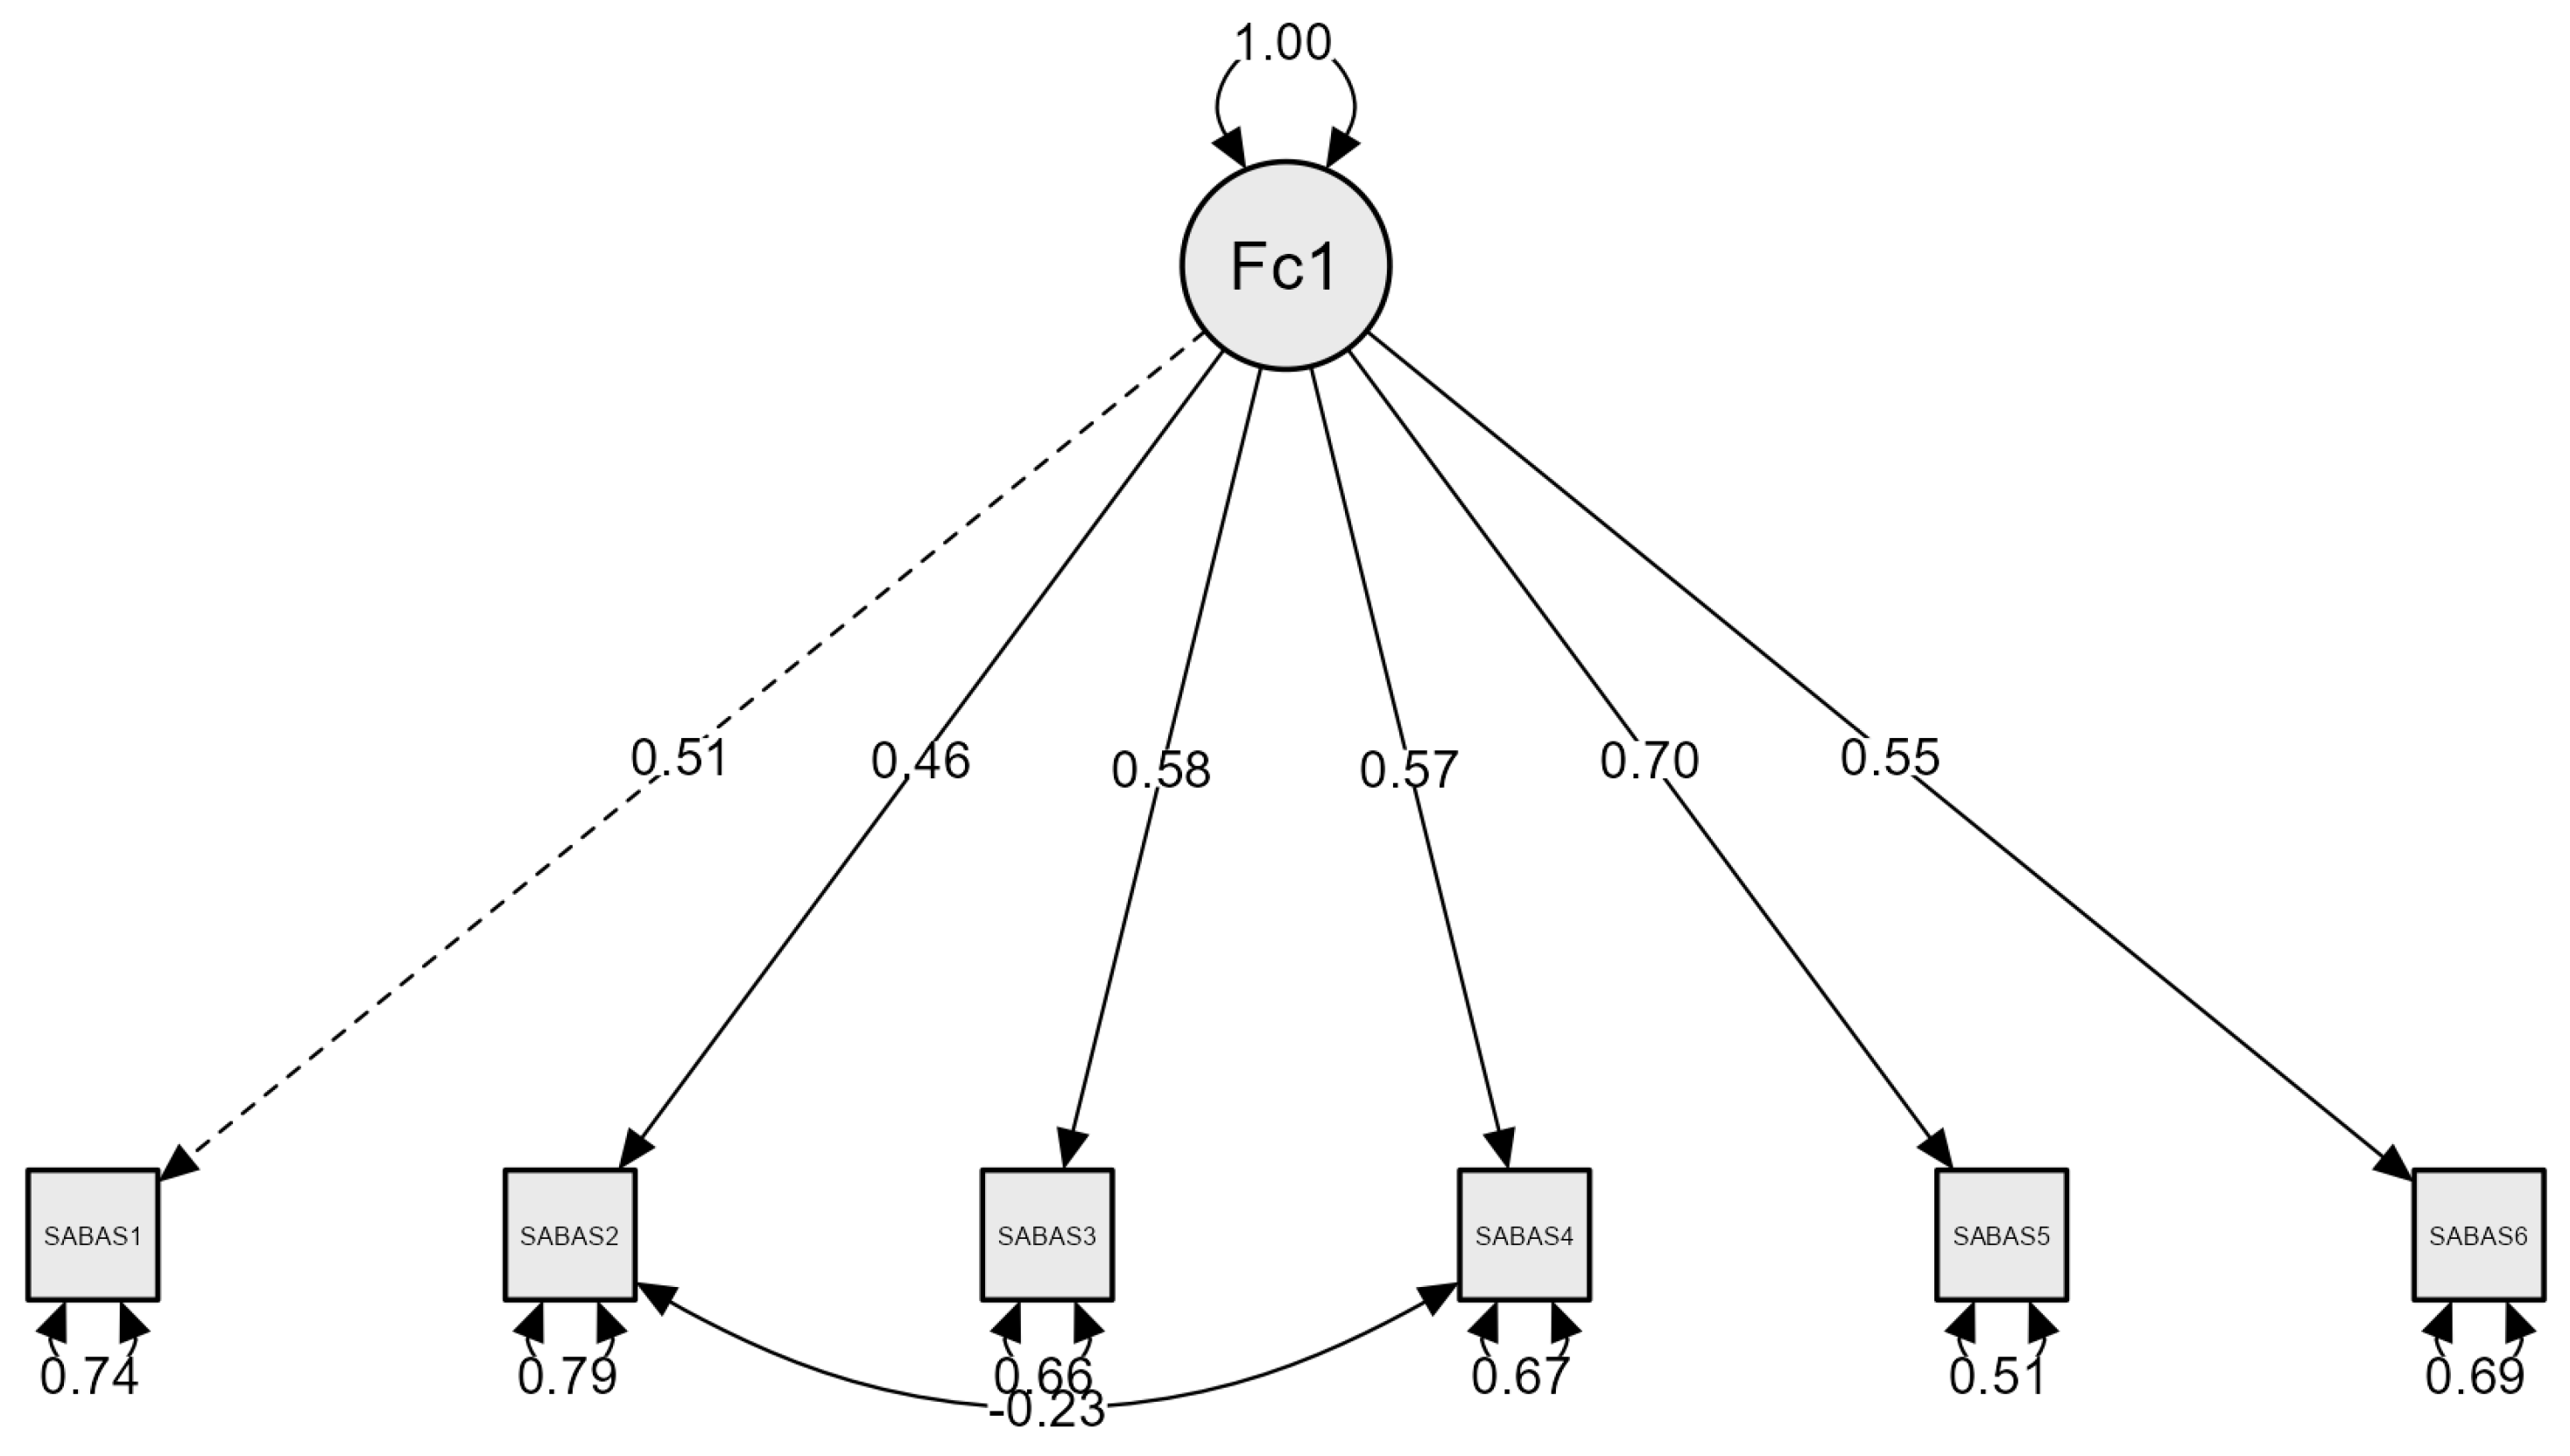
| Item | Unstandardized Loading (SE) | p | Unstandardized Loading CI95% | Sandardized Loading (SE) | p | Standardized Loading CI95% |
|---|---|---|---|---|---|---|
| 1 | 1.00 | 1.00; 1.00 | 0.51 (0.06) | <0.001 | 0.40; 0.62 | |
| 2 | 1.00 (0.20) | <0.001 | 0.61; 1.39 | 0.46 (0.06) | <0.001 | 0.35; 0.58 |
| 3 | 1.29 (0.19) | <0.001 | 0.93; 1.66 | 0.59 (0.04) | <0.001 | 0.50; 0.67 |
| 4 | 1.22 (0.20) | <0.001 | 0.83; 1.61 | 0.57 (0.06) | <0.001 | 0.47; 0.68 |
| 5 | 1.32 (0.15) | <0.001 | 1.02; 1.62 | 0.70 (0.05) | <0.001 | 0.61; 0.79 |
| 6 | 1.25 (0.19) | <0.001 | 0.87; 1.63 | 0.55 (0.06) | <0.001 | 0.44; 0.67 |
| Variables | r | CI 95% | p |
|---|---|---|---|
| Daily hours spent using smartphones | 0.327 | [0.222; 0.425] | <0.001 |
| SAS-SV | 0.728 | [0.669; 0.777] | <0.001 |
| DASS-21 depression | 0.279 | [0.170; 0.380] | <0.001 |
| DASS-21 anxiety | 0.325 | [0.219; 0.423] | <0.001 |
| DASS-21 stress | 0.277 | [0.169; 0.379] | <0.001 |
| FoMO | 0.408 | [0.308; 0.499] | <0.001 |
Disclaimer/Publisher’s Note: The statements, opinions and data contained in all publications are solely those of the individual author(s) and contributor(s) and not of MDPI and/or the editor(s). MDPI and/or the editor(s) disclaim responsibility for any injury to people or property resulting from any ideas, methods, instructions or products referred to in the content. |
© 2025 by the authors. Licensee MDPI, Basel, Switzerland. This article is an open access article distributed under the terms and conditions of the Creative Commons Attribution (CC BY) license (https://creativecommons.org/licenses/by/4.0/).
Share and Cite
Hidalgo-Fuentes, S.; Martínez-Álvarez, I.; Llamas-Salguero, F.; Villaseñor-León, M. Adaptation and Validation of the Spanish Version of the Smartphone Application-Based Addiction Scale (SABAS). Behav. Sci. 2025, 15, 496. https://doi.org/10.3390/bs15040496
Hidalgo-Fuentes S, Martínez-Álvarez I, Llamas-Salguero F, Villaseñor-León M. Adaptation and Validation of the Spanish Version of the Smartphone Application-Based Addiction Scale (SABAS). Behavioral Sciences. 2025; 15(4):496. https://doi.org/10.3390/bs15040496
Chicago/Turabian StyleHidalgo-Fuentes, Sergio, Isabel Martínez-Álvarez, Fátima Llamas-Salguero, and Miriam Villaseñor-León. 2025. "Adaptation and Validation of the Spanish Version of the Smartphone Application-Based Addiction Scale (SABAS)" Behavioral Sciences 15, no. 4: 496. https://doi.org/10.3390/bs15040496
APA StyleHidalgo-Fuentes, S., Martínez-Álvarez, I., Llamas-Salguero, F., & Villaseñor-León, M. (2025). Adaptation and Validation of the Spanish Version of the Smartphone Application-Based Addiction Scale (SABAS). Behavioral Sciences, 15(4), 496. https://doi.org/10.3390/bs15040496