Article

Species Sensitivity to Hydrologic Whiplash in The Tree-Ring Record of the High Sierra Nevada

1
Laboratory of Tree-Ring Research, University of Arizona, Tucson, AZ 85721, USA
2
School of Natural Resources and the Environment, University of Arizona, Tucson, AZ 85721, USA
3
Department of Geography and Earth and Environmental Systems Institute, The Pennsylvania State University, University Park, PA 16802, USA
4
DendroLab, Department of Natural Resources and Environmental Science, University of Nevada, Reno, NV 89557, USA
*
Author to whom correspondence should be addressed.
Environments 2023, 10(1), 12; https://doi.org/10.3390/environments10010012
Submission received: 1 October 2022 / Revised: 8 November 2022 / Accepted: 9 January 2023 / Published: 13 January 2023

Abstract

:
The year-to-year variability of precipitation has significant consequences for water management and forest health. “Whiplash” describes an extreme mode of this variability in which hydroclimate switches abruptly between wet and dry conditions. In this study, a pool of total-ring-width indices from five conifer species (Abies magnifica, Juniperus grandis, Pinus ponderosa, Pinus jeffreyi, and Tsuga mertensiana) in the Sierra Nevada is used to develop reconstructions of water-year precipitation using stepwise linear regression on lagged chronologies, and the reconstructions are analyzed for their ability to track whiplash events. A nonparametric approach is introduced to statistically classify positive and negative events, and the success of matching observed events with the reconstructions is evaluated using a hypergeometric test. Results suggest that reconstructions can effectively track whiplash events, but that tracking ability differs among species and sites. Although negative (dry-to-wet) events (1921–1989) are generally tracked more consistently than positive events, Tsuga stands out for strong tracking of positive events. Tracking ability shows no clear relationship to variance explained by reconstructions, suggesting that efforts to extend whiplash records with tree-ring data should consider optimizing reconstruction models for the whiplash signal.

1. Introduction

The year-to-year variability of precipitation and temperature has significant consequences for water management decision-making. “Whiplash” is a term that describes this variability at its most severe, referring to consecutive years in which the hydroclimate switches between extremes. These extreme transitions can have wide-ranging implications for water and watershed management. Positive whiplash events, or those characterized by a particularly dry year followed by a wet year, can result in landslides and flooding, while negative whiplash events, where the two-year sequence is reversed, can lead to catastrophic wildfires [1,2,3].
Dramatic climate variability is an integral characteristic of the Truckee-Carson River Basin and other Sierra Nevada watersheds, where annual and seasonal fluctuations are driven by large-scale oceanic and atmospheric patterns (e.g., ENSO), resulting in hot, dry summers and cold, wet winters [3,4,5,6]. These watersheds overwhelmingly rely on cool-season precipitation for their water supply, much of which falls as snow in the winter months. The snowpack acts as a natural storage reservoir for water, which is released throughout the spring and summer to support flows of rivers and recharge surface reservoirs and groundwater reserves. Cities, including the combined Reno-Sparks urban and suburban areas, rely on water allocations from the Truckee and Carson Rivers for a complete range of interests encompassing recreation, industry, and municipal use [7].
Climate change forces may further amplify water resource pressures in the Sierra Nevada. Regional projections under future greenhouse-gas emission scenarios indicate decreasing water availability despite modestly increasing mean annual precipitation [8,9,10]. Rising temperatures contribute to a reduction in water storage capacity and increase the flood risk due to rapid spring snowmelt and rain-on-snow events [11,12,13,14]. Streamflow projections for the central Sierra Nevada also include longer periods of low flows and the sensitivity of streamflow to changes in the timing of runoff [15]. Recent studies have shown already increasing water-cycle extremes driven by ENSO [16], and the interannual precipitation regime has become increasingly characterized by high-intensity wet and dry periods since the mid-20th century [3,11,17,18].
Tree rings in semi-arid environments provide proxy records of hydroclimate as their annual growth is tied directly to climate limitations such as water availability [6]. Models derived from tree rings can extend climate records centuries prior to the start of instrumental measurements. Resulting reconstructions have an annual resolution and can explain significant climate variance, providing long-term context for water resource expectations and management decision-making [19]. In the Sierra Nevada, tree rings have been used to model hydroclimate variables, including Snow Water Equivalent [20,21], streamflow [6,22], temperature [23], and precipitation [23,24,25].
Tree rings have long been used to place recent droughts and wet periods in perspective, but it is possible that whiplash events are obscured in reconstructions by the prior conditioning of the trees. Whiplash events can be masked by persistence in a tree’s total ring width as a result of biological carryover processes that support or suppress growth in subsequent years [26,27]. For example, the legacy effects of drought can significantly impact total ring width for 1–4 years following a drought event [17,28,29]. The recovery can be complicated by factors such as site location [30], drought timing [31], and forestry practices [32]. Further, drought recovery and resilience can differ between species [33,34]. As such, there is value in directly studying the ability of reconstructions to track whiplash events, which represent the highest-frequency component of the generalized climate signal, and in understanding possible differences in whiplash-tracking ability among tree species and among sites within species.
Our objective is to determine if tree ring reconstructions of regional precipitation in the Truckee-Carson River Basin by various conifer species identify whiplash events, which we define as two-year periods with contrasting exceptional annual precipitation departures from the median. A negative event transitions from a water year of high accumulated precipitation to low, and in a positive event the pattern is reversed. We derive tree-ring reconstructions of regional precipitation and develop a novel methodology to determine and rank whiplash events in time series records, and then compare time series to a control (here, tree-ring reconstructions to a precipitation record) to test the null hypothesis that the number of matches occurred by chance. Through this process, we address two fundamental research questions: (A) Do tree-ring reconstructions of annual precipitation in the Truckee-Carson River Basin identify whiplash events in the observed precipitation record? and (B) Does the ability to identify events depend on tree species?

2. Materials and Methods

2.1. Climate Data

PRISM (Parameter-elevation Regressions on Independent Slopes Model) total monthly precipitation data were used to calculate water-year precipitation in the Truckee-Carson River Basin headwater region. The public-domain 4-km PRISM precipitation record [35] across the western United States correlates highly with other widely used instrumental climate datasets [36], and PRISM precipitation is particularly well suited for exploring spatial variability in mountainous regions due to the explicit incorporation of elevation in model development [35]. PRISM draws from a wide network of climate stations and provides records back to 1895. Climatic data used as input for the PRISM model do not undergo any time-discontinuity screening, either for urban heat island effects, for changes in station location or instrumentation, or for the potential impact of adding new datasets [37]. To allow for the sporadic nature of data availability in the instrumental record during the early part of the 20th century, for this analysis we chose to limit precipitation records to a start year of 1920.
The PRISM time series selected as the primary variable for reconstruction is water-year (Oct–Sep) total precipitation averaged over coordinate points corresponding to 12 snow-monitoring locations throughout the Truckee-Carson River Basin (Figure 1). This represents a regional precipitation series. From this point forward, this 12-station mean precipitation series will be referred to as P12. The 12 coordinate points sample the varied topography of the basins and cover the north-south extent of the basin’s headwaters. While the P12 coordinate locations are at different elevations in the Tahoe sub-basin, annual precipitation at the sites is highly correlated, and differences are primarily in magnitude (Figure S1). Furthermore, P12 is highly correlated with other datasets of interest (Figure S2) that relate to Truckee-Carson River Basin hydroclimate, including natural flow series of the American, Carson, and Truckee Rivers and the Northern Sierra 8-Station Precipitation Index, all of which are important to water resources assessment and are available directly from the California Data Exchange Center (CDEC; accessed on 12 February 2021). P12 is also significantly correlated with the April 1 Snow Water Equivalent (SWE) series developed from snow-course data at the same locations by Biondi and Meko (2019). Moreover, whiplash events in P12 broadly match events in the other hydrologic series mentioned above (Figure S3). Methods for deriving those events will be addressed in Section 2.3.

2.2. Tree-Ring Data

Five conifer species, Abies magnifica (ABMA), Juniperus grandis (JUGR), Pinus ponderosa (PIPO), Pinus jeffreyi (PIJE), and Tsuga mertensiana (TSME), were selected for this analysis (Figure 1, Table 1). All species can be found at elevations where snowfall accumulates. Data files of measured total-ring-width indices (TWI) downloaded from the International Tree-Ring Data Bank (ITRDB, https://www.ncei.noaa.gov/products/paleoclimatology/tree-ring, accessed on 15 November 2021) were supplemented by the authors’ contributions (Table 1). These chronologies meet specific requirements for spatial representation, time coverage, and sample depth. The geographical domain of the tree-ring network was limited to the northern-to-mid latitudes of the Sierra Nevada. A correlation map derived from the North American Drought Atlas (NADA; [38]) was used to establish a search region for tree-ring chronologies consistent with the climate footprint of the Truckee-Carson River Basin. The summer average (June–July–August) of the instrumentally derived Palmer Drought Severity Index (PDSI) in the headwaters of the Truckee-Carson River Basin (39.05° N, 120.15° W) was correlated spatially with PDSI at 0.5° latitude/longitude grid points, 1920–2000, to identify the climate footprint (Figure S4), which has north–south boundaries at 40.75° N and 37.25° N. Selected tree-ring sites were restricted to elevations above 1500 m, which marks the approximate lowest elevation of snow-course measurements collected annually by the CDEC to monitor snowpack conditions for water management. A total of 65 ITRDB chronologies were found in the geographic domain, and of those, we selected 28 chronologies with an ending year of 1990 or later. Each of the five target tree species in this network is represented by at least three site chronologies.
Ring widths were standardized to site chronologies by the ratio method, using a 50-year cubic smoothing spline to remove growth/age trends, and a bi-weight mean to average core indices by site and species [39]. Before standardization, ring-width series were truncated to begin no earlier than 1800, and any series without data in 1950 was excluded. This last screening step ensures that all core indices overlap the calibration period of reconstruction models by at least 30 years. All resulting chronologies begin no later than 1880 CE.

2.3. Climate Reconstruction

Chronologies were transformed into estimates of precipitation by distributed-lag forward stepwise regression models [40,41]. Single-site models (28 models) were developed by individually regressing P12 on each chronology lagged t − 2 to t + 2 years from the year of P12. Species-specific models were developed by including a screened subset of all chronologies, with lags, of each species in the pool of potential predictors. An additional full-network model was developed that included a screened subset of all 28 chronologies and their lags in the pool. Screening consisted of including in the pool of potential predictors only the N/5 tree-ring variables most highly correlated with P12, where N is the length of the calibration period for regression. The stepwise regression was guided by a cross-validation stopping rule [42], such that the entry of predictors was terminated if the next step failed to result in an increase in reconstruction skill as measured by a cross-validation reduction of error (RE) statistic [43]. Following Meko [44], we use leave-9-out cross-validation rather than leave-1-out cross-validation to ensure that, in the presence of lags, cross-validation predictions do not use any of the same tree-ring data used to calibrate the reconstruction model.

2.4. Analysis of Whiplash Events

Whiplash events, ranked by severity, were defined separately for P12 and its various reconstructions (Figure S5) as instances of most-severe opposite-sign departures from the median precipitation in two consecutive water years. A non-parametric approach, described below, was used to determine the most extreme positive (low to high value years) and negative (high to low) whiplash events in each time series. For all analyses, we used a common analysis period, 1921–1989 (Figure 2).
An algorithm we call “collapsing quantiles” was developed for identifying whiplash events in a time series, x. After exploratory analysis, we settled on a goal of six positive and six negative events in the common period. The time series of length N is first sorted from smallest (rank 1) to largest (rank N). The most severe possible thresholds are set midway between ranks 1 and 2 (dry) and between ranks N − 1 and N (wet). Any two-year sequence in x with both members outside those thresholds, one member wet and one member dry, is defined as a whiplash event, either positive (dry-to-wet) or negative (wet-to-dry). The thresholds are then relaxed by collapsing them toward the median by one ranked value. This process is repeated until six positive and six negative events are found in the analysis period. As events are identified, they are assigned a severity ranking in order of identification, such that rank 1 corresponds to the first event, satisfying the most extreme thresholds, and rank 6 corresponds to the 6th event. We repeated this process independently for each time series. Accordingly, the thresholds for inclusion to reach the target of six events vary among series, and the thresholds for positive and negative events vary for any given time series. The number of events in a series may exceed six because the last step of collapsing quantiles might identify more than one new event.
The statistical significance of the match of whiplash events in each reconstructed series with the events in P12 was assessed by a hypergeometric test that has been applied in past studies to examine relationships in climatic and hydrologic variables [5,40,45]. Assume a sample (e.g., P12) of length Ns (e.g., 69 years, 1921–1989) with M events (e.g., M = 6 positive whiplash events). The hypergeometric distribution gives the probability that k random draws, without replacement, from the sample will result in m-or-more hits, or matches of events, by chance alone. In our application, we treat the events in the reconstructed series as the k “attempts.” For the reconstructions, k = 6 or k = 7. Given the constant settings of Ns = 69 years and M = 6 P12 events, any number of matches m ≥ 2 is statistically significant at α = 0.05.
Even in a highly accurate reconstruction (e.g., regression R2 > 0.60), there is no guarantee that whiplash will be tracked perfectly because R2 reflects the full spectrum of the reconstructed variance and whiplash events are just the highest-frequency portion of the variance. As part of our analysis, we use scatterplots and linear regression to assess the relationship between the variance explained by the reconstruction and the accuracy of tracking whiplash events. Finally, we examine the plots of monthly precipitation in years of whiplash events in P12 for possible association and the accuracy of whiplash event-tracking with an anomalous monthly distribution of precipitation.

3. Results

Results on the tracking of whiplash events are presented in Section 3.1 for species-specific and full-network reconstructions and in Section 3.2 for single-site reconstructions. The emphasis is on evaluating the tracking ability and its relationship to overall reconstruction accuracy. For the species-specific and full-network reconstructions only, we explore the possible dependence of tracking ability on the anomalous monthly distribution of precipitation in whiplash event–years.

3.1. Species-Specific and Full-Network Reconstructions

The regression models for the full-network and species-specific reconstructions all have significant (p < 1 × 10⁻⁵) F levels and include a lag on at least one chronology (Table 2). All models validate strongly, as reflected in the high cross-validation RE. The percentage of variance of P12 explained for the 1921–1989 calibration period is 62% for the full-network model and ranges from 32% to 54% for models restricted to the use of chronologies from a single species.
The 6 positive and 6 negative whiplash events in P12 during the global common period of 1921–1989 all coincide with events in at least one of the six reconstructions generated by the full-network or species-specific reconstruction models (Figure 3, Table 2). No single P12 event is tracked by every reconstruction, either in the negative or positive event series. Some events in P12 are more consistently tracked than others by the reconstructions. For example, the positive P12 event in 1977–1978 is tracked by five reconstructions, while the negative events in 1944 and 1981 are tracked by only one reconstruction. Tracking ability is imperfectly related to the rank of the P12 event. The highest-ranked positive and negative P12 events are not the most closely tracked. Instead, the second-ranked positive and third-ranked negative events in P12 have the highest number of matches with events in the five species-specific reconstructions. Event agreement among the reconstructions themselves is inconsistent. For example, three TSME events in the late 1920s are not classified as events by any of the other species-specific reconstructions. Moreover, no two species consistently classify the same years as events.
Results for the hypergeometric test indicate that, with a few exceptions, the number of matches of P12 events by events in the reconstructions is greater than expected by chance (Figure 4, Table 3). p-values for the full-network and most species-specific reconstructions fall between 0.001 and 0.0001. The JUGR reconstruction for negative events stands out for the strongest tracking. Two reconstructions have insignificant tracking of P12 whiplash events: PIJE for negative events and ABMA for positive events. The scatter of points for positive and negative events (Figure 4) does not support a relationship between tracking ability and R2 of the reconstruction model, in that the slope of a straight line (not shown) fit to the points is not significantly different from zero for either positive or negative events.
The distribution of monthly precipitation totals in the 24 months comprising P12 event years varies greatly from one event to another (Figure 5). Monthly precipitation is logically expected to drop from the first to the second year of a negative event and vice versa, but these plots emphasize the difference in the monthly footprint of precipitation in individual events. In the dry water years of all events, monthly precipitation still exceeds the long-term mean in at least one month, such as in November of 1964 and 1966. The annual high precipitation in years 1956, 1965, and 1986 was driven by single monthly values, while in 1958, 1978, and 1982, more moderate monthly cumulative precipitation fed the overall high annual value. On average, positive events tended to include particularly suppressed dry season precipitation in the first year relative to their second year and high precipitation in December and January of the second year (Figure S6). In negative event averages, the dry season pattern was reversed, and February and December first-year precipitation was particularly suppressed. The pattern of monthly precipitation in the wet season does not appear to be related to better or worse tracking of the P12 events by the reconstructions (Figure 5). However, negative event tracking was more successful for events in which the dry-season precipitation dropped particularly below the long-term average in the second year, as was the case in 1987 and 1966.

3.2. Single-Site Reconstructions

The single-site regression models reveal a highly variable signal for P12 among species and among chronologies of the same species (Table S2). Seven of the 28 models are insignificant by the criterion of regression pF > 0.05, where pF is the p-value of the overall F of regression. The significant models explain from 7% to 42% of the variance over the 1921–1989 calibration period, and all validate successfully (RE > 0). A total of 14 of the 21 significant models include lagged predictors. The within-species variability of the signal for P12 is highlighted by juniper (JUGR), which has chronologies explaining the most (42%; chronology DGS) and least (2%; chronology CA698) variance of P12 over 1921–1989. The DGS model achieves its high explained variance without lags—in other words, with a contemporaneous relationship between the tree-ring index and P12.
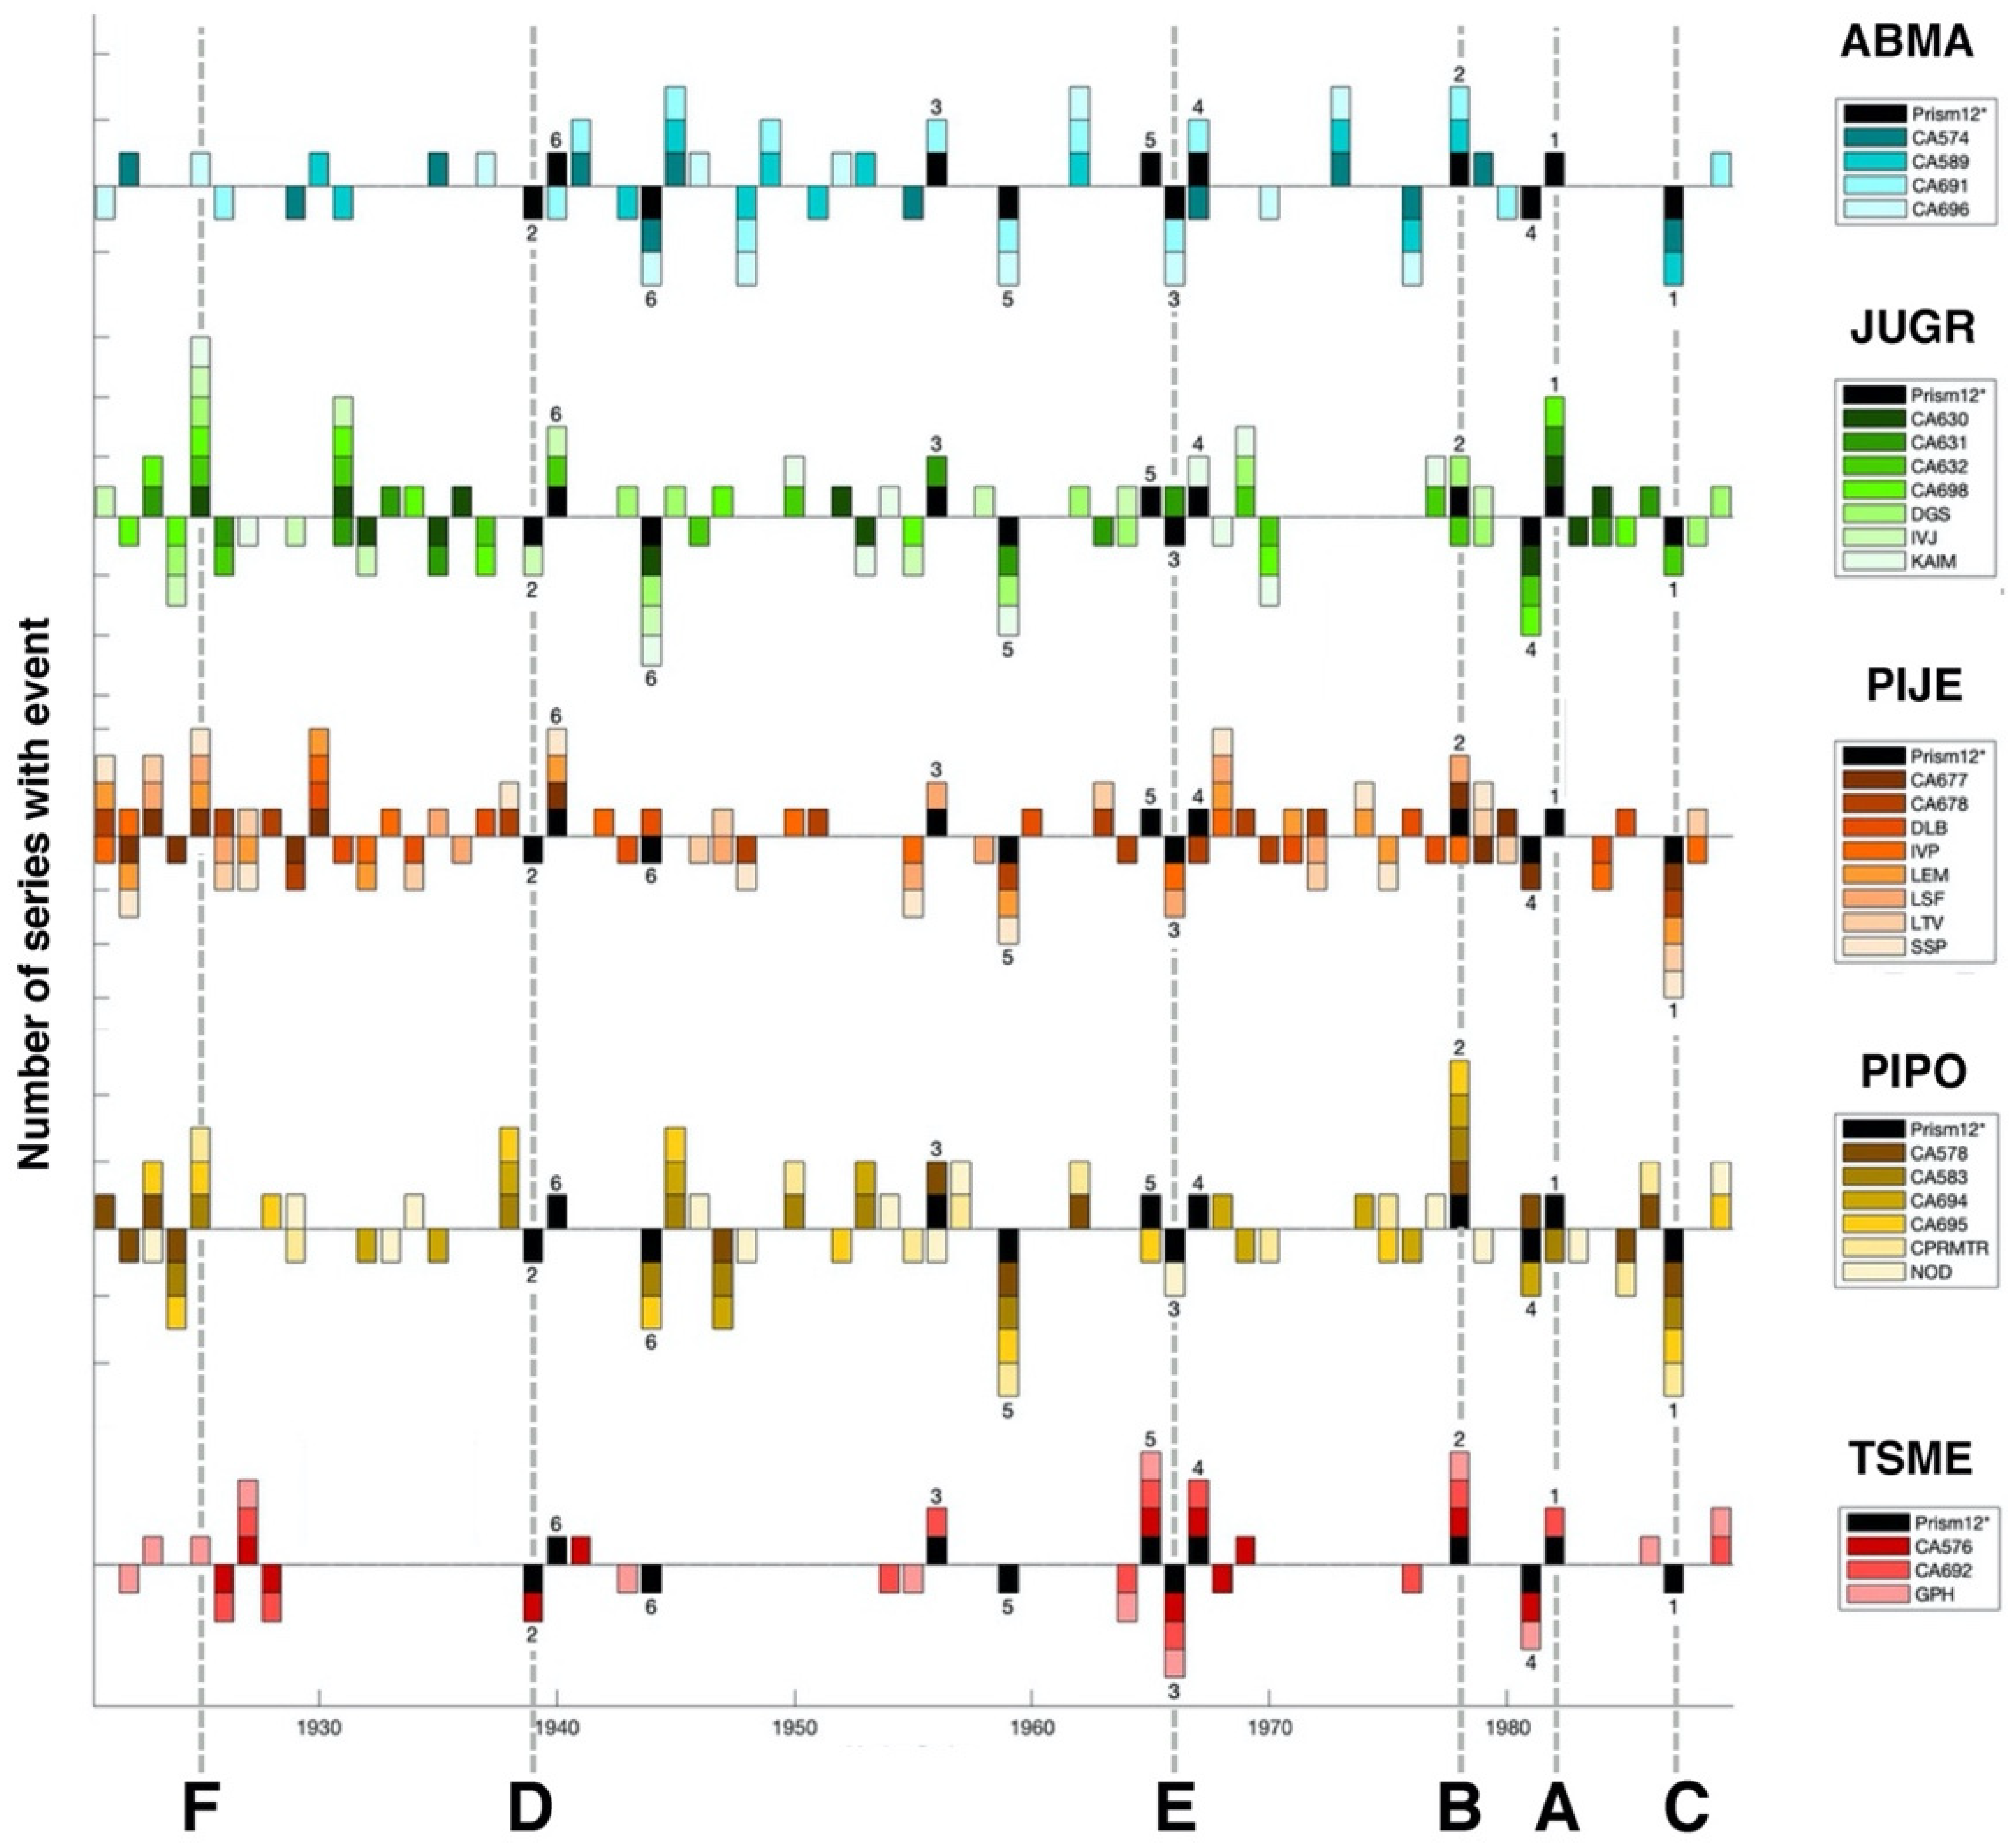
Matching of whiplash events in P12 varies among single-site reconstructions for the five tree species, but multiple chronologies of a single species sometimes succeed in identifying particular P12 events missed by other species (Figure 6, Table S2). Years of particular interest have been labeled A–F in Figure 6. The highest-ranking positive P12 whiplash event (A) is tracked by fewer than 50% of sites across all species. The second-highest ranking positive P12 whiplash event (B) is tracked by at least 50% of sites by species, except for JUGR and PIJE. The highest-ranking negative P12 whiplash event (C) is tracked by more than 50% of sites for PIJE and PIPO and by less than 50% of sites for other species. The second-highest ranking negative P12 whiplash event (D) is tracked by less than 50% of sites by all species. Three consecutive whiplash years of middling ranking (E) are tracked by most TSME sites and by fewer than 50% of sites of other species. The sequence 1924–1925 stands out as a false positive, identified as a positive event by several species but not classified as an event by P12 (F). The year 1924 had the second-lowest annual precipitation in the P12 record over the calibration period, but P12 precipitation was near the median in 1925. However, 1924–1925 was identified as positive whiplash by at least 50% of JUGR, PIJE, and PIPO sites. The tree rings in 1925 appear to have been picking up a signal for wetness in 1925, not well represented by P12 but present in other hydrologic time series we investigated (Figure S3).
Single-site reconstructions for all species except TSME track negative P12 whiplash events better than positive events (Figure 7, Table S3). Few single-site reconstructions surpass the event-tracking ability reported previously (see Figure 4) for species-specific reconstructions. Notable exceptions are the significant tracking of positive events by all three TSME sites and of negative events by ABMA. All species show some variation among sites in their tracking of P12 whiplash events. Positive P12 whiplash events are poorly tracked by single-site reconstructions for all species except TSME; for other species, matching of P12 events is no more accurate than expected by chance. On the other hand, negative P12 whiplash events are well tracked by the reconstructions. More than 50% of the PIJE reconstructions have significant tracking at the 95% confidence level, and for other species, more than 50% of reconstructions have significant tracking at the 99% level.
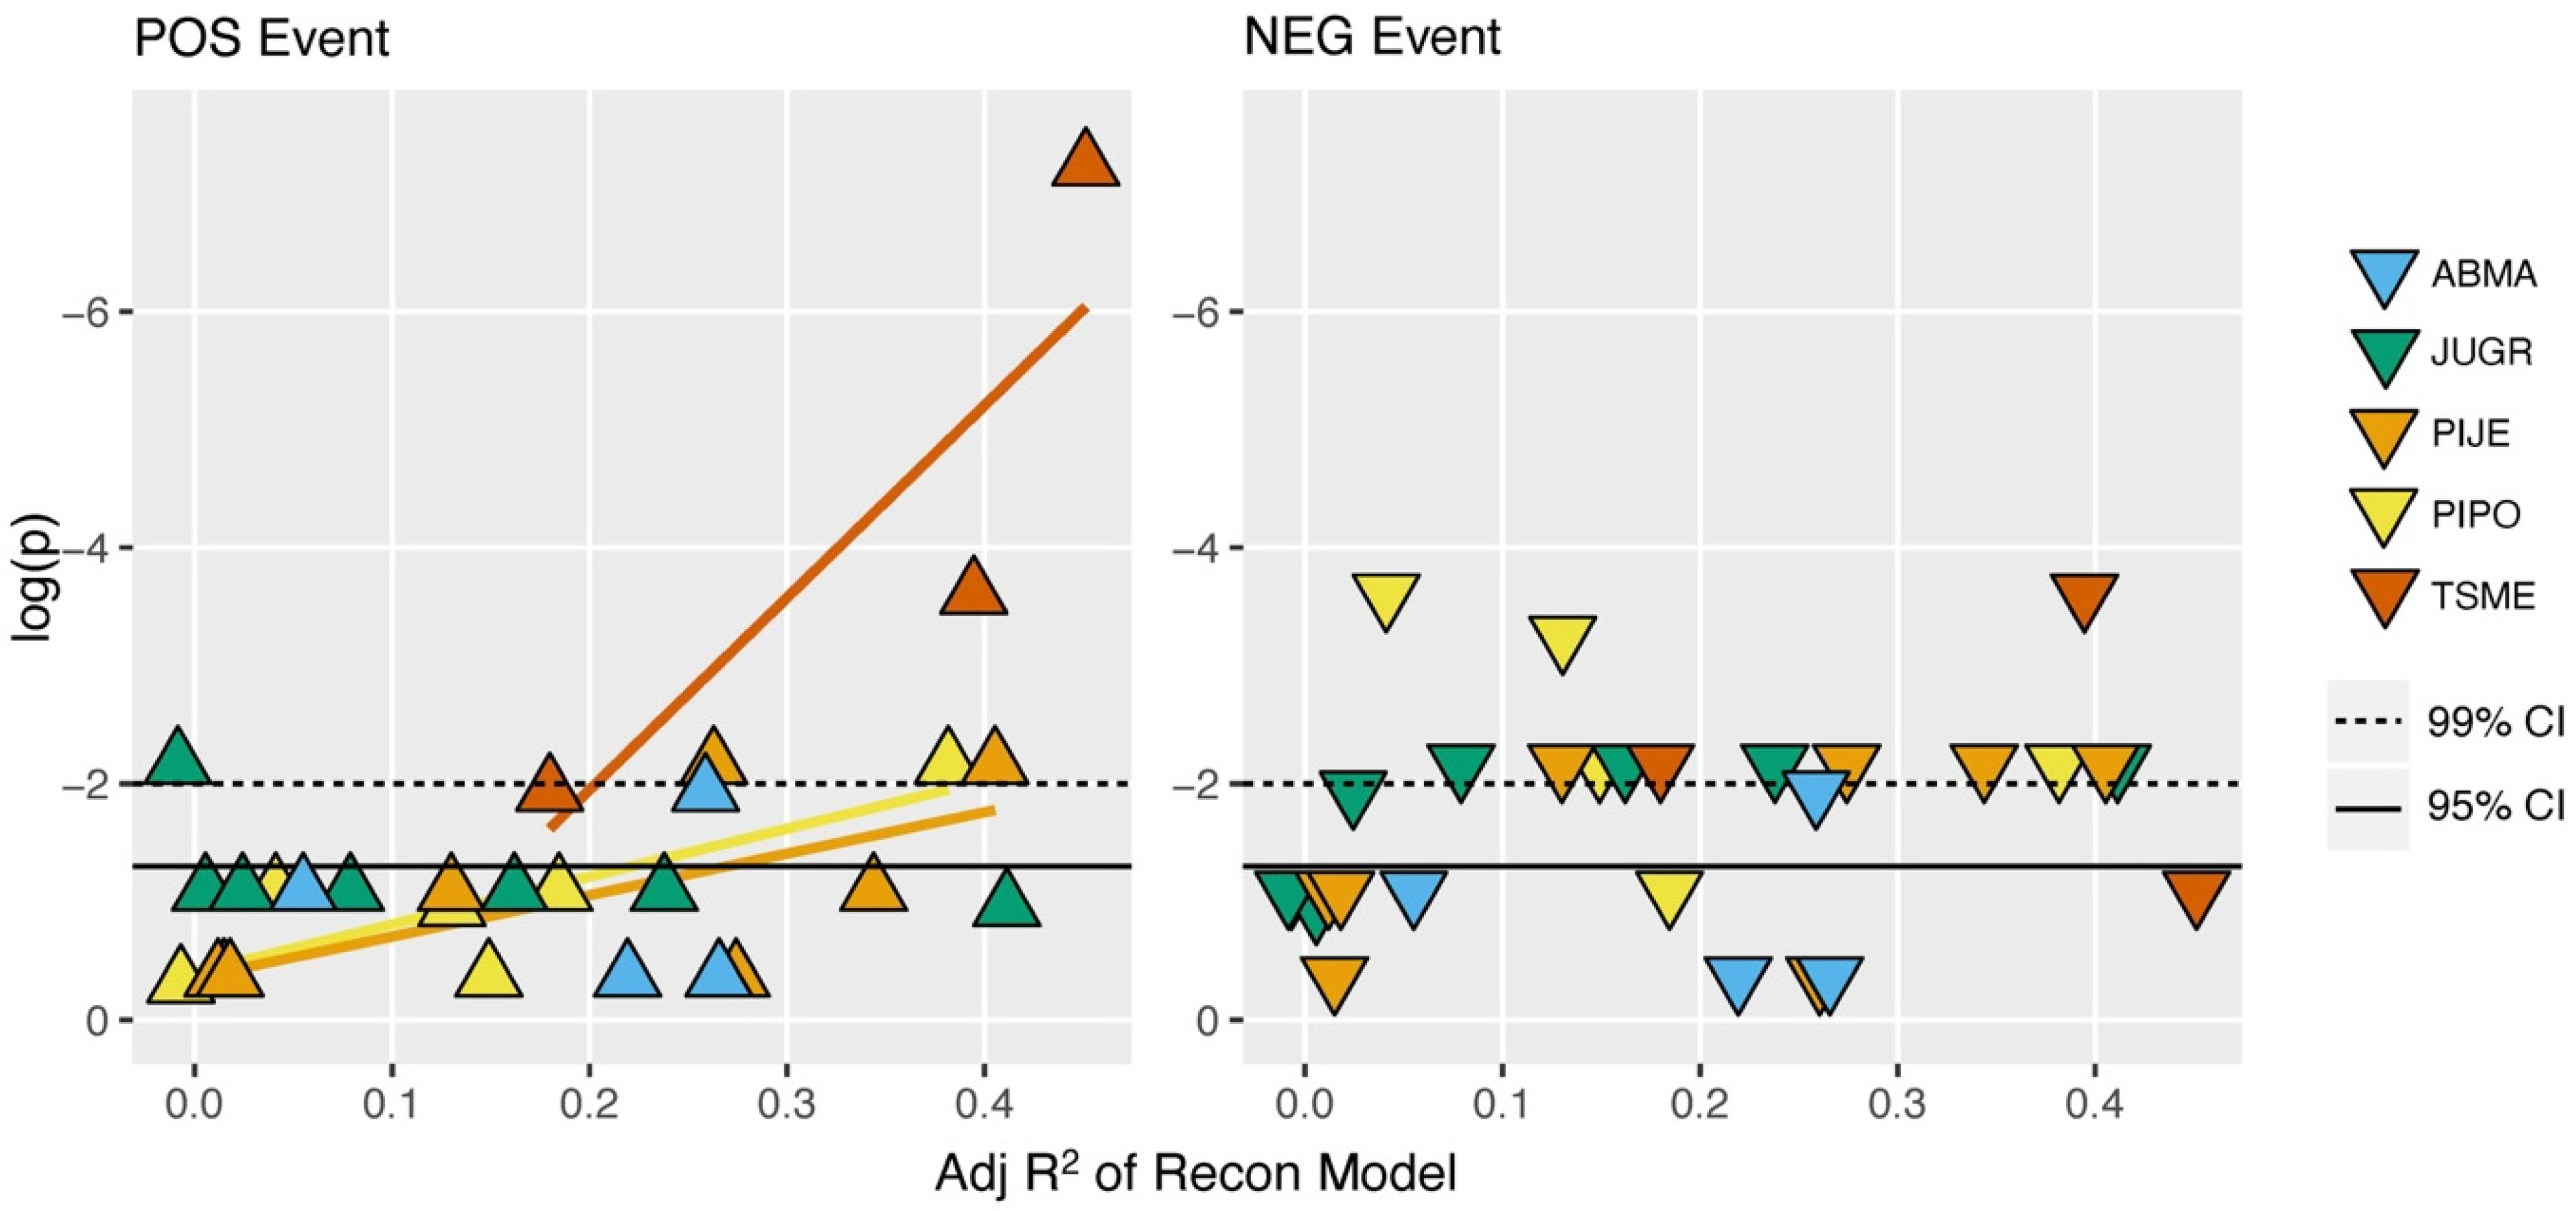
The accuracy of tracking P12 whiplash events by all single-site reconstructions when assessed together is not related to R2 of the reconstruction models, but there is some positive relationship for positive events (Figure 8) for species TSME, PIPO, and PIJE. Relationships for the other two species for positive events and, for all species for negative events, are not significant.

4. Discussion

Results suggest that tree-ring reconstructions of annual precipitation from individual and multiple tree species can identify whiplash events in the observed precipitation record of the Truckee-Carson River Basin and that the ability to identify events differs among tree species. Single-site reconstructions for all species track negative events significantly at over 50% of sites, while only those for TSME track positive events with a high rate of success. Tree-ring studies with drought-sensitive chronologies have generally shown a more consistent (tree-to-tree and site-to-site) growth response to dry years than to wet years [26]. However, this asymmetry alone cannot explain the better recording of negative whiplash events than positive whiplash events, because a good wet-year response as well as drought sensitivity are required for accurate tracking of negative events. The distinction lies in drought recovery. A strong positive-event response suggests drought sensitivity in the first year of the positive whiplash event, coupled with a relatively low drought legacy effect. This combination is unusual, as low drought resilience tends to co-occur with poor recovery [33]. We also note that the lag-structure of the reconstruction model can be critical to identifying positive whiplash events because a very wet year driven by cool-season precipitation in the Sierra Nevada can have a detrimental impact on the length of the growing season in the current year [46]. If a deep snowpack lessens drought stress later in the growing season, the enhanced storage of photosynthate could favor growth the following year, such that a lagged regression model is needed to capture the positive moisture response (Figure S7).
The relatively poor tracking of positive P12 whiplash events by single-site reconstructions of species other than TSME may reflect a strong drought-legacy effect in recovery from exceptionally dry years in those species. Studies of drought-legacy effects in Sierra Nevada conifers have found extended (2+ year) recovery time in Pinus and Abies species [28,29]. The short-term (1 year) drought-recovery time has been reported for Juniperus species [28], but some studies of the Cupressaceae family (to which Juniperus belongs) report no time needed for recovery [27]. No studies specifically address drought-legacy effects in TSME. In comparative evaluation, TSME has shown lower resilience to drought than ABMA and Pinus species [47]. Positive correlations with current-year precipitation have been shown in ABMA, PIJE, and other Pinus species [48,49]. Positive correlation with previous water year precipitation is seen in ABMA, TSME, PIJE [48,49,50], and JUGR [51]. TSME shows a negative correlation with current-year winter precipitation [48,52]. Drought sensitivity combined with a positive lagged-year and a negative current-year response to precipitation may favor the potential of TSME to track positive whiplash events. It is further possible that site characteristics, which were unexplored in this research, further contribute to the positive whiplash event sensitivity of TSME. Perhaps the drought-legacy effect in TSME is less than in other species because TSME are growing in settings more disposed to mitigating drought-legacy effects, such as sites with a high water table [27,30] or low evaporative demand due to soil, vegetation, and spatial characteristics [53].
It is also notable that some single-site reconstructions by the same species consistently tracked whiplash events consistently missed by reconstructions by other species. Again, this result could reflect species differences in phenology and in climate response, favoring the response to whiplash events associated with undetermined patterns in site characteristics or in the monthly precipitation anomalies in the wet and dry years of the event.
The weak tracking of positive P12 whiplash events by single-site models is not seen in models with a wider predictor pool. The full-network reconstruction significantly (α = 0.01) tracks both positive and negative whiplash events. Species-specific reconstructions often mitigate the failure of the majority of sites to track positive events through the inclusion of even a single chronology that captures high-frequency variance and successfully tracks whiplash. At the same time, some reconstructions that draw from the full-network still fail to track events as successfully as the majority of single-site reconstructions of the same species. This is the case for PIJE reconstructions: 50% of the single-site PIJE reconstructions track negative events at better than α = 0.01 significance in the hypergeometric test, but the species-specific (multi-site) PIJE reconstruction fails to track such events at even the α = 0.05 significance level. Such a seemingly illogical drop in whiplash tracking accuracy could result from the species-specific reconstruction model selecting a chronology or chronologies with a strong climate signal at other than the highest frequencies—those driving whiplash events. Decadal-scale fluctuations are highly important to the precipitation and streamflow histories of the Sierra Nevada [22], and a stepwise reconstruction model may select chronologies with a relatively strong response to those lower-frequency variations at the expense of tracking whiplash events.
Traditional metrics of reconstruction accuracy (e.g., R2) are not directly related to whiplash tracking outcomes. In some cases, tree-ring reconstructions track known whiplash events at a significant rate, even with relatively low explained variance by the reconstruction model. In others, a reconstruction with high explained variance failed to track whiplash events more frequently than expected by chance. The findings suggest that it may be unwise to assume that whiplash events will be well tracked just because a reconstructed model has a high explained variance. We explain the disconnect between variance and whiplash tracking by differential responses of chronologies to the spectrum of climate variability. The goal of minimum error variance in regression might be satisfied by chronologies with relatively strong responses at frequencies other than those driving whiplash events. In future studies, the methods developed for this study could be applied to quantify the ability of a reconstruction to track whiplash events or to screen alternative reconstruction models in order to select one most suitable for whiplash tracking.
The simple magnitude of events seems to have little bearing on whiplash tracking. This is unsurprising given prior research, which suggests the outcomes of legacy effects are likewise not radically changed by the relative severity of drought [27,30]. However, there may be some relationship to the monthly distribution of precipitation during the dry season of whiplash years. An extremely wet or dry water year contributing to a whiplash event can result from radically different combinations of monthly precipitation. Soil moisture in the Sierra Nevada increases during winter snowmelt, spring rain and snowmelt, and fall rain [54]. Because most of the precipitation in the study area falls as snow, a particular month of wet conditions in a wet year may be of little importance to tree growth. Regardless of the monthly distribution, the snowpack acts as a reservoir that releases the water with warming the following spring. The onset of the growth season aligns with an influx of soil moisture as spring temperatures rise. The overall duration of growth is dependent on water availability from soil moisture and internal water stress modulated by vapor pressure deficits over the hot, dry season [55]. The apparent tracking by reconstructions of negative P12 events with particularly low dry season precipitation (Figure 5) may suggest that whiplash tracking by some reconstructions is driven by the availability of late season (autumn) precipitation, which could give some relief during seasonal drought. Low spring temperatures can delay the start of the growth season, while high temperatures and rain-on-snow events advance snowmelt timing and speed accumulated snow water release, which can contribute to a shorter growing season [56,57], further complicating the relationship between stored wet-season snowpack and dry-season water availability. In this study, the impacts of temperature on whiplash tracking were not explicitly examined. However, exploratory analysis shows that the natural flows of some rivers in Sierra Nevada often reflect the same whiplash years as P12 (Figure S3), and streamflow, equivalent to net precipitation, or precipitation minus evapotranspiration, implicitly includes a temperature effect [58].
Future studies of whiplash events in tree-ring data should include sensitivity analysis to understand the extent to which the methodology of reconstruction (e.g., lagged stepwise regression vs. other alternatives) and statistical definition of events impacts results. Factors in reconstruction procedures such as the inclusion or exclusion of lagged years in the predictor pool, choice of analysis period, standardization method, and use of standard vs. residual chronologies could affect whiplash outcomes in reconstructed series. Alternatives to the nonparametric approach of defining whiplash events could be considered. We set our whiplash thresholds with the goal of having the same number of whiplash events in each series for the analysis period; this is only one of many possible approaches to whiplash classification. Further, there are opportunities for analysis of trends in the ability to track whiplash events that may be related to climate change.
Exploration of climate at various scales, such as multi-year droughts or pluvial periods preceding whiplash event years as well as interannual or seasonal variability, might help explain why some whiplash events are well tracked across sites and species while others are missed. West coast populations of PIPO, for instance, have demonstrated that the duration and severity of drought-legacy effects increase when multiple drought years occur in a five-year period preceding a non-drought year [59]. Future studies could also explore climate in years defined as whiplash by reconstructions or chronologies rather than by a hydrologic variable (e.g., P12). This focus, including analysis of the seasonal climate signal in chronologies [60], could likewise shed light on such questions.

5. Conclusions

This study presents a novel methodology to determine, rank, and compare whiplash events, defined as a two-year period when annual precipitation switches between extremes of wet to dry (negative) or dry to wet (positive). Models were designed and/or evaluated through the lens of species distinctions as a primary variable, allowing for separate evaluation of the capacity of Abies magnifica, Juniperus grandis, Pinus ponderosa, Pinus jeffreyi, and Tsuga mertensiana to track P12 whiplash, gaged from the top 6 most severe events in a 69-year period. The success or failure of P12 whiplash event-tracking by P12 tree-ring reconstructions was assessed by a hypergeometric test.
Outcomes suggest that ring-width indices of conifer species in the Sierra Nevada are often able to record consecutive years of opposing extreme precipitation and that the history of such events can be extracted through reconstruction by lagged regression models. Residual effects of a preceding year’s drought or pluvial on tree growth do not necessarily erase records of whiplash from the tree-ring record, though there is still much uncertainty as to why some events are tracked by tree rings and others are missed. Among all reconstructions in this study, negative events are generally tracked more consistently than positive events, although tracking sensitivity differs among species and especially strong tracking of positive events is exhibited by TSME. Tracking ability appears to have no clear relationship to the overall explained variance of the model (R2), the relative magnitude of whiplash events, or the interannual precipitation during those whiplash years.
This study was successful in presenting a novel methodology for determining whiplash events and comparing them among time series. This study lays the foundation for future exploration of tree-ring responses to consecutive years of disparate climate extremes. The species lens used in the study resulted in evidence of the importance of chronology selection in predictor pools and suggests that whiplash tracking is yet another metric (e.g., sensitivity to climate factors such as precipitation or temperature) that varies among chronology sites. There is no single chronology or species that captures year-to-year variability at its most extreme in all cases, and this reminds us that the diversity of data plays a role in understanding the larger picture of paleoclimate. As climate variability increases in its severity due to anthropogenic climate change, understanding the frequency and severity of whiplash events through the tree ring record will serve to provide context for contemporary and future events.

Supplementary Materials

The following supporting information can be downloaded at: https://www.mdpi.com/article/10.3390/environments10010012/s1, Figure S1: Time series of PRISM water-year precipitation at 12 SWE monitoring stations, 1896–2020. Figure S2: Correlation matrix of annual hydroclimatic series, 1923–2017. Site codes are defined in Table S1. Figure S3: Synchrony of positive whiplash events in alternative annual hydroclimatic series, 1923–2017. Figure S4: The climate footprint of the Truckee-Carson River Basin is illustrated with the spatial correlation of the instrumental summer (June-July-August) Palmer Drought Severity Index (PDSI) on a 0.5-degree latitude-longitude grid. Figure S5: Time series of P12, species-specific reconstructions of P12, and full-network reconstructions of P12. Figure S6: Mean of monthly P12 precipitation in years of whiplash events in P12. Figure S7: The correlations, 1920–1989, of P12 with full-network and species-specific reconstructions compared with the correlations of P12 with species-mean chronologies for each of the 5 tree species. Table S1: Key for 8 Hydroclimatic series in/near the Truckee-Carson River Basin. Table S2: Summary statistics of single-site reconstructions of P12. Table S3: Significance of whiplash event tracking in P12 by single-site reconstructions.

Author Contributions

Conceptualization, A.G.W. and D.M.M.; methodology, A.G.W. and D.M.M.; validation, D.M.M.; formal analysis, A.G.W. and D.M.M.; resources, D.M.M., A.H.T. and F.B.; writing—original draft preparation, A.G.W. and D.M.M.; writing—review and editing, A.G.W., D.M.M., A.H.T. and F.B.; visualization, A.G.W. and D.M.M.; project administration, D.M.M.; funding acquisition, D.M.M. and F.B. All authors have read and agreed to the published version of the manuscript.

Funding

This work was supported by National Science Foundation Awards #1903535 (Meko) and #1903561 (Biondi). The views and conclusions contained in this document are those of the authors and should not be interpreted as representing the opinions or policies of the funding agencies and supporting institutions.

Data Availability Statement

Publicly available datasets were analyzed in this study. Tree-ring datasets were sourced from the International Tree Ring Databank at: https://www.ncei.noaa.gov/products/paleoclimatology/tree-ring (accessed on 15 November 2021) or through the contributions of the authors. Precipitation datasets were sourced from the PRISM Climate Group at: https://prism.oregonstate.edu/explorer/, accessed on 2 February 2022. Novel computer code (“Collapsing Quantiles”) was developed using MATLAB R2022b software and will be made publicly available through the Tree-Ring MATLAB Toolbox at https://www.ltrr.arizona.edu/~dmeko/toolbox.html, accessed on 27 March 2022.

Acknowledgments

We would like to thank the many contributing authors to the International Tree-Ring Data Bank whose work has made this research possible, as well as Connie Woodhouse and Jia Hu for providing critique and support throughout the project.

Conflicts of Interest

The authors declare no conflict of interest. The funders had no role in the design of the study, in the collection, analyses, or interpretation of data, in the writing of the manuscript, or in the decision to publish the results.

References

  1. Wahl, E.R.; Zorita, E.; Trouet, V.; Taylor, A.H. Jet stream dynamics, hydroclimate, and fire in California from 1600 CE to present. Proc. Natl. Acad. Sci. USA 2019, 116, 5393–5398. [Google Scholar] [CrossRef] [Green Version]
  2. Wahl, E.R.; Hoell, A.; Zorita, E.; Gille, E.; Diaz, H.F. A 450-Year Perspective on California Precipitation “Flips”. J. Clim. 2020, 33, 10221–10237. [Google Scholar] [CrossRef]
  3. Zamora-Reyes, D.; Black, B.; Trouet, V. Enhanced winter, spring, and summer hydroclimate variability across California from 1940 to 2019. Int. J. Clim. 2022, 42, 4940–4952. [Google Scholar] [CrossRef]
  4. Pandey, G.R.; Cayan, D.R.; Georgakakos, K.P. Precipitation structure in the Sierra Nevada of California during winter. J. Geophys. Res. Atmos. 1999, 104, 12019–12030. [Google Scholar] [CrossRef] [Green Version]
  5. Mason, S.J.; Goddard, L. Probabilistic Precipitation Anomalies Associated with ENSO. Bull. Am. Meteorol. Soc. 2001, 82, 619–638. [Google Scholar] [CrossRef]
  6. Biondi, F.; Meko, D.M. Long-Term Hydroclimatic Patterns in the Truckee-Carson Basin of the Eastern Sierra Nevada, USA. Water Resour. Res. 2019, 55, 5559–5574. [Google Scholar] [CrossRef] [Green Version]
  7. Sterle, K.; Singletary, L. Adapting to Variable Water Supply in the Truckee-Carson River System, Western USA. Water 2017, 9, 768. [Google Scholar] [CrossRef] [Green Version]
  8. Hayhoe, K.; Cayan, D.; Field, C.B.; Frumhoff, P.C.; Maurer, E.P.; Miller, N.L.; Moser, S.C.; Schneider, S.H.; Cahill, K.N.; Cleland, E.E.; et al. Emissions pathways, climate change, and impacts on California. Proc. Natl. Acad. Sci. USA 2004, 101, 12422–12427. [Google Scholar] [CrossRef] [Green Version]
  9. Cayan, D.R.; Maurer, E.; Dettinger, M.D.; Tyree, M.; Hayhoe, K. Climate change scenarios for the California region. Clim. Chang. 2008, 87, 21–42. [Google Scholar] [CrossRef]
  10. Dettinger, M.D.; Alpert, H.; Battles, J.J.; Kusel, J.; Safford, H.; Fougeres, D.; Knight, C.; Miller, L.; Sawyer, S. Sierra Nevada Summary Report. California’s Fourth Climate Change Assessment; Publication No. SUMCCCA4-2018-004; California Energy Commission: Sacramento, CA, USA; Natural Resoources Agency: Sacramento, CA, USA, 2018; 94p. [Google Scholar]
  11. Dettinger, M. Climate Change, Atmospheric Rivers, and Floods in California—A Multimodel Analysis of Storm Frequency and Magnitude Changes1. JAWRA J. Am. Water Resour. Assoc. 2011, 47, 514–523. [Google Scholar] [CrossRef]
  12. AghaKouchak, A.; Cheng, L.; Mazdiyasni, O.; Farahmand, A. Global warming and changes in risk of concurrent climate extremes: Insights from the 2014 California drought. Geophys. Res. Lett. 2014, 41, 8847–8852. [Google Scholar] [CrossRef] [Green Version]
  13. Casson, N.J.; Contosta, A.R.; Burakowski, E.A.; Campbell, J.L.; Crandall, M.S.; Creed, I.F.; Eimers, M.C.; Garlick, S.; Lutz, D.A.; Morison, M.Q.; et al. Winter Weather Whiplash: Impacts of Meteorological Events Misaligned With Natural and Human Systems in Seasonally Snow-Covered Regions. Earth’s Futur. 2019, 7, 1434–1450. [Google Scholar] [CrossRef] [Green Version]
  14. McCabe, G.J.; Wolock, D.M. Recent Declines in Western U.S. Snowpack in the Context of Twentieth-Century Climate Variability. Earth Interact. 2009, 13, 1–15. [Google Scholar] [CrossRef]
  15. Null, S.E.; Viers, J.H.; Mount, J.F. Hydrologic Response and Watershed Sensitivity to Climate Warming in California’s Sierra Nevada. PLoS ONE 2010, 5, e9932. [Google Scholar] [CrossRef] [Green Version]
  16. Yoon, J.-H.; Wang, S.-Y.S.; Gillies, R.R.; Kravitz, B.; Hipps, L.; Rasch, P.J. Increasing water cycle extremes in California and in relation to ENSO cycle under global warming. Nat. Commun. 2015, 6, 8657. [Google Scholar] [CrossRef] [Green Version]
  17. Berg, N.; Hall, A. Increased Interannual Precipitation Extremes over California under Climate Change. J. Clim. 2015, 28, 6324–6334. [Google Scholar] [CrossRef]
  18. Swain, D.L.; Langenbrunner, B.; Neelin, J.D.; Hall, A. Increasing precipitation volatility in twenty-first-century California. Nat. Clim. Chang. 2018, 8, 427–433. [Google Scholar] [CrossRef]
  19. Meko, D.M.; Woodhouse, C.A. Application of Streamflow Reconstruction to Water Resources Management. In Dendroclimatology; Hughes, M., Swetnam, T., Diaz, H., Eds.; Developments in Paleoenvironmental Research; Springer: Dordrecht, The Netherlands, 2011; Volume 11, pp. 231–261. [Google Scholar] [CrossRef]
  20. Belmecheri, S.; Babst, F.; Wahl, E.R.; Stahle, D.W.; Trouet, V. Multi-century evaluation of Sierra Nevada snowpack. Nat. Clim. Chang. 2015, 6, 2–3. [Google Scholar] [CrossRef]
  21. Lepley, K.; Touchan, R.; Meko, D.; Shamir, E.; Graham, R.; Falk, D. A multi-century Sierra Nevada snowpack reconstruction modeled using upper-elevation coniferous tree rings (California, USA). Holocene 2020, 30, 1266–1278. [Google Scholar] [CrossRef]
  22. Meko, D.M.; Therrell, M.D.; Baisan, C.H.; Hughes, M.K. Sacramento river flow reconstructed to A.D. 869 from tree rings1. JAWRA J. Am. Water Resour. Assoc. 2001, 37, 1029–1039. [Google Scholar] [CrossRef]
  23. Graumlich, L.J. A 1000-Year Record of Temperature and Precipitation in the Sierra Nevada. Quat. Res. 1993, 39, 249–255. [Google Scholar] [CrossRef]
  24. Williams, A.P.; Anchukaitis, K.J.; Woodhouse, C.A.; Meko, D.M.; Cook, B.I.; Bolles, K.; Cook, E.R. Tree Rings and Observations Suggest No Stable Cycles in Sierra Nevada Cool-Season Precipitation. Water Resour. Res. 2021, 57, e2020WR028599. [Google Scholar] [CrossRef]
  25. Borkotoky, S.S.; Williams, A.P.; Cook, E.R.; Steinschneider, S. Reconstructing Extreme Precipitation in the Sacramento River Watershed Using Tree-Ring Based Proxies of Cold-Season Precipitation. Water Resour. Res. 2021, 57, e2020WR028824. [Google Scholar] [CrossRef]
  26. Fritts, H.C. Tree Rings and Climate; Academic Press: Cambridge, MA, USA, 1976. [Google Scholar] [CrossRef]
  27. Anderegg, W.R.L.; Schwalm, C.R.; Biondi, F.; Camarero, J.J.; Koch, G.W.; Litvak, M.; Ogle, K.; Shaw, J.D.; Shevliakova, E.; Williams, A.P.; et al. Pervasive drought legacies in forest ecosystems and their implications for carbon cycle models. Science 2015, 349, 528–532. [Google Scholar] [CrossRef] [Green Version]
  28. Gazol, A.; Camarero, J.J.; Sánchez-Salguero, R.; Vicente-Serrano, S.M.; Serra-Maluquer, X.; Gutiérrez, E.; De Luis, M.; Sangüesa-Barreda, G.; Novak, K.; Rozas, V.; et al. Drought legacies are short, prevail in dry conifer forests and depend on growth variability. J. Ecol. 2020, 108, 2473–2484. [Google Scholar] [CrossRef]
  29. Peltier, D.M.P.; Ogle, K. Legacies of more frequent drought in ponderosa pine across the western United States. Glob. Chang. Biol. 2019, 25, 3803–3816. [Google Scholar] [CrossRef] [PubMed]
  30. Kannenberg, S.A.; Maxwell, J.; Pederson, N.; D’Orangeville, L.; Ficklin, D.L.; Phillips, R.P. Drought legacies are dependent on water table depth, wood anatomy and drought timing across the eastern US. Ecol. Lett. 2018, 22, 119–127. [Google Scholar] [CrossRef] [Green Version]
  31. Huang, M.; Wang, X.; Keenan, T.F.; Piao, S. Drought timing influences the legacy of tree growth recovery. Glob. Chang. Biol. 2018, 24, 3546–3559. [Google Scholar] [CrossRef]
  32. Bose, A.K.; Wagner, R.G.; Weiskittel, A.R.; D’Amato, A.W. Effect magnitudes of operational-scale partial harvesting on residual tree growth and mortality of ten major tree species in Maine USA. For. Ecol. Manag. 2021, 484, 118953. [Google Scholar] [CrossRef]
  33. Gazol, A.; Camarero, J.J.; Anderegg, W.R.L.; Vicente-Serrano, S.M. Impacts of droughts on the growth resilience of Northern Hemisphere forests. Glob. Ecol. Biogeogr. 2016, 26, 166–176. [Google Scholar] [CrossRef]
  34. Bose, A.K.; Scherrer, D.; Camarero, J.J.; Ziche, D.; Babst, F.; Bigler, C.; Bolte, A.; Dorado-Liñán, I.; Etzold, S.; Fonti, P.; et al. Climate sensitivity and drought seasonality determine post-drought growth recovery of Quercus petraea and Quercus robur in Europe. Sci. Total. Environ. 2021, 784, 147222. [Google Scholar] [CrossRef]
  35. Daly, C. Guidelines for assessing the suitability of spatial climate data sets. Int. J. Clim. 2006, 26, 707–721. [Google Scholar] [CrossRef]
  36. Buban, M.S.; Lee, T.R.; Baker, C.B. A Comparison of the U.S. Climate Reference Network Precipitation Data to the Parameter-Elevation Regressions on Independent Slopes Model (PRISM). J. Hydrometeorol. 2020, 21, 2391–2400. [Google Scholar] [CrossRef]
  37. Serreze, M.C.; Clark, M.P.; Armstrong, R.L.; McGinnis, D.A.; Pulwarty, R.S. Characteristics of the western United States snowpack from snowpack telemetry (SNOTEL) data. Water Resour. Res. 1999, 35, 2145–2160. [Google Scholar] [CrossRef] [Green Version]
  38. Cook, E.R.; Seager, R.; Heim, R.R., Jr.; Vose, R.S.; Herweijer, C.; Woodhouse, C. Megadroughts in North America: Placing IPCC projections of hydroclimatic change in a long-term paleoclimate context. J. Quat. Sci. 2010, 25, 48–61. [Google Scholar] [CrossRef] [Green Version]
  39. Cook, E.R.; Kairiukstis, L.A. (Eds.) Methods of Dendrochronology: Applications in The environmental Sciences; Springer Science & Business Media: Berlin/Heidelberg, Germany, 1990. [Google Scholar] [CrossRef]
  40. Meko, D.; Graybill, D.A. Tree-ring reconstruction of upper gila rwer discharge. JAWRA J. Am. Water Resour. Assoc. 1995, 31, 605–616. [Google Scholar] [CrossRef]
  41. Meko, D.M.; Stahle, D.W.; Griffin, D.; Knight, T.A. Inferring precipitation-anomaly gradients from tree rings. Quat. Int. 2011, 235, 89–100. [Google Scholar] [CrossRef]
  42. Wilks, D.S. Statistical Methods in the Atmospheric Sciences, 4th ed.; Elsevier Academic Press: New York, NY, USA, 2019; 395p. [Google Scholar]
  43. Fritts, H.C.; Guiot, J.; Gordon, G.A. Verification. In Methods of Dendro-Chronology: Applications in the Environmental Sciences; Cook, E.R., Kairiukstis, L.A., Eds.; Kluwer Academic Publishers: Amsterdam, The Netherlands, 1990; pp. 178–185. [Google Scholar]
  44. Meko, D. Dendroclimatic Reconstruction with Time Varying Predictor Subsets of Tree Indices. J. Clim. 1997, 10, 687–696. [Google Scholar] [CrossRef]
  45. Dracup, J.A.; Kahya, E. The relationships between U.S. streamflow and La Niña Events. Water Resour. Res. 1994, 30, 2133–2141. [Google Scholar] [CrossRef]
  46. Kozlowski, T.T.; Kramer, P.J.; Pallardy, S.G. The Physiological Ecology of Woody Plants; Academic Press: San Diego, CA, USA, 1991. [Google Scholar]
  47. Declerck, F.A.J.; Barbour, M.G.; Sawyer, J.O. Species richness and stand stability in conifer forests of the Sierra Nevada. Ecology 2006, 87, 2787–2799. [Google Scholar] [CrossRef]
  48. Dolanc, C.R.; Westfall, R.D.; Safford, H.D.; Thorne, J.H.; Schwartz, M.W. Growth–climate relationships for six subalpine tree species in a Mediterranean climate. Can. J. For. Res. 2013, 43, 1114–1126. [Google Scholar] [CrossRef]
  49. Hurteau, M.; Zald, H.; North, M. Species-specific response to climate reconstruction in upper-elevation mixed-conifer forests of the western Sierra Nevada, California. Can. J. For. Res. 2007, 37, 1681–1691. [Google Scholar] [CrossRef] [Green Version]
  50. Shamir, E.; Meko, D.; Touchan, R.; Lepley, K.S.; Campbell, R.; Kaliff, R.N.; Georgakakos, K.P. Snowpack- and soil water content-related hydrologic indices and their association with radial growth of conifers in the Sierra Nevada, California. J. Geophys. Res. Biogeosci. 2019, 125, e2019JG005331. [Google Scholar] [CrossRef]
  51. Graumlich, L.J. Subalpine Tree Growth, Climate, and Increasing CO_2: An Assessment of Recent Growth Trends. Ecology 1991, 72, 1–11. [Google Scholar] [CrossRef]
  52. Peterson, D.W.; Peterson, D.L. Mountain Hemlock Growth Responds to Climatic Variability at Annual and Decadal Time Scales. Ecology 2001, 82, 3330–3345. [Google Scholar] [CrossRef]
  53. Bartholomeus, R.P.; Witte, J.-P.M.; Runhaar, J. Drought stress and vegetation characteristics on sites with different slopes and orientations. Ecohydrology 2011, 5, 808–818. [Google Scholar] [CrossRef]
  54. Bales, R.C.; Hopmans, J.W.; O’Geen, A.T.; Meadows, M.; Hartsough, P.C.; Kirchner, P.; Hunsaker, C.T.; Beaudette, D. Soil Moisture Response to Snowmelt and Rainfall in a Sierra Nevada Mixed-Conifer Forest. Vadose Zone J. 2011, 10, 786–799. [Google Scholar] [CrossRef]
  55. Goldstein, A.; Hultman, N.; Fracheboud, J.; Bauer, M.; Panek, J.; Xu, M.; Qi, Y.; Guenther, A.; Baugh, W. Effects of climate variability on the carbon dioxide, water, and sensible heat fluxes above a ponderosa pine plantation in the Sierra Nevada (CA). Agric. For. Meteorol. 2000, 101, 113–129. [Google Scholar] [CrossRef] [Green Version]
  56. Kapnick, S.; Hall, A. Observed Climate–Snowpack Relationships in California and their Implications for the Future. J. Clim. 2010, 23, 3446–3456. [Google Scholar] [CrossRef] [Green Version]
  57. Cooper, A.E.; Kirchner, J.W.; Wolf, S.; Lombardozzi, D.L.; Sullivan, B.W.; Tyler, S.W.; Harpold, A.A. Snowmelt causes different limitations on transpiration in a Sierra Nevada conifer forest. Agric. For. Meteorol. 2020, 291, 108089. [Google Scholar] [CrossRef]
  58. Meko, D.; Stockton, C.W.; Boggess, W.R. The tree-ring record of severe sustained drought. JAWRA J. Am. Water Resour. Assoc. 1995, 31, 789–801. [Google Scholar] [CrossRef]
  59. Peltier, D.M.P.; Fell, M.; Ogle, K. Legacy effects of drought in the southwestern United States: A multi-species synthesis. Ecol. Monogr. 2016, 86, 312–326. [Google Scholar] [CrossRef]
  60. Meko, D.; Touchan, R.; Anchukaitis, K. Seascorr: A MATLAB program for identifying the seasonal climate signal in an annual tree-ring time series. Comput. Geosci. 2011, 37, 1234–1241. [Google Scholar] [CrossRef]
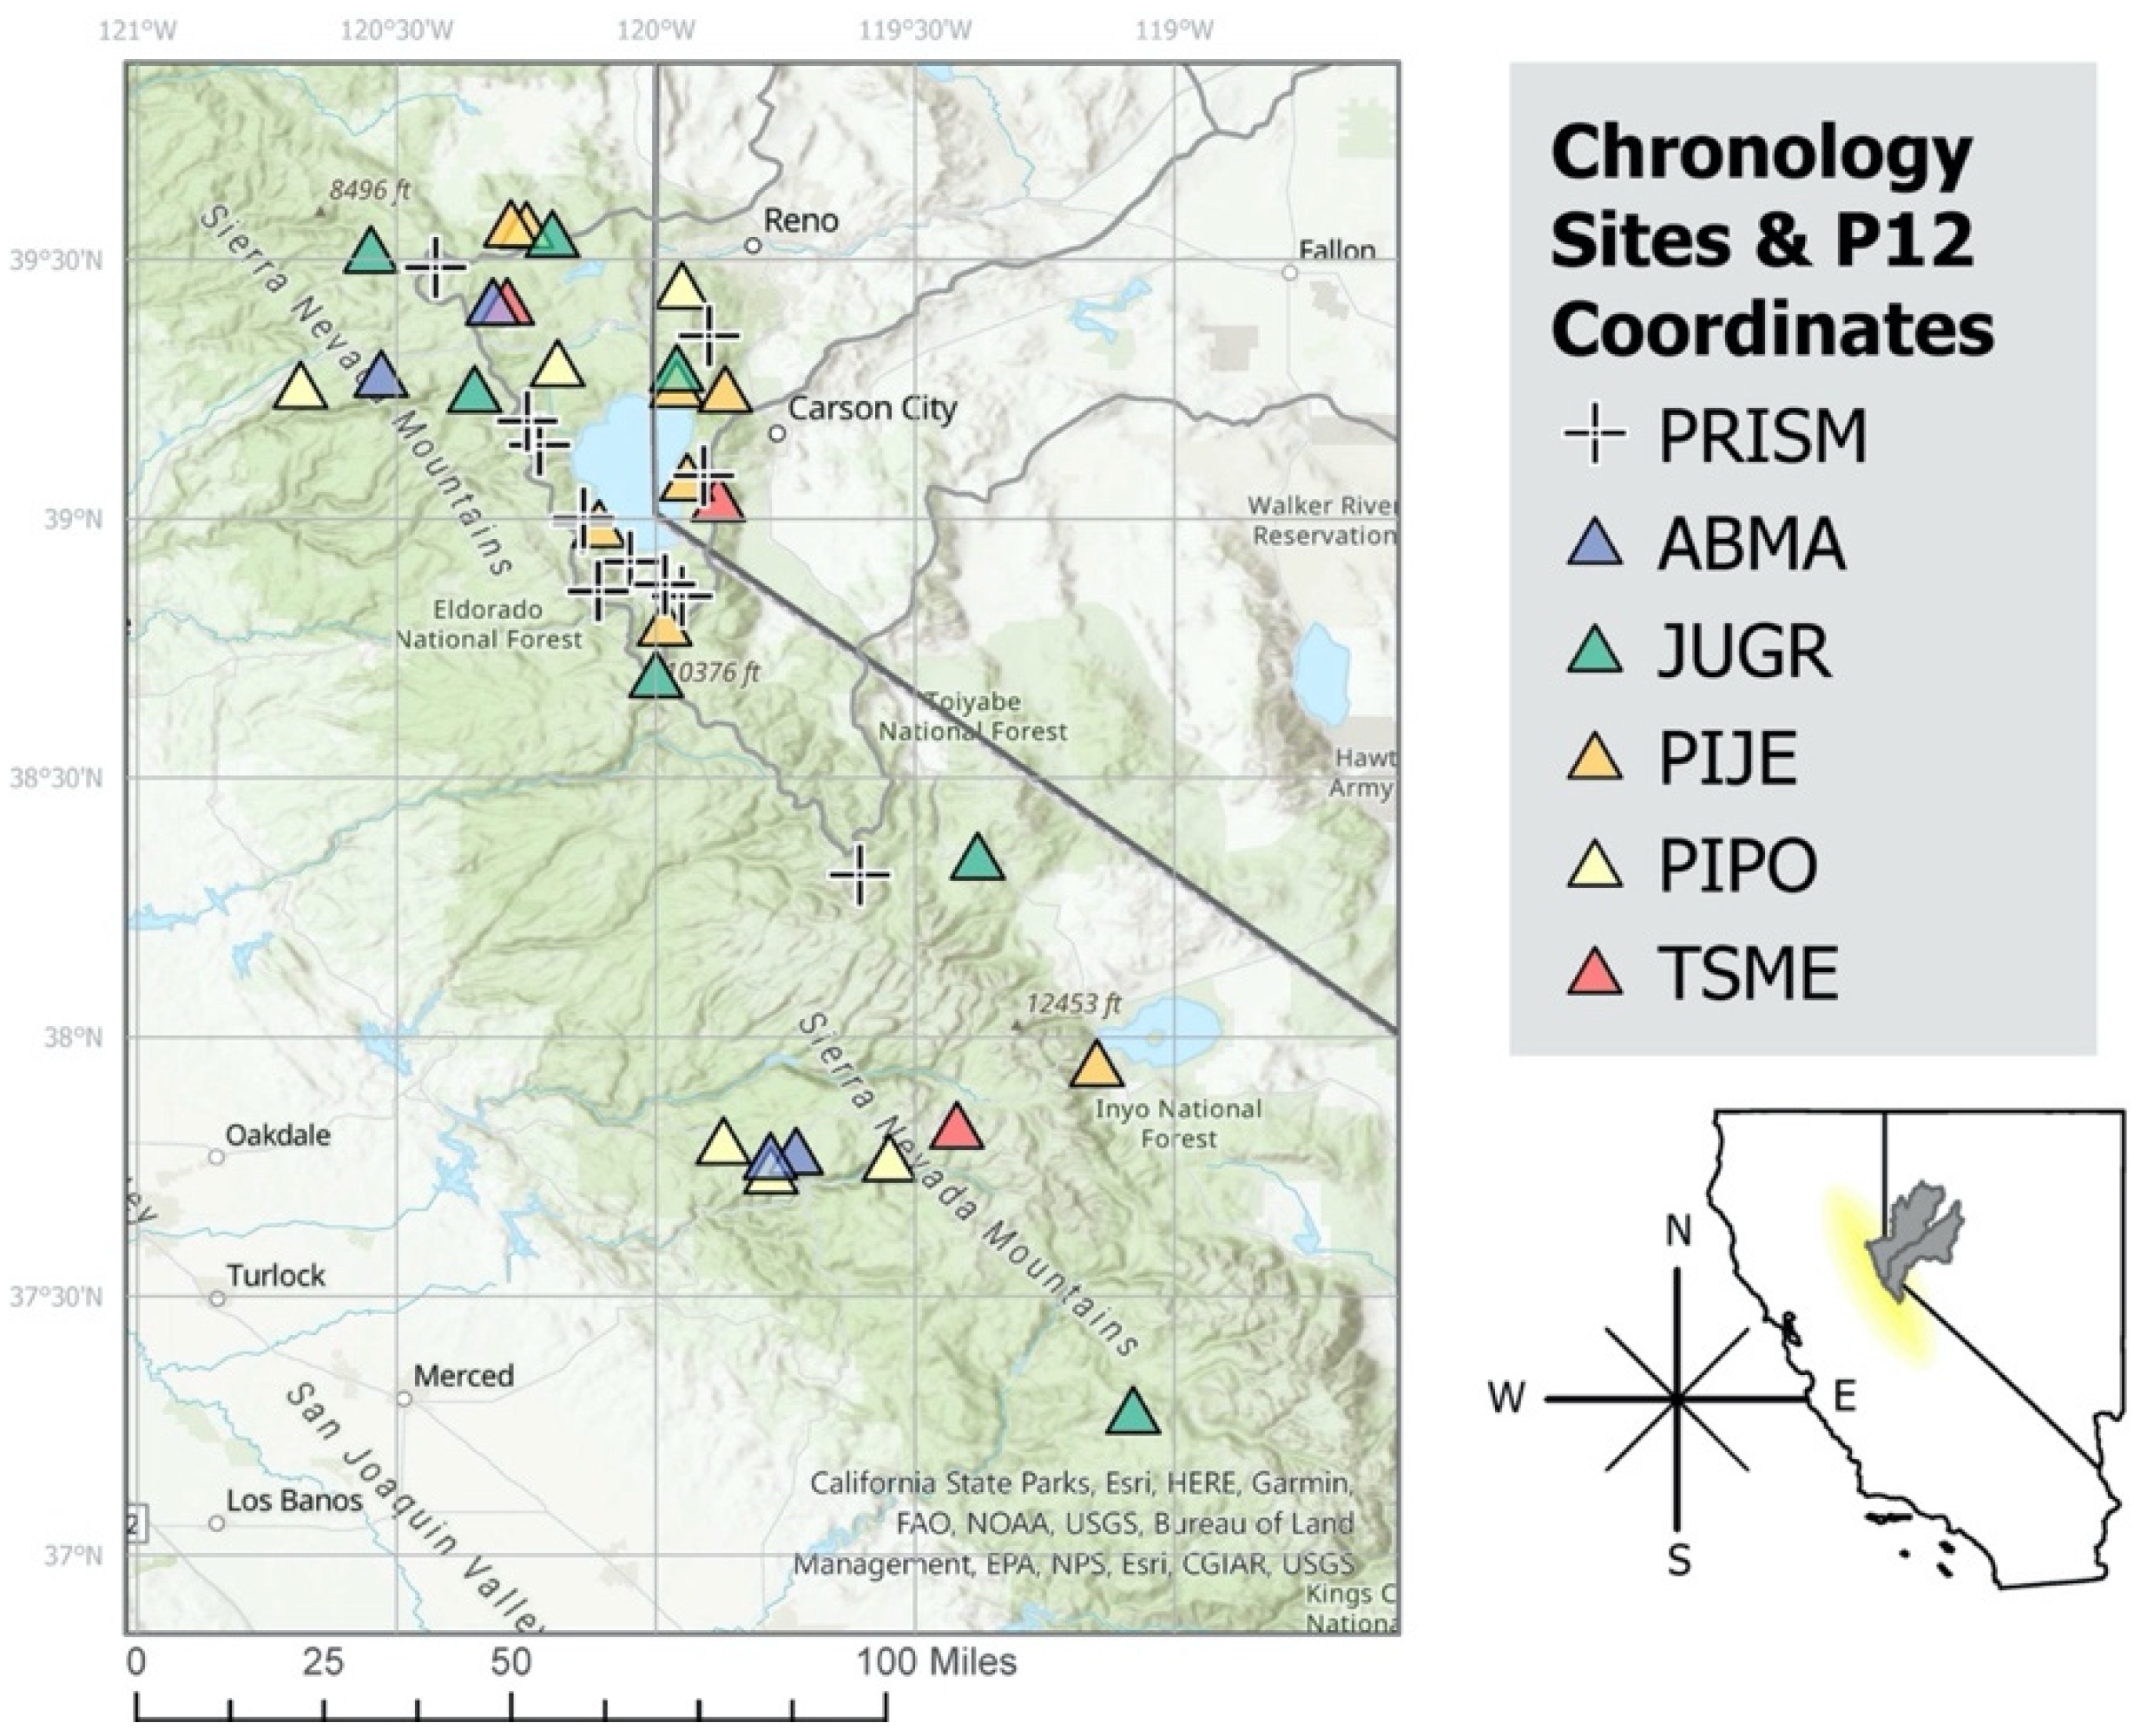
Figure 1. Regional map showing chronology sites color-coded by species and PRISM grid point locations used for regional water-year precipitation interpolation.
Environments 10 00012 g001
Figure 2. Time series of P12 precipitation data, 1921–1989, which is the calibration period for all reconstructions. Whiplash events are identified in the second year of the two-year whiplash event by positive (blue) and negative (red) triangles and ranked (annotated number) by the size of the precipitation anomaly in the two years, as described in the text. For example, 1982 and 1987 are the second years of the top-ranking positive and negative events, respectively.
Environments 10 00012 g002
Figure 3. Whiplash events in observed regional precipitation (P12) and in species-specific and full-network (All) reconstructions, 1921–1989. Bars are plotted at the second year of the event. Positive events are above the x axis, and negative events below. Numbers above and below bars are ranks of positive and negative events in observed P12 as defined in text. The asterisk indicates that the annotated ranks apply to P12, and so ranks appear only when P12 is one of the stacked bars.
Environments 10 00012 g003
Figure 4. Significance of tracking of whiplash events in P12 by reconstructions as a function of variance explained by reconstruction model. Significance estimated by hypergeometric analysis for positive (left) and negative (right) events. The y-axis is the p-value (log scale) for rejection of the null hypothesis that a number of matches or greater could occur by chance. Colors code species-specific and full-network (All) models.
Environments 10 00012 g004
Figure 5. Monthly P12 precipitation in years of whiplash events in P12. (A) Positive events. (B) Negative events. Events are ordered by severity ranking (number at upper right). Background shading shows long-term mean monthly precipitation, which does not vary among frames. The colored dots indicate species-specific reconstructions with events in same years.
Environments 10 00012 g005
Figure 6. Whiplash events in observed P12 and in site-specific reconstructions grouped by tree species, 1921–1989. Plotting convention as in Figure 3. Numbers above and below bars are ranks of positive and negative P12 events as defined in text. Color codes identify the chronologies of the five species (see Table 1). Labeled years (A–F) are examined in more detail in Section 3.2.
Environments 10 00012 g006
Figure 7. The significance of tracking of P12 whiplash events by single-site reconstructions. The y-axis is the p-value (log scale) representing the probability of obtaining the observed number of matches or greater by chance, according to the hypergeometric test. The species are color-coded. Each box plot summarizes the distribution of p-values for tracking chronologies of that species, and the dots, offset horizontally for clarity, give the p-values for individual chronologies. The median and middle quartile positive JUGR p-values are the same, so the box does not render.
Environments 10 00012 g007
Figure 8. Event-matching significance as a function of R2 of regression models for single-site reconstructions. Points, color-coded by species, represent p-values for the hypergeometric test of the number of matches of P12 whiplash events by events in reconstruction. Plotting convention as in Figure 4. Least-squares-fit lines shown only for sites grouped by species when the slope of the line is significantly different from zero at α = 0.05.
Environments 10 00012 g008
Table 1. Complete pool of predictor chronologies used in various tree-ring reconstructions of P12.
Site CodeSpecies CodeLat.Lon.Elev. (m)SourceStart YearEnd Year
CA574ABMA37.77−119.772180ITRDB18801991
CA589ABMA37.78−119.732075ITRDB18801991
CA691ABMA39.42−120.312478ITRDB15402015
CA696ABMA39.28−120.532008ITRDB17992014
CA630JUGR38.42−1202591ITRDB−4201999
CA631JUGR39.52−120.551921ITRDB9301999
CA632JUGR39.33−120.122268ITRDB10101999
CA698JUGR39.15−120.211809ITRDB16002014
DGSJUGR38.35−119.382370Biondi−3002000
IVJJUGR39.28−119.962563Taylor11422000
KAIMJUGR37.28−119.082730Meko11402011
CA677PIJE39.34−120.171688ITRDB14152010
CA678PIJE37.57−119.092499ITRDB13042010
DLBPIJE38.99−120.112004Taylor13062000
IVPPIJE39.27−119.962332Taylor13052000
LEMPIJE39.34−120.0152008Biondi15422020
LSFPIJE38.48−119.592416Biondi14742020
LTVPIJE39.15−119.522006Biondi14182020
SSPPIJE39.08−119.942132Taylor11901999
CA578PIPO37.8−119.871722ITRDB18801990
CA583PIPO37.75−119.771803ITRDB18801990
CA694PIPO39.2988−120.19151975ITRDB18292014
CA695PIPO39.258−120.68571537ITRDB18382014
CPRMTRPIPO39.27−119.572507Biondi14742020
NODPIPO37.46−119.331539Biondi15392002
CA567TSME37.83−119.422960ITRDB18801990
CA692TSME39.42−120.312478ITRDB16152015
GPHTSME39.04−119.882728Taylor13492000
Table 2. Summary statistics 1 of species-specific reconstructions and from full-network (ALL) reconstruction of P12.
ReconChronologiesR2R2adjFREcvRSME
ALLDGS CA574 CA567P10.6130.59534.3270.583227.276
ABMACA696P1 CA691P1 CA574P1 CA574 CA589P1 CA6960.4300.3757.8000.384276.220
JUGRDGS KAIM IVJN2 CA6300.5400.51521.4210.498253.836
PIJECA677 CA678 LSFP1 LEM LSF0.4860.45013.6220.426271.409
PIPOCA578 CA694P10.3210.30115.6340.247305.411
TSMECA692P1 CA567P1 GPH GPHP2 CA692N20.4630.42010.8550.409270.588
1 “Chronologies” refers to the tree-ring chronology site code (see Table 1) and lag (e.g., P1 is t + 1) of the chronology from the year of the predictand in the reconstruction model. No “P” or “N” after the site code means the chronology in the model is unlagged from the predictand. The calibration statistics listed are the regression R-squared, adjusted R-squared, and overall-F. All listed F are significant, with p-values less than 0.00001. The validation statistics (from cross-validation) listed are the reduction-of-error statistics and the root-mean-square error of validation.
Table 3. Significance of tracking of positive (POS) and negative (NEG) whiplash events in P12 by species-specific and full-network reconstructions as estimated by the hypergeometric test. Sample size (Ns = 69) and maximum possible event matches (M = 6) are the same for all reconstructions. The last two columns list the probability, by chance alone, of m-or-more successes (events identified) given k draws from the sample.
Namem (POS)m (NEG)k (POS)k (NEG)p-Val (POS)p-Val (NEG)
ALL3376<0.001<0.001
ABMA12670.08140.0116
JUGR3476<0.001<0.001
PIJE3176<0.0010.0814
PIPO3376<0.001<0.001
TSME3366<0.001<0.001
Disclaimer/Publisher’s Note: The statements, opinions and data contained in all publications are solely those of the individual author(s) and contributor(s) and not of MDPI and/or the editor(s). MDPI and/or the editor(s) disclaim responsibility for any injury to people or property resulting from any ideas, methods, instructions or products referred to in the content.