Article

Surface-Modified Activated Carbon Fibers by a Facile Microwave Technique for Enhancing Hydrocarbon Adsorption

Department of Advanced Materials and Chemical Engineering, Jeonju University, Jeonju 55069, Republic of Korea
*
Author to whom correspondence should be addressed.
Environments 2023, 10(3), 52; https://doi.org/10.3390/environments10030052
Submission received: 21 February 2023 / Revised: 8 March 2023 / Accepted: 10 March 2023 / Published: 13 March 2023
(This article belongs to the Special Issue Deployment of Green Technologies for Sustainable Environment II)

Abstract

:
Evaporative emissions from automobiles, which mainly consist of hydrocarbons, are a major source of air pollutants. As such, prevention means are required to minimize such emissions. Evaporative emissions are collected using adsorbents, where the adsorption capacity is directly influenced by the ratio of oxygen-containing functional groups, which have high polarity. This study investigated the effect of controlling the oxygen functional group (OFG) on the hydrocarbon adsorption/desorption performance of activated carbon fiber (ACF) in adsorbents. We used microwave heating to remove OFG on the ACF surfaces. The removal of surface OFG by microwave heating was analyzed using scanning electron microscopy-energy-dispersive X-ray spectroscope (SEM-EDS), Fourier transform infrared spectroscopy (FT-IR), thermogravimetric–infrared gas analysis (TGA-IR), and X-ray photoelectron spectroscopy (XPS). According to microwave heating, textural properties were analyzed using N2/77K adsorption/desorption isotherms. The hydrocarbon adsorption/desorption performance of the ACF was evaluated according to a modified ASTM D5228. Compared to the untreated ACF, the butane working capacity of the modified (non-polarized) ACF was increased by up to 20% (adsorption capacity 27%).

1. Introduction

As per the definition (World Health Organization (WHO)), volatile organic compounds (VOCs) are organic compounds with a Reid vapor pressure of more than 10.3 Pa at ambient temperature (25 °C) and pressure (101.325 kPa). Furthermore, they are hydrocarbon (HC)-based compounds that evaporate easily at room temperature [1,2,3]. Automotive emissions, a major source of VOCs, can be classified into two types: exhaust gas and evaporative gas. Between these, evaporative gas, which mainly consists of HC, is harmful to human health and the environment. Hence, the removal of these pollutants is imperative [4,5,6,7]. Automotive evaporative gas emissions can be classified into three main loss mechanisms: running, hot soak, and diurnal breathing loss (DBL) [8]. Between these, DBL occupies the largest proportion of evaporative gas emissions [9,10]. Produced evaporative gas is collected into canisters or HC traps via an evaporative emission control (EVAP) system. When an engine operates, vapors are drawn from the storage canister into the intake manifold, followed by combustion in the cylinder before being used as fuel [11]. Therefore, an adsorbent with an excellent HC adsorption/desorption performance is required for enhanced evaporative gas removal.
Commercially available adsorbents include activated carbon (AC), activated carbon fiber (ACF), zeolite, silica gel, and alumina [12,13,14,15,16]. Among these, ACF is especially effective in adsorbing VOCs from a gaseous stream compared to other commercially available adsorbents due to well-developed micropores on the surface and exhibits optimal performance in removing low-concentration HC pollutants, especially under high-gas-flow-rate conditions [17].
For developing porous microstructures in ACF, an activation process based on oxidation at high temperatures is required, which involves the inevitable production of oxygen-containing functional groups on the surface of ACF [18,19,20]. The oxygen functional group (OFG) reduces the HC adsorption capacity, which is a non-polar compound; thus, the removal of surface OFG on ACF is instrumental for increased HC pollutant adsorption [21,22].
In previous studies [23,24,25], heat treatments in different atmospheres (inert, reducing, etc.) were performed to remove the OFG on AC and ACF. Furnaces, microwaves, and induction are commonly used for the heat treatment of the AC and ACF [25,26]. Several previous studies have used the furnace method [24,25]. It presents the advantages of scalability and high versatility. However, since the heat source in furnace heating is located outside the samples and heat is transferred by radiation, the heat conduction of ACF samples from the outside to the inside requires an extended time and high energy consumption. In the case of induction heat treatment, heat generation varies depending on the material density, and the method is unsuitable for low-density ACF. In contrast, microwave heating supplies energy to the carbon particles, where the energy is converted into heat within the carbon particles of ACF by dipole rotation and ionic conduction, enabling quick heating [27]. Conclusively, microwave heating presents the advantages of rapid heating, allowing fast heat treatment and saving energy compared to conventional methods such as furnace heating [28]. Therefore, microwave heating was used in this study for removing OFG on ACF.
The n-butane adsorption mechanism of ACF is achieved by van der Waal’s interaction (physical adsorption). The polar OFG of the ACF surface combines with carbon to reduce the interaction with non-polar n-butane, which causes a decrease in adsorption performance due to a decrease in adsorption heat. Therefore, the removal of OFG in the ACF surface affords improved n-butane adsorption performance. However, recent research reported on the changes in HC adsorption performance according to the changes in textural properties by the pore structure of the adsorbents. To date, few studies have investigated the n-butane adsorption/desorption behavior of ACF with surface chemical modification by varying the OFG only—without changing the textural properties of ACF via pore structure control. Consequently, we examined the effect of OFG removal on the ACF with different microwave heating conditions on the HC adsorption/desorption performance of ACF. Microwave heating enabled the simple removal of OFG on the ACF with a short treatment time. Accordingly, correlations between textural properties, surface oxygen content and surface OFG composition and butane working capacity (BWC), butane retentivity (BR), and butane activity (BA) for n-butane were also analyzed.

2. Experimental

2.1. Sample Preparation

Rayon-based ACF (FM10, Calgon Carbon Corporation, Pittsburgh, PA, USA) was used for the acquired samples. Preceding microwave heating, the ACF samples were cut into sizes of 3 × 3 cm and stored at 105 °C for 24 h. A microwave heating system for the experiment was built using a household microwave oven (MW22CD9D, LG Electronics, Seoul, Republic of Korea). Prior to heating, all ACF samples (1.0 g) were placed in a built quartz reactor (diameter 70 mm × length 100 mm) at room temperature, and N2 flow was maintained at 200 mL/min to sufficiently exclude air. The samples were then microwaved for 1–7 min at an input power of 400 W. An inert atmosphere was maintained during microwave heating by passing high-purity N2 maintained at a flow rate of 200 mL/min. After microwave heating, the ACF samples were left to naturally cool and stored at 105 °C for 24 h under a vacuum. The ACF samples subjected to microwave heating were termed “reduced activated carbon fiber (rACF)-microwave heating time (M)”.

2.2. Characterization

2.2.1. Surface Functional Group Analyses

Various analysis techniques were used to analyze the changes in OFG of the ACF by microwave heating. The change in the elemental composition of ACF with microwave heating was analyzed using scanning electron microscope–energy dispersive X-ray spectroscopy (SEM-EDS), SEM (CX-200TA, COXEM, Daejeon, Republic of Korea) combined with EDS (Element SDD, AMETEK, Berwyn, PA, USA), under the conditions of 20 kV accelerating voltage and pressure of <1 × 10⁻³ torr.
The OFG changes on the surface of ACF according to microwave heating were analyzed using transmission infrared spectra obtained by Fourier transform infrared spectroscopy (FT/IR-4600, Jasco, Tokyo, Japan) using 7 mm-diameter pellets with ACF and KBr mixed in the same weight ratio. For the FT-IR analysis, the laboratory environment was maintained under the same conditions of temperature (25 °C) and humidity (30%).
The ACF composition changes of surface OFG before and after microwave heating were analyzed employing an X-ray photoelectron spectroscopy (XPS) (Nexsa, Thermo Fisher Scientific, Waltham, MA, USA). Spectra were collected with an X-ray source (Al Kα, photon energy 1486.6 eV). During the analysis, the pressure inside the chamber was maintained at <2 × 10⁻⁷ Torr. The collected spectra deconvolution was performed using a nonlinear least-squares curve-fitting program with a Gaussian–Lorentzian function.
A thermogravimetric (TGA/DSC 3+, Mettler-Toledo, Columbus, OH, USA)–infrared gas analyzer (I 4001-E, MIDAC, Westfield, NJ, USA) was used to analyze the gases released during the TGA experiment in real time using FT-IR by connecting the TGA with an IR gas analyzer. To evaluate the changes in OFG of the ACF, FT-IR spectra of CO and CO2 released during pyrolysis of ACF samples in the inert atmosphere (N2) were analyzed. The experimental conditions were set to a heating rate of 10 °C/min, a heating temperature range of 25–900 °C, and an N2 flow rate of 200 mL/min. Before performing TGA-IR, the ACF samples were stored under a vacuum at 105 °C for 24 h. Following air exclusion N2, the same sample weight (5 mg) was used for analysis.

2.2.2. Textural Properties

The textural properties of ACF were analyzed based on N2/77K adsorption–desorption isotherms using BELSORP-Max II (Microtrac BEL, Osaka, Japan). Prior to the analysis, the respective ACF samples (0.15 g) were treated at 300 °C and <1 × 10⁻³ torr pressure. Based on the N2 adsorbed to the ACF, the specific area and total pore volume of the ACF were calculated by the Brunauer–Emmett–Teller (BET) equation [29], and the micropore volume of the ACF was calculated by the t-plot method [30].

2.3. Evaluation of the Butane Working Capacity (BWC) of Activated Carbon Fibers

The BWC of the ACF was determined following the standard method specified in the modified ASTM D5228 [31]. A schematic diagram is shown in Figure S1. The ACF samples (0.5 g) were placed in a U-shaped cell and placed in a water bath at 25 °C. N-butane was fed into the U-shaped cell at a rate of 250 mL/min for 15 min. The mass change due to the adsorption of n-butane to the ACF was measured, and n-butane adsorption was repeated at 10 min intervals until there was no change in ACF mass. When the ACF was saturated to the point where no mass change was observed, the cell was purged by flowing N2 at a rate of 300 mL/min for 40 min. This process of measurement was repeated five times, and the calculated average value was recorded and used. BWC, butane activity (BA), and butane retentivity (BR) were calculated using the following Equations (1)–(3).
Butane   working   capacity   ( % ) :   B C A × 100
Butane   activity   ( % ) :   B A A × 100
Butane   retentivity   ( % ) :   C A A × 100
where A denotes the weight of the ACF sample, B represents the weight of the sample saturated with n-butane, and C is the weight of the purged ACF sample using N2 for 40 min.

3. Result and Discussion

3.1. SEM-EDS

SEM-EDS is a useful method to analyze elemental composition changes in the ACF according to microwave heating conditions. Table 1 presents the elemental composition of ACF obtained based on the SEM-EDS analysis. The ACF carbon content increased by 87.9–92.1%, and the ACF oxygen content decreased by 10.5–5.3% with the increasing microwave heating time. Furthermore, the oxygen/carbon (O/C) ratio of the ACF was reduced to 0.119–0.058. Conclusively, it is recognized that OFG on the ACF are removed by microwave heating, and the oxygen content on the ACF surface is reduced, whereas the carbon content increased.

3.2. FT-IR

The OFG on the ACF are bound to the edge sites of carbon crystallite and exist in the form of carboxyl, carbonyl, phenolic hydroxyl, and ether. The OFG may alter the polarity of the ACF surface [32,33]. FT-IR is effective at analyzing the changes in the OFG of the ACF using spectra obtained via the wavelength of light absorbed by the ACF. Figure 1 shows the FT-IR spectra of ACF according to microwave heating time. Changes were observed for all the ACF samples in peaks of similar ranges at wavenumbers of 3300–3600 cm−1, 1650 cm−1, and 1100 cm−1. The broad peak at 3300–3600 cm−1 was ascribed to OH vibrations including hydrogen bonding of ACF [34]. The peak at 1650 cm−1 was affected by the C=O stretching vibrations of the carbonyl group adjacent to the quinone and hydroxy groups of ACF [35], and the peak at 1100 cm−1 was attributable to the C-O stretching vibrations of the ether, phenolic hydroxyl, carboxylic, and carboxylic anhydride groups of ACF [36]. The OH peak change at 3300–3600 cm−1 was determined by removing moisture from ACF using microwave heating and reducing the carboxyl group. The change in the C=O peak at 1650 cm−1 was ascribed to the reduction in carbonyl and quinone groups in the ACF. Finally, the C-O peak change at 1100 cm−1 was caused by the ether, phenolic hydroxyl, carboxylic, and anhydride group reduction in the ACF. The FT-IR analysis confirmed that the intensity of the peaks related to ACF OFG showed a gradual decrease overall with an increased microwave heating time.

3.3. TGA-IR

The curves of the evolved gases, CO and CO2, that are released from the ACF, were obtained using TGA-IR analysis (Figure 2). In the ACF pyrolysis process, CO is released via the ether, phenolic hydroxyl, carbonyl, and quinone decomposition in ACF [37], and CO2 is released via carboxyl and lactone decomposition [38,39]. With the increasing microwave heating time, the CO and CO2 released from the ACF pyrolysis decreased. This is attributable to ACF OFG that were actively removed in the early stage of microwave heating due to the fast temperature rise. Changes in the curve shape of CO2 were observed at <400 °C, which is caused by the decomposition of the carboxyl group and lactone. Furthermore, CO2 release at temperatures >400 °C could be due to the decomposition of lactone and carboxylic anhydride [37], and decomposition due to a rising temperature was clearly observed. The shape of the CO curve showed a significant change >700 °C, which is likely due to ether, phenolic hydroxyl, carbonyl, and quinone decomposition at high temperatures. The ACF produced CO with higher intensity than that of CO2, along with a notable change in the amount of released CO. The composition of ACF OFG, ether, phenolic hydroxyl, carbonyl groups, and quinones account for higher proportions than those of the carboxyl group and lactones. In addition, the changes in the curve of CO indicated that the temperature of the microwave heating reached approximately ≥700 °C.

3.4. XPS

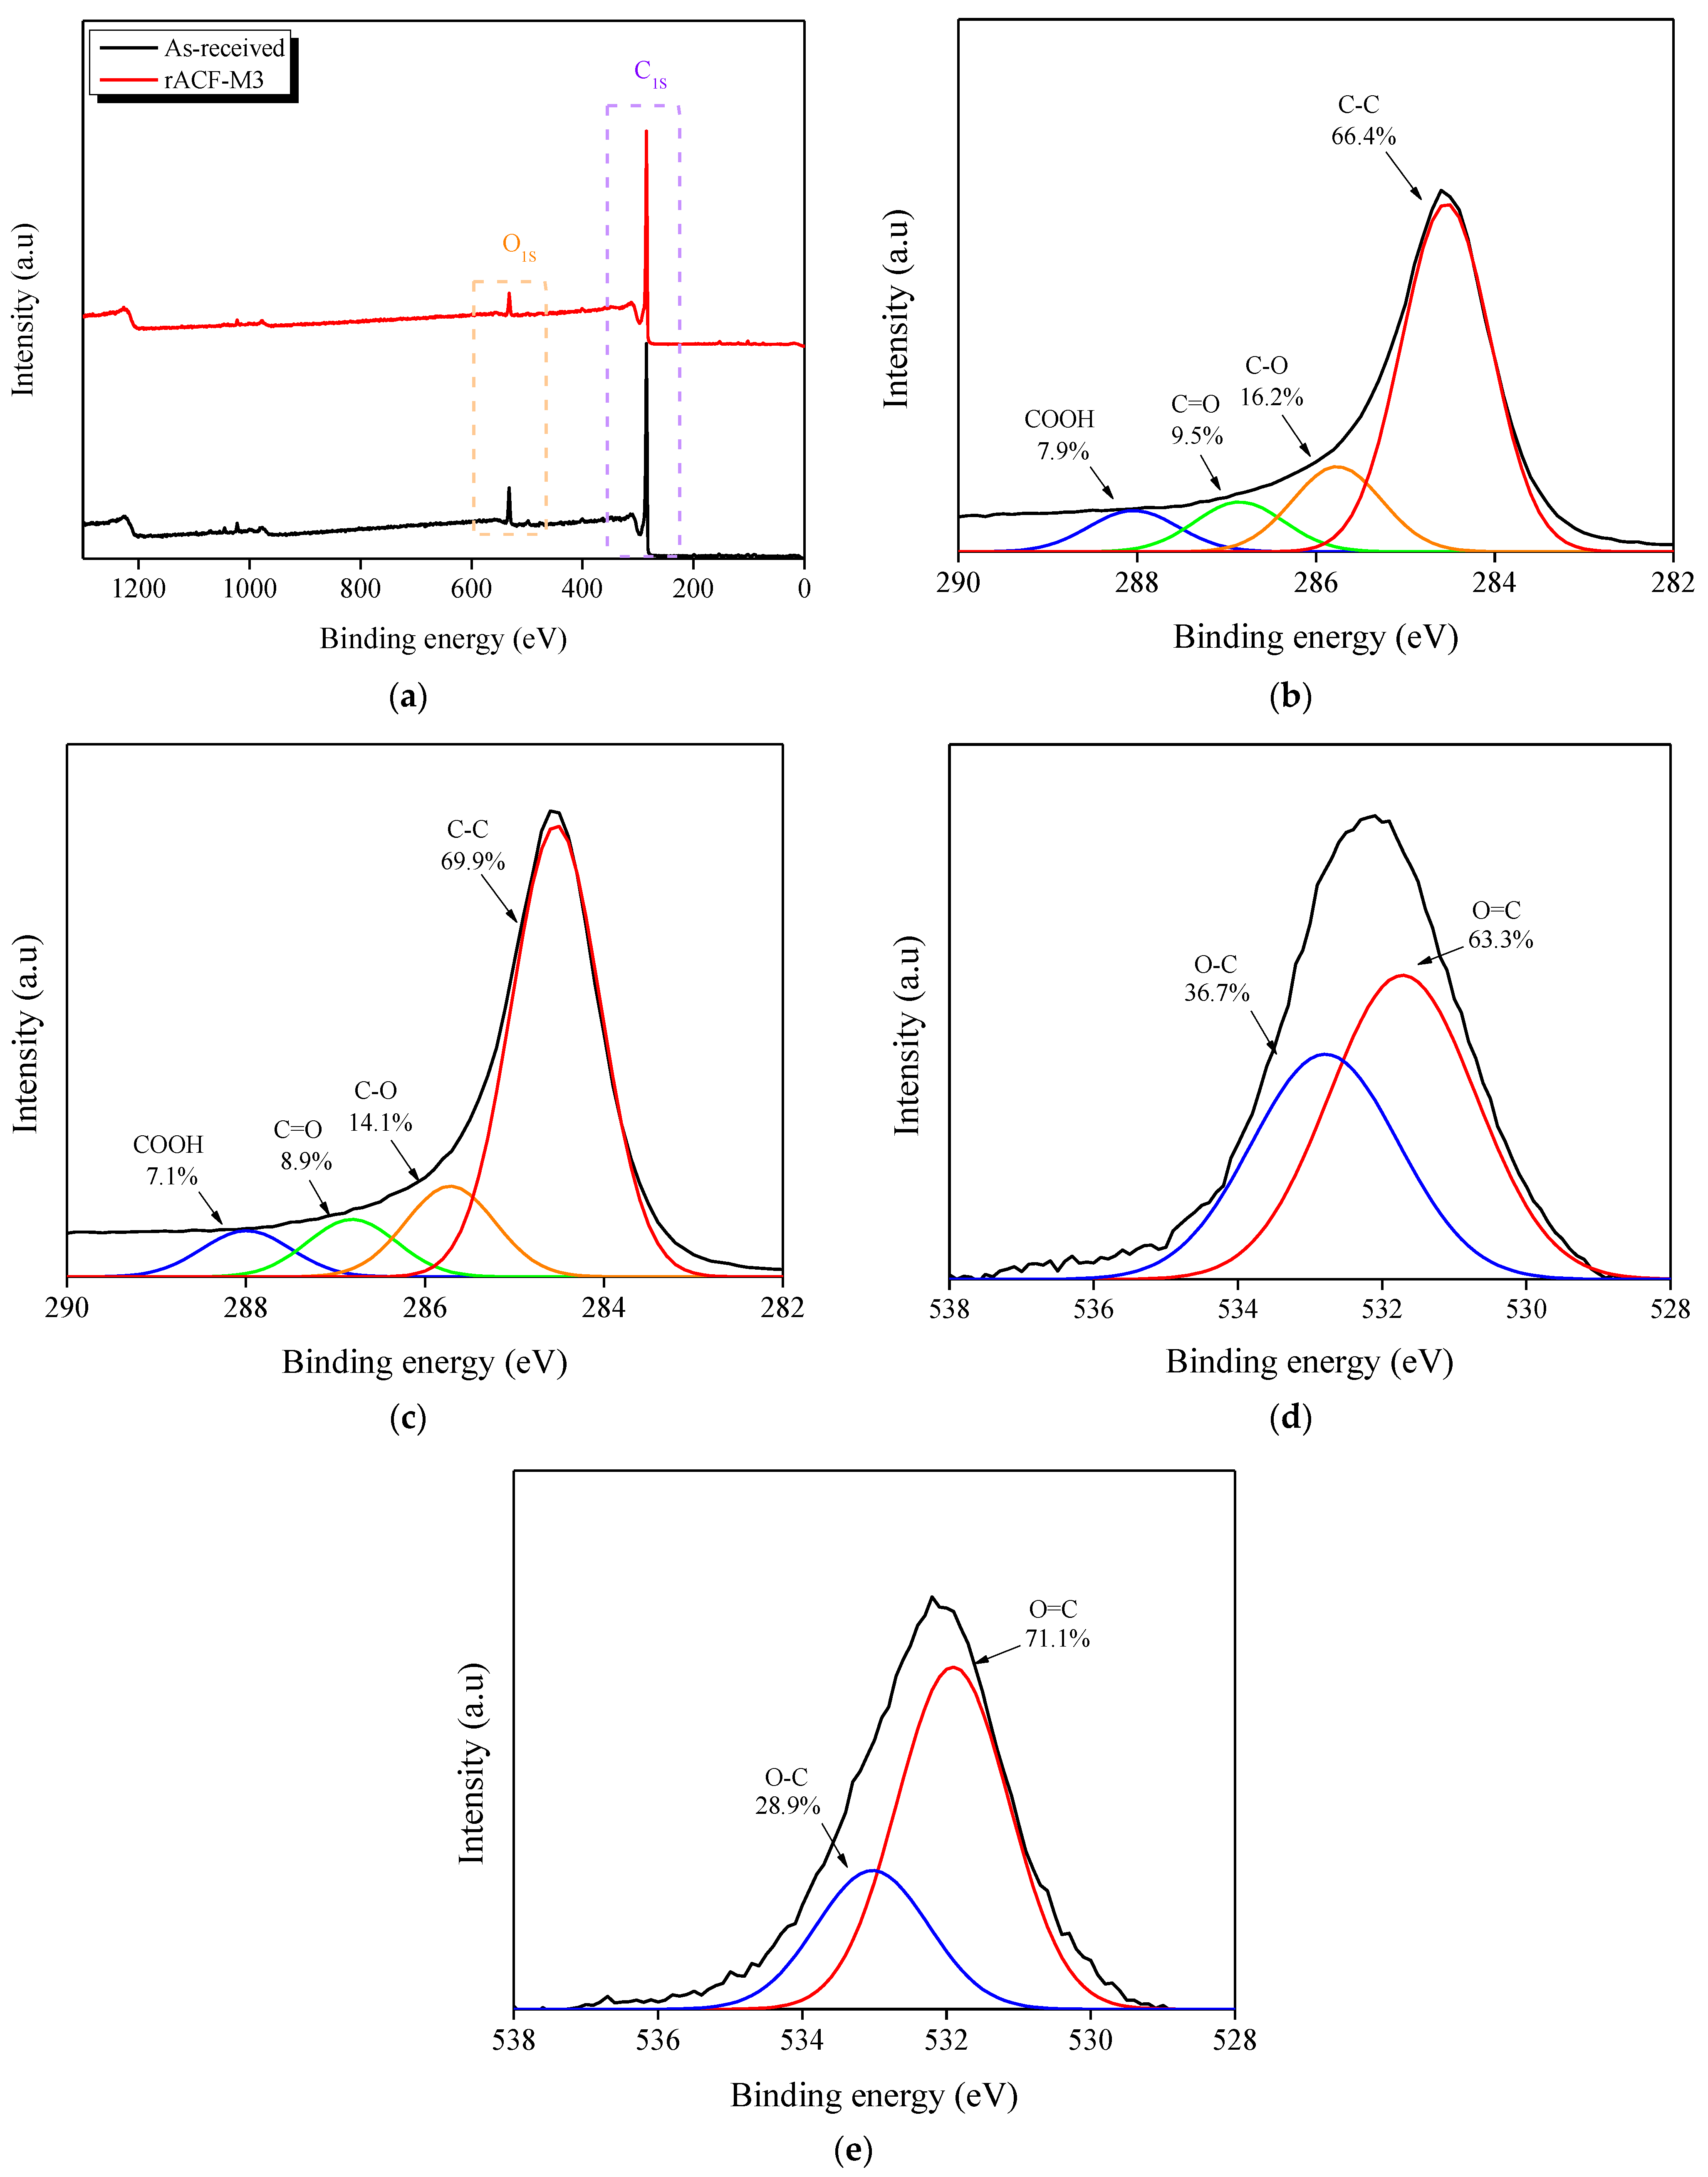
XPS is used for surface analysis via electronic state and atom binding investigations on the ACF surface using X-rays, and it allows for an analysis of changes in the surface OFG of the ACF. Figure 3a exhibits the survey spectra of the untreated ACF sample (As-received) and the ACF that were subjected to 3 min of microwave heating. The results indicated that due to the removal of surface OFG of ACF, the intensity of the C1S region increased, and the intensity of the O1S region decreased.
Figure 3b,c show the results of deconvolution of the C1S region of the As-received and rACF-M3, respectively, indicating that the C1S spectrum deconvoluted into C-C peak (approximately 284.6 eV), C-O peak (approximately 285.8 eV), C=O peak (approximately 287.0 eV), and a COOH peak (approximately 281.1 eV) [40]. The C-C, C-O, C=O, and COOH peaks of the As-received accounted for 66.4%, 16.2%, 9.5%, and 7.9%, respectively, and those of rACF-M3 accounted for 69.9%, 14.1%, 8.9%, and 7.1%, respectively. The C-C peak area increased after microwave heating, and the other peak areas (except for the C-C peak) decreased. We assume that the C-C bond formation increased with the removal of OFG on the ACF surface by microwave heating.
Figure 3d,e show the results of deconvolution of the O1S region of the As-received and rACF-M3, respectively, indicating that the O1S spectrum deconvoluted into O=C (approximately 531.9 eV) and O-C (approximately 533.0 eV) peaks [41]. The O=C and O-C peaks of the As-received and rACF-M3 accounted for 61.7–76.6% and 38.3–23.4%, respectively. The O-C peak intensity of rACF-M3 was decreased compared to that of the original ACF samples, but the intensity of the O=C peak was similar between the two samples. This is likely caused by the active decomposition of the carboxyl group, ether, and phenolic hydroxyl, which are decomposed at relatively low temperatures, and weak decomposition of carbonyl and quinones, respectively. Therefore, the results of XPS analysis confirmed the active decomposition of the carboxyl group, ether, and phenolic hydroxyl, which are decomposed at relatively low temperatures, and the weak decomposition of carbonyl and quinones, which are decomposed at relatively high temperatures. In addition, the XPS analysis technique is limited to the surface in the wavelength range of 10–100 Å, and microwave heating forms a thermal gradient where the temperature inside the sample is higher than the temperature outside. Hence, it is inferred that the decomposition of carbonyl and quinone on the surface of the sample was relatively weak.
The OFG changes on the ACF by microwave heating were analyzed using SEM-EDS, FT-IR, TGA-IR, and XPS techniques. As a result of SEM-EDS analysis, with the increasing microwave heating time, the elemental composition of ACF changed, and the oxygen content decreased whereas the carbon content increased. Similarly, the FT-IR analysis indicated a decrease in ACF OFG-related peaks with increased microwave heating times. Changes in ACF OFG were established using the changes in CO and CO2 released from ACF pyrolysis, and the amount of the evolved CO and CO2 showed a decrease with ACF OFG removal. XPS analysis revealed that in the C1S region, with the removal of OFG, the intensity of C-C bonds increased, and accordingly, the intensities of other peaks (C-O, C=O, and COOH), decreased. A decrease in the intensity of the O-C bond was observed in the O1S region, and the change in the O=C bond was insignificant. This is considered to be the result of the active decomposition of carboxyl ether and phenolic hydroxyl and the weak decomposition of carbonyl and quinone on the ACF surface, respectively. The results of analysis based on SEM-EDS, FT-IR, TGA-IR, and XPS indicated that with an increase in the microwave heating time, the amount of ACF OFG removed increased, and OFG was quickly removed in the early stage of microwave heating (within 3 min).

3.5. N2/77K Adsorption–Desorption Isotherms

N2/77K adsorption–desorption isotherms are useful for analyzing the textural properties of ACF. Figure 4 shows the N2/77K adsorption–desorption isotherms of the ACF. All ACF were classified as type I according to the International Union of Pure and Applied Chemistry (IUPAC) classification [42], and hysteresis patterns from the formation of mesopores were not observed. This is mainly due to the development of wedge-shaped micropores on the ACF surface. Compared to the untreated ACF, the microwave-heated ACF exhibited more adsorption of N2 at a relative pressure (P/P0) of ≤0.1. This is considered to be caused by the development of micropores by microwave heating. Carbon materials with a sp2 structure may undergo alteration in their physical structures due to arc discharge caused by a potential difference during microwave heating [43]. Furthermore, microwave-heated AC in an inert atmosphere can result in closed pore opening by OFG decomposition [44,45]. Therefore, an amorphous and quasi-crystalline decomposition constituting carbon domains by arc-discharge, and the opening of closed pores by OFG decomposition, led to the development of micropores on the ACF, which resulted in more N2 adsorption at a relative pressure (P/P0) of ≤0.1.
Table 2 lists the textural properties of the ACF samples according to microwave heating time. The specific surface area and total pore volume of the ACF were 1090–1190 m2/g and 0.48–0.54 cm3/g, respectively. All microwave-heated ACF samples showed a more pronounced development of micropore volumes compared to the untreated ACF samples. The rACF-M5 samples exhibited the most developed micropore volume, and the volume was reduced in the rACF-M7 sample. Additionally, the increase in the development of mesopore volume of the ACF samples was observed with the increasing microwave heating time. ACF micropores are reasoned to be developed by the decomposition of ACF OFG by microwave heating and the decomposition of amorphous and small crystallites of carbon domains due to pyrolysis. Further, the decomposition of the OFG on the ACF into CO and CO2 may result in the opening of closed pores, which in turn contribute to the development of micropore volume. The development of mesopores is thought to be due to the oxidation of the edge sites of crystallite constituting the carbon domain by CO, CO2, and H2O released from the decomposition of the OFG on the ACF [37,38]. The decrease in the micropore volume of rACF-M7 is due to the change in micropores to mesopores with the increasing oxidation of the crystallite edge. However, in the final results, the observation showed that changes in the total pore volume and micropore volume of all ACF samples were similarly small and approximately 10%.

3.6. BWC

BWC determined, according to the ASTM D5228, is an effective method for evaluating the canister performance of ACF. In this study, the n-butane adsorption evaluation of ACF was performed according to the modified ASTM D5228. ASTM D5228 observes the weight change in ACF according to the adsorbed n-butane after a certain time. When confirming the first weight change, ACF is extremely close to the adsorption equilibrium, so it is considered that there is almost no change in the adsorption amount at the second measurement because the micropores are almost filled in the first measurement. Therefore, the n-butane adsorption behavior of ACF is expected to be extremely close to that of monolayer adsorption according to the Langmuir model. Figure 5 shows the butane activity (BA) and butane retentivity (BR) for the n-butane of ACF determined according to the modified ASTM D5228 standard. As the microwave heating time increased, BA and BR gradually increased. This is a result of an increase in the interaction between the ACF surface, modified to a non-polar surface by removing OFG with microwave heating, and n-butane, a non-polar hydrocarbon. The result values were similar for all five repeated, independent measurements according to the ASTM-D5228 standard, and it was confirmed that the adsorption–desorption performance of ACF was not decreased by the repeated adsorption and desorption of n-butane.
Table 3 presents the BWC, BA, and BR of ACF determined according to the modified ASTM D5228. The density of the ACF decreased to 0.37–0.34 g/mL according to the microwave heating time. The BA and BR of the ACF samples gradually increased as the microwave heating time increased, and the values were in the range of 25.67–32.63% and 3.83–6.65%, respectively. Using the N2/77K adsorption–desorption isotherms described in the previous section, we confirmed that all changes in the ACF textural properties were similar and approximately 10%. Accordingly, the continuously increasing BA is thought to indicate an improvement in the adsorption capacity of ACF due to the increased interaction with n-butane by the removal of the OFG of the ACF. Lee et al. [17] demonstrated that an increase in the mesopore ratio improves the n-butane desorption performance of ACF. However, in this study, no improvement in n-butane desorption performance was observed with the development of ACF mesopores. Therefore, the gradual increase in BR is considered to decrease the desorption performance due to the increase in the heat of adsorption by the increase in the interaction between the OFG-removed ACF and n-butane. The determined BWC value was in the range of 21.84–26.17%. An increase in BA (adsorption) and a decrease in BR (desorption) are required to obtain optimal performance in terms of BWC. Accordingly, optimal BWC performance was achieved in the rACF-M5 sample. The highest BA was observed in the rACF-M7 sample, but the BWC performance was reduced to 25.98% due to the increase in BR. The values of BWC determined, according to the ASTM D5228 standard, confirmed that there was an improvement in the BWC performance of the ACF with the removal of OFG by optimal conditions of microwave heating, whereas BWC performance might have been decreased due to the increased heat of adsorption of the ACF in the case of excessive microwave heating.

3.7. Correlation between the Textural Properties, Oxygen Functional Groups, and Butane Adsorption Behaviors

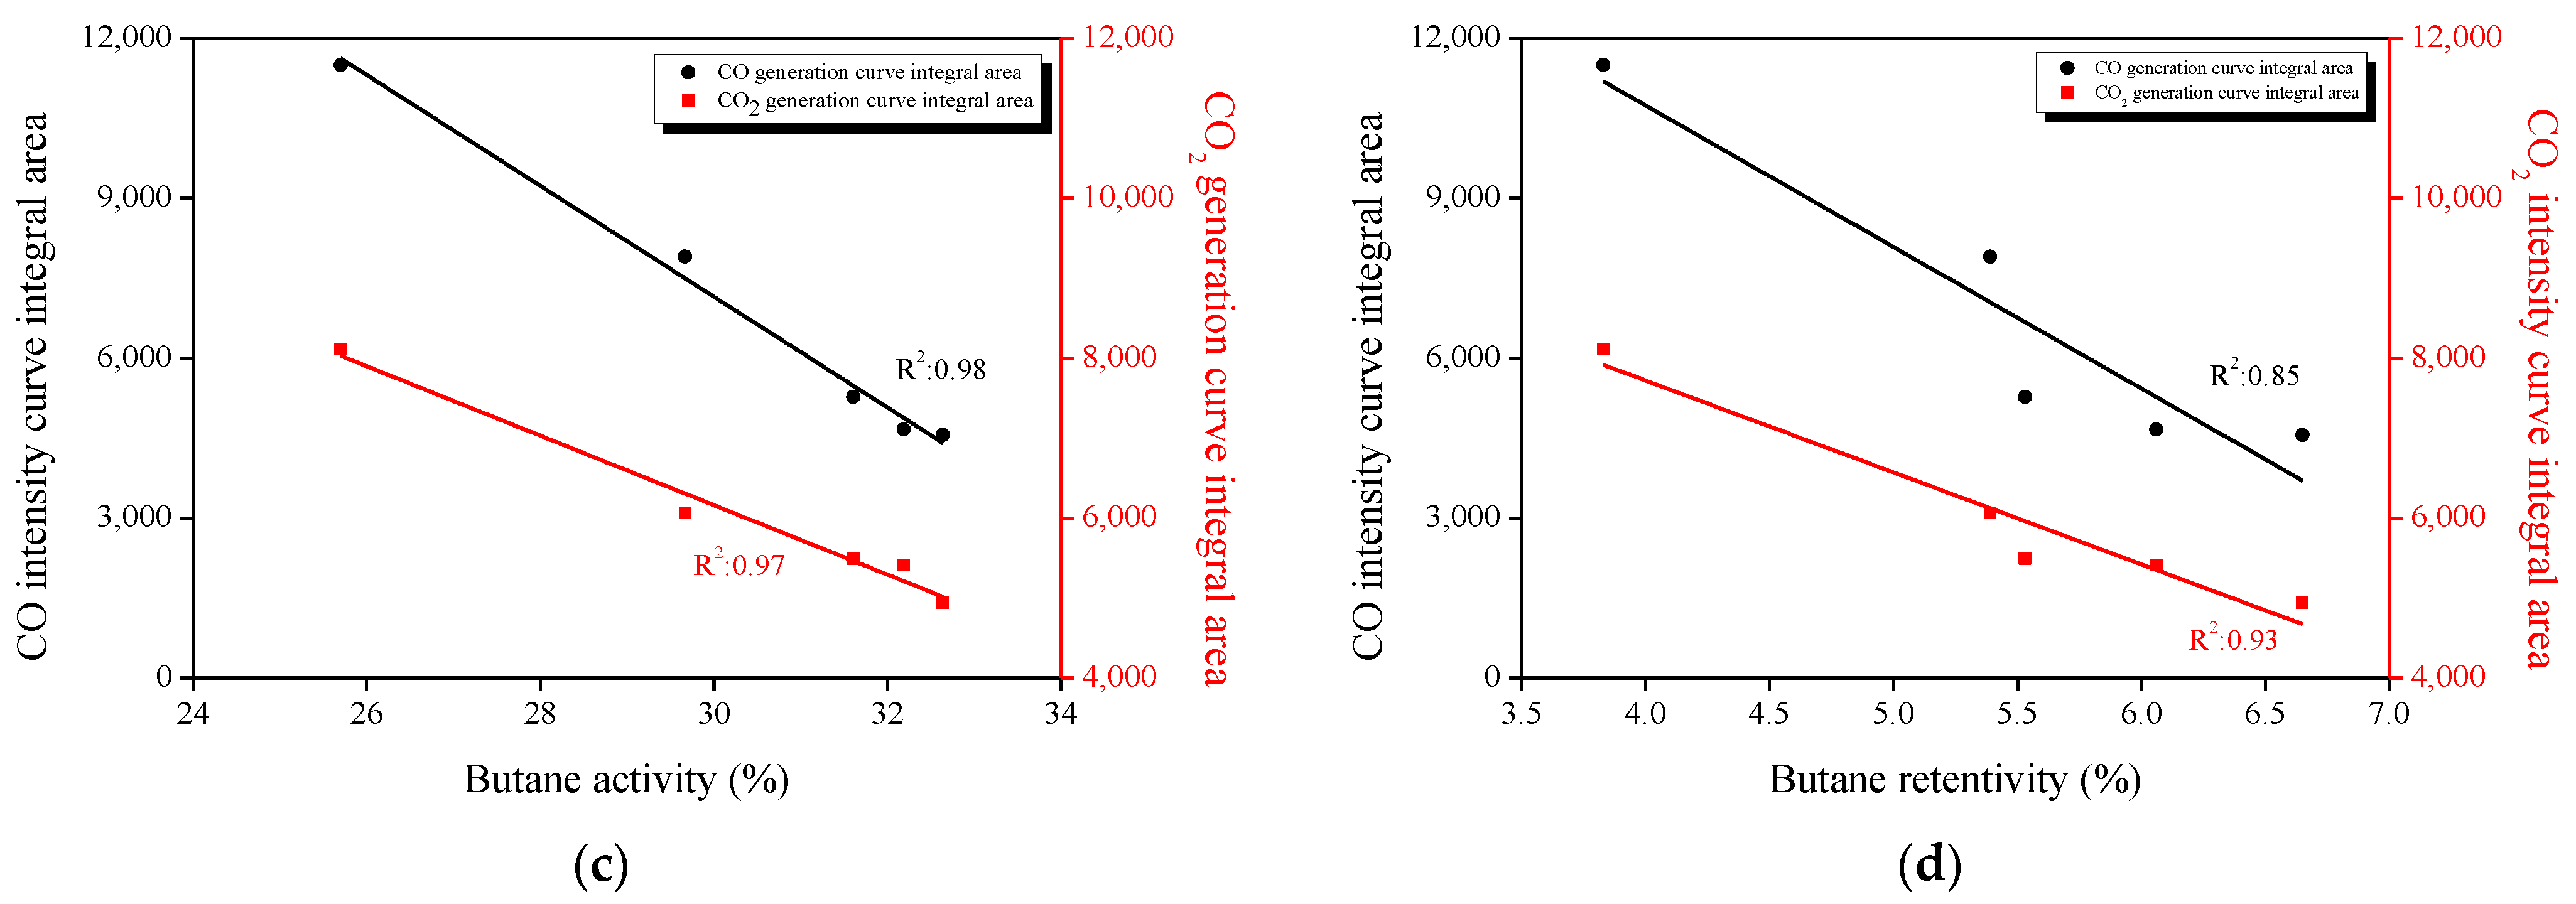
Figure 6a shows the correlation between the specific surface area and total pore volume, which are the textural properties of ACF and BA. The R2 values between the textural properties of ACF and BA were 0.45 and 0.37, respectively, indicating no clear correlation. As-received, rACF-M1, and rACF-M3 samples showed different BAs even though they had similar textural properties. Therefore, ACF textural properties do not have a significant effect on BA. Figure 6b shows the correlation between the specific surface area and total pore volume of ACF and BR. The R2 value between the ACF textural properties and BR were 0.58 and 0.47, respectively. A decrease in BR according to the continuous development of mesopores was not confirmed, and as in the case of BA, a clear correlation with the textural properties of ACF could not be established. Figure 6c,d show the correlation between OFG, BA, and BR using the area obtained by integrating the curves of CO and CO2 released from ACF pyrolysis, obtained from TGA-IR analysis. In Figure 6c, the R2 values were 0.98 and 0.97, and the n-butane adsorption capacity of ACF was confirmed to have a high correlation with the OFG on the ACF. As OFG is removed by microwave heating, the surface is modified to a non-polar surface, and the interaction with n-butane, a non-polar hydrocarbon, increased, resulting in the enhancement of the adsorption capacity of ACF. In Figure 6b, the R2 values were 0.85 and 0.93, respectively, and BR indicated a high correlation with the OFG on the ACF. With OFG removal, the BR also increased, which resulted in an increase in the heat of adsorption due to OFG removal. Furthermore, we presume that the reason for the high correlation between BR and OFG compared to the correlation between BA and OFG is due to the improvement in n-butane desorption performance by mesopore development. Therefore, the n-butane adsorption/desorption performance of ACF may have been affected by the textural properties of ACF to some extent, but the performance was mainly affected by OFG content on the ACF.

4. Conclusions

To improve the performance of canister and HC-traps, which constitute parts of the vehicular evaporative emissions control system, the effect of changes in the OFG on the surface of ACF regarding hydrocarbon adsorption/desorption performance was investigated by varying microwave heating conditions.
In this study, a range of analytical techniques was used to observe and examine the removal of the OFG via microwave heating. The elemental composition of ACF changed, and a decrease in oxygen content was confirmed. The analyses also confirmed the effective removal of the OFG on the ACF. The textural properties of ACF were changed by microwave heating; however, the range of these changes was not substantial, indicating similar values of approximately 10%. The BWC of ACF was dependent on the OFG, and a 20% increase in BWC was confirmed in the rACF-M5 sample compared to the untreated sample. This change is caused by an increase in the Van der Waals interaction between the non-polarized surface of ACF and n-butane. The study results signify that the canister and HC-trap performance can be improved only by controlling the OFG without significant changes in the textural properties of ACF.

Supplementary Materials

The following supporting information can be downloaded at: https://www.mdpi.com/article/10.3390/environments10030052/s1. Figure S1: Schematic diagram of modified ASTM D5228.

Author Contributions

Conceptualization, J.-Y.L. and B.-J.K.; methodology, B.-J.K.; investigation, J.-Y.L.; data curation, B.-J.K.; writing—original draft preparation, J.-Y.L.; writing—review and editing, J.-Y.L. and B.-J.K.; supervision, B.-J.K.; project administration, B.-J.K.; funding acquisition, B.-J.K. All authors have read and agreed to the published version of the manuscript.

Funding

This research was supported by project no. 20013038 (the development of non-firing pitch-based porous material technology for high vapor adsorption) and the carbon industry foundation project no. 20016774, (the development of activated carbon fiber and module for vaporization solvent recovery) of the Ministry of Trade, Industry, and Energy. This research was also supported by the Nano-Material Technology Development Program through the National Research Foundation of Korea (NRF) funded by the Ministry of Science and ICT (NRF-2019M3A7B9071501).

Data Availability Statement

Not applicable.

Conflicts of Interest

The authors declare no conflict of interest.

References

  1. Miguet, M.; Goetz, V.; Plantard, G.; Jaeger, Y. Removal of a Chlorinated Volatile Organic Compound (Perchloroethylene) from the Aqueous Phase by Adsorption on Activated Carbon. Ind. Eng. Chem. Res. 2015, 54, 9813–9823. [Google Scholar] [CrossRef]
  2. Li, Z.; Jin, Y.; Chen, T.; Tang, F.; Cai, J.; Ma, J. Trimethylchlorosilane modified activated carbon for the adsorption of VOCs at high humidity. Sep. Purif. Technol. 2021, 272, 118659. [Google Scholar] [CrossRef]
  3. Awad, R.; Mamaghani, A.H.; Boluk, Y.; Hashisho, Z. Synthesis and characterization of electrospun PAN-based activated carbon nanofibers reinforced with cellulose nanocrystals for adsorption of VOCs. Chem. Eng. J. 2021, 410, 128412. [Google Scholar] [CrossRef]
  4. Huang, G.; Brook, R.; Crippa, M.; Janssens-Maenhout, G.; Schieberle, C.; Dore, C.; Guizzardi, D.; Muntean, M.; Schaaf, E.; Friedrich, R. Speciation of anthropogenic emissions of non-methane volatile organic compounds: A global gridded data set for 1970–2012. Atmos. Meas. Tech. 2017, 17, 7683–7701. [Google Scholar] [CrossRef] [Green Version]
  5. Hutchison, D.H.; Holden, F.R. An Inventory of Automobile Gases. J. Air Pollut. Control Assoc. 1955, 5, 71–118. [Google Scholar] [CrossRef]
  6. Faith, W.L.; Goodwin, J.T., Jr.; Morriss, F.V.; Bolze, C. Automobile exhaust and smog formation. J. Air Pollut. Control Assoc. 1957, 7, 9–12. [Google Scholar] [CrossRef]
  7. Kotin, P.; Falk, H.L. Atmospheric Factors in Pathogenesis of Lung Cancer. Adv. Cancer Res. 1963, 7, 475–514. [Google Scholar] [CrossRef]
  8. Romagnuolo, L.; Yang, R.; Frosina, E.; Rizzoni, G.; Andreozzi, A.; Senatore, A. Physical modeling of evaporative emission control system in gasoline fueled automobiles: A review. Renew. Sustain. Energy Rev. 2019, 116, 109462. [Google Scholar] [CrossRef]
  9. Yamada, H. Contribution of evaporative emissions from gasoline vehicles toward total VOC emissions in Japan. Sci. Total Environ. 2013, 449, 143–149. [Google Scholar] [CrossRef]
  10. Duffy, B.; Nelson, P.; Ye, Y.; Weeks, I. Speciated hydrocarbon profiles and calculated reactivities of exhaust and evaporative emissions from 82 in-use light-duty Australian vehicles. Atmos. Environ. 1999, 33, 291–307. [Google Scholar] [CrossRef]
  11. Reddy, S. Understanding and Designing Automotive Evaporative Emission Control Systems. SAE Tech. Pap. 2012, 1, 1700. [Google Scholar] [CrossRef]
  12. Lai, J.Y.; Ngu, L.H.; Hashim, S.S.; Chew, J.J.; Sunarso, J. Review of oil palm-derived activated carbon for CO2 capture. Carbon Lett. 2021, 31, 201–252. [Google Scholar] [CrossRef]
  13. Lee, H.-M.; Lee, B.-H.; Kim, J.-H.; An, K.-H.; Park, S.-J.; Kim, B.-J. Determination of the optimum porosity for 2-CEES adsorption by activated carbon fiber from various precursors. Carbon Lett. 2019, 29, 649–654. [Google Scholar] [CrossRef]
  14. Alver, E.; Metin, A. Anionic dye removal from aqueous solutions using modified zeolite: Adsorption kinetics and isotherm studies. Chem. Eng. J. 2012, 200–202, 59–67. [Google Scholar] [CrossRef]
  15. Ng, K.; Chua, H.; Chung, C.; Loke, C.; Kashiwagi, T.; Akisawa, A.; Saha, B. Experimental investigation of the silica gel–water adsorption isotherm characteristics. Appl. Therm. Eng. 2001, 21, 1631–1642. [Google Scholar] [CrossRef]
  16. Lin, T.-F.; Wu, J.-K. Adsorption of Arsenite and Arsenate within Activated Alumina Grains: Equilibrium and Kinetics. Water Res. 2001, 35, 2049–2057. [Google Scholar] [CrossRef]
  17. Lee, H.-M.; Lee, B.-H.; Park, S.-J.; An, K.-H.; Kim, B.-J. Pitch-Derived Activated Carbon Fibers for Emission Control of Low-Concentration Hydrocarbon. Nanomaterials 2019, 9, 1313. [Google Scholar] [CrossRef] [Green Version]
  18. Kim, J.-H.; Lee, H.-M.; Jung, S.-C.; Chung, D.-C.; Kim, B.-J. Bamboo-Based Mesoporous Activated Carbon for High-Power-Density Electric Double-Layer Capacitors. Nanomaterials 2021, 11, 2750. [Google Scholar] [CrossRef]
  19. Lee, H.-M.; Kang, H.-R.; An, K.-H.; Kim, H.-G.; Kim, B.-J. Comparative studies of porous carbon nanofibers by various activation methods. Carbon Lett. 2013, 14, 180–185. [Google Scholar] [CrossRef] [Green Version]
  20. Lee, H.-M.; An, K.-H.; Kim, B.-J. Effects of carbonization temperature on pore development in polyacrylonitrile-based activated carbon nanofibers. Carbon Lett. 2014, 15, 146–150. [Google Scholar] [CrossRef] [Green Version]
  21. Chiang, H.-L.; Chiang, P.; Huang, C. Ozonation of activated carbon and its effects on the adsorption of VOCs exemplified by methylethylketone and benzene. Chemosphere 2002, 47, 267–275. [Google Scholar] [CrossRef] [PubMed]
  22. Meng, F.; Song, M.; Wei, Y.; Wang, Y. The contribution of oxygen-containing functional groups to the gas-phase adsorption of volatile organic compounds with different polarities onto lignin-derived activated carbon fibers. Environ. Sci. Pollut. Res. 2019, 26, 7195–7204. [Google Scholar] [CrossRef] [PubMed]
  23. Kim, J.-H.; Kim, S.-H.; Kim, B.-J.; Lee, H.-M. Effects of Oxygen-Containing Functional Groups on the Electrochemical Performance of Activated Carbon for EDLCs. Nanomaterials 2023, 13, 262. [Google Scholar] [CrossRef]
  24. Zarifyanz, Y.; Kiselev, V.; Lezhnev, N.; Nikitina, O. Interaction of graphite fresh surface with different gases and vapours. Carbon 1967, 5, 127–135. [Google Scholar] [CrossRef]
  25. Menéndez, J.A.; Radovic, L.R.; Xia, B.; Phillips, J. Low-Temperature Generation of Basic Carbon Surfaces by Hydrogen Spillover. J. Phys. Chem. 1996, 100, 17243–17248. [Google Scholar] [CrossRef]
  26. Ahmad, A.A.; Al-Raggad, M.; Shareef, N. Production of activated carbon derived from agricultural by-products via microwave-induced chemical activation: A review. Carbon Lett. 2021, 31, 957–971. [Google Scholar] [CrossRef]
  27. Fernández, Y.; Menéndez, J. Influence of feed characteristics on the microwave-assisted pyrolysis used to produce syngas from biomass wastes. J. Anal. Appl. Pyrolysis 2011, 91, 316–322. [Google Scholar] [CrossRef]
  28. Ren, S.; Lei, H.; Wang, L.; Bu, Q.; Chen, S.; Wu, J.; Julson, J.; Ruan, R. Biofuel production and kinetics analysis for microwave pyrolysis of Douglas fir sawdust pellet. J. Anal. Appl. Pyrolysis 2012, 94, 163–169. [Google Scholar] [CrossRef]
  29. Brunauer, S.; Emmett, P.H.; Teller, E. Adsorption of Gases in Multimolecular Layers. J. Am. Chem. Soc. 1938, 60, 309–319. [Google Scholar] [CrossRef]
  30. Lippens, B. Studies on pore systems in catalysts V. The t method. J. Catal. 1965, 4, 319–323. [Google Scholar] [CrossRef]
  31. American Society for Testing and Materials. ASTM Standard D5228-16; Standard Test Method for Determination of Butane Working Capacity of Activated Carbon. ASTM: West Conshohocken, PA, USA, 1992. Available online: https://scholar.google.com/scholar?hl=ko&as_sdt=0%2C5&scioq=ASTM+D5228&q=D5228-16&btnG= (accessed on 20 February 2023).
  32. Azhagapillai, P.; Al Shoaibi, A.; Chandrasekar, S. Surface functionalization methodologies on activated carbons and their benzene adsorption. Carbon Lett. 2020, 31, 419–426. [Google Scholar] [CrossRef]
  33. Kang, Y.-J.; Jo, H.-K.; Jang, M.-H.; Han, G.-J.; Yoon, S.-J.; Oh, K.; Park, J.-I. Acid treatment enhances performance of beads activated carbon for formaldehyde removal. Carbon Lett. 2022, 33, 397–408. [Google Scholar] [CrossRef]
  34. Pradhan, B.K.; Sandle, N. Effect of different oxidizing agent treatments on the surface properties of activated carbons. Carbon 1999, 37, 1323–1332. [Google Scholar] [CrossRef]
  35. Shim, J.-W.; Park, S.-J.; Ryu, S.-K. Effect of modification with HNO3 and NaOH on metal adsorption by pitch-based activated carbon fibers. Carbon 2001, 39, 1635–1642. [Google Scholar] [CrossRef]
  36. Maldonado, P.S.D.V.; Hernández-Montoya, V.; Concheso, A.; Montes-Morán, M.A. Formation of cerussite and hydrocerussite during adsorption of lead from aqueous solution on oxidized carbons by cold oxygen plasma. Appl. Surf. Sci. 2016, 386, 381–388. [Google Scholar] [CrossRef]
  37. Figueiredo, J.L.; Pereira, M.F.R.; Freitas, M.M.A.; Órfão, J.J.M. Modification of the surface chemistry of activated carbons. Carbon 1999, 37, 1379–1389. [Google Scholar] [CrossRef]
  38. Otake, Y.; Jenkins, R.G. Characterization of oxygen-containing surface complexes created on a microporous carbon by air and nitric acid treatment. Carbon 1993, 31, 109–121. [Google Scholar] [CrossRef]
  39. de la Puente, G.; Pis, J.; Menéndez, J.; Grange, P. Thermal stability of oxygenated functions in activated carbons. J. Anal. Appl. Pyrolysis 1997, 43, 125–138. [Google Scholar] [CrossRef]
  40. Puziy, A.; Poddubnaya, O.; Ziatdinov, A. On the chemical structure of phosphorus compounds in phosphoric acid-activated carbon. Appl. Surf. Sci. 2005, 252, 8036–8038. [Google Scholar] [CrossRef]
  41. Smith, M.; Scudiero, L.; Espinal, J.; McEwen, J.-S.; Garcia-Perez, M. Improving the deconvolution and interpretation of XPS spectra from chars by ab initio calculations. Carbon 2016, 110, 155–171. [Google Scholar] [CrossRef] [Green Version]
  42. Sing, K.S.W. Reporting physisorption data for gas/solid systems with special reference to the determination of surface area and porosity (Recommendations 1984). Pure Appl. Chem. 1985, 57, 603–619. [Google Scholar] [CrossRef]
  43. Choi, S.-W.; Chu, H.-J. Toluene Desorption of Modified Activated Carbon for Microwave Irradiation. J. Environ. Sci. Int. 2011, 20, 223–229. [Google Scholar] [CrossRef] [Green Version]
  44. Zhang, L.; Mi, M.; Li, B.; Dong, Y. Modification of Activated Carbon by Means of Microwave Heating and its Effects on the Pore Texture and Surface Chemistry. Res. J. Appl. Sci. Eng. Technol. 2013, 5, 1836–1840. [Google Scholar] [CrossRef]
  45. Zhang, L.; Cui, L.; Wang, Z.; Dong, Y. Modification of Activated Carbon Using Microwave Radiation and Its Effects on the Adsorption of SO2. J. Chem. Eng. Jpn. 2016, 49, 52–59. [Google Scholar] [CrossRef]
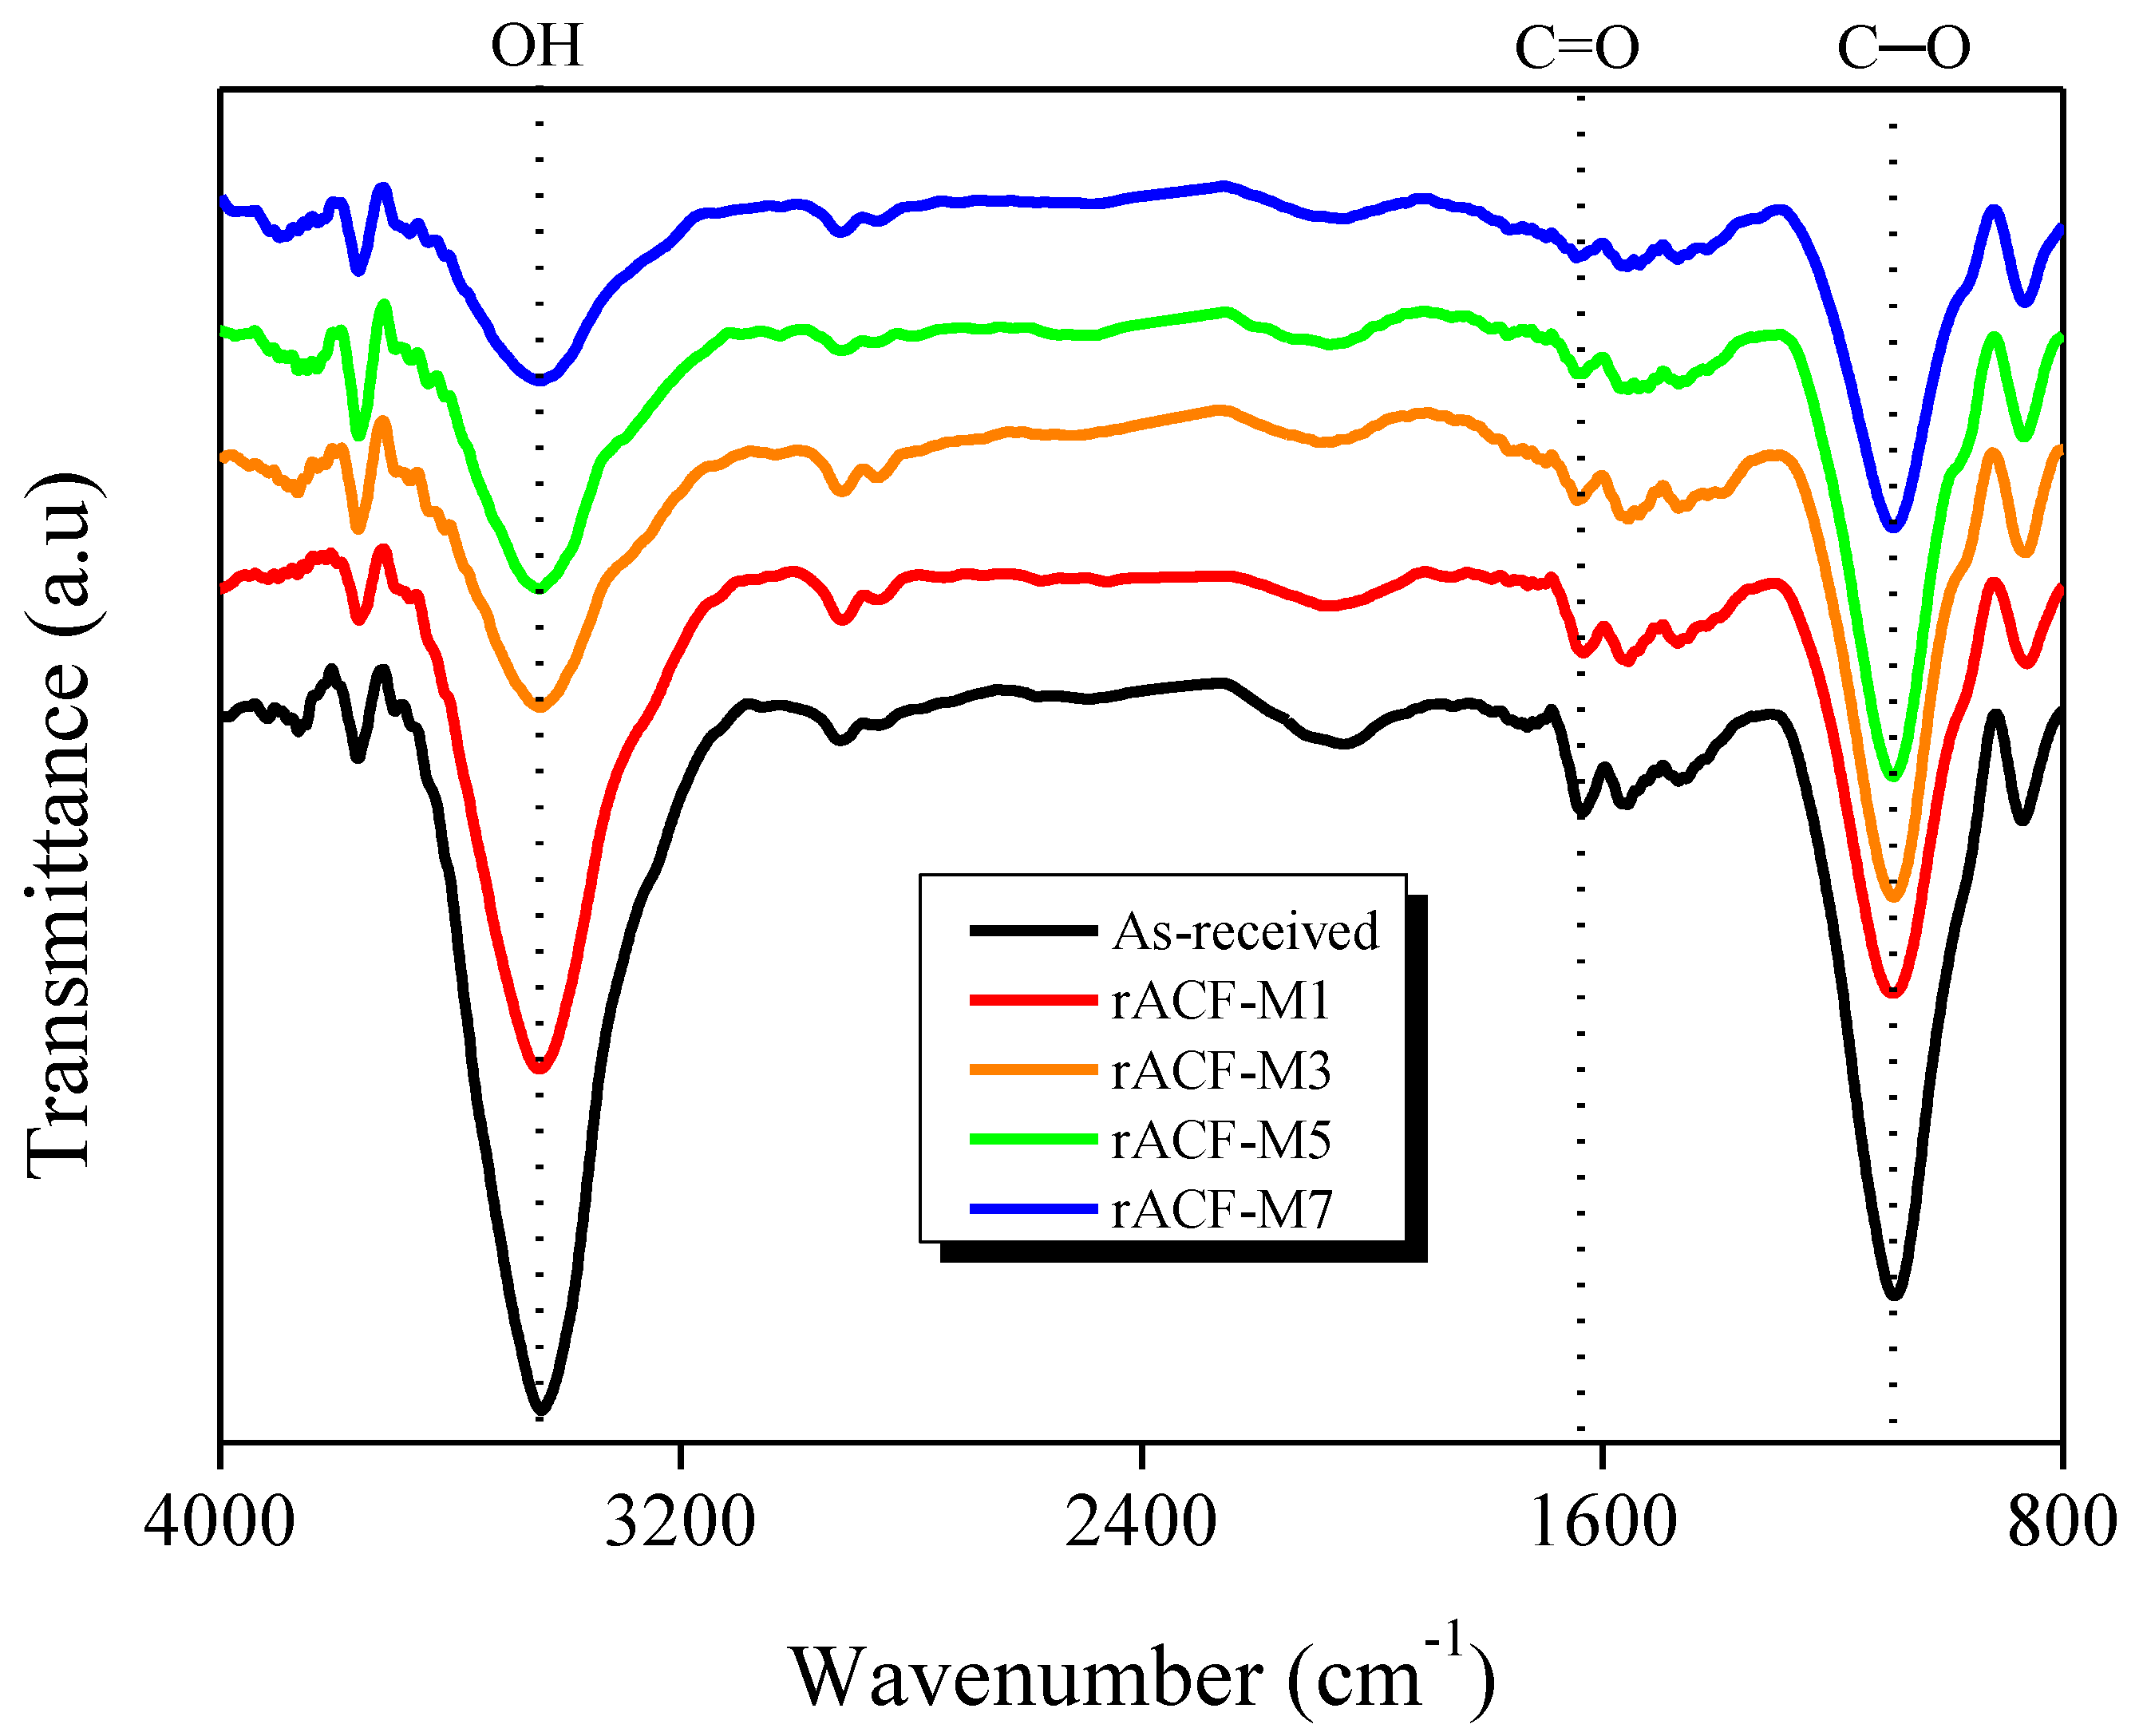
Figure 1. Fourier transform infrared spectroscopy spectra of activated carbon fibers according to the microwave heating time.
Environments 10 00052 g001
Figure 2. Intensity curves of carbon monoxide and carbon dioxide during the pyrolysis of activated carbon obtained through the thermogravimetric analysis–infrared gas analyzer.
Environments 10 00052 g002
Figure 3. X-ray photoelectron spectroscopy survey spectra (a); high-resolution C1S spectra of As-received (b) and rACF-M3 (c); high-resolution O1S spectra of As-received (d) and rACF-M3 (e).
Environments 10 00052 g003
Figure 4. N2/77K adsorption–desorption isotherm of activated carbon fibers according to the microwave heating time.
Environments 10 00052 g004
Figure 5. Five repeated butane adsorption and desorption measurements of activated carbon fibers as a function of the microwave heating time.
Environments 10 00052 g005
Figure 6. Correlations between the butane activity with the specific surface area and total pore volume (a); butane retentivity with specific surface and total pore volume (b); butane activity with a CO and CO2 intensity curve integral area (c); butane retentivity with a CO and CO2 intensity curve integral area (d).
Environments 10 00052 g006aEnvironments 10 00052 g006b
Table 1. Elemental Ratio of Activated Carbon Fibers obtained through Scanning Electron Microscope–Energy Dispersive X-ray Spectroscopy.
SampleC (at.%)O (at.%)O/C
As-received88.010.50.119
rACF-M391.96.70.073
rACF-M792.15.30.058
Table 2. Textural Properties of Activated Carbon Fibers according to the Microwave Heating Time.
SampleSBETVTotalVMicroVMesoMicropore RatioYield
(m2/g)(cm3/g)(cm3/g)(cm3/g)(%)(%)
As-received10900.480.460.0295.8100.0
rACF-M111200.500.470.0394.096.4
rACF-M311100.490.460.0393.994.7
rACF-M511900.540.500.0492.692.2
rACF-M711700.520.480.0492.391.4
SBET: Specific surface area; Brunauer–Emmett–Teller (BET) method; VTotal: Total pore volume; The amount adsorbed P/P0 = 0.99; VMicro: Micropore volume; The pore volume of micropores was calculated by t-plot; VMeso: Mesopore volume; VTotal − VMicro; Micropore ratio: VMicro/VTotal × 100.
Table 3. Butane Adsorption/Desorption Behaviors of Activated Carbon Fibers according to the Microwave Heating Time.
SampleBWC 1BA 2BR 3
(%)(%)(%)
As-received21.8425.673.83
rACF-M124.1729.555.39
rACF-M326.0931.625.53
rACF-M526.1732.236.06
rACF-M725.9832.636.65
1 BWC: butane working capacity; 2 BA: butane activity; 3 BR: butane retentivity.
Disclaimer/Publisher’s Note: The statements, opinions and data contained in all publications are solely those of the individual author(s) and contributor(s) and not of MDPI and/or the editor(s). MDPI and/or the editor(s) disclaim responsibility for any injury to people or property resulting from any ideas, methods, instructions or products referred to in the content.