Abstract
Intertidal reefs of Crassostrea virginica (eastern oyster) provide ecologically valuable habitat in estuaries along the Atlantic coast of North America. In Mosquito Lagoon, a shallow-water estuary on the east coast of central Florida, USA, historical aerial imagery was used to document a 24% decline in the live C. virginica reef area between 1943 and 2009. Using 2021 imagery, every living and dead reef in the same region was manually digitized to identify changes during the intervening 12 years. Positive impacts of C. virginica reef restoration that took place between 2007 and 2021 were also digitized to quantify long-term restoration impact. Natural, live C. virginica reef coverage throughout the system was found to have decreased by 50.6% between 2009 and 2021 and, thus, 62.6% between 1943 and 2021. This was attributed to reef fragmentation, reef footprint loss, boating activity, and mangrove expansion. Of the 2542 live reefs identified using 2009 imagery, 219 reefs fragmented, 988 reefs no longer had an identifiable footprint, and 598 reefs contained visible mangroves with non-continuous canopies. Conservatively, 63.6% of directly restored reef area was classified as living reef in 2021, and 74.5% of restoration projects were more than 50% live reef. Dead reef area decreased by 57.9% throughout the system. Understanding changes in C. virginica reef acreage, reef numbers, and mangrove expansion is essential for resource management, restoration practices, and tracking climate change impacts on publicly protected estuaries.
1. Introduction
The term “habitat fragmentation” can be applied to a range of landscape-scale patterns in which habitat patches become smaller and more isolated [1,2,3]. Habitat fragmentation has been documented across terrestrial and marine habitats, including rainforests, meadows, and seagrass beds [4,5]. This can alter both the services an ecosystem can provide and the community it can support [1,2]. For example, fragmentation in forest habitats around the globe has led to decreased biomass and disrupted nutrient cycling [6], while fragmented smaller vegetative patches in terrestrial marshes have been associated with reduced species diversity [7].
A meta-analysis showed that in marine settings, habitat fragmentation often increases biodiversity [5], although the effects of fragmentation and patch size in these ecosystems are often species and habitat-specific [8]. For example, salt marsh patch size was shown to be positively correlated with fish density [9], but seagrass patch size was not consistently correlated with differences in faunal community structure [10].
Fragmentation changes the ratio of interior to edge habitat, which has potential consequences in habitats where ecosystem pressures vary across a patch. For example, the interior of marsh and seagrass patches appear to have reduced predation rates for snails and scallops, respectively [11,12,13]. This can lead to variation in community structure across a patch. Differences in invertebrate community species composition and abundance have been observed between interior and edge marsh [14,15], and the edges of seagrass beds have been found to have a greater density of fish and crustaceans [16,17]. The effects of edge vs. interior habitat on community composition vary between taxa [18,19].
One important marine ecosystem undergoing fragmentation is shellfish reefs [20]. Shellfish reefs serve as habitats for a variety of fishes and crustaceans [21] and increase water clarity through filter feeding [22]. Globally, shellfish reef area has declined 85% over the last 130 years [23] due to a variety of anthropogenic pressures, including habitat destruction, disease, overharvesting, ocean acidification, and environmental shifts associated with climate change [23,24,25], fragmentation being one feature of this decline.
Fragmentation of Crassostrea virginica (eastern oyster) reefs has been shown to have a variable effect on overall faunal diversity [20,26]. Larger reefs, however, have been associated with increased species richness and density [27]. There also appear to be differences in faunal community structure between the edge reef and interior reef, with the edge reef exhibiting increased benthic macrofaunal diversity [27]. This may be explained by variations in adult oyster density and size across a reef patch [28]. Some studies suggest that more complex oyster reef edges are associated with a greater ratio of fish being found on the reef as opposed to open areas nearby [29]. Due to the many potential consequences of habitat fragmentation, it is crucial that managers know the degree to which it is occurring in foundational habitats, including shellfish reefs.
Crassostrea virginica plays an important role in estuarine and nearshore marine ecosystems along the US Atlantic and Gulf coasts [21,23,30]. In Mosquito Lagoon, the northernmost basin of the Indian River Lagoon (IRL) system along the east coast of central Florida, USA, most C. virginica reefs are intertidal patch reefs ranging from 10–5000 m2 [31]. Live reefs are generally 30 cm or less in height due to local tidal amplitude [32]. The reefs in this system provide habitat to a diverse community of macroinvertebrates, including crabs, shrimp, and marine polychaetes [33]. They also are associated with sport fish making them important to the economy [33,34]. The reefs serve as foraging and nesting grounds for a variety of wading and shorebirds [35,36]. Schafer et al. [36] observed 41 different species utilizing C. virginica reefs. In addition to providing habitat, C. virginica reefs have been shown to protect adjacent marsh and shorelines from erosion by facilitating increased accretion [37,38].
In Mosquito Lagoon, the presence of dead reefs along boating channels suggests that boating activity is facilitating the C. virginica reef area decline [31,39]. In 2016, there were over 102,000 boats registered in counties adjacent to the IRL [40]. According to the state highway safety commission, by 2021, that number had grown to over 107,000, suggesting increased boating activity [41]. Walters et al. [42] demonstrated that boats commonly generate wakes that degrade C. virginica reefs. Waves larger than 2 cm erode sediment from the base of C. virginica clusters, making them vulnerable to displacement. Subsequent wakes move these clusters onto the reef platform, where they perish from exposure and lack of inundation. These are referred to as dead margins [39]. Over time, this process leads to the formation of sun-bleached mounds of disarticulated shells known as dead reefs [42]. Garvis et al. [31] measured the movement of dead reefs toward the shore along boating channels and found that they move away from the boating channels at a rate of 0.86 ± 0.14 m/y.
Although wakes are generated both by boating activity and the wind, in Mosquito Lagoon, reefs are primarily located among a network of mangrove and spoil islands that limit fetch and decrease the overall effect of wind in the system. Furthermore, dead margins are not found on reefs located away from boating channels despite being subject to the same wind conditions [31]. These observations make it less likely that wind-driven wave action plays a substantial role in contributing to reef decline in this system.
Mosquito Lagoon, located in the transition zone of tropical and temperate climate zones, has not experienced a mangrove-killing freeze event since 1989 [43]. Higher minimum winter temperatures have facilitated the widespread colonization of intertidal C. virginica reefs by red mangroves [43,44,45]. The potential ecosystem shift from intertidal reef to mangrove habitat represents an example of tropicalization that could have important consequences regarding the system’s community structure and ecosystem services provided.
C. virginica reef restoration practices have been employed to help recover lost ecosystem services [23,46,47]. Restored reefs have been shown to successfully replicate ecosystem services that natural reefs provide [48]. In Mosquito Lagoon, restoration projects have been implemented along dead reefs throughout the lagoon [31,42]. Here, C. virginica reef restoration is primarily conducted by raking mounds of disarticulated shells down to natural-intertidal elevation and deploying stabilized, recycled oyster shells or cement-plant fiber (jute) structures for recruiting substrate [49]. For reefs with both living and dead areas, only the dead margins were restored.
Cannon et al. [50] measured C. virginica populations on restored reefs at 12 months post-restoration and found that density, mean shell length, and mean canopy height did not significantly differ from populations on nearby reference reefs. Walters et al. [42] found reefs restored in 2007 had C. virginica densities between 922 to 1053 individuals/m2 at thirteen years post-restoration. This suggests that these restoration interventions have relatively long-lasting effects. In addition to being structurally similar to natural reefs, invertebrate communities, avian biodiversity, and biogeochemical measurements on restored reefs were all found to be similar to those of natural reefs within months of restoration [33,35,36,51]. Given the many different methods of restoration being employed by practitioners throughout the country, long-term monitoring is crucial to determine the true success of restoration methods [46].
To understand changes in C. virginica reef coverage in Mosquito Lagoon, Garvis et al. [31] hand-digitized C. virginica reefs using historical aerial imagery on a decadal basis between 1943 and 2009 and observed a 24.1% loss of total live reef coverage. During this time, the area of the dead reef grew from 0.32 ha to 4.3 ha [31]. Updated C. virginica reef maps were needed to determine the system-wide effects of restoration efforts and to calculate overall trends in reef coverage in this estuary of national significance. Using GIS techniques and 2021 aerial photography, this study aimed to accomplish four goals: (1) Update the number and total area of living and dead reefs along with the number of reefs that contain individual mangroves that are not yet part of continuous mangrove stands. (2) Quantify reef fragmentation and survival by comparing individual reef footprints digitized in 2009 and 2021. (3) Determine if factors such as a reef’s size or its exposure to boating activity are associated with increased vulnerability. (4) Digitize restored footprints and assess restoration success. This study will provide resource managers and scientists with valuable insights regarding restoration and long-term management of shallow-water estuaries.
2. Materials and Methods
The Indian River Lagoon system is a series of estuaries spanning 251 km along the east coast of central Florida [40]. Mosquito Lagoon, the northernmost estuary in the system, is characterized by shallow waters (average: 1.5 m) and extended water retention times (Figure 1) [52,53]. It is connected to the ocean at its northern end (Ponce de Leon Inlet) and has no significant freshwater inputs besides rainwater. It has an average salinity of 31.6 ppt with a range of 20–40 ppt [54]. In addition to C. virginica reefs, it contains a variety of nearshore marine habitats, including mangrove wetlands and seagrass beds. [52].
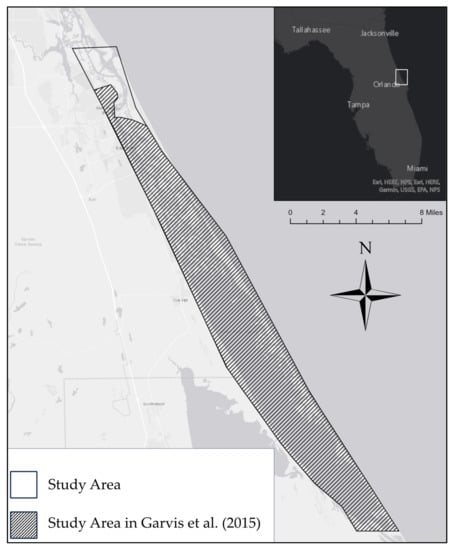
Figure 1.
Map of Mosquito Lagoon with full study area and comparison zone of Garvis et al. [31].
Color infrared imagery (CIR) taken of Mosquito Lagoon in 2021 was provided by St. Johns River Water Management District. Pixel resolution was 0.2 m2, and digitization took place at a scale of ~1:600. Reefs were hand-digitized using ArcGIS Pro (version 2.8.0). The smallest feature created was 0.4 m2. Dead margins and dead reefs were distinguished from live reefs by their lighter coloration and reflection (Figure 2) [31,55]. Similarly to Garvis et al. [31], non-continuous C. virginica clusters were not digitized as reefs. The presence of juvenile mangroves growing in a non-continuous stand was also noted for each digitized feature.
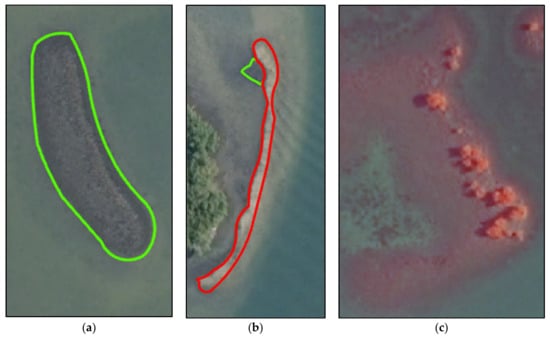
Figure 2.
(a) Digitized live reef; (b) Digitized dead reef (red outline) with small live area (green outline); (c) Juvenile mangroves growing on live reef visible using CIR imagery.
Once the digitization of all reefs in the Mosquito Lagoon using the 2021 imagery was completed, the GIS layer was clipped to the 2009 study area of Garvis et al. [31] (Figure 1). This allowed for a direct comparison of the total area between the two studies. These layers were called “2021 reefs total” and “2021 reefs comparison zone”, respectively. For each 2009 reef, the number and area of overlapping living and dead 2021 reefs were recorded and added to that feature’s data in ArcGIS. Restored reefs and reefs directly bordering partially restored reefs were excluded from this analysis, leaving a total of 2479 reefs analyzed. Overlaps of less than 10% of the total reef area were ignored, as it was assumed that this was an observer error. Instances when two 2009 reefs overlapped with one 2021 reef were explained by methodological differences in digitation. In these cases, the larger 2009 reef was assigned the data of the 2021 reef (this occurred for 1.9% of reefs). All 2009 reefs were coded for whether they were exposed to a primary boating channel. Reefs that were coded as “in a boating channel” were located along the primary boating pathways in Mosquito Lagoon and not shielded by mangrove or spoil islands. This layer was named “2009–2021 comparison”.
To determine long-term restoration success, footprints of all reefs that were restored between 2007 and 2020 were likewise manually digitized in a restored reefs layer. The “2021 reefs total” layer was then clipped to the restored footprint layer, and the amount of live and dead reefs in each restored footprint was recorded. This became the “restored reefs” layer. The amount of living and dead reefs in 2021 were separated by the year in which restoration occurred. The percentage of restored reef area that was still coded as a live reef in 2021 could then be compared on a yearly basis.
Ground-truthing occurred before and after digitization. Preliminary ground-truthing was conducted prior to hand-digitizing by visiting features that were difficult to distinguish using areal imagery. Live reefs were confirmed to appear darker than dead reefs and dead margins, which were sun-bleached. The continuous reef was not observed under mangrove stands with a continuous canopy, so these areas were excluded from digitization. Formal ground truthing, conducted after hand-digitization was complete, was undertaken by checking quality control points. Using the “generate random points” tool in ArcGIS, 60 points were generated for each field category: live reef, dead reef, and non-reef areas (e.g., open water, sandbar). All points were checked for accuracy during the summer of 2022 using a motorboat or kayak. The resulting confusion matrix was then used to calculate a Kappa statistic [56].
All data in the “2021 reefs total”, “2021 reefs comparison zone”, “2009–2021 comparison layer”, and the “restored reefs” layers were then exported from ArcGIS to R studio (version 1.4.1717). The total number and area of living and dead reef was then calculated. The number of reefs with juvenile mangroves was also summed.
Using the “2009–2021 comparison” dataset, two analyses were conducted to determine what factors were associated with a reef being vulnerable to not persisting or fragmenting between 2009 and 2021. Using the “glmmTMB” package [57], binomial generalized linear models (GLMs) with “logit” link functions were generated to predict the probability of a reef’s footprint persisting. Four model options were compared with an Akaike Information Criterion (AIC). (1) Persistence predicted by reef footprint size in 2009, (2) persistence predicted by whether a reef was in a boating channel, (3) persistence predicted by both variables, (4) persistence predicted by both variables and an interaction. The fourth model had the lowest AIC, so it was chosen. The same approach was taken for the second analysis: predicting a reef’s probability of fragmenting between 2009 and 2021. Four binomial GLMs using the same independent variables as the first analysis were compared with AIC. The first, third, and fourth models all had similar AIC scores, so the fourth was chosen to allow direct comparison to the first analysis. The two chosen models were then used to generate probability curves.
3. Results
3.1. Ground-Truthing
Of the 180 random points generated for formal ground-truthing post-digitizing, 15 were inaccessible and thus discarded. This resulted in a slight variation in the number of points between differently coded areas. Live reef points were correctly coded 49/56 times (87.5%), dead reef points were correctly coded 55/59 times (93.2%), and non-reef points were correctly coded 100% of the time (50/50). Errors occurred when algae-covered dead reefs were mistaken for live reefs, and sand bars were mistaken for dead reefs. The accuracy of random points was used to calculate a Kappa statistic of 0.90; this is considered “almost perfect agreement” [56]. The map layer created by Garvis et al. [31] had a Kappa score of 0.97, indicating that both maps used for this study closely matched the landscape they portrayed. Because the materials used for C. virginica reef restoration change the aerial signature of the reef, every restored reef that was coded as more than 50% dead in 2021 was checked independently from natural reefs.
3.2. 2021 Reef Analysis and Comparison
A total of 3244 live reefs covering 25.96 ha and 230 dead reefs covering 1.81 ha were digitized using imagery from 2021 (Table 1). Within the study area used by Gavis et al. [31], 2668 live reefs covering 22.87 ha were digitized (Table 1) (Figure 2). This represents an increase of 5% in the number of live reefs and a 50.6% decrease in the total live reef area between 2009 and 2021 (Table 1). The yearly rate of loss increased between 2009 and 2020 relative to between 1943 and 2020 (Figure 3). The total number of dead reefs decreased by 6.9% (17), and the total dead reef area decreased by 57.9% (Table 1). 16.8% (545) of the lagoon’s live reefs had one or more juvenile mangroves growing on them (Table 1).

Table 1.
C. virginica reef statistics of study area produced with 2009 aerial photographs by Garvis et al. [31] compared to our results (comparison zone) and full study area (GIS layers used: “2021 reefs total” and “2021 reefs comparison zone”).

Figure 3.
Total percent loss in live reef area relative to 1943 using imagery from 1943, 1951, 1967, 1971, 1984, 1995, 2006, 2009, and 2021 (Garvis et al. [31]; this study). Mean annual percentage change between points is shown in parentheses.
Of the 2479 reefs digitized by Garvis et al. [31] using 2009 images, 40% (988) were not visible in 2021 images even though the water level was low, waters were clear, and intertidal reefs were fully exposed (Table 2). Moreover, 34.5% (856) of reefs decreased in size by at least 50%. Only 8% (198) of reefs digitized using 2009 images stayed within 20% of their original area by 2021 (Table 2), and 8.8% (219) of the reefs fragmented into multiple reefs by 2021 (Table 3). When fragmented, the average number of fragmented reefs created was 2.7 (Table 3). Moreover, 34.7% (76) of reefs that fragmented were split into at least 3 separate reefs, and the maximum number of reefs created was 14 (Table 3).
Table 2.
Analysis of reefs 2009 reefs digitized by Garvis et al. [31] compared to reefs digitized using 2021 imagery (GIS layer used: “2009–2021 comparison”).
Table 3.
Analysis of individual reef fragmentation between 2009 and 2021.
Binomial GLMs were used to model the probability of a reef having a measurable footprint in 2021 based on its area in 2009, whether or not the reef was located in a primary boating channel, and the interaction of the two variables. Reef size in 2009 was found to be significantly positively correlated with the probability of having a measurable footprint in 2021 (Table 4). The interaction between size and location was also statistically significant, as the effect of being in a boating channel decreased the probability of persistence of medium-sized reefs (~200–700 m2) (Table 4). Smaller reefs had lower probabilities of persistence regardless of location.
Table 4.
Summary of binomial GLM predicting the probability of a reef’s footprint persisting in 2021 based on its size in 2009 and whether it was located in a primary boating channel.
A similar approach was used to predict the probability of a reef fragmenting between 2009 and 2021 based on its size in 2009 and location. Larger reefs were significantly more likely to fragment, but the effect of being in a boating channel was not statistically significant (Table 5). The two models were used to generate probability curves (Figure 4).
Table 5.
Summary of binomial GLM predicting the probability of a reef fragmenting by 2021 based on its size in 2009 and whether it was located in a boating channel.
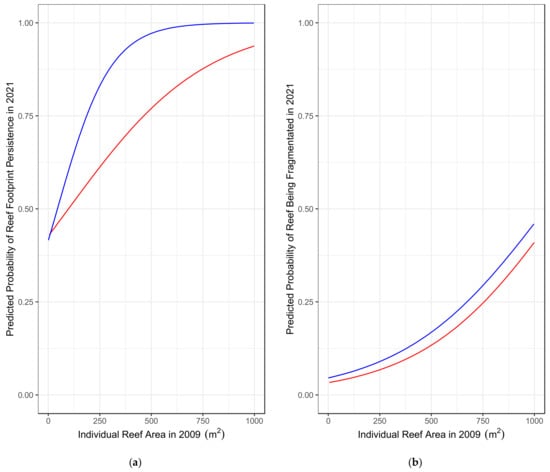
Figure 4.
Probability curves predicted using binomial GLMs. The blue line represents reefs located away from primary boating channels, and the red line represents reefs located along primary boating channels. (a) Probability of a reef being fragmented in 2021 based on its area in 2009 and whether it is located along a primary boating channel (b) Probability of a reef having an identifiable footprint in 2021 based on its area in 2009 and whether it is located along a primary boating channel. (a) Red = Exposed to Primary Boating Channel. (b) Blue = Not Exposed to Primary Boating Channel.
3.3. Restored Reef Analysis and Ground Truthing
Between 2007 and 2020, a total of 1.03 ha across 94 reefs were restored by community volunteers (Table 6). Of this total area, 0.655 ha (63.6%) was digitized as living reef and 0.07 ha (6.8%) was coded as dead reef using 2021 imagery (Table 6). The remaining 29.6% did not have a recognizable footprint.
Table 6.
Analysis of restored intertidal C. virginica reefs in Mosquito Lagoon by year (“restored reefs” GIS layer).
Overall, 74.5% of restored reefs retained at a minimum half of their restored live reef footprint in 2021. All of the restored reefs that had less than 50% of their area classified as living reefs were checked. Of these 24 reefs, 8 (33%) were still mostly living, with some areas now being shallow subtidal as determined by the composition of the fouling communities. This indicates that the classifications of restored reef survival are conservative and underestimate success.
4. Discussion
To compare shellfish habitat loss between different systems, Beck et al. [23] designated four categories of decline. When compared to the earliest documented historical coverages, systems in “good” condition lost less than 50% of their reef area, systems in “fair “condition lost 50–89%, systems in poor condition lost 90–99%, and any system with more than 99% loss had reefs that were “functionally extinct”. Between 1943 and 2009, Garvis et al. [31] documented a 24% loss in live reef areas suggesting the system’s reefs were classified as being in “good” condition. Using the updated digitized reefs created in this study, between 1943 and 2021, the live reef area declined by 62.6%. According to the designations from Beck et al. [23], Mosquito Lagoon’s C. virginica reef health dropped to “fair” during the past 12 years. Notably, the annual rate of reef loss (4.22%) appears to have increased during the last 12 years relative to 1943–2009 (Figure 3).
One important source of total reef area loss is the apparent disappearance of smaller reefs. The footprints of reefs that were smaller (<~250 m2) in 2009 were less likely to persist in 2021 (Figure 4), indicating that they were more vulnerable to disturbances. Because the interaction of size and location was significant, reefs of equal sizes were less likely to be present if they were located along a primary boating channel. This was particularly true in medium size reefs (~200–700 m2). For example, a reef that was 250 m2 in 2009 had a ~82% chance of being identifiable in 2021 if it was located away from a boating channel but only a ~62% chance of being identifiable if it was located along a primary boating channel (Figure 4). These findings support previous studies that suggest that boat traffic can negatively impact C. virginica reef survival in this shallow-water estuary and that this pressure increased between 2009 and 2021 [31,39,42].
Despite the apparent disappearance of 988 individual reefs and a 50.6% decline in live reef area between 2009 and 2021, the number of live reefs in the Garvis et al. [31] study region increased by 126 (4.7%) (Table 1). We determined that reef fragmentation contributed to these seemingly incongruous results (Table 2 and Table 3). Almost 9% of all reefs fragmented, and our model suggests that larger reefs were more likely to fragment (Figure 4). A reef’s location relative to a primary boating channel did not affect its likelihood to fragment. This indicates that pressures causing fragmentation are present throughout the system. Because of this fragmentation and loss of total area, the average reef size shrunk from 182.3 m2 in 2009 to 85.7 m2 in 2021. Fragmentation and the increased vulnerability of smaller reefs may have a compounding effect. As the average reef size in the system shrinks, the results of this study suggest that the average reef size is becoming increasingly vulnerable. In this way, fragmentation indirectly decreases a reef’s probability of persisting. This fits with the standard ecological theory that suggests that smaller, more isolated habitats are inherently more vulnerable to stochastic events [58].
Harwell et al. [20] found that small amounts of C. virginica reef fragmentation did not affect species diversity but suggested that once a threshold amount of habitat loss was reached (~50%), species diversity and abundance significantly dropped. Our results show that 856 reefs (34.3%) lost at least 50% of their area between 2009 and 2021, indicating that on an individual level, they may not be providing the same quality habitat. There is also evidence that suggests that the detrimental effects of habitat fragmentation are greatest when they include a loss in total habitat area [1]. This is an important nuance as this study documents both individual reef fragmentation and system-scale habitat loss.
Another factor potentially contributing to the loss of total reef area was widespread mangrove expansion (Rhizophora mangle, Avicenna germinans) onto C. virginica reefs [43,44,45]. Because we found a few C. virginica clusters growing underneath continuous mangrove stands (Figure 5c), this study chose to focus on isolated mangroves with non-continuous canopies as a proxy for future expansion (Figure 5c). Throughout Mosquito Lagoon, 16.8% of live reefs had one or more isolated mangroves growing on them in 2021, indicating that there may be almost 600 reefs in the early stages of mangrove expansion (Table 1). Mangrove expansion begins when a mangrove takes root in a reef. As it grows, it traps sediment and buries the reef below. Eventually, it may cover the entire footprint of the reef (Figure 5). McClenachan et al. [43] reported a 103% increase in mangrove cover on C. virginica reefs in Mosquito Lagoon between 1943 and 2017.
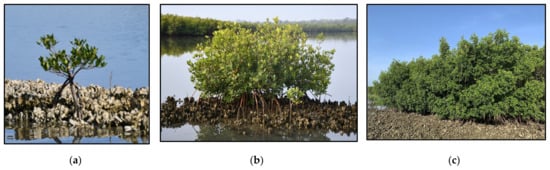
Figure 5.
Stages of mangrove expansion onto intertidal C. virginica reef. (a) Juvenile pioneer mangrove growing on intact reef; (b) Mangrove stand growing on sediment surrounded by reef; (c) Mangrove island surrounded by fringing reef (photos by LJW and E. Suchonic).
This example of tropicalization has been documented in coastal ecosystems in Florida to the south of Mosquito Lagoon. In Thousand Islands National Park on the Gulf Coast of southern Florida, the many small mangrove islands that are found in the park are believed to have been formed on top of oyster reefs ~3500 years ago [59]. More recently, in Tampa Bay, Hesterberg et al. [45] examined 82 years of aerial photography between 1938 and 2020 and found that 83% of oyster reefs without any mangroves at the start of the study converted to mangrove islands during this time period. This process took between 10 and 30 years per reef.
Following this pattern in Tampa Bay [45] at a similar latitude to Mosquito Lagoon, we predict that the 7.45 hectares of live reef that currently host juvenile mangroves growing in non-continuous stands will convert to continuous mangrove stand within the next 30 years. This is likely a substantial underestimate as many more reefs in Mosquito Lagoon will potentially experience initial mangrove recruitment during this time. Only temperatures below the colonizing species’ threshold (−4.0 °C for R. mangle, −6.6 °C for A. germinans) will limit this regime shift [43].
Mangrove shading, reef disappearance, shrinkage, and fragmentation may exacerbate differences in methodology between GIS practitioners, potentially creating inconsistencies between studies. After extensive preliminary ground truthing, this study excluded continuous mangrove stands in its reef digitization. Some of these stands, however, were counted as continuous C. virginica cover in the layer created by Garvis et al. [31]. This discrepancy in the analysis may be one source of the difference in total reef coverage. Furthermore, expanded mangrove coverage could also have shaded measurable areas of fringing C. virginica reef growing along mangrove islands, further reducing the total digitized area in 2021. Phenomena such as shading and fragmentation obfuscate reef footprints making the digitization and analysis of features in a GIS more complex. Slight differences in the interpretation of these footprints by GIS practitioners may then be compounded over thousands of observations. While this phenomenon likely occurred in the comparison between this study and Garvis et al. [31], the similarity in the number and location of digitized reefs, along with the high degree of accuracy from both ground-truthing procedures, indicate that the overall methodologies were similar and that the key environmental trends identified in this study are occurring.
This study found that reef areas that were directly restored, meaning that they were covered in restoration materials, consistently survived regardless of when they were established (Table 4). In total, restoration has directly created 0.655 hectares of reef still living in 2021 (Table 4), and 74.5% of restored footprints were more than 50% live reef area in 2021. Subsequent ground truthing found that 8 of the 24 reefs that appeared more than half dead were actually healthy. This was likely due to the effect of restoration materials on the aerial signature as well as reef subsidence. These totals are, therefore, conservative and likely underestimate success. Unlike the number of live reefs, which increased by 5%, the number of dead reefs in the comparison zone decreased by 6.9%, providing evidence of positive system-wide effects of restoration efforts.
While 0.655 hectares of restored reef represents only 2.5% of the Lagoon’s total live reef area (25.96 ha) (Table 1), this analysis of directly restored areas does not include the potential effects of restoration taking place off of the restored footprint. Walters et al. [42] examined these “off-footprint” restoration effects and found that between 2010 and 2020, C. virginica density adjacent to, but off the restoration footprint of reefs restored in 2007, doubled. This was attributed to the reduced presence of disarticulated C. virginica shell, increased sediment stabilization, and improved wave energy absorption. If the local effects of C. virginica reef restoration extend beyond restored footprints, then C. virginica reef restoration has affected substantially more than the 1.03 hectares that were directly restored in this system.
Prior studies in Mosquito Lagoon have shown that on an individual reef scale, restored reef C. virginica densities, heights, and biotic communities were similar to those of natural reefs [35,42,50,51]. By documenting long-term survival, this GIS-based assessment supports these field-based findings on a system-wide scale. This study’s findings suggest that despite successful restoration efforts and a 57.9% reduction in dead reef areas, the live reef area continues to decline (Figure 3). Continual improvements to reef management and restoration strategies are therefore required. Due to the observed increased resilience of larger reefs and the long-term survival of directly restored footprint, this study recommends that further research focus on using restoration techniques to combine fragmented reefs. Connecting live reef patches may create a more resilient habitat over the long term than the restoration of multiple smaller reefs.
5. Conclusions
This study found that in 2021 live intertidal C. virginica reef coverage in Mosquito Lagoon decreased by 50.6% since 2009 and 62.6% since 1943. This decrease was attributed to the disappearance of smaller reef footprints, fragmentation of larger reefs, and mangrove expansion via tropicalization onto reefs throughout the system. Smaller reefs were shown to be more vulnerable to boating activity. The potential shrinking average size of reefs (182.3 m2 in 2009 to 85.7 m2 in 2021) suggests the negative effects of boating activity persist. The abundance of reefs with juvenile mangroves that do not yet form a continuous stand (598) suggests that many reefs are likely in the early stage of transitioning into mangrove stands/islands. Individual reef restoration outcomes demonstrate long-term success, and restoration was identified as an important tool for offsetting the degradation of natural reefs. This study highlights the necessity of repeated mapping of important C. virginica reef areas, as well as the need to standardize the delineation of oyster reefs in the face of environmental processes that make their footprints increasingly difficult to define.
Author Contributions
Conceptualization, G.W.B., M.J.D., P.E.S. and L.J.W.; methodology, G.W.B., M.J.D., P.E.S. and L.J.W.; software, G.W.B., M.J.D., P.E.S. and L.J.W.; validation, G.W.B., P.E.S. and L.J.W.; formal analysis, G.W.B.; investigation, G.W.B.; resources, M.J.D. and L.J.W.; data curation, G.W.B.; writing—original draft preparation, G.W.B.; writing—review and editing, M.J.D., P.E.S. and L.J.W.; visualization, G.W.B.; supervision, M.J.D. and L.J.W.; project administration, M.J.D. and L.J.W.; funding acquisition, M.J.D. and L.J.W. All authors have read and agreed to the published version of the manuscript.
Funding
This research was funded through the Indian River Lagoon National Estuary Program and the University of Central Florida.
Data Availability Statement
The 2021 Reefs GIS layer is available on the University of Central Florida STARS data repository (https://stars.library.ucf.edu/, accessed on 25 May 2023).
Acknowledgments
We thank Canaveral National Seashore for access to field sites and St. Johns River Water Management District for access to aerial photography. We also thank K. Lewis and S. Garvis for their assistance with GIS.
Conflicts of Interest
The authors declare no conflict of interest.
References
- Li, D.; Yang, Y.; Xia, F.; Sun, W.; Li, X.; Xie, Y. Exploring the influences of different processes of habitat fragmentation on ecosystem services. Landsc. Urban Plan. 2022, 227, 104544. [Google Scholar] [CrossRef]
- Fahrig, L. Effects of Habitat Fragmentation on Biodiverstiy. Annu. Rev. Ecol. Evol. Syst. 2003, 34, 487–515. [Google Scholar] [CrossRef]
- Lindenmayer, D.B.; Fischer, J. Tackling the habitat fragmentation panchreston. Trends Ecol. Evol. 2007, 22, 127–132. [Google Scholar] [CrossRef] [PubMed]
- Debinski, D.M.; Holt, R.D. A Survey and Overview of Habitat Fragmentation Experiments. Conserv. Biol. 2000, 14, 342–355. [Google Scholar] [CrossRef]
- Yeager, L.A.; Estrada, J.; Holt, K.; Keyser, S.R.; Oke, T.A. Are Habitat Fragmentation Effects Stronger in Marine Systems? A Review and Meta-analysis. Curr. Landsc. Ecol. Rep. 2020, 5, 58–67. [Google Scholar] [CrossRef]
- Haddad, N.M.; Brudvig, L.A.; Clobert, J.; Davies, K.F.; Gonzalez, A.; Holt, R.D.; Lovejoy, T.E.; Sexton, J.O.; Austin, M.P.; Collins, C.D.; et al. Habitat fragmentation and its lasting impact on Earth’s ecosystems. Sci. Adv. 2015, 1, e1500052. [Google Scholar] [CrossRef]
- Werner, K.J.; Zedler, J.B. How Sedge Meadow Microtopography, and Vegetation Respond to Sedimentation. Wetlands 2002, 22, 451–466. [Google Scholar] [CrossRef]
- Carroll, J.M.; Keller, D.A.; Furman, B.T.; Stubler, A.D. Rough Around the Edges: Lessons Learned and Future Directions in Marine Edge Effects Studies. Curr. Landsc. Ecol. Rep. 2019, 4, 91–102. [Google Scholar] [CrossRef]
- Meyer, D.L.; Posey, M.H. Influence of Salt Marsh Size and Landscape Setting on Salt Marsh Nekton Populations. Estuaries Coasts 2014, 37, 548–560. [Google Scholar] [CrossRef]
- Bell, S.S.; Brooks, R.A.; Robbins, B.D.; Fonseca, M.S.; Hall, M.O. Faunal response to fragmentation in seagrass habitats: Implications for seagrass conservation. Biol. Conserv. 2001, 100, 115–123. [Google Scholar] [CrossRef]
- Lewis, D.B.; Eby, L.A. Spatially heterogeneous refugia and predation risk in intertidal salt marshes. Oikos 2002, 96, 119–129. [Google Scholar] [CrossRef]
- Carroll, J.M.; Peterson, B.J. Ecological trade-offs in seascape ecology: Bay scallop survival and growth across a seagrass seascape. Landsc. Ecol. 2013, 28, 1401–1413. [Google Scholar] [CrossRef]
- Carroll, J.M.; Furman, B.T.; Tettelbach, S.T.; Peterson, B.J. Balancing the edge effects budget: Bay scallop settlement and loss along a seagrass edge. Ecology 2012, 93, 1637–1647. [Google Scholar] [CrossRef]
- Novak, C.S. Benthic Community Development on Edge Vs. Interior of Created Salt Marshes. Ph.D. Thesis, University of North Carolina Wilmington, Chapel Hill, NC, USA, 2011. [Google Scholar]
- Whaley, S.D.; Minello, T.J. The Distribution of Benthic Infauna og a Texas Salt Marsh in Relation to the Marsh Edge. Wetlands 2002, 22, 753–766. [Google Scholar] [CrossRef]
- Smith, T.M.; Hindell, J.S.; Jenkins, G.P.; Connolly, R.M. Edge effects on fish associated with seagrass and sand patches. Mar. Ecol. Prog. Ser. 2008, 359, 203–213. [Google Scholar] [CrossRef]
- Tanner, J.E. Edge effects on fauna in fragmented seagrass meadows. Austral Ecol. 2005, 30, 210–218. [Google Scholar] [CrossRef]
- Eggleston, D.B.; Elis, W.E.; Etherington, L.L.; Dahlgren, C.P.; Posey, M.H. Organism responses to habitat fragmentation and diversity: Habitat colonization by estuarine macrofauna. J. Exp. Mar. Biol. Ecol. 1999, 236, 107–132. [Google Scholar] [CrossRef]
- Eggleston, D.B.; Etherington, L.L.; Elis, W.E. Organism response to habitat patchiness: Species and habitat-dependent recruitment of decapod crustaceans. J. Exp. Mar. Biol. Ecol. 1998, 223, 111–132. [Google Scholar] [CrossRef]
- Harwell, H.D.; Posey, M.H.; Alphin, T.D. Landscape aspects of oyster reefs: Effects of fragmentation on habitat utilization. J. Exp. Mar. Biol. Ecol. 2011, 409, 30–41. [Google Scholar] [CrossRef]
- Coen, L.D.; Luckenbach, M.W.; Breitburg, D.L. The role of oyster reefs as essential fish habitat: A review of current knowledge and some new perspectives. Am. Fish. Soc. Symp. 1999, 22, 438–454. [Google Scholar]
- Grizzle, R.E.; Greene, J.K.; Coen, L.D. Seston Removal by Natural and Constructed Intertidal Eastern Oyster (Crassostrea virginica) Reefs: A Comparison with Previous Laboratory Studies, and the Value of in situ Methods. Estuaries Coasts 2008, 31, 1208–1220. [Google Scholar] [CrossRef]
- Beck, M.W.; Brumbaugh, R.D.; Airoldi, L.; Carranza, A.; Coen, L.D.; Crawford, C.; Defeo, O.; Edgar, G.J.; Hancock, B.; Kay, M.C.; et al. Oyster Reefs at Risk and Recommendations for Conservation, Restoration, and Management. Bioscience 2011, 61, 107–116. [Google Scholar] [CrossRef]
- Kyzar, T.; Safak, I.; Cebrian, J.; Clark, M.W.; Dix, N.; Dietz, K.; Gittman, R.K.; Jaeger, J.; Radabaugh, K.R.; Roddenberry, A.; et al. Challenges and opportunities for sustaining coastal wetlands and oyster reefs in the southeastern United States. J. Environ. Manag. 2021, 296, 113178. [Google Scholar] [CrossRef] [PubMed]
- Rothschild, B.J.; Ault, J.S.; Goulletquer, P.; Héral, M. Decline of the Chesapeake Bay oyster population: A century of habitat destruction and overfishing. Mar. Ecol. Prog. Ser. 1994, 111, 29–39. [Google Scholar] [CrossRef]
- Hanke, M.H.; Posey, M.H.; Alphin, T.D. Spatial Dynamics of Two Host-Parasite Relationships on Intertidal Oyster Reefs. Diversity 2021, 13, 260. [Google Scholar] [CrossRef]
- Hanke, M.H.; Posey, M.H.; Alphin, T.D. The effects of intertidal oyster reef habitat characteristics on faunal utilization. Mar. Ecol. Prog. Ser. 2017, 581, 57–70. [Google Scholar] [CrossRef]
- Hanke, M.H.; Posey, M.H.; Alphin, T.D. The influence of habitat characteristics on intertidal oyster Crassostrea virginica populations. Mar. Ecol. Prog. Ser. 2017, 571, 121–138. [Google Scholar] [CrossRef]
- Griffitt, J.; Posey, M.; Alphin, T. Effects of Edge Fragmentatiion on Oyster Reef Utilization by Transient Nekton. J. Elisha Mitchell Sci. Soc. 1999, 115, 98–103. [Google Scholar]
- Grabowski, J.H.; Brumbaugh, R.D.; Conrad, R.F.; Keeler, A.G.; Opaluch, J.J.; Peterson, C.H.; Piehler, M.F.; Powers, S.P.; Smyth, A.R. Economic Valuation of Ecosystem Services Provided by Oyster Reefs. Bioscience 2012, 62, 900–909. [Google Scholar] [CrossRef]
- Garvis, S.K.; Sacks, P.E.; Walters, L.J. Formation, Movement, and Restoration of Dead Intertidal Oyster Reefs in Canaveral National Seashore and Mosquito Lagoon, Florida. J. Shellfish Res. 2015, 34, 251–258. [Google Scholar] [CrossRef]
- Walters, L.J.; Sacks, P.E.; Bobo, M.Y.; Richardson, D.L.; Coen, L.D. Impact of Hurricanes and Boar Wakes on Intertidal Oyster Reefs in the Indian River Lagoon: Reef Profiles and Disease Prevalence. Fla. Sci. 2007, 70, 506–521. [Google Scholar]
- Searles, A.R.; Gipson, E.E.; Walters, L.J.; Cook, G.S. Oyster reef restoration facilitates the recovery of macroinvertebrate abundance, diversity, and composition in estuarine communities. Sci. Rep. 2022, 12, 8163. [Google Scholar] [CrossRef] [PubMed]
- Loch, J.M.H.; Walters, L.J.; Donnelly, M.L.; Cook, G.S. Restored Coastal Habitat Can “Reel In” Juvenile Sportfish: Population and Community Responses in the Indian River Lagoon, Florida, USA. Sustainability 2021, 13, 12832. [Google Scholar] [CrossRef]
- Copertino, J.L.; Harris, K.; Chute, L.; Walters, L.J. Impact of Oyster (Crassostrea virginica) Reef Restoration on Benthic Invertebrates and Coastal Birds in a Subtropical Estuary. Sustainability 2022, 14, 2371. [Google Scholar] [CrossRef]
- Shaffer, M. Does Intertidal Oyster Reef Restoration Affect Avian Community Structure and Behavior in a Shallow Estuarine System? A Post-Restoration Analysis. Fla. Field Nat. 2019, 47, 37–59. [Google Scholar]
- Meyer, D.L.; Townsend, E.C.; Thayer, G.W. Stabilization and Erosion Control Value of Oyster Cultch for Intertidal Marsh. Restor. Ecol. 1997, 5, 93–99. [Google Scholar] [CrossRef]
- McClenachan, G.M.; Donnelly, M.J.; Shaffer, M.N.; Sacks, P.E.; Walters, L.J. Does size matter? Quantifying the cumulative impact of small-scale living shoreline and oyster reef restoration projects on shoreline erosion. Restor. Ecol. 2020, 28, 1365–1371. [Google Scholar] [CrossRef]
- Grizzle, R.E.; Adams, J.R.; Walters, L.J. Historical changes in intertidal oyster (Crassostrea virginica) reefs in a Florida lagoon potentially related to boating activities. J. Shellfish Res. 2002, 21, 749–756. [Google Scholar]
- One Lagoon. Looking Ahead to 2030: A 10-Year Comprehensive Conservation Managment Plan for the Indian River Lagoon, Florida; One Lagoon: Sebastian, FL, USA, 2019. [Google Scholar]
- Vessel Owner Statistics. Available online: https://www.flhsmv.gov/motor-vehicles-tags-titles/vessels/vessel-owner-statistics/ (accessed on 23 May 2023).
- Walters, L.J.; Sacks, P.E.; Campbell, D.E. Boating impacts and boat-wake resilient restoration of the eastern oyster Crassostrea virginica in Mosquito Lagoon, Florida, USA. Fla. Sci. 2021, 84, 173–199. [Google Scholar]
- McClenachan, G.; Witt, M.; Walters, L.J. Replacement of oyster reefs by mangroves: Unexpected climate-driven ecosystem shifts. Glob. Change Biol. 2021, 27, 1226–1238. [Google Scholar] [CrossRef]
- Walters, L.J.; McClenachan, G. Commentary on Osland et al.: Tropicalization of temperate ecosystems in North America: The northward range expansion of tropical organisms in response to warming winter temperatures. Glob. Change Biol. 2021, 27, 3006–3008. [Google Scholar] [CrossRef] [PubMed]
- Hesterberg, S.G.; Jackson, K.; Bell, S.S. Climate drives coupled regime shifts across subtropical estuarine ecosystems. Proc. Natl. Acad. Sci. USA 2022, 119, e2121654119. [Google Scholar] [CrossRef] [PubMed]
- Howie, A.H.; Bishop, M.J. Contemporary Oyster Reef Restoration: Responding to a Changing World. Front. Ecol. Evol. 2021, 9, 689915. [Google Scholar] [CrossRef]
- Reeves, S.E.; Renzi, J.J.; Fobert, E.K.; Silliman, B.R.; Hancock, B.; Gillies, C.L. Facilitating Better Outcomes: How Positive Species Interactions Can Improve Oyster Reef Restoration. Front. Mar. Sci. 2020, 7, 656. [Google Scholar] [CrossRef]
- Coen, L.D.; Brumbaugh, R.D.; Bushek, D.; Grizzle, R.; Luckenbach, M.W.; Posey, M.H.; Powers, S.P.; Tolley, S.G. Ecosystem services related to oyster restoration. Mar. Ecol. Prog. Ser. 2007, 341, 303–307. [Google Scholar] [CrossRef]
- Nitsch, C.K.; Walters, L.J.; Sacks, J.S.; Sacks, P.E.; Chambers, L.G. Biodegradable Material for Oyster Reef Restoration: First-Year Performance and Biogeochemical Considerations in a Coastal Lagoon. Sustainability 2021, 13, 7415. [Google Scholar] [CrossRef]
- Cannon, D.; Kibler, K.; Walters, L.; Chambers, L. Hydrodynamic and biogeochemical evolution of a restored intertidal oyster (Crassostrea virginica) reef. Sci. Total Environ. 2022, 831, 154879. [Google Scholar] [CrossRef]
- Chambers, L.G.; Gaspar, S.A.; Pilato, C.J.; Steinmuller, H.E.; McCarthy, K.J.; Sacks, P.E.; Walters, L.J. How Well Do Restored Intertidal Oyster Reefs Support Key Biogeochemical Properties in a Coastal Lagoon? Estuaries Coasts 2018, 41, 784–799. [Google Scholar] [CrossRef]
- Provancha, J.A.; Hall, C.R.; Oddy, D.M. Mosquito Lagoon Environmental Resources Inventory; National Aeronautics and Space Administration: Washington, DC, USA, 1992. [Google Scholar]
- Smith, N.P. Tidal and Nontidal Flushing of Florida’s Indian River Lagoon. Estuaries 1993, 16, 739–746. [Google Scholar] [CrossRef]
- Johnson, D.R.; Funicelli, N.A.; Bohnsack, J.A. Effectiveness of an Existing Estuarine No-Take Fish Sanctuary within the Kennedy Space Center, Florida. North Am. J. Fish. Manag. 1999, 19, 436–453. [Google Scholar] [CrossRef]
- Garvis, S.; Donnelly, M.; Hernandez, E.; Walters, L.; Weishampel, J.; Brockmeyer, R. Remote sensing of live and dead intertidal oyster reefs using aerial photo interpretation in Northeast Florida. J. Coast. Conserv. 2020, 24, 14. [Google Scholar] [CrossRef]
- Viera, A.J.; Garrett, J.M. Understanding interobserver agreement: The kappa statistic. Fam. Med. 2005, 37, 360–363. [Google Scholar] [PubMed]
- Brooks, M.E.; Kristensen, K.; Benthem, K.J.v.; Magnusson, A.; Berg, C.W.; Nielsen, A.; Skaug, H.J.; Mächler, M.; Bolker, B.M. glmmTMB Balances Speed and Flexibility Among Packages for Zero-inflated Generalized Linear Mixed Modeling. R J. 2017, 9, 378. [Google Scholar] [CrossRef]
- Laurance, W.F. Theory meets reality: How habitat fragmentation research has transcended island biogeographic theory. Biol. Conserv. 2008, 141, 1731–1744. [Google Scholar] [CrossRef]
- Parkinson, R.W. Decelerating Holocene sea-level rise and its influence on Southwest Florida coastal evolution; a transgressive/regressive stratigraphy. J. Sediment. Petrol. 1989, 59, 960–972. [Google Scholar] [CrossRef]


Disclaimer/Publisher’s Note: The statements, opinions and data contained in all publications are solely those of the individual author(s) and contributor(s) and not of MDPI and/or the editor(s). MDPI and/or the editor(s) disclaim responsibility for any injury to people or property resulting from any ideas, methods, instructions or products referred to in the content. |
© 2023 by the authors. Licensee MDPI, Basel, Switzerland. This article is an open access article distributed under the terms and conditions of the Creative Commons Attribution (CC BY) license (https://creativecommons.org/licenses/by/4.0/).