1. Introduction
Termites are persistent insect pests that damage wood in service, including wood flooring, load-bearing wooden structures of buildings, and rail foundation supports such as railroad ties and bridge trusses. Damage may result in the structural collapse and failure of wooden buildings and supporting frameworks. There are three major types of termites in the U.S., including drywood, dampwood, and subterranean termites. Drywood termites build above-ground nests in dry, sound wood. Dampwood species tend to nest in moist, decaying wood and build tunnels to extend into drier wood. However, subterranean termites typically nest in the soil and make mud tubes to reach wood substrates above ground. Most U.S. economic losses due to termites are caused by subterranean species. Annual property damage due to subterranean termites and costs for the prevention, treatment, and repairs of termite damage were estimated to be at least USD 11 billion [
1]. The financial value of annual property damaged by termites is over USD 40 billion worldwide [
2]. Termites may also cause significant damage to urban trees, resulting in structural failures of the main trunk or limbs of trees, which may fall and cause major damage to homes, buildings, and automobiles, as well as injuries to pedestrians and animals in parks and on sidewalks. Certain subterranean species, such as the Formosan termite (
Coptotermes formosanus), cause significant damage to wood structures but are also capable of causing serious human health hazards due to the release of toxic gas air pollutants (particularly naphthalene) into living spaces of indoor environments.
Termites have important ecological roles as decomposers that facilitate the carbon and nutrient cycling of course wood debris in forested ecosystems. They interact in association with wood decay fungi to compete for woody substrates and often cause the synergistic degradation and decomposition of coarse woody debris, tree heartwood, and woody materials on the forest floor. Four subterranean species are the most economically important in the southern United States:
Coptotermes formosanus,
Reticulitermes flavipes,
R. hageni, and
R. virginicus. The Formosan termite,
C. formosanus, is a non-native invasive species first introduced into the U.S. in the 1950s at ports of entry in Houston, Texas, and New Orleans, Louisiana, but it subsequently spread to all U.S. states except for Alaska [
3,
4].
The effective management and control of subterranean termite populations that cause damage to wood in forested ecosystems and in building structures is often based on species-specific control methods. The rapid and accurate detection and identification of termite species is necessary to select appropriate methods for individual pest control situations. The identification of destructive termite species also is essential for assessing economic and ecological impacts and currently relies predominantly on a combination of morphological taxonomic keys, various DNA genetic methods, and cuticular hydrocarbon (CHC) profiling [
5]. The morphological separation of species is particularly difficult using taxonomic keys to North American species based on soldier and alate caste morphology, yet workers are often the only samples available for collection [
6]. The usefulness of taxonomic keys for
Reticulitermes species identification is further confounded by morphological plasticity within species, resulting in a wide range of geographical phenotypes found in diverse environments when comparing specimens from both allopatric and local sympatric colony collections [
7]. Proper identification is also complicated by interspecific variation, causing considerable overlapping ranges for many taxonomic characters. Taxonomic keys need to be revised to resolve ambiguity about species identities and to accommodate newly described species [
7,
8,
9].
DNA sequencing has been used successfully and consistently to identify termite species because all genetic methods may be applied to any caste, including morphologically indistinct workers [
10,
11]. Szalanski et al. [
12] developed a restriction fragment length polymorphism (RFLP) method to distinguish between four
Reticulitermes species (
R. flavipes,
R. hageni,
R. tibialis, and
R. virginicus) using two restriction enzymes on the 16S and COII mitochondrial DNA (mtDNA) genes. This protocol was revised and updated by Garrick et al. [
13] using three restriction enzymes on a single mtDNA gene (COII). Some eastern species of
Reticulitermes have been identified through the sequencing of species-specific inter-simple sequence repeats (ISSRs) from PCR-amplify regions of 130 and 350 bp DNA between identical microsatellite regions [
5]. The ISSR method has frequently been employed for population genetic studies of vertebrates, fungi, and many insects, including termites [
14,
15]. This ISSR method has not been useful in distinguishing between western
Reticulitermes species and invasive species. Genetic data from molecular techniques that lack taxonomic support have often confused the interpretation of
Reticulitermes species definitions in the literature [
7]. However, DNA analyses are not feasible for most commercial pest-control applications due to very large sampling requirements, high costs, and time-consuming, multistep DNA procedures necessary for species determinations.
Cuticular hydrocarbons (CHCs) of termites have been investigated extensively for taxonomic determinations to identify species and lineages [
9,
16,
17,
18,
19]. However, variations in CHC profiles between colonies and species sometimes have been difficult to distinguish [
20]. Page et al. [
18] separated termites into three major lineages, characterized by different primary methyl-branched or unsaturated hydrocarbon components. Species-specific mixtures of CHCs define various chemical phenotypes within a species based on the predominant classes of hydrocarbons present in their CHC profiles. Nevertheless, all
Reticulitermes phenotypes synthesize n-alkanes, such as 2- and 3-methylalkanes, and have internally branched monomethylalkanes in common, but they produce variable quantities of alkenes, dienes, trienes, dimethyl- and trimethylalkanes [
18,
21]. Various types of species-specific pheromones, including aggregation, alarm, soldier, trail-following, and sex-pairing pheromones have been used to distinguish termites into chemical groups [
22,
23].
A variety of methods have been tested previously for termite detection within wooden structures, such as optical borescopes, acoustic emission devices, radar, and canine detection using trained dogs [
24,
25,
26,
27,
28]. Most earlier work involved extensive studies on the use of acoustic wave monitoring devices to detect the sounds and activities of termites within wood and to detect voids in wood caused by termite consumption [
29]. None of these methods are useful alone in identifying the termite species present.
The invention of multisensory electronic-nose (e-nose) technologies in the late 1980s provided new tools for identifying and characterizing both living and dead organic samples based on their unique volatile organic compound (VOC) emissions [
30]. The more recent development of e-nose devices with applications focused on the detection and identification of agricultural and forest insect and disease pests has introduced new approaches and alternatives for pest recognition necessary for the timely implementation of effective pest control measures [
31]. There are several important logistical advantages of using e-nose devices for pest detection and identification. These devices have the capability of low-cost sensing of readily detectable VOCs that emanate from target pests concealed within wood or plant substrata. Another significant advantage is that e-nose devices have a wide dynamic sensing range, good accuracy, precision (reproducibility), and cross-reactive sensor arrays for detecting VOCs from many diverse chemical classes [
31]. Pest-specific VOC smellprint signatures may be used to identify insect pest species without the need to identify individual VOCs present among sample analytes [
30]. The identification of target pest species is essential for effective termite control due to significant variations in termite biology and quarantine regulations. Portable e-nose devices may be used in field situations, particularly in combination with lightweight aerial drone technologies in remote locations [
32]. The more sophisticated dual-technology e-nose devices also have chemical analysis capabilities for identifying individual VOCs present in air samples. Some identified VOCs have been strongly correlated with the presence of specific pest species and may therefore be used as chemical biomarkers for the identification of specific pests [
33,
34].
Previous investigations have provided evidence for the efficacy of using e-nose gas-sensing devices for the detection of insect pests in agricultural crops, tree plantations, urban and public forests, and commercial forest trees. Many studies have utilized e-noses to detect damaging insects at various stages of agricultural food production. Henderson et al. [
35] used a portable C320 carbon black polymer composite e-nose to detect stinkbugs in cotton. Wu et al. [
36] detected beetle infestations in stored wheat grains with a 12-metal oxide semiconductor (MOS) FOX-3000 e-nose. Wilson et al. [
33] developed a dual-technology method based on gas chromatography (GC) combined with MOS e-nose sensory technologies for the early detection of emerald ash borer (EAB),
Agrilus planipennis infestations in green ash (prior to symptom development) and identified VOC chemical biomarkers specific to healthy ash and EAB-infested trees. Recently, the early detection of aphid infestations in wheat was accomplished by Fuentes et al. [
37] using a low-cost e-nose in combination with near-infrared spectroscopy. Similarly, Cui et al. [
38] detected whitefly infestations of tomato plants in a greenhouse using a portable e-nose device.
The earliest studies that tested gas-sensing e-nose devices for termite detection utilized only three types of tin oxide MOS gas sensors to detect the most common and abundant gases (methane, hydrogen, and carbon dioxide) emitted from termite colonies [
39]. The use of only three sensors in the sensor array, specifically selected with each sensor to target only single gases (CH
4, H
2, and CO
2), did not constitute the definition of a modern e-nose system that generally has many more sensors in the sensor array designed to detect a wide variety of VOCs from different chemical classes. Consequently, this initial approach was only intended to detect the presence of termites, not to identify them to species for pest management applications.
The current study reports on the development of improved nondestructive, electronic methods for detecting, monitoring, and identifying subterranean termite species destructive to wood in the environment and wood in service. A very brief preliminary report of initial study results was published previously [
40]. The development of this CP e-nose technology is based on the detection of unique mixtures of VOC metabolites released from the whole bodies of termites into sampled air headspace. The objectives of this study were to develop and test the efficacy of using this e-nose VOC-detection device for the: (1) rapid detection of four subterranean termite species within wood (i.e.,
Coptotermes formosanus,
Reticulitermes flavipes,
R. hageni, and
R. virginicus); (2) simultaneous identification of these species based on differences in whole-body volatile emissions derived from small aggregate samples; and (3) determination of whether the e-nose detection of termite-specific volatiles is an effective alternative method for improved termite detection (noninvasively) of individual species which is required for best management of these pests within wood in service.
2. Materials and Methods
The subterranean termite specimens were analyzed by anatomical characters utilized in conventional methods for species identification using taxonomic keys, and by chemical e-nose detection with the capability of identifying samples by detecting differences in sensor array responses to volatile components (VOC metabolites) released from their bodies in sample headspace. Comparisons of effective identification methods were necessary to evaluate ways to improve the detection of existing termite infestations without structural damage to wood in service. This initial study was for proof-of-concept testing to evaluate differences in termite smells from different species based on differences in the VOC composition of volatile emissions from small aggregate termite samples.
2.1. Termite Collections
A minimum of 50 termites (workers and soldiers) were collected from individual sympatric termite colonies derived from infested wood or nests at four field locations within Oktibbeha County, near Tombigbee National Forest, in east-central Mississippi. No collections of allopatric colonies were made from widely distant geographical locations (as defined in
Appendix A). Each colony was given a unique colony number designation as an identifier for statistical analyses. The two-letter colony designations were based on four collection locations (sites) from which separate termite colonies of each species were sampled, designated as follows: BH = Bluff Hill, DOR = Dorman Lake, KTA = Keaton Tower Area, and NX = Noxubee River, which are landmarks (roads or rivers) within or near the John W. Starr Memorial Forest. The number following the location letter designation indicates the specific colony number at the indicated location. Termite individuals of
Reticulitermes flavipes were collected from four field locations, including fourteen colonies, with the following designated code numbers: BH-1, BH-3, BH-6, BH-9, BH-21, BH-27, DOR-2, DOR-3, DOR-4, DOR-8, DOR-6, KTA, NX-3, and NX-14. Termite samples of
Reticulitermes virginicus were collected from three field locations, consisting of nine colonies, designated: BH-2, BH-7, BH-8, BH-18, BH-19, BH-20, BH-28, NX-2, and DOR-7. Samples of
Reticulitermes hageni were obtained from three field locations and consisted of nine colonies, designated: BH-4, BH-5, BH-10, BH-11, BH-12, BH-24, BH-26, DOR-5, and KTB. Individuals of the non-native, invasive species
Coptotermes formosanus were collected from a laboratory colony reared on wood substrates within a quarantine facility to prevent accidental release into native southern forests. The identities of all e-nose-analyzed termite colonies were tentatively identified by using morphological keys (of soldier termites) and confirmed by genetic analysis of reference specimens, based on the sequencing of a 685 bp fragment of the COII mitochondrial gene (mtDNA), as described previously [
41,
42].
2.2. Termite Morphological Measurements
Morphological data of body dimensions, including the head capsule plus the mandible lengths (mm) and pronotum widths (mm), were recorded for soldier individuals collected from each colony for the three Reticulitermes species investigated. This data provided a range of measurements of these phenotypic characters for comparing taxonomic traits used to distinguish Reticulitermes species and showing the relative sizes of these species. Significant overlaps exist in the measurements of these characters among geographically separated colonies, which increases the difficulty of distinguishing morphologically similar species without genetic tests. In addition to physical measurements, photographs were taken of mandible structures of representative termite specimens collected from each field colony for further comparisons of the phenotypic traits used in conventional taxonomic keys for species identification.
2.3. Termite Storage Prior to VOC Emissions Analysis
Live worker and soldier individuals of each species, collected from separate colonies, were stored in the dark within a refrigerator maintained at 4 °C prior to e-nose analysis. Colony samples of separate termite species were placed between multiple separated layers of corrugated cardboard pieces (derived from clean corrugated boxes) and stored within separate 90 mm glass Petri dishes sealed with Parafilm (Bemis Corp. Inc., Neenah, WI, USA).
2.4. Electronic-Nose Instrument
Electronic-nose analyses of headspace volatiles derived from termite VOC emissions were conducted with a commercially available Aromascan A32S (Osmetech, Inc., Wobum, MA, USA) e-nose instrument fitted with a conducting polymer (CP) 32-sensor array with a constant 15 volts maintained across individual sensor paths. Initial pilot test results indicated that several sensors did not contribute significantly to species discrimination. The sensors that did not provide significant contributions toward the discrimination of termite volatiles were turned off, including sensors 11, 12, 21–26, and 30–32. Consequently, 21 separate sensors (i.e., 1–10, 13–20, and 27–29) were used in all whole-body VOC-emission analyses of termites.
Preliminary tests of A32S e-nose sensor chemical sensitivities were performed previously to determine the sensor output responses and sensitivities of the individual 32 sensors to specific chemical classes of VOCs, with sensor results reported by Wilson et al. [
43]. The sensitivity of individual sensors in the sensor array was tested individually based on relative output responses to representative organic compounds from nine chemical classes. The response sensitivities of individual sensors were measured as a percentage of electrical resistance changes (%∆R/Rbase) in response to the adsorption of VOCs to the sensor surfaces. The sensitivity of individual sensors varied with the types of plastic polymers (polypyrrole, polyanaline, or polythiophene) used in the sensor matrix coating. In addition, ring substitutions of functional groups on the plastic polymer monomer units modify its conductive properties, and certain metal ions are used to dope the matrix to improve and modulate sensor response. The detection limits of the instrument varied with different chemical classes of volatile components present in the sample headspace. A32S e-nose sensors were generally more sensitive to amines and sulfur-containing compounds. Highly polar compounds like carboxylic acids tended to bind to some sensors, causing negative sensor responses in some cases.
2.5. Termite Sample Preparation and Instrument Prerun Procedures
Fifteen live termite individuals per colony within each Petri dish were removed from refrigeration, randomly selected as samples for each known species using sterile forceps, and placed into 14.8 mL capped glass sample vials for separate whole-body VOC-emissions analysis. Glass vials containing termite samples were uncapped immediately prior to analysis and placed into a 500 mL glass sampling bottle. The sampling bottle was fitted with reference air, sampling, and exhaust ports at the top of a polypropylene bottle cap. The sampling bottle was placed into the e-nose sampling chamber, and the internal air temperature of the sampling chamber was held at a constant 25 °C.
Filtered and humidity-controlled reference air entered the sampling bottle through a 3 mm polypropylene tube extending to just above the bottom of the sampling bottle. Input reference air was strictly controlled, with internal relative humidity adjustments set to 4.0 ± 0.5% RH, maintained significantly below that of room air, which was held at 25 °C. Prior to building the sample headspace, the sampling bottle was purged with filtered, moisture-conditioned reference air for 2 min. The reference air and exhaust ports on the sampling bottle were sealed to allow volatiles from the termite sample to build headspace and equilibrate for 30 min prior to each analysis run. The sampling bottle cap and exhaust ports were opened between analysis runs to purge the previous sample from the sampling bottle using conditioned and filtered reference air before running the next sample.
2.6. Instrument Configuration and Run Parameters
The sensor array block temperature was maintained at a constant 30 °C. Reference air was preconditioned prior to humidity control and introduction into the sampling bottle by passing room air sequentially through a carbon filter, silica gel beads, an inline filter, and an HEPA filter to remove VOC contaminants, excess moisture, solid particulates, and microbes. The flow rate of sample air into the sampling bottle was maintained at 702 mL/min using a calibrated ADM 3000 flow meter (Agilent Technologies, Wilmington, DE, USA). The sensors within the array were purged between runs using vapor from a 2% isopropanol wash solution. The e-nose instrument was interfaced with a personal computer via an RS232 cable, controlled with Aromascan (version 3.51) software. The instrument plumbing was configured for the static sampling of the headspace. This was accomplished by allowing reference air to flow out of the external vent port of the instrument during analytical runs instead of into the sampling bottle. The exhaust port on the sampling bottle was closed so that headspace volatiles were removed from a homogeneous static air mass within the sampling bottle.
2.7. Data Acquisition Parameters and Run Schedules
Sensor array data were collected at 1 s intervals using a 0.2 detection threshold (y units) and a 15- to 20-y-max graph scale. Sensor data of response patterns were averaged from five data slices recorded per run during the data acquisition period. A fixed analysis run schedule (one valve sequence) consisted of purging with conditioned reference air for 20 s; sampling acquisition for 90 s; washing sensors with 2% isopropanol vapor for 20 s; and a 90 s reference air purge, for a total run time of 220 s. A 2 min reference air purge followed by a 30 min equilibration period was allowed between runs.
2.8. Construction of Reference Libraries and Data Validation
A reference library consisting of a recognition file (databases), created from COII genetically identified reference specimens for each of the four termite species analyzed, was constructed using neural-net training by defining termite aroma classes using reference databases of known species. The termite reference library, composed of recognition files for all termite species, was constructed by first running e-nose analyses of known samples of each termite species. All database files derived from the sample analysis of known reference termite species were linked to specific (designated) aroma classes for each sample type. The following neural-network training parameters were used for each training session: training threshold = 0.60, recognition threshold = 0.60, number of elements allowed in error = 5, learning rate = 0.10, momentum = 0.60, error goal = 0.010 (p ≤ 0.01), hidden nodes = 5, and maximum iterations (epochs) = 10,000, using normalized input data, not raw sensor output data. A typical neural-net training session normally requires 2 to 35 min, depending on the size of the database applied. Neural-net trainings were validated by examining training results compared to database files of each aroma class. Similarity matches were used to determine aroma class distributions (percentages) among all aroma classes included in the neural-net training. The recognition files in the reference library were then used to discriminate the identities of unknown double-blind termite samples.
2.9. Identification of Termite Unknowns Using Recognition Files
A reference library containing species-specific reference databases (recognition files), created from neural-net training of sensor outputs in response to VOC emissions from known termite species, was used to identify unknown termite samples from colony field collections. Neural-net pattern-recognition algorithms compared the response pattern of the unknown samples with databases of known species found in the reference library. The recognition algorithms quickly determined the best match that most closely fit the aroma characteristics found in the unknown sample. The closeness of the match was expressed as a percentage value assigned to different aroma classes represented in the sample. A value greater than 95% was considered a good identity match. The neural-net training algorithm could be set to determine differences between sample types at any level of statistical significance based on the duration of the training session. A significance level of 0.05 or lower was used in the current application to discriminate between termites at the species level.
2.10. Instrument Reliability in Species Identifications
The reliability of the A32S instrument termite species determinations of unknown samples was tested with double-blind tests. A separate random selection of 15 termite individuals from individual colonies were labeled with colony number designations so that each unknown sample was run blindly without knowledge of the species identities. Unknown analyzed samples were later determined to be either correctly identified, not identified (indeterminate), incorrectly identified, or ambiguously identified (with more than one identification). Determinations falling outside of the domain of defined aroma classes were recorded as unknown. Ambiguous determinations resulted when different sensor output pattern responses to colony specimens from termite colonies were different when collected from different geographical locations.
2.11. Data Processing and Statistical Evaluations
Data collected from the A32S e-nose array for each termite species were assembled collectively and used to construct sensor response (smellprint) patterns from separate analyses and for statistical comparisons of the volatile composition of termite VOC emissions using principal component analysis (PCA).
2.11.1. Smellprint Signatures
Aroma signature (smellprint) patterns for each termite species or aroma class (descriptors) were reported from calculated means (±1 standard deviation of the mean) of raw relative resistance sensor output values from 10 replicate runs of each aroma class. Real-time determinations of sample unknowns utilized recognition files with normalized sensor intensity responses and pattern-recognition algorithms.
2.11.2. Principal Component Analysis
A score plot of e-nose data derived from the analysis of VOC emissions from termite species was created from the e-nose 32-sensor array, consisting of data clusters from the four sample types (termite aroma classes) defined by each species of subterranean termites. The score plot was statistically determined using PCA provided by the Aromascan (version 3.51) analysis software. This software did not have the capability of providing reportable matrix output data for PCA or to limit the number of PCs (using a specified threshold value). Therefore, pre-score matrix data was not reported. Comparisons of relatedness of termite aroma classes were illustrated in the score plot to distinguish between differences in VOC composition of headspace volatiles released from Reticulitermes and Coptotermes species. Score plot parameters used for plotting data with PCA were as follows: iterations = 30, units in Eigenvalues (%), and normalized input data. The input e-nose data were obtained from the analysis of field colonies (i.e., samples of unknown identity prior to confirmation by separate genetic analysis and morphological keys), which were compared to the e-nose reference library databases of each termite species created from known (genetically identified) reference specimens and used as data to develop the correlation matrix.
2.11.3. Quality Factor Analysis
Pairwise comparisons of chemical relatedness between headspace volatiles of non-native Coptotermes formosanus and three southern native Reticulitermes species aroma classes were based on PCA. Quality factor (QF) statistical values, based on mean plot distances between data clusters on the score plot, were calculated to determine differences in levels of chemical relatedness between VOC emissions of termite species for each pairwise comparison. The statistical significance of QF values for each pairwise comparison was determined at different levels, ranging from p < 0.05 to p < 0.0001. The quality factor analysis (QFA) statistical algorithm works in association with PCA analysis and the score plots by providing a quantitative statistical measure of relatedness between the VOC composition of termite emissions. The QFA algorithm considers data plot spatial distributions of data clusters of each sample type. The numerical value of calculated mean plot distances between data clusters of sample types (in each pairwise comparison) was statistically evaluated to indicate the level of significant differences determined at different levels of statistical probability depending on the magnitude of the QF value determined in each pairwise comparison.
3. Results
The comparison of morphological data and measurements for four subterranean termite species provided indications of the range of dimensions of conventional phenotypic taxonomic characters used for the identification of these species. Chemical data derived from the electronic-nose analysis of termite VOC emissions were added to obtain and evaluate different information that could be used to identify termite species.
3.1. Subterranean Termite Measurements
Measurements of head capsule and pronotum widths of 15 termite soldier individuals from colonies of 3
Reticulitermes species provided data on morphological variations in these physical traits for each species. The measurements showed great similarities in the gross physical appearances (sizes and shapes) and phenotypic range of characteristics among
Reticulitermes species, which contributed significantly to the difficulty of distinguishing between species based on morphological characteristics, as indicated in
Table 1. Although the measurements of head capsules and pronotum widths were similar among species, there were significant, although not readily obvious, differences in the range of mean measures. The data suggest that there is an overall trend of size differences for head capsules and pronotum measurements among species in the dimensional relative size order of
R. flavipes >
R. virginicus >
R. hageni, with each species in the order sequence being slightly larger than the previous species and with
R. flavipes being the largest. These size differences are not palpable without taking mean measurements for each species due to the wide variation in the range of measurements within each species. Thus, identifications based on gross morphological traits and physical measures are only tentative and often lack certainty without additional corroborative molecular data based on DNA sequence analyses.
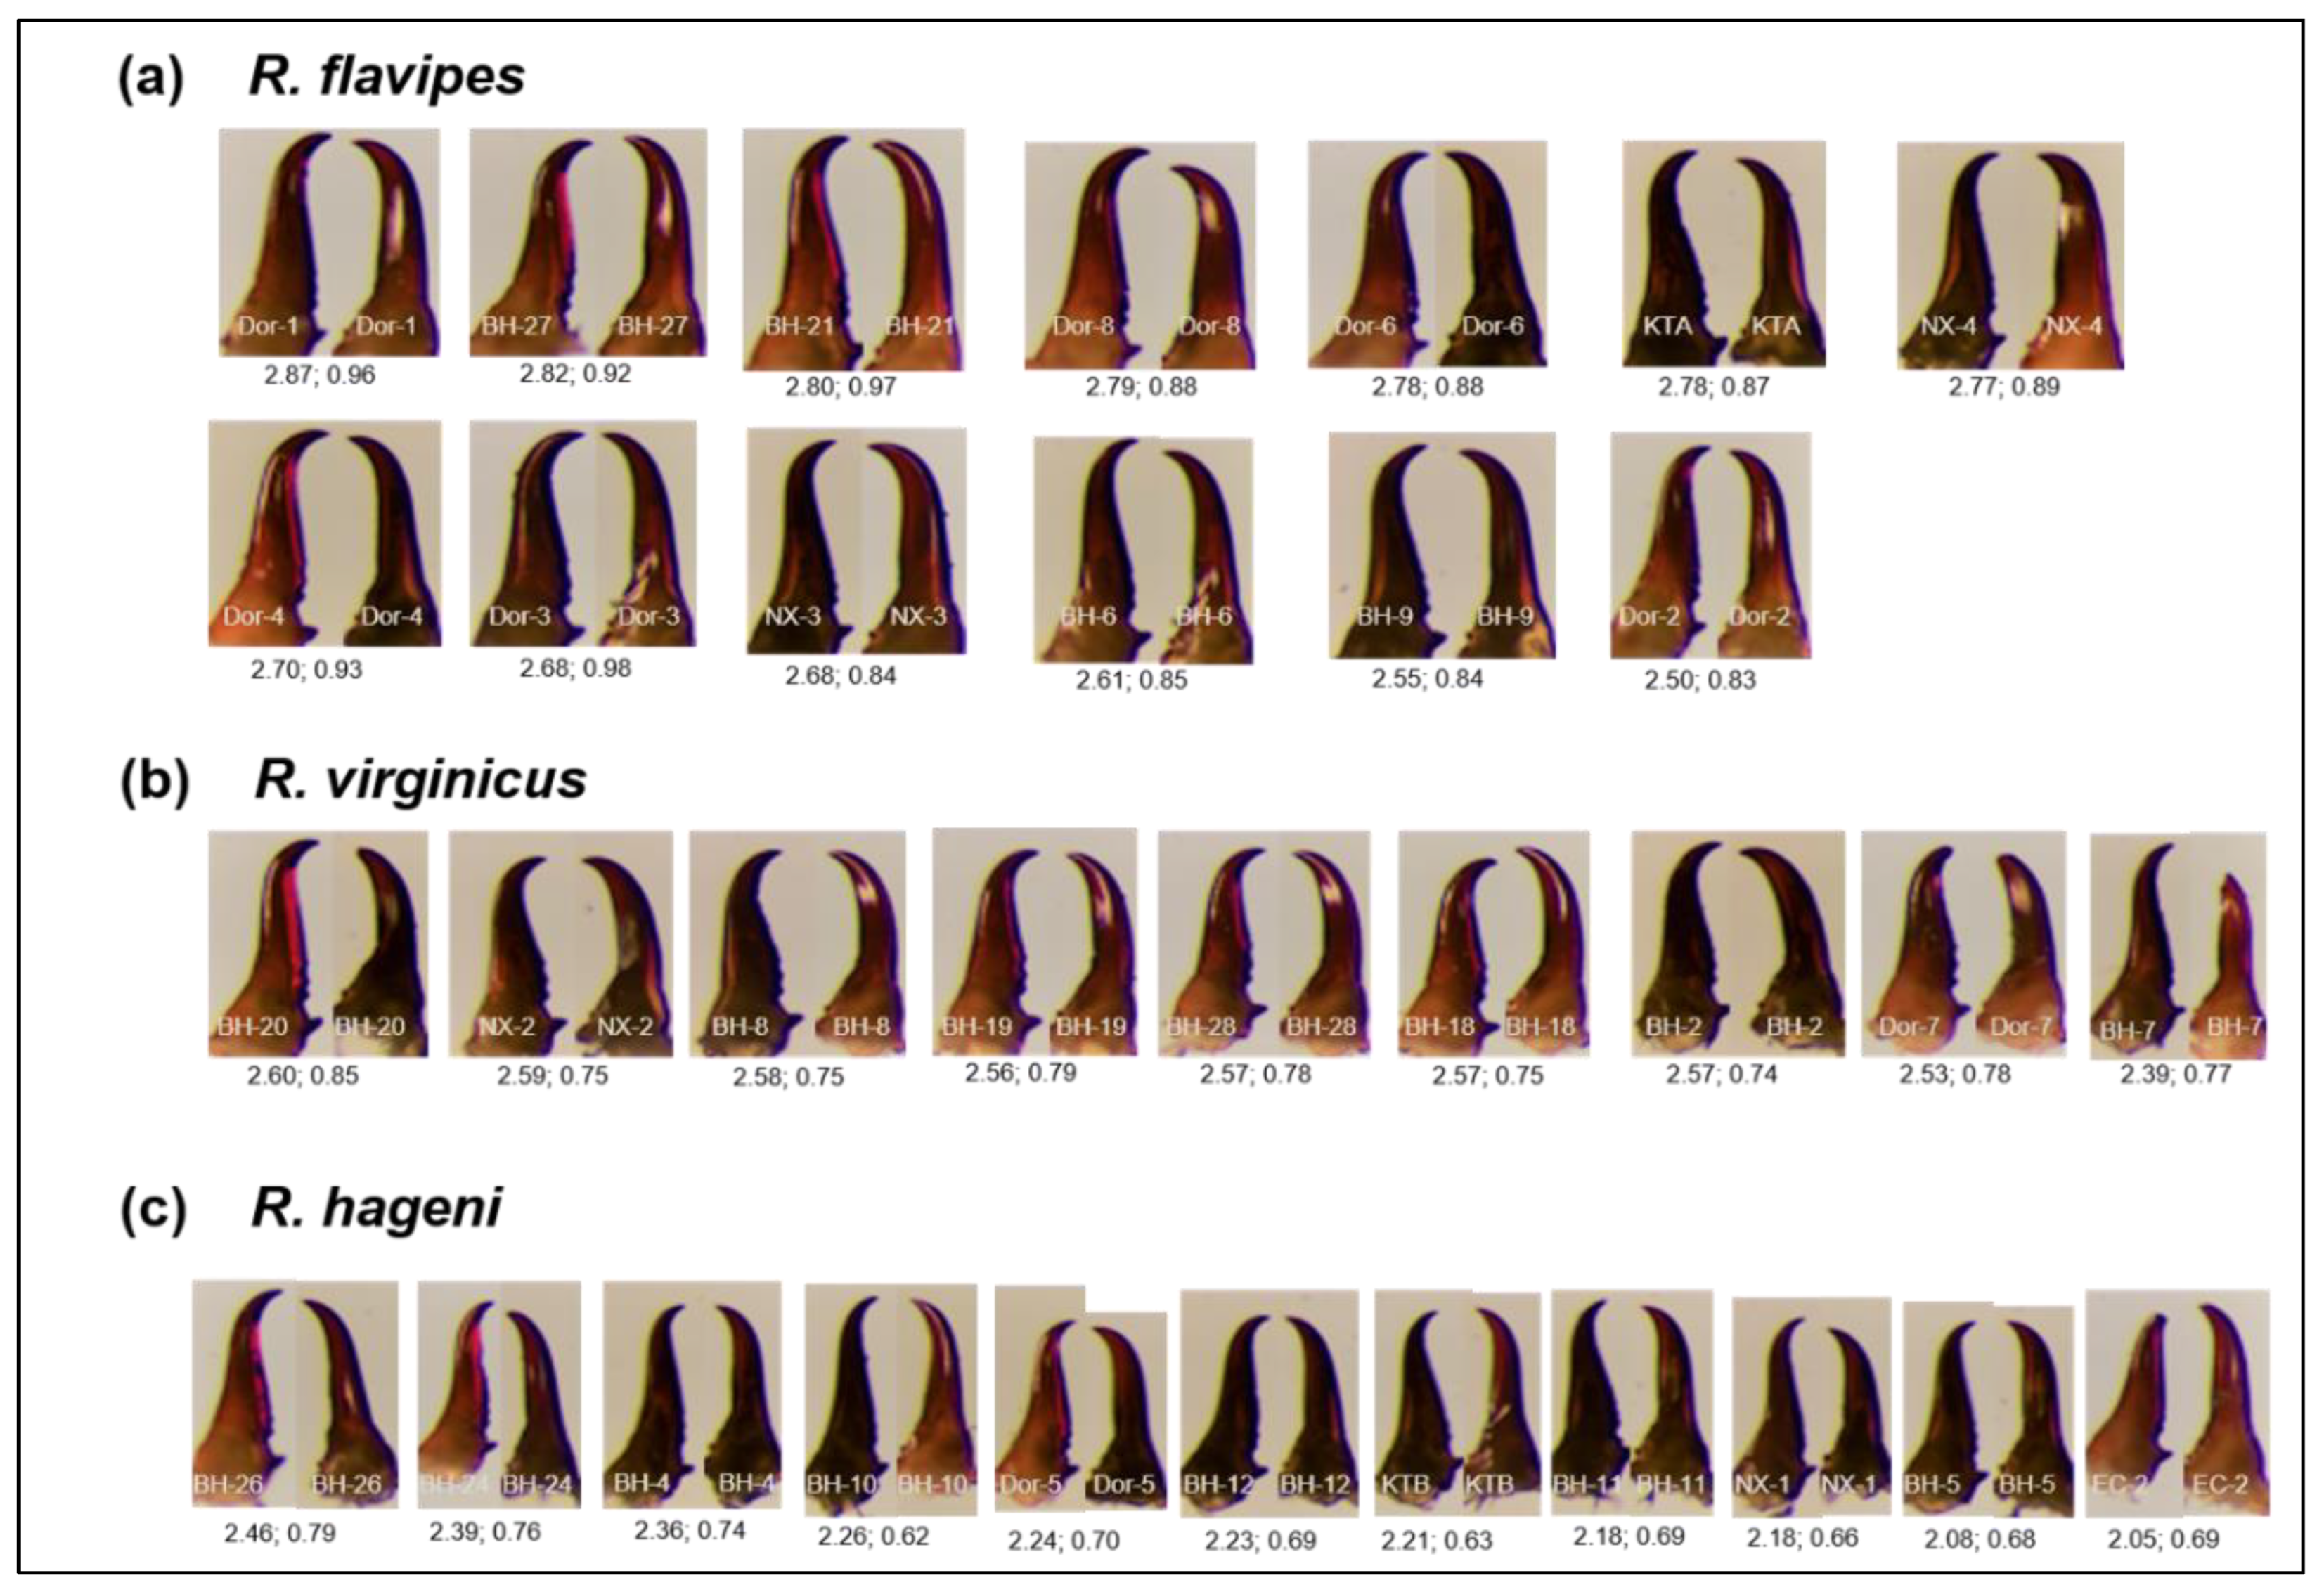
Similarities in the gross morphological data of mandible characters among
Reticulitermes species were also evaluated visually and recorded with photographs of these structures from representative individuals from all field colonies. The photographic images of
Reticulitermes mandibles are presented along with the size dimensions of head capsule (+mandible) lengths and pronotum widths (mm) in
Figure 1a–c.
Slight differences in the mandible and pronotum structural measurements were observable from photographic examinations of specimens from colonies of each species. However, these observable differences in structural morphology are not apparent to most individuals who are not taxonomic experts. The wide range of intraspecific measurements across individual species, along with overlaps in size dimensions for interspecific comparisons, could easily lead to misidentifications of species in many cases. However, additional confirmation from genetic tests would require further time-consuming analyses for commercial field applications. In addition, observation methods for the detection and identification of termite specimens within wood structures are not readily available since termites tend to be hidden behind walls and floorboards.
3.2. Termite E-Nose Smellprint Comparisons
Comparisons of electronic aroma signature (smellprint) patterns, derived from the CP analysis of volatiles released into the sampled headspace from four subterranean termite species, indicated that unique smellprint signatures were produced from the sensor array in response to VOC emissions from each species. These differences could be used to discriminate between termite species based on volatile metabolites released from termite bodies (
Table 2). Sensor response values are dimensionless units because e-nose sensor responses are semi-quantitative, indicating only relative concentrations of complex VOC mixtures that individual sensors are detecting in the sample. Individual sensor responses indicated that
R. flavipes and
R. virginicus contained smellprint signatures that were most similar, although PCA results provided a better measure of relatedness between these species. The smellprint signature of
R. hageni consisted of somewhat intermediate sensor responses for some sensors compared with the other two
Reticulitermes species. However, the uniqueness of the smellprint signature of
R. hageni was indicated by sensor 27, which recorded an unusually low response intensity (3.7) and higher responses for sensors 6, 7, 13–16, 19, and 28 than for
R. flavipes and
R. virginicus. The smellprint signature sensor responses for
C. formosanus were much higher in sensor intensity than those of the three
Reticulitermes species, demonstrating that this non-native, exotic species from the southern region of China and Taiwan (Formosa) produces different metabolic VOC emissions due to its more distant taxonomic relationship. The results provide strong evidence that different types of volatile metabolites released from different termite species are correlated with taxonomic relatedness.
Chemical variations between volatile emissions from individual termite species, indicated here by different sensor response patterns to VOC composition of headspace volatiles for each species, may be largely explained by differences in metabolic pathways of termite species that result in variations in types, amounts, and molar ratios of VOCs from different chemical classes.
An analysis of the intensity of individual sensor response (of sensors in the e-nose sensor array) to components of VOC emissions for each termite species provided clues to differences in the VOC composition of volatile emissions. Electronic-nose sensor responses to C. formosanus volatiles for sensors 1, 3, 17, 18, and 19 were significantly higher than responses to VOCs for all three Reticulitermes species. However, sensor responses to volatiles of all four subterranean termites were highest to sensors 7, 8, 27, 28, and 29, a possible indication of some similar VOC-emission fractions that are in common to all species. Responses of sensors 27–29 to C. formosanus volatiles were the highest sensor intensity responses to VOCs recorded for emissions among all termite species tested.
3.3. Principal Component Analysis
All four subterranean termite species were analyzed collectively by PCA. The resulting PCA score plot provided data clusters for each species reflecting differences in the VOC composition of volatile emissions among samples of each termite species (
Figure 2). The data points on the plot of
C. formosanus samples were tightly clustered and well separated from all three
Reticulitermes species. By contrast, plots of the three
Reticulitermes species were much more widely distributed and spatially separated, with some partial overlaps in data clusters, indicating likely similarities in the VOC composition of volatile emissions among these more chemically related species. The score plot of
R. virginicus was the most diffuse and least clustered among the
Reticulitermes species, suggesting greater variability in VOC composition among samples collected from geographically separated locations.
Further PCA testing was conducted to compare differences in the VOC composition of volatile emissions only among the three
Reticulitermes species. Three-dimensional PCA of e-nose analysis data based on headspace volatiles effectively differentiated between the three
Reticulitermes species in the PCA score plot (
Figure 3). The first two principal components (PC1 and PC2) accounted for 96.7% and 3.2% of the variance in the analysis and were plotted as orthogonal Eigenvalues on the Y, X, and Z axis, respectively, expressed as percentages. The PC variance for each axis indicated the proportion of the total variance explained by that principal component. The relatively high percentage of difference (99.9%) accounted for by the first two principal components in this analysis was a good indication that a significant degree of difference was determined between aroma classes, without the need for more rigorous discrimination parameters during neural-net training when constructing the reference library for termite species.
The distribution of data points for R. virginicus and R. flavipes were widely dispersed, in narrow, non-overlapping lines almost perpendicular to each other on the score plot. By contrast, the data points of R. hageni were tightly clustered in a central position between R. virginicus and R. flavipes, not overlapping, because the R. hageni data points were in a separate plane behind those of the other two species; this may be observed only by the axial rotation of the three-dimensional score plot using the visualization software that generates the plots.
The occurrence of wide distributions of data point clusters on the score plot for R. virginicus and R. flavipes, but not for R. hageni (with a tight data cluster), suggests greater variations in morphological plasticity in the former two species resulting from geographical variations in VOC emissions, derived from sympatric colonies, than were observed in the latter species.
3.3.1. Pairwise Comparisons of Species by Quality Factor Analysis
Quality factor analysis (QFA) provided a means for comparing the chemical relatedness of VOC emissions among
Coptotermes formosanus and
Reticulitermes species in pairwise comparisons. The higher the QF values, the greater the statistical differences in chemical relatedness between the aroma class pairs (termite species) being compared. Comparisons of
C. formosanus to the
Reticulitermes species indicated the highest QF values, as was expected. The VOC emissions of the Formosan termite had the greatest chemical difference with
R. virginicus (QF = 1439.4) and fewer chemical differences with
R. flavipes and
R. hageni (
Table 3). The VOC emissions of
C. formosanus were more closely related to those of
R. hageni, but less related to
R. flavipes. QF value comparisons, indicative of the chemical differences between the
Reticulitermes and
C. formosanus species, suggest that the VOC emissions of
R. flavipes are more closely related to those of
R. hageni than
R. virginicus. However, pairwise comparisons only among
Reticulitermes species did not confirm these relative chemical relatedness results implied by the interspecies comparisons.
The chemical relatedness of VOC emissions among Reticulitermes species was greater, as indicated by lower QF values in these pairwise species comparisons. The lowest QF value of 2.63 among the comparisons indicated that R. virginicus and R. hageni species produced VOC emissions that were most closely chemically related among the three species in their VOC emissions. R. virginicus and R. flavipes were more distantly related (QF > 4.0), whereas R. hageni and R. flavipes (QF > 13) were most distantly related based on differences in released volatiles.
3.3.2. Distribution of VOC Component Emissions in Common among Termite Species
An examination of e-nose neural-net-training validation values, derived from termite species databases following the construction of library recognition files, indicates the distribution of major VOC aroma components that are unique to each termite species and minor components that are shared by other termite species. A summary of the mean percentages of aroma components of each species that are unique or shared by other species is presented in
Table 4. The highest percentage of aroma components consists of major elements that are only found in the indicated species. The distribution of aroma elements in this table must be read from left to right (by rows), not from top to bottom (by columns).
The most significant and obvious revelation from this data is that C. formosanus shares very few of its minor VOC components with the Reticulitermes species included in the analysis. Larger percentages of aroma components were shared among Reticulitermes species. Significant percentages of R. flavipes aroma elements were shared with R. hageni (6.7%), and lesser amounts were shared with R. virginicus (4.1%). R. virginicus contained a larger percentage of its minor components that were shared with R. flavipes (10.5%), but very low amounts (<2%) were shared with C. formosanus and R. hageni, respectively. The more distinctly different R. hageni species shared some (4.5%) of its minor VOC components only with R. flavipes.
3.4. Reliability of E-Nose Identification of Unknown Reticulitermes Samples
Fresh specimens of
Reticulitermes samples of each species were collected from field colonies for use in testing the accuracy of the species reference library (created by neural-net training) in providing correct species identifications when the VOC emissions of the blind (unknown) test samples were compared with databases of known species in the reference library. The effectiveness of the A32S e-nose in correctly identifying unknown samples indicated a measure of reliability for accurate identifications compared with other possible methods. The e-nose machine classification results were scored and reported with three possible categories of identity determinations (outcomes), including: (1) correct identification, (2) ambiguous (mixed identifications of two or more species), and (3) unknown (inability to determine an identity), indicated as percentages of samples analyzed of each termite species, as presented in
Table 5. The results of sample determinations varied considerably with different types of termite samples analyzed. The range of each determination value for each species is provided in parentheses. The machine yielded the most accurate identifications (81.5% of samples identified correctly) for
R. virginicus, followed by 72.7% of samples correctly identified for
R. hageni, and 67.6% for
R. flavipes.
The highest percentage of ambiguous (multispecies) machine determinations of 9.1% for R. hageni samples was followed by 7.4% for R. virginicus and 5.4% for R. flavipes. However, the highest number of unknown (unidentified) machine determinations occurred with R. flavipes, followed by R. hageni and R. virginicus. The species specificity and variability of identity-determination results are complex and have several possible explanations relating to the original visual identity of analyzed samples (based on taxonomic keys) and morphological characters, as well as relatedness or differences in metabolic pathways shared between species, which ultimately affect whole-body VOC emissions.
4. Discussion
The effective management and control of subterranean termite populations in the environment is often based on species-specific control methods such as pheromone-based traps, growth-inhibiting chemicals, and biological controls. Even insecticides may have variable levels of effectiveness in killing different species of termites. For these reasons, the rapid accurate detection and identification of termites are required to select appropriate control methods. Genetic and acoustic methods do not provide rapid means for identifying termite species in field situations or investigations of possible termite structural damage to buildings. However, the aroma detection of volatile emissions using e-nose instruments potentially provides more information, including not only termite species present but also indications of the chemical composition of constituents present among VOC emissions when using dual technology e-nose devices with analytical chemistry capabilities in tandem.
The chemical ecology associated with volatile emissions of subterranean termite species was examined to determine the sources of differences in chemical classes of VOCs present and associated differences in semiochemical and behavioral patterns of termites placed into different chemical groups. Our analysis of individual sensor response intensities and varying smellprint signatures suggested differing compositions of VOCs within volatile emissions for each termite species. Sensor responses (for sensors 1, 3, 17, 18, and 19) to volatile emissions from
C. formosanus were significantly higher than responses to VOCs for the
Reticulitermes species. A previous study by Wilson et al. [
43] identified the chemical classes of VOCs to which individual sensors in the A32S e-nose sensor array had the highest response intensities. From this information, we determined that sensors 1, 3 and 19 have the greatest sensitivities to short-chain alcohols and carboxylic acids, whereas sensors 17 and 18 have the greatest sensitivities to long-chain alcohols, esters, aliphatic ketones, and aromatic hydrocarbons. The most significant class of VOCs found only in
C. formosanus volatile emissions was aromatic hydrocarbons, which were absent in all
Reticulitermes species. Aromatic hydrocarbons include benzenoid, bicyclic aromatic hydrocarbons (BAH) such as naphthalene and related derivatives. Naphthalene fumes are a significant health hazard as an indoor air pollutant to humans in homes and other urban dwellings that have high infestations and nests of Formosan termites [
48]. High exposure to naphthalene gas in indoor environments can cause headaches, fatigue, confusion, tremors, nausea, and vomiting in humans. Long-term exposure to naphthalene has the potential to cause certain types of human cancers [
49].
The uniquely different e-nose smellprint signatures from the four subterranean termite species studied here suggest unique differences in VOC constituents, particularly between volatile emissions of
Coptotermes and
Reticulitermes species. Previous early studies to distinguish between the chemical constituents of termite emissions showed that
C. formosanus nests were unique in producing naphthalene [
50,
51]. Later studies showed that winged imagoes of
C. formosanus produced fourteen compounds (C6–C18 hydrocarbons) with naphthalene as the major component, along with n-hexanoic acid and some minor antifungal volatiles, including nonanal, n-pentadecane, n-tetradecane, n-heptadecane and methyl octanoate [
52]. Complex mixtures of short-chain fatty acids, aldehydes, aromatics, heterocyclic aromatics, flavonoids, sesquiterpenes, straight-chained and branched alkanes, ketones, esters, alcohols and nitrogen- and sulfur-containing compounds were also produced. Volatiles from nymphs (C10–C16 hydrocarbons) contained 1,2,3-trimethyl-4[E]-propenyl-naphthalene as the major component. Soldier volatiles were comprised of seventeen C9–C18 hydrocarbons, with oleic acid as the major component. The volatile emission from workers was comprised of fifteen C9–C18 hydrocarbons with n-amyl isovalerate as the major component. Naphthalene appears to be a major aromatic defense repellant used by
C. formosanus as an exclusionary volatile chemical barrier to prevent competing soil microbes (bacteria and fungi), ants, various macroinvertebrates, and possibly other termite species from approaching their wood colonies and nests [
52,
53]. Chen et al. [
50] also found that naphthalene elicits trail-following behavior in Formosan termite soldiers.
Reticulitermes taxa, by comparison, are well known for producing unique terpenoid volatiles for various functions and semiochemical interactions. Tarver et al. [
54] identified two terpenes, γ-cadinene and γ-cadinenal, as the most abundant VOCs in
R. flavipes emissions. Several other terpenes also were significantly active. Zalkow et al. [
55] previously determined that these two sesquiterpenes were soldier-specific secretions.
Reticulitermes soldiers have a frontal gland that produces several types of terpenes, including (−)-β-elemene, a major component of soldier extract that acts multifunctionally as a worker arrestant, a component of inhibitory primer pheromone, and an anti-pathogenic agent [
56].
Distinct volatiles derived from the
Reticulitermes species, including
R. flavipes,
R. virginicus, and
R. hageni, have been identified based on morphological characters from alates and soldiers [
57]. Three cuticular hydrocarbon phenotypes were identified that corresponded with
R. flavipes, one corresponded with
R. virginicus, and the remainder corresponded with
R. hageni based on soldiers. Haverty et al. [
8,
17] identified 15 unique hydrocarbon phenotypes among
Reticulitermes collections. Haverty et al. [
58] found several dimethylalkanes CHCs of
C. formosanus that may be unique to this species. Cuticular hydrocarbon phenotypes correlate well with morphometric species determinations, with some exceptions. Other examples of volatile emissions from termites have included various types of species-specific pheromones and different chemical classes of CHCs [
23,
56,
58,
59,
60,
61]. The identification of CHCs from samples taken in surveys of
Reticulitermes from Georgia, California, Nevada, Arizona, and New Mexico provides evidence that there are numerous undescribed species or species complexes of
Reticulitermes in North America [
18]. Volatile CHCs are often identified by solid-phase microextraction (SPME) coupled with gas chromatography-mass spectrometry (GC-MS) analysis of headspace volatiles [
62]. These termite CHCs may also be similarly analyzed by e-nose devices to produce corresponding species-specific smellprint signatures.
Subterranean termites are considered lower or more primitive forms than higher termites, which also produce species-specific volatiles useful for identification. Himuro et al. [
63] analyzed volatiles emitted by live primary queens, workers, soldiers, alates, and eggs of
Nasutitermes takasagoensis, a higher termite species collected in a Japanese subtropical forest. They found 14 VOCs, of which 7 were from soldiers, 1 was from alates (cyclohexane) only, 1 was egg-specific (dimethyl disulfide), and 1 (phenylethanol) was queen-specific. These VOCs consisted mostly of unique terpenes produced only by soldiers, with minor components consisting of a triene, an oxime, and diketone from queens, workers, or adults, but not soldiers.
The volatile emissions from termites also contain significant VOC constituents derived from microbial emissions from the hindgut. The hindgut microflora of termites can vary considerably in different termite species, and this species-specific microbial composition contributes to the unique aroma of their termite hosts. Termite hindguts may be inhabited by microbes from all three life domains of Eukarya (protists), Bacteria, and Archaea, which are horizontally and vertically transferred by nestmates and reproductives, respectively [
64,
65]. A variety of acetate and C3–C5 volatile fatty acids (VFAs) were identified in emissions from the hindgut fluid of
Reticulitermes flavipes,
Coptotermes formosanus, and other species, produced in situ through acetogenesis by hindgut microbiota [
66]. Approximately 85% of the acetate emitted from hindgut microbiota was derived from the enzymatic digestion of cellulose, and the remaining 15% was derived from hemicellulose digestion.
Differences in termite VOC emission compositions were further reflected here in results from pairwise species comparisons based on analyses using QF values and aroma class distributions of VOC components in common between termite species. QF value comparisons between C. formosanus and Reticulitermes species demonstrated very large differences in VOC compositions of volatile emissions between these two major groups of subterranean termites. These major differences were also indicated by very large differences in sensor response intensities, indicated by vastly different smellprint signatures. These large QF value differences indicate major divergences in the VOC profiles corresponding to and indicated by differences in smellprint signatures. Among Reticulitermes species, QF values indicated that the composition of VOC emissions of R. hageni is more closely related to that of R. virginicus than R. flavipes. The Formosan termite had only very minor VOC components in common or shared with R. flavipes and R. virginicus, and had none in common with R. hageni. R. flavipes shared some minor VOC components with R. virginicus and R. hageni, but R. hageni and R. virginicus shared common VOC elements mainly with R. flavipes, not with each other. These somewhat variable results may be only partially explained by different levels of overlap in common VOCs being emitted. Other explanations could include possible misidentifications of some analyzed specimens using morphology-based taxonomic keys.
The wider distribution of data point clusters within the PCA score plot for
R. virginicus, which encroaches on data clusters of
R. hageni and
R. flavipes, could be explained by several possible factors. The VOC composition of volatile emissions from
R. virginicus could be more variable across different geographic locations of sampling sites compared to the more conserved VOC composition of the other two species. It is also possible that the cohabitation of colonies that occasionally occurs with two or more species may result in more than two species of termite within the same colony, which can affect reference sample identifications used in selecting specimens for e-nose analysis [
41,
67,
68]. This phenomenon may occasionally result in misidentified individual field samples from a colony that are not identical to the species identification for that colony, particularly due to morphological similarities among species. In cases where a colony of one species is close to a colony of another species, foraging workers from separate colonies can share tunnels used in moving within subterranean passageways. Closely located colonies also may fuse to some extent [
68].
The A32S conducting polymer e-nose correctly identified and discriminated between Reticulitermes unknown field specimens at different rates for each species. The e-nose provided the highest mean level of correct identifications for R. virginicus (81.5%), followed in decreasing order by R. hageni (72.7%) and R. flavipes (67.6%). The e-nose yielded the highest mean ambiguous determination for R. hageni (9.1%) and the highest unknown determination for R. flavipes (27.0%). The variable results associated with e-nose species identifications, classified by known-species reference library comparisons, may be due to potential misidentifications of some specimens of each species using morphological keys in setting up reference aroma libraries of known species. This error could be eliminated by performing genetic tests on individuals from each aggregate sample analyzed. The accuracy of correct identifications may also be improved by increasing the duration of neural-net training to provide greater separations between species, although this could potentially result in higher rates of unknown determinations, but it should decrease the rate of ambiguous determinations. Thus, over-training is a risk possibility that does not necessarily yield improved or more accurate species identifications.
The use of e-nose devices for the early nondestructive detection of hidden termites in wood provides the advantage of applying control treatments without expensive deconstructive and reconstructive carpentry work which is necessary for older termite infestations when substantial structural damage to wood has already been done. Another advantage of the e-nose detection of termite species is facilitating the use of species-specific baits for the routine detection, control, and monitoring of populations of specific termite pest species present in different environmental conditions and regions [
69,
70].
The e-nose sensing of VOC emissions from termites in small aggregate samples to nondestructively detect termites could be further developed by including wood volatile components in the sample, added for the purpose of detecting and determining the presence of subterranean termite species within coarse wood debris and infesting wood in service. Cheaper portable e-nose devices provide effective means for detecting differences in VOC emissions between termite species found in woody structures without the necessity of identifying individual VOCs present in sample analytes. By empirically establishing correlations between the chemical composition of VOC emissions and e-nose smellprint signatures, it is possible to create application-specific e-nose reference library databases for detecting specific termite species in different types of woody substrates.
The detection of termite volatiles emanating from wood may in some cases require small boreholes in the wood structure for the acquisition of adequate air samples beneath floorboards or behind walls for effective e-nose identifications. Future studies to improve the identification of termite species within wood samples should include the development of more comprehensive e-nose reference libraries containing known termite and wood types in various combinations to facilitate accurate identifications regardless of wood type.


