Article

Wastewater-Based Epidemiology of SARS-CoV-2 RNA in Bethlehem, PA and Lehigh University

by
Nusaibah Alqasawah
1,
Vassie Ware
2 and
Kristen Jellison
1,*
1
Department of Civil and Environmental Engineering, Lehigh University, Bethlehem, PA 18015, USA
2
Department of Biological Sciences, Lehigh University, Bethlehem, PA 18015, USA
*
Author to whom correspondence should be addressed.
Environments 2024, 11(10), 212; https://doi.org/10.3390/environments11100212
Submission received: 15 August 2024 / Revised: 4 September 2024 / Accepted: 12 September 2024 / Published: 26 September 2024

Abstract

:
Wastewater surveillance for SARS-CoV-2 provides a broad assessment of community health since wastewater represents all community members, regardless of health care access and status of health (i.e., symptomatic and asymptomatic). Wastewater surveillance also provides early detection of disease transmission since the virus can be present in human waste before the presentation of clinical symptoms. We analyzed wastewater from Lehigh University (Bethlehem, PA) as well as the greater Bethlehem community for SARS-CoV-2 (N1, N2, and E genes) from August 2020 through May 2021. Total RNA was extracted and analyzed for SARS-CoV-2 and pepper mild mottle virus (PMMoV) by RT-qPCR. Of 73 Bethlehem wastewater samples, the number of positive samples depended on which SARS-CoV-2 gene was screened: 62 (84.9%) for N1, 52 (71.2%) for E, and 28 (38.4%) for N2. Of 67 university wastewater samples, the numbers of positive samples were 59 (88.1%) for N1, 51 (76.1%) for E, and 31 (46.3%) for N2. Temporal trends of SARS-CoV-2 in wastewater mirrored trends in COVID-19 positive cases in the Bethlehem community. Normalizing SARS-CoV-2 RNA concentrations to PMMoV (a human fecal indicator) increased the correlation between both N1 (ρ increased from 0.37 to 0.72) and E (ρ increased from 0.32 to 0.61) concentrations in wastewater with COVID-19 cases in the community.

Graphical Abstract

1. Introduction

In March 2020, the World Health Organization (WHO) declared a global coronavirus disease (COVID-19) pandemic [1]. The first COVID-19 infection was reported in Wuhan, China, in December 2019, with subsequent transmission of the virus to other countries in Asia, Europe, Africa, and the Americas [2,3]. As of 26 August 2024, over 103 million confirmed cases and over 1 million deaths have been reported in the United States [4]. Locally, the pandemic has had devastating consequences for Pennsylvania’s economy; lockdown orders led to the closing of schools and businesses across the commonwealth [5].
Patients with COVID-19 present a wide range of symptoms ranging from mild to severe, including cough, fever, difficulty breathing, myalgia, throat soreness, and diarrhea [6,7,8]. Severe symptoms include pneumonia that can lead to organ malfunction [1]. The actual number of COVID-19 infections in a community is likely to be higher than the number of confirmed cases for several reasons: it may take a long time before people show symptoms (up to 14 days after infection) [9]; some symptomatic infected individuals do not get tested due to lack of access to health care; and some infected individuals remain asymptomatic for the duration of the infection.
The genomic material of SARS-CoV-2 has been detected in the urine and feces of both symptomatic and asymptomatic patients, which also raises concerns about possible fecal-oral routes of transmission [10,11,12,13]. Studies have estimated that 27–89% of infected individuals shed the virus in their feces [7]. SARS-CoV-2 can be excreted in the feces of infected individuals as early as 3 to 5 days before symptoms begin [14,15,16,17,18] and even after all respiratory symptoms have cleared [15], supporting the likelihood of virus detection in wastewater. Wastewater-based epidemiology (WBE) is a promising tool for understanding disease transmission in a community [19], potentially minimizing the spread of disease by providing early detection of disease transmission before populations exhibit symptoms [20]. WBE has been historically used to understand and estimate viral diseases, including poliovirus, hepatitis A and E viruses, enterovirus, and norovirus [20,21].
Wastewater surveillance for SARS-CoV-2 may potentially be used as an early warning system that allows decision-makers the opportunity to intervene with public health protection measures prior to symptomatic cases in a community [22,23]. Early identification of infected individuals is paramount to limit virus transmission and to ensure early intervention [10]. Several studies in different geographic locations around the world have focused on the detection of SARS-CoV-2 RNA in wastewater during the COVID-19 pandemic [7,23,24,25,26,27,28,29,30,31]. Furthermore, the utility of WBE is not limited to community-level wastewater treatment plants (WWTPs); it can also be applied to wastewater from more localized areas, such as hospitals, schools, and other high-risk transmission sites [32,33]. In this work, we monitored wastewater in Bethlehem, Pennsylvania, for the presence of SARS-CoV-2 RNA as an indicator of COVID-19 transmission in the community. We also monitored the wastewater effluent from part of Lehigh University’s main campus to monitor virus transmission during student re-entry onto campus in the Fall 2020 and Spring 2021 semesters. This study evaluated the usefulness of WBE as a complementary tool to clinical testing for COVID-19 at the community level.

2. Materials and Methods

Sampling Sites. Untreated municipal wastewater samples were collected from two locations in Bethlehem, Pennsylvania: the Bethlehem WWTP influent and Lehigh University’s Asa Packer campus effluent. The Asa Packer campus is Lehigh University’s main campus, encompassing approximately 360 acres on the north slope of South Mountain, where most students attend class and live. The campus sampling location included wastewater from a portion of the lower Asa Packer campus that included some student residences; academic buildings; faculty, staff and student offices; and other facilities. In fall 2020, Lehigh University limited the on-campus student population primarily to first-year students and others with specific personal or academic needs. In spring 2021, some additional students returned to campus, although there continued to be a mix of in-person and remote enrollment. The spring academic calendar was adjusted to minimize travel and reduce the risk of COVID-19 transmission by implementing a one-week delayed start of the semester and canceling spring break.
The Bethlehem WWTP influent represents the greater Bethlehem community and served a population of 136,724 at the time of this study. The sewershed (Figure 1) encompasses many categories of critical users (including hospitals, dialysis centers, nursing homes, childcare centers/homes, adult care centers, schools, and colleges) and covers the following municipalities and ZIP codes: Bethlehem (18015, 18016, 18017, 18018), Bethlehem Township (18020), Fountain Hill (18015), Freemansburg (18017), Hanover Township Northampton County (18017), Hellertown (18055), parts of Allentown (18109), East Allen Township (18067), Hanover Township Lehigh County (18109), Lower Nazareth (18064), Palmer Township (18043), and Salisbury Township (18103).
Wastewater Quality Characterization. Bethlehem WWTP receives both domestic (90%) and industrial (10%) wastewater; treatment consists of primary treatment, secondary treatment (activated sludge), and disinfection with chlorine. While stormwater also combines with sewage water, the study catchment received a maximum of 33.8 mm of precipitation in the 24 h prior to wastewater sampling over the duration of the study. Wastewater quality data were provided by the operators of the WWTP from their routine wastewater analyses (Table 1); these data were measured according to Standard Methods for the Examination of Water and Wastewater, 23rd edition [34].
Wastewater Sampling, Transportation, and Storage. Wastewater sampling was conducted by City of Bethlehem technicians following the national guidance of biosafety precautions for WWTP personnel [6,7]. During each sampling event, technicians wore standard personal protective equipment (PPE) including face masks, safety goggles, gloves, steel-capped boots, hard hats, and long trousers [7].
From August 2020 through May 2021, eight wastewater samples per month per location were collected (Monday through Thursday on alternating weeks). For the Lehigh University sampling location, an ISCO GLS autosampler (10 L capacity) was used. The sampler intake was composed of 3/8-inch vinyl tubing weighted with a polypropylene strainer to prevent large debris from clogging the tubing. The sampler was programmed to take 100 mL samples at 20 min intervals over 24 h; after 24 h, the composite sample was unloaded, and a 400 mL sterile plastic collection bottle was filled with a well-mixed aliquot of the 24-h composite wastewater sample. For Bethlehem WWTP, refrigerated autosamplers were used. The sample size and frequency depended on the real-time flow, but a typical influent composite had 24–25 samples (roughly one sample per hour). The plant has two separate influent flows: a North influent (~90% of daily flow) and a South influent (~10% of daily flow). WWTP technicians collected the composite samples shortly after midnight and immediately stored them at 4 °C; the following day, technicians made one 1 L “Influent” composite containing 100 mL and 900 mL of the South and North influents, respectively, from which a 400 mL sterile plastic collection bottle was filled with a well-mixed aliquot.
Samples were stored on ice in coolers until delivery to the WWTP refrigerator, where they were stored at 4 °C until picked up within 48 h [9,35] and transported on ice to the Lehigh University laboratory. The total number of samples collected at the Bethlehem WWTP influent and the Lehigh University effluent was 73 and 62, respectively. Upon arriving at the laboratory, the wastewater sample in the 400 mL collection bottle was divided into four separate 100 mL aliquots and stored at −20 °C [35]. Samples collected from August 2020 through January 2021 were stored at −20 °C until further analysis, whereas samples collected from February 2021 through May 2021 were processed within 6 h of pickup. Samples were processed in duplicate, i.e., two 100 mL aliquots of each sample were processed, and the other two 100 mL aliquots were kept in the −20 °C freezer in case they were needed for further analysis.
SARS-CoV-2 Concentration. Viral concentration was performed according to Medema et al. [32]. Briefly, duplicate 100 mL aliquots of each sample were processed (if frozen, they were thawed overnight at 4 °C) [20,25]. Each 100 mL aliquot was centrifuged at 4654× g for 30 min at 4 °C (no brake) to remove the large particles and suspended solids that may clog filtration columns [7,36]. The supernatant was carefully removed without disturbing the pellet and evenly divided and applied to a Centricon® Plus-70 centrifugal filter (Merck Millipore, Burlington, MA, USA; 30 kDa cut-off, maximum sample volume 70 mL—so each filter was used twice (processing 50 mL each time) to completely process the 100 mL sample aliquot). The filters were centrifuged at 3500× g for 20 min at 4 °C (repeated twice to allow the full 100 mL volume to pass through) [7,37]. The concentrate cup was inverted and centrifuged at 1000× g for 2 min to obtain a viral concentrate of approximately 200–1800 μL. The viral concentrate was collected from the concentrate cup and stored at −80 °C as 200 μL aliquots for RNA extraction; the filtrate was discarded. All glassware used for viral concentration was disinfected with a diluted diethylpyrocarbonate solution (DEPC) and rinsed with DI water between processing each sample.
RNA Extraction. Viral RNA was extracted using the RNeasy Power Microbiome Kit [36] (Qiagen, Germantown, MD, USA) according to the manufacturer’s protocol with slight modification. In brief, 650 μL of PM1-β-mercaptoethanol solution was added to each 200 μL viral concentrate aliquot, followed by 150 μL of solution IRS (specially formulated to remove PCR inhibitors). Samples were incubated for 5 min at 4 °C and then centrifuged at 13,000× g for 1 min; supernatants were transferred to a 2 mL collection tube. Next, 650 μL each of PM3 and PM4 were added to the supernatant, and 650 μL of the sample solution was loaded into an RNA spin column and centrifuged at 13,000× g for 1 min. The flow-through was discarded, and this centrifugation step was repeated until all of the supernatants from all aliquots of each sample were processed through one spin column. The manufacturer’s instructions were followed for the remaining steps of the protocol, resulting in a final elution volume of 100 μL of RNA. The quality and quantity of the extracted RNA was determined using a NanoDrop 1000 (Thermo Fisher Scientific, Wilmington, DE, USA). Extracted RNA was stored at −80 °C until further analysis.
Reverse Transcriptase-Quantitative Polymerase Chain Reaction (RT-qPCR). Five microliters (5 μL) of extracted viral RNA were processed by RT-qPCR for quantitative detection of SARS-CoV-2 using primers and probe sequences that target regions of the SARS-CoV-2 nucleocapsid genes (N1,N2) and envelope gene (E). For the internal municipal wastewater virus reference, primers targeting pepper mild mottle virus (PMMoV) were used. All samples were processed in triplicate. RT-qPCR was performed on an Applied Biosystems™ 7300 Real-Time PCR System. Reactions were run in sterile 96-well plates; each 20 μL reaction mixture contained 5 μL of extracted viral RNA (or control) template; 9 μL of nuclease-free water; 4 μL of 5× Evoscript Mastermix (Roche CustomBiotech, Indianapolis, IN, USA); primers (0.2 μM for N1 and N2; 0.4 μM for E); and 0.2 μM of probe for N1, N2, and E genes. For PMMoV assays, primers/probe mixture targeting PMMoV genomic RNA were used (DNA Software, Plymouth, MI, USA). Primer and probe sequences are shown in Table 2; primers and probes were purchased from Integrated DNA Technologies, Inc. (Coralville, IA, USA). For SARS-CoV-2 quantification, RT-qPCR assays were initiated with reverse transcription for 15 min at 60 °C, denaturation and activation for 10 min at 95 °C, followed by 45 cycles of 95 °C for 15 s, 58 °C for 30 s, and 40 °C for 30 s. For PMMoV quantification, RT-qPCR assay started with 50 °C for 5 min, 94 °C for 3 min, followed by 44 cycles of 94 °C for 5 s, 63 °C for 30 s, and a final extension at 63 °C for 3 min.
Baseline values were set automatically by the Applied Biosystems™ 7300 Real-Time PCR System, while Ct values were manually set at the point where the positive controls began to exponentially increase. Samples with non-exponential multiplication were considered to be negative. Environmental wastewater samples were considered positive for SARS-CoV-2 RNA with a Ct ≤ 35, and suspected positive samples (Ct = 36–40) were considered positive if the amplification curve crossed the threshold line of both N1 and E targets at a Ct < 40 in a repeated experiment. All amplification reactions were run in triplicate.
RT-qPCR Amplification Efficiency and Limit of Detection. To assess the performance of RT-qPCR primer sets (Table 3), ten-fold serial dilutions of a SARS-CoV-2 RNA stock (concentration 1 × 10⁸ gene copies/μL; European Commission Joint Research Centre, Geel, Belgium, Item EURM-019) were included in each batch of RT-qPCR assays to generate a standard curve. Standard curves generated from the log-linear regression of RNA quantity (known value) versus the cycle threshold (Ct) produced coefficient of correlation (R2) values greater than 0.99. Amplification efficiencies (E) were calculated as E = 10(−1/slope) − 1 [26,38]; the amplification efficiencies of the N1, N2, and E assays were within the prescribed range (90–110%) of Minimum Information for Publication of Quantitative Real-time PCR (MIQE) guidelines [39]. The concentration of SARS-CoV-2 RNA (copies/L) of wastewater for each sample was estimated based on the standard curve (y = m (log10x) + c), as measured using RT-qPCR assay [26,38].
To evaluate the limits of detection (LOD) for the N1, N2, and E genes, ten-fold serial dilutions of SARS-CoV-2 RNA (spanning 5 × 10⁷ to 5 × 10⁻⁴ gene copies) were used as the template for the RT-qPCR. The Ct values for each concentration were determined in triplicate. The assays were sensitive enough to detect 5 gene copies/reaction consistently (Ct = 35.14 for N1; Ct = 35.26 for N2; and Ct = 35.04 for E). Reactions containing less than 5 gene copies/reaction were occasionally amplified in one or two of the triplicates (Ct = 36–40).
Table 2. RT-qPCR primer and probe sequences and concentrations [36,40].
AssayTarget GenePrimer/Probe
Identification *
Sequence
SARS-CoV-2N1Nucleocapsid (N)2019-nCoV_N1-F5′-GACCCCAAAATCAGCGAAAT-3′
2019-nCoV_N1-R5′-TCTGGTTACTGCCAGTTGAATCTG-3′
2019-nCoV_N1-P5′-FAM ACCCCGCATTACGTTTGGTGGACC-ZEN/Iowa Black-3′
N2Nucleocapsid (N)2019-nCoV_N2-F5′-TTACAAACATTGGCCGCAAA-3′
2019-nCoV_N2-R5′-GCGCGACATTCCGAAGAA-3′
2019-nCoV_N2-P5′-FAM-ACAATTTGCCCCCAGCGCTTCAG- ZEN/Iowa Black-3′
EEnvelope (E)E_Sarbeco-F5′-ACAGGTACGTTAATAGTTAATAGCGT-3′
E_Sarbeco-R5′-ATATTGCAGCAGTACGCACACA-3′
E_Sarbeco-P5′-FAM-ACACTAGCCATCCTTACTGCGCTTCG-ZEN/Iowa Black-3′
PMMoV-Forward PrimerGAG TGG TTT GAC CTT AAC GTT GA
Reverse PrimerTTG TCG GTT GCA ATG CAA GT
Probe6-FAM-CCT ACC GAA GCA AAT G-MGB
* Forward primer (F), reverse primer (R), and probe (P).
Table 3. RT-qPCR performance characteristics generated from the log-linear regression of RNA quantity vs. cycle threshold (Ct).
AssayRT-qPCR Characteristics
Efficiency (E) (%)Linearity (R2)SlopeY-Intercept
N191.030.994−3.557735.282
N290.630.995−3.569035.318
E90.430.995−3.575735.242
RT-qPCR Inhibition Evaluation. Multiple experiments were conducted to determine the presence of RT-qPCR inhibitors in RNA extracted from wastewater samples. Briefly, 5 × 10⁵ gene copies of SARS-CoV-2 RNA were added to RNase-free water and quantified by RT-qPCR for the N1, N2, and E genes; the Ct value served as a reference point. The presence of PCR inhibitors was assessed for all wastewater samples that yielded negative detection for SARS-CoV-2 by RT-qPCR. RNA extracted from those samples was seeded with 5 × 10⁵ gene copies of SARS-CoV-2 RNA and analyzed by RT-qPCR. Previous studies showed that wastewater samples with a Ct value ≥ 2 from the reference Ct were considered to have RT-qPCR inhibition [7,41,42]. Samples with high Ct values from both sites were also tested for inhibition by spiking 5 × 10⁵ gene copies of SARS-CoV-2 RNA into 100 μL of RNA extracted from the wastewater sample; this spiked sample was then serially diluted (5 times) and processed by RT-qPCR to determine Ct values.
Viral Recovery. SARS-CoV-2 recovery was calculated based on the equation:
R e c o v e r y   E f f i c i e n c y   % = t o t a l   v i r a l   R N A   g e n e   c o p i e s   r e c o v e r e d t o t a l   v i r a l   R N A   g e n e   c o p i e s   s p i k e d × 100
The percent recovery of spiked SARS-CoV-2 was calculated for each step of the protocol using the standard curves generated for each assay and the estimated spiked SARS-CoV-2 quantity. To evaluate viral recovery of the complete protocol, a known quantity of SARS-CoV-2 was added to negative wastewater samples as well as nuclease-free water; these seeded water samples were processed through SARS-CoV-2 concentration, RNA extraction, and RT-qPCR [26].
To determine the viral recovery of the SARS-CoV-2 concentration protocol, a set of 100 mL wastewater samples (n = 6) that tested negative for SARS-CoV-2, as well as 100 mL of nuclease-free water (n = 6), was each seeded with heat-inactivated SARS-CoV-2 before the first centrifugation step (in which large particles and suspended solids are removed) and then processed using the SARS-CoV-2 concentration protocol. The concentrated samples were then processed through RNA extraction, and RT-qPCR was performed in triplicate. Similarly, a set of negative wastewater samples (n = 6) were spiked prior to RNA extraction, and RT-qPCR was performed in triplicate; the percent recovery of the SARS-CoV-2 concentration protocol was calculated based on the difference in virus quantity detected in the water spiked before RNA extraction from the water spiked prior to the first centrifugation.
To measure viral losses during the removal of large particles and suspended solids in the first centrifugation step of the SARS-CoV-2 concentration protocol, a set of negative wastewater samples (n = 6) as well as 100 mL of nuclease-free water were each seeded with heat-inactivated SARS-CoV-2 after the first centrifugation step (before ultrafiltration) and then concentrated, processed by RNA extraction, and quantified by RT-qPCR. By comparing the RT-qPCR detection of RNA extracted from samples spiked before and after the centrifugation step, the recovery of virus during the first centrifugation step of the SARS-CoV-2 concentration method was evaluated. To determine the recovery of SARS-CoV-2 from the RNA extraction and RT-qPCR protocols, a set of concentrated wastewater samples that tested negative for SARS-CoV-2 (n = 6) as well as nuclease-free water was each seeded with inactivated SARS-CoV-2 virus and processed by RNA extraction and RT-qPCR. Recovery was calculated according to Equation (1).
Quality Control. To minimize the potential for RT-qPCR contamination, RNA extraction and RT-qPCR assays were performed in separate laboratories. A negative control (nuclease-free water) was included with each batch of viral RNA extractions; all negative controls resulted in negative RT-qPCR detection. An absorbance ratio (260/280 nm) greater than 1.80 for extracted RNA was considered to be acceptable RNA quality [41]. A negative control (nuclease-free water) and positive controls (three 10-fold dilutions of a 1 × 10⁸ gene copies/μL SARS-CoV-2 RNA stock in nuclease-free water) were included in each RT-qPCR assay; all negative controls resulted in negative RT-qPCR detection. All positive controls resulted in consistent Ct values for all RT-qPCR assays.
PMMoV, an indicator of human waste input, was quantified in all wastewater samples via RT-qPCR as an internal control to account for variations in wastewater flow or the size of the representative population in each wastewater sample. To normalize the SARS-CoV-2 concentration in each wastewater sample based on the PMMoV concentration, the SARS-CoV-2 concentration detected by RT-qPCR was divided by a deviation factor calculated according to Wu et al. [43]:
D e v i a t i o n   f a c t o r = 10 k s a m p l e   C t m e d i a n   C t
where k is the slope of the PMMoV standard curve (−0.3034 in this study), sample Ct is the Ct value of PMMoV for each sample, and median Ct is the median Ct of PMMoV in all samples. Amplification efficiency was 101.09% for the PMMoV primer set.
COVID-19 Clinical Data. Clinical data, including daily positive COVID cases, positive active COVID cases, outpatient emergency room visits due to COVID infection, and inpatient hospital visits due to COVID infection, were provided by St. Luke’s University Health Network (SLUHN) for the greater Bethlehem community and the Lehigh University Health Center for the Lehigh campus community.

3. Results

3.1. Detection of PMMoV in Wastewater Samples

PMMoV was detected in all wastewater samples from both sampling sites. The average Ct value for PMMoV in Bethlehem WWTP and Lehigh University samples was 28.5 ± 2.94 (Figure S1) and 30.91 ± 3.57 (Figure S2), respectively.

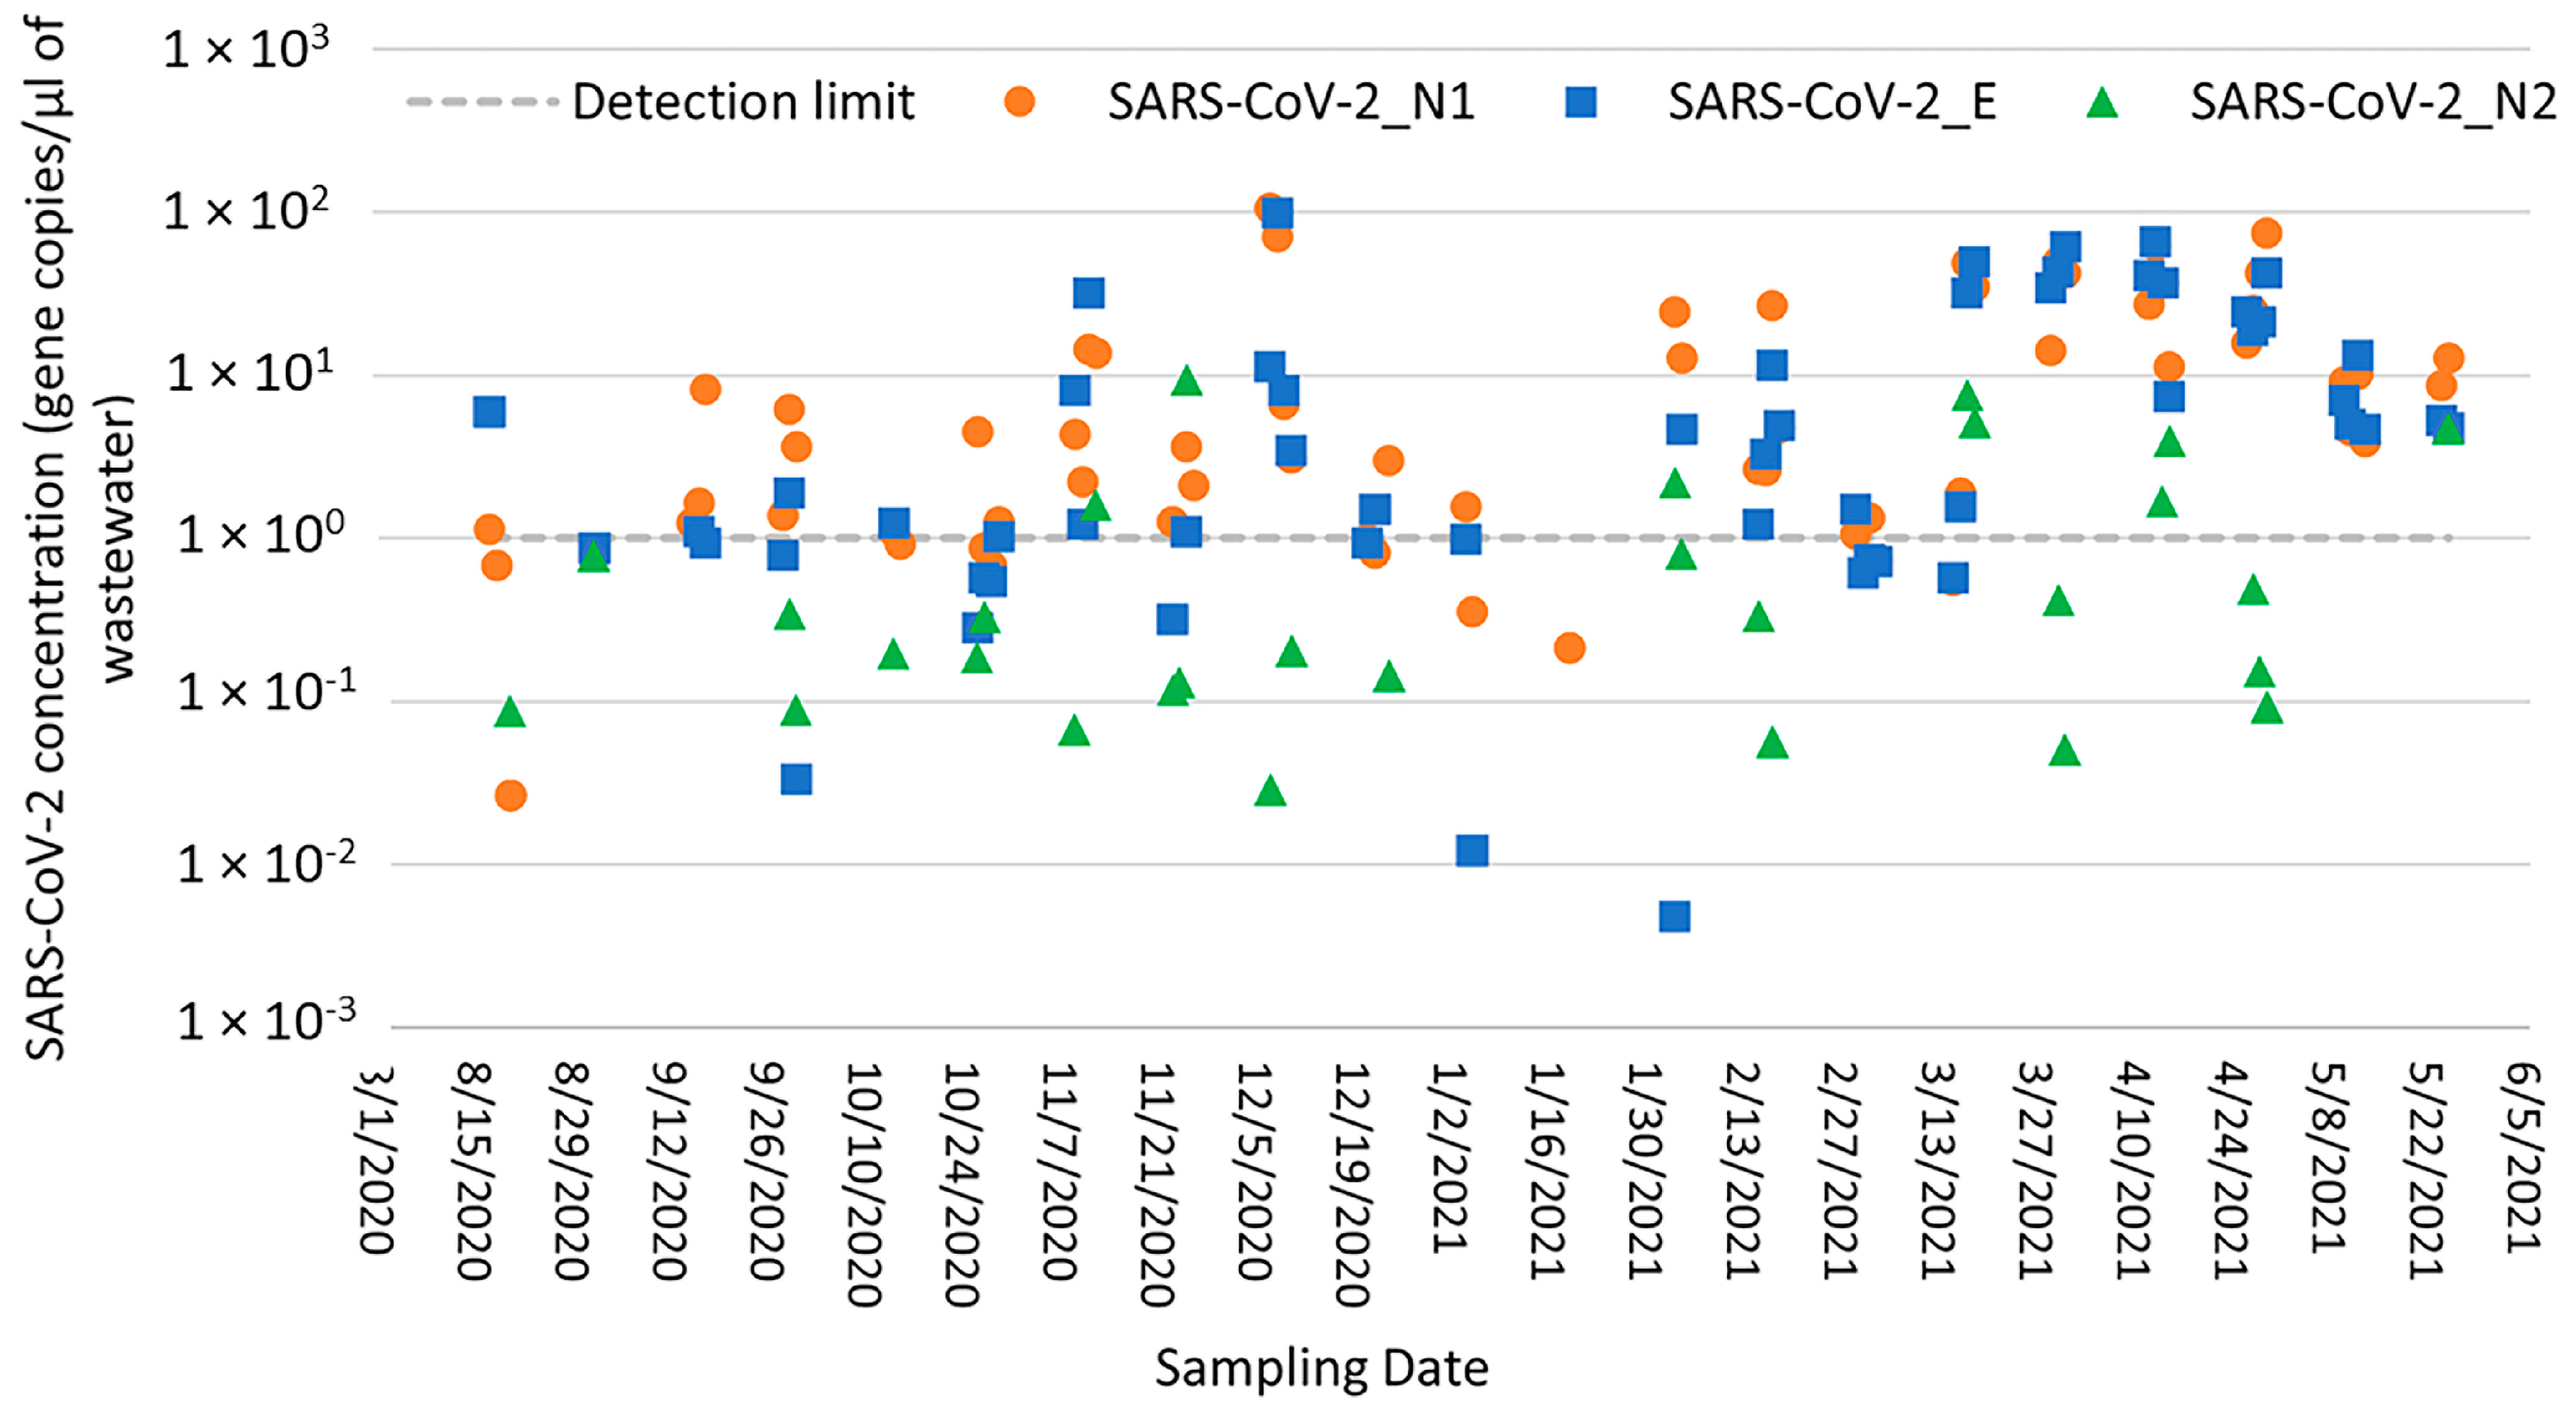
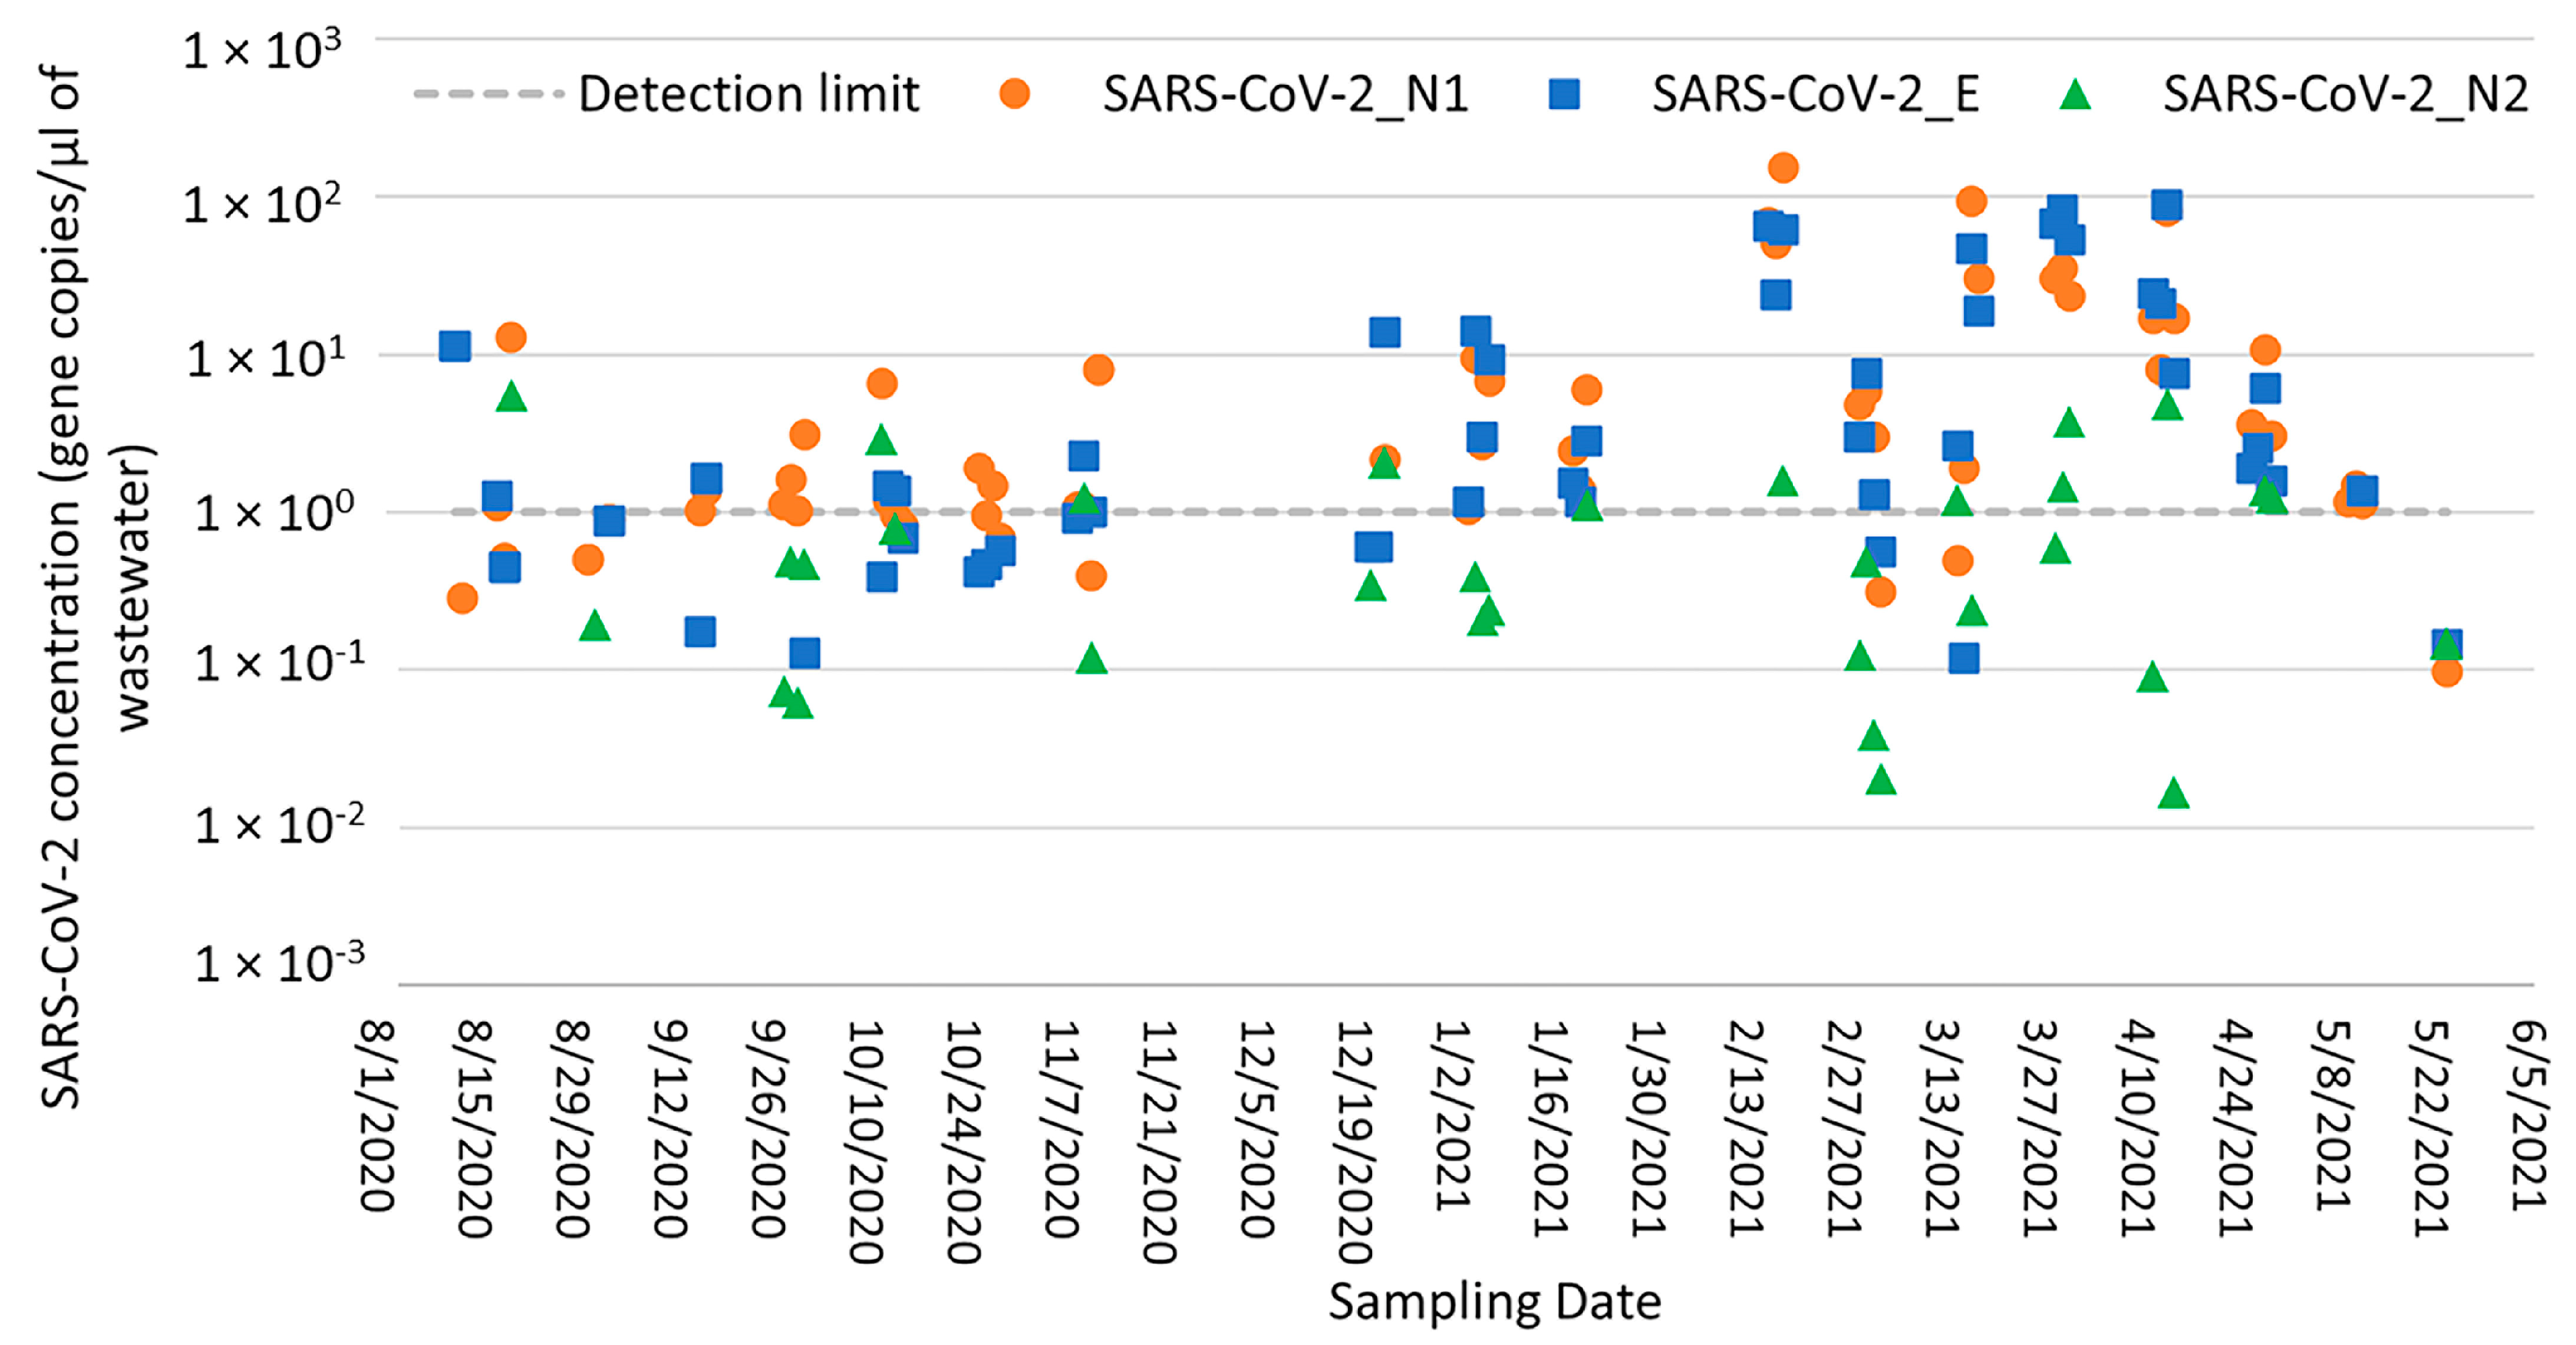
3.2. Detection of SARS-CoV-2 RNA in Wastewater Samples

Out of 73 wastewater samples collected from the Bethlehem WWTP from August 2020 through May 2021, a total of 62 (84.9%), 52 (71.2%), and 28 (38.4%) samples tested positive for SARS-CoV-2 with the N1, E, and N2 gene primers, respectively. Of the three RT-qPCR assays tested here (i.e., targeting the SARS-CoV-2 N1, N2, and E genes), the N1 assay gave the highest frequency of detection and was therefore selected for further correlation studies. The Ct values for positive WWTP samples ranged from 28.1 to 39.9 across all three assays, and SARS-CoV-2 concentrations ranged from 2.19 × 10³ to 1.67 × 10⁶ gene copies/L, 1.8 × 10³ to 1.20 × 10⁶ gene copies/L, and 1.48 × 10² to 1.11 × 10⁵ gene copies/L for the N1, E, and N2 assays, respectively (Figure 2). The SARS-CoV-2 concentrations detected with the N1 and E assays were positively correlated (Spearman’s rank correlation coefficient = 0.80; p < 0.0000), and the highest concentrations were detected on 7 December 2020 for N1 and 8 December 2020 for E. This strong correlation may be related to the interior positions of the N1 and E genes compared to the distal position of N2 near the genome end, making N2 more susceptible to degradation. Notably, N2 was consistently detected in positive controls, favoring the hypothesis that the N2 gene was degraded in a number of wastewater samples.
Out of 67 wastewater samples collected from the Lehigh University sampling site, 59 (88.1%), 51 (76.1%), and 31 (46.3%) samples tested positive for SARS-CoV-2 with the N1, E, and N2 gene primers, respectively. The Ct values for positive samples ranged from 27.1 to 38.9, and SARS-CoV-2 concentrations ranged from 5.90 × 10² to 9.34 × 10⁵ gene copies/L, 8.13 × 10² to 5.31 × 10⁵ gene copies/L, and 1.27 × 10² to 3.47 × 10⁴ gene copies/L for the N1, E, and N2 assays, respectively (Figure 3). Again, the SARS-CoV-2 N1 assay gave the highest frequency of detection compared to the E and N2 assays and was therefore selected for further correlation analysis. The SARS-CoV-2 concentrations detected with the N1 and E assays were moderately correlated (Spearman’s rank correlation coefficient = 0.65; p < 0.0000), and the highest concentrations were detected on 7 January 2021 for both assays. No correlation was observed between the SARS-CoV-2 concentrations detected with the N1 and N2 assays at either the Bethlehem WWTP or Lehigh University sampling locations; SARS-CoV-2 concentrations detected with the N2 assay were consistently lower than those detected with the N1 and E assays (Figure 2 and Figure 3). These differences may be explained by the positioning of N2 on the distal end of the genome and its potential instability, as explained previously.

3.3. Recovery of SARS-CoV-2 RNA from Seeded Wastewater Samples

SARS-CoV-2 was recovered from seeded wastewater samples (that initially tested negative for SARS-CoV-2) as well as seeded nuclease-free water. For the entire processing protocol (i.e., viral concentration, RNA extraction, and RT-qPCR), recovery of SARS-CoV-2 from seeded wastewater samples ranged from 18% to 22.3% (n = 6) for the N1 gene and from 18.5% to 24.3% (n = 6) for the E gene; similarly, recovery of SARS-CoV-2 from seeded nuclease-free water ranged from 18.8% to 21.5% (n = 2) for the N1 gene and from 19.2% to 23.3% (n = 2) for the E gene. For RNA extraction and RT-qPCR portions of the protocol, recovery of SARS-CoV-2 from seeded wastewater samples ranged from 40.7% to 49.6% (n = 6) for the N1 gene and from 40.2% to 50.3% (n = 6) for the E gene; recovery from seeded nuclease-free water ranged from 44.4% to 45.2% (n = 2) for the N1 gene and from 42.2% to 42.5% (n = 2) for the E gene. For the viral concentration protocol, recovery of SARS-CoV-2 from seeded wastewater samples ranged from 22.7% to 27.3% (n = 6) and from 21.7% to 26% (n = 6) for the N1 and E genes, respectively; similarly, recovery from seeded nuclease-free water ranged from 23.7% to 25.6% (n = 2) and from 19.2% to 23% (n = 2) for the N1 and E genes, respectively. Viral losses with the wastewater solids during centrifugation were estimated to range 8.2% to 10.8% (n = 6) and 9.4% to 10.9% (n = 6) for the N1 and E genes, respectively.

3.4. PCR Inhibition Test Assessment

The presence of PCR inhibitors was assessed in wastewater for samples that yielded no detection (negative results) and samples with low SARS-CoV-2 concentration (Ct > 35) during initial testing by RT-qPCR. None of these samples were found to be impacted by PCR inhibitors as the Ct values obtained for the seeded wastewater were within one Ct value of the reference value obtained for seeded nuclease-free water (for the N1, N2, and E genes). Figure 4 shows that the range of wastewater quality characteristics for the samples included in the inhibition tests was representative of the overall sample set.

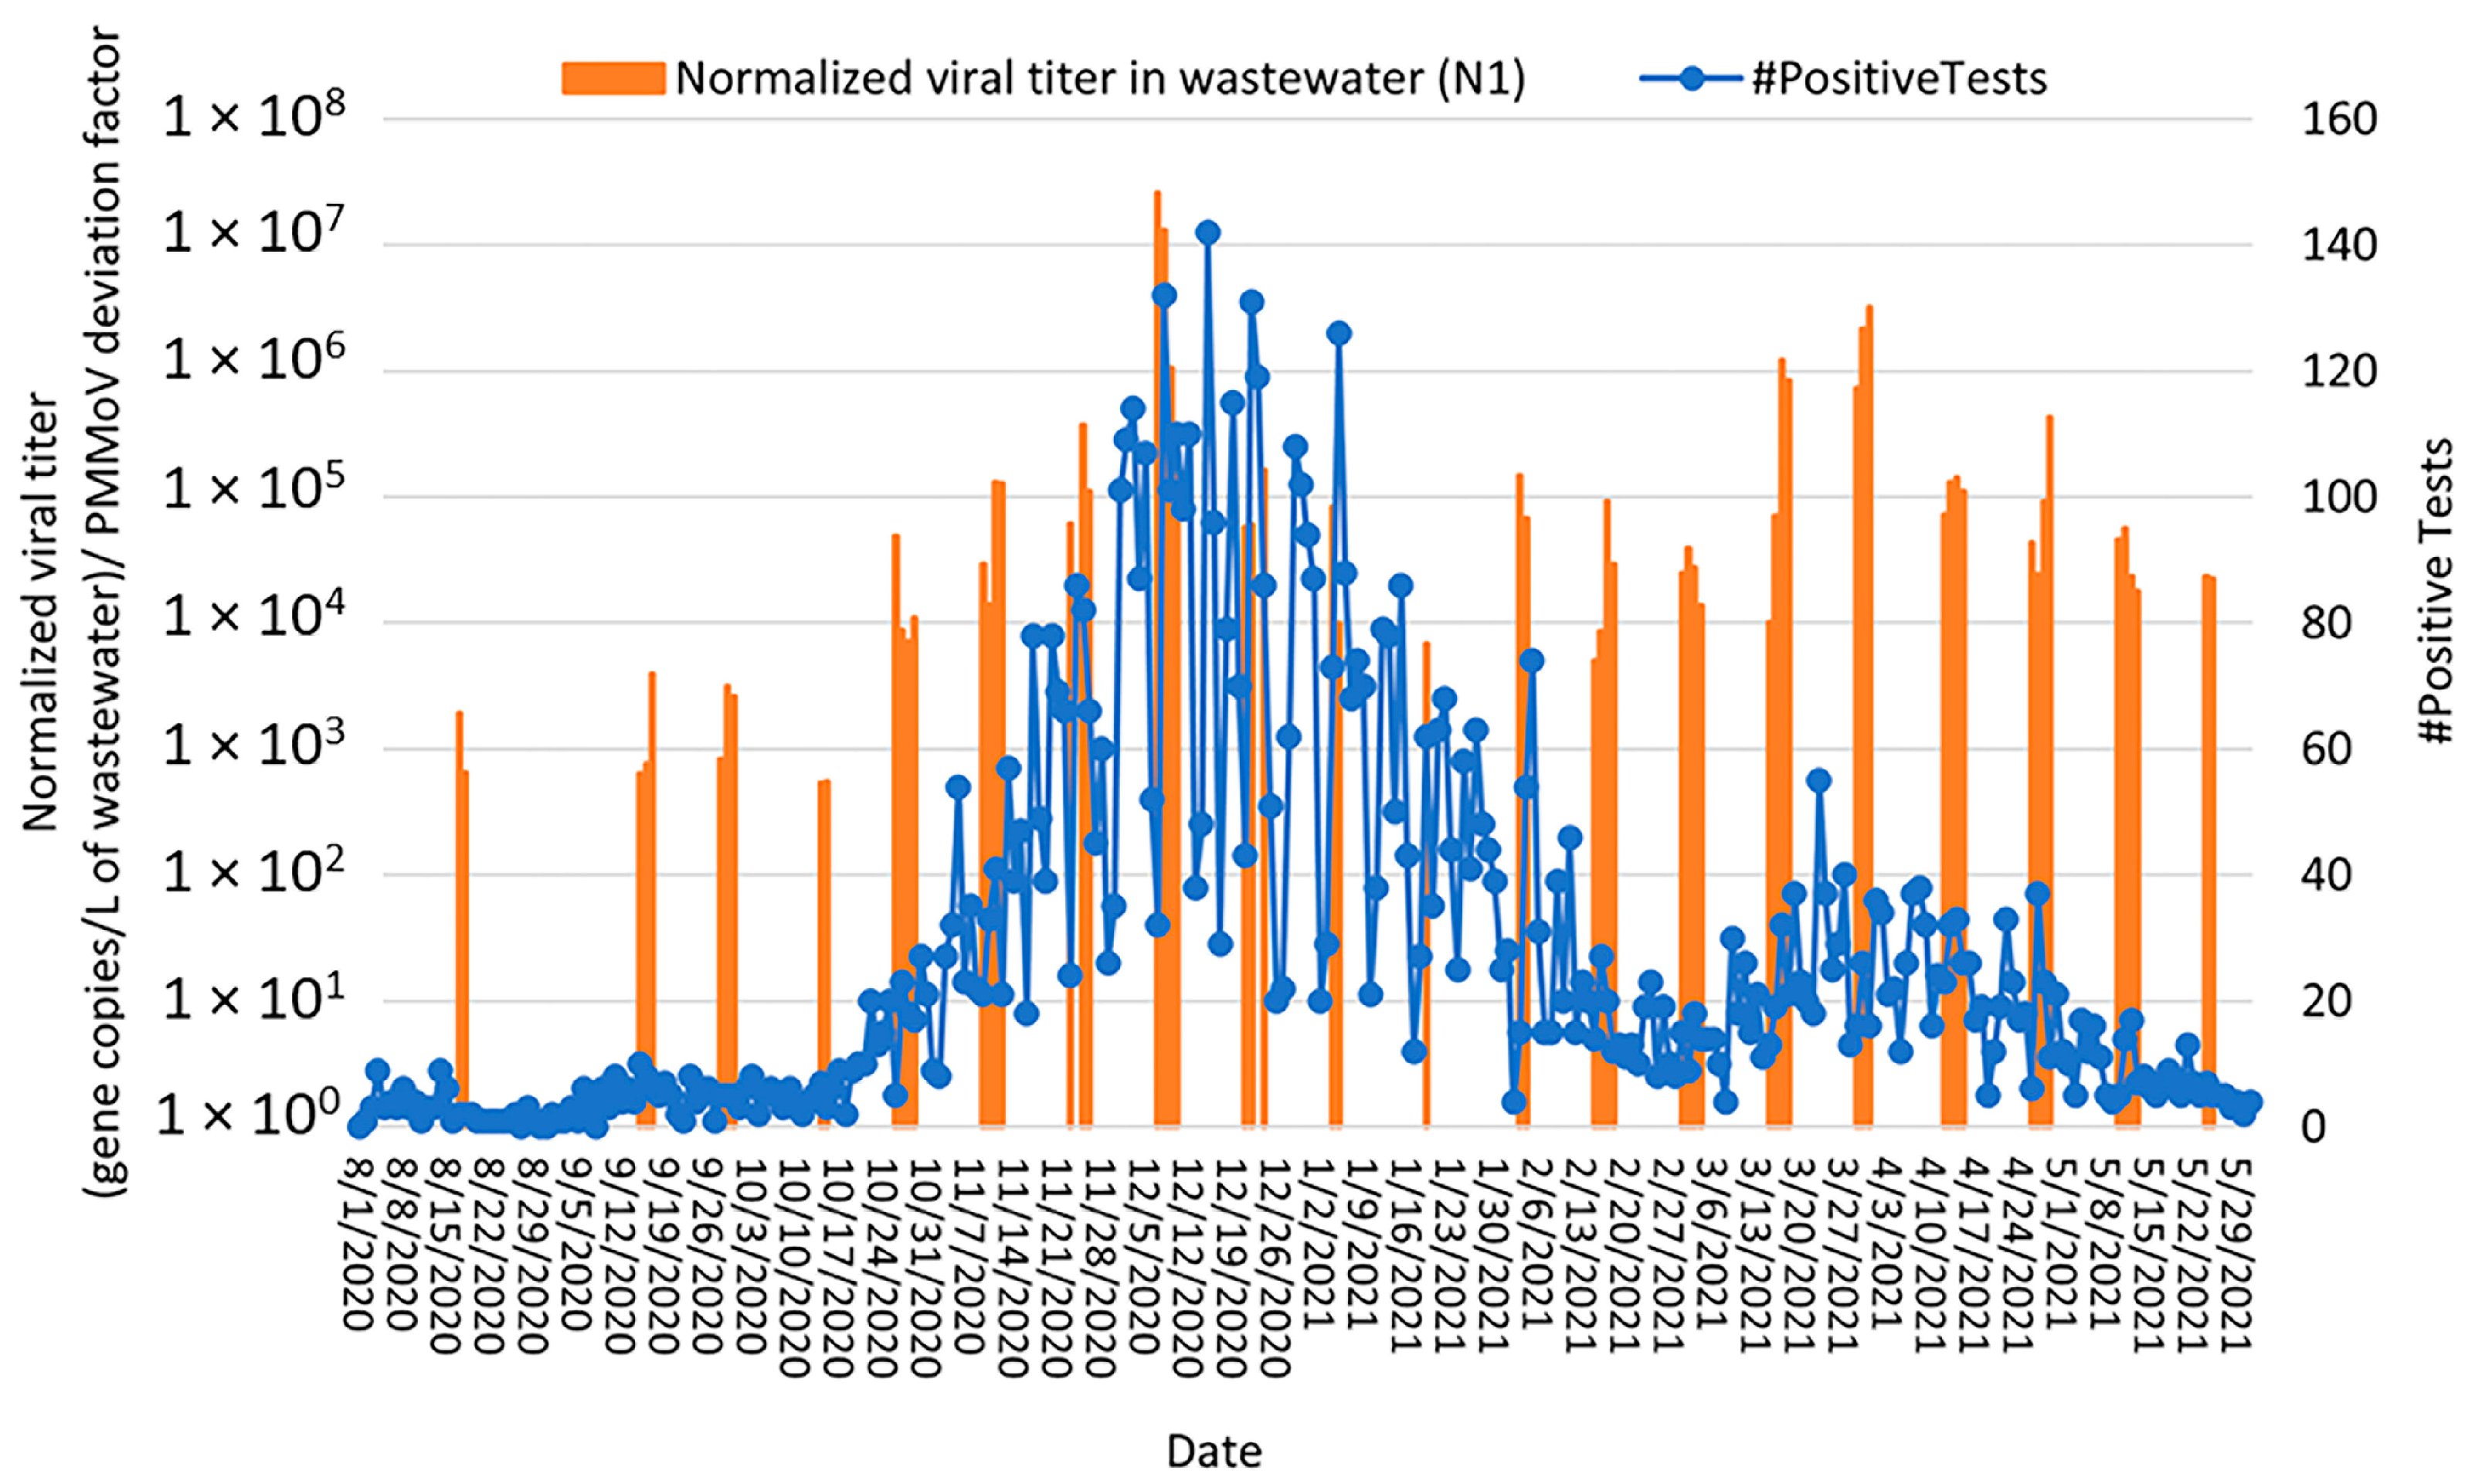
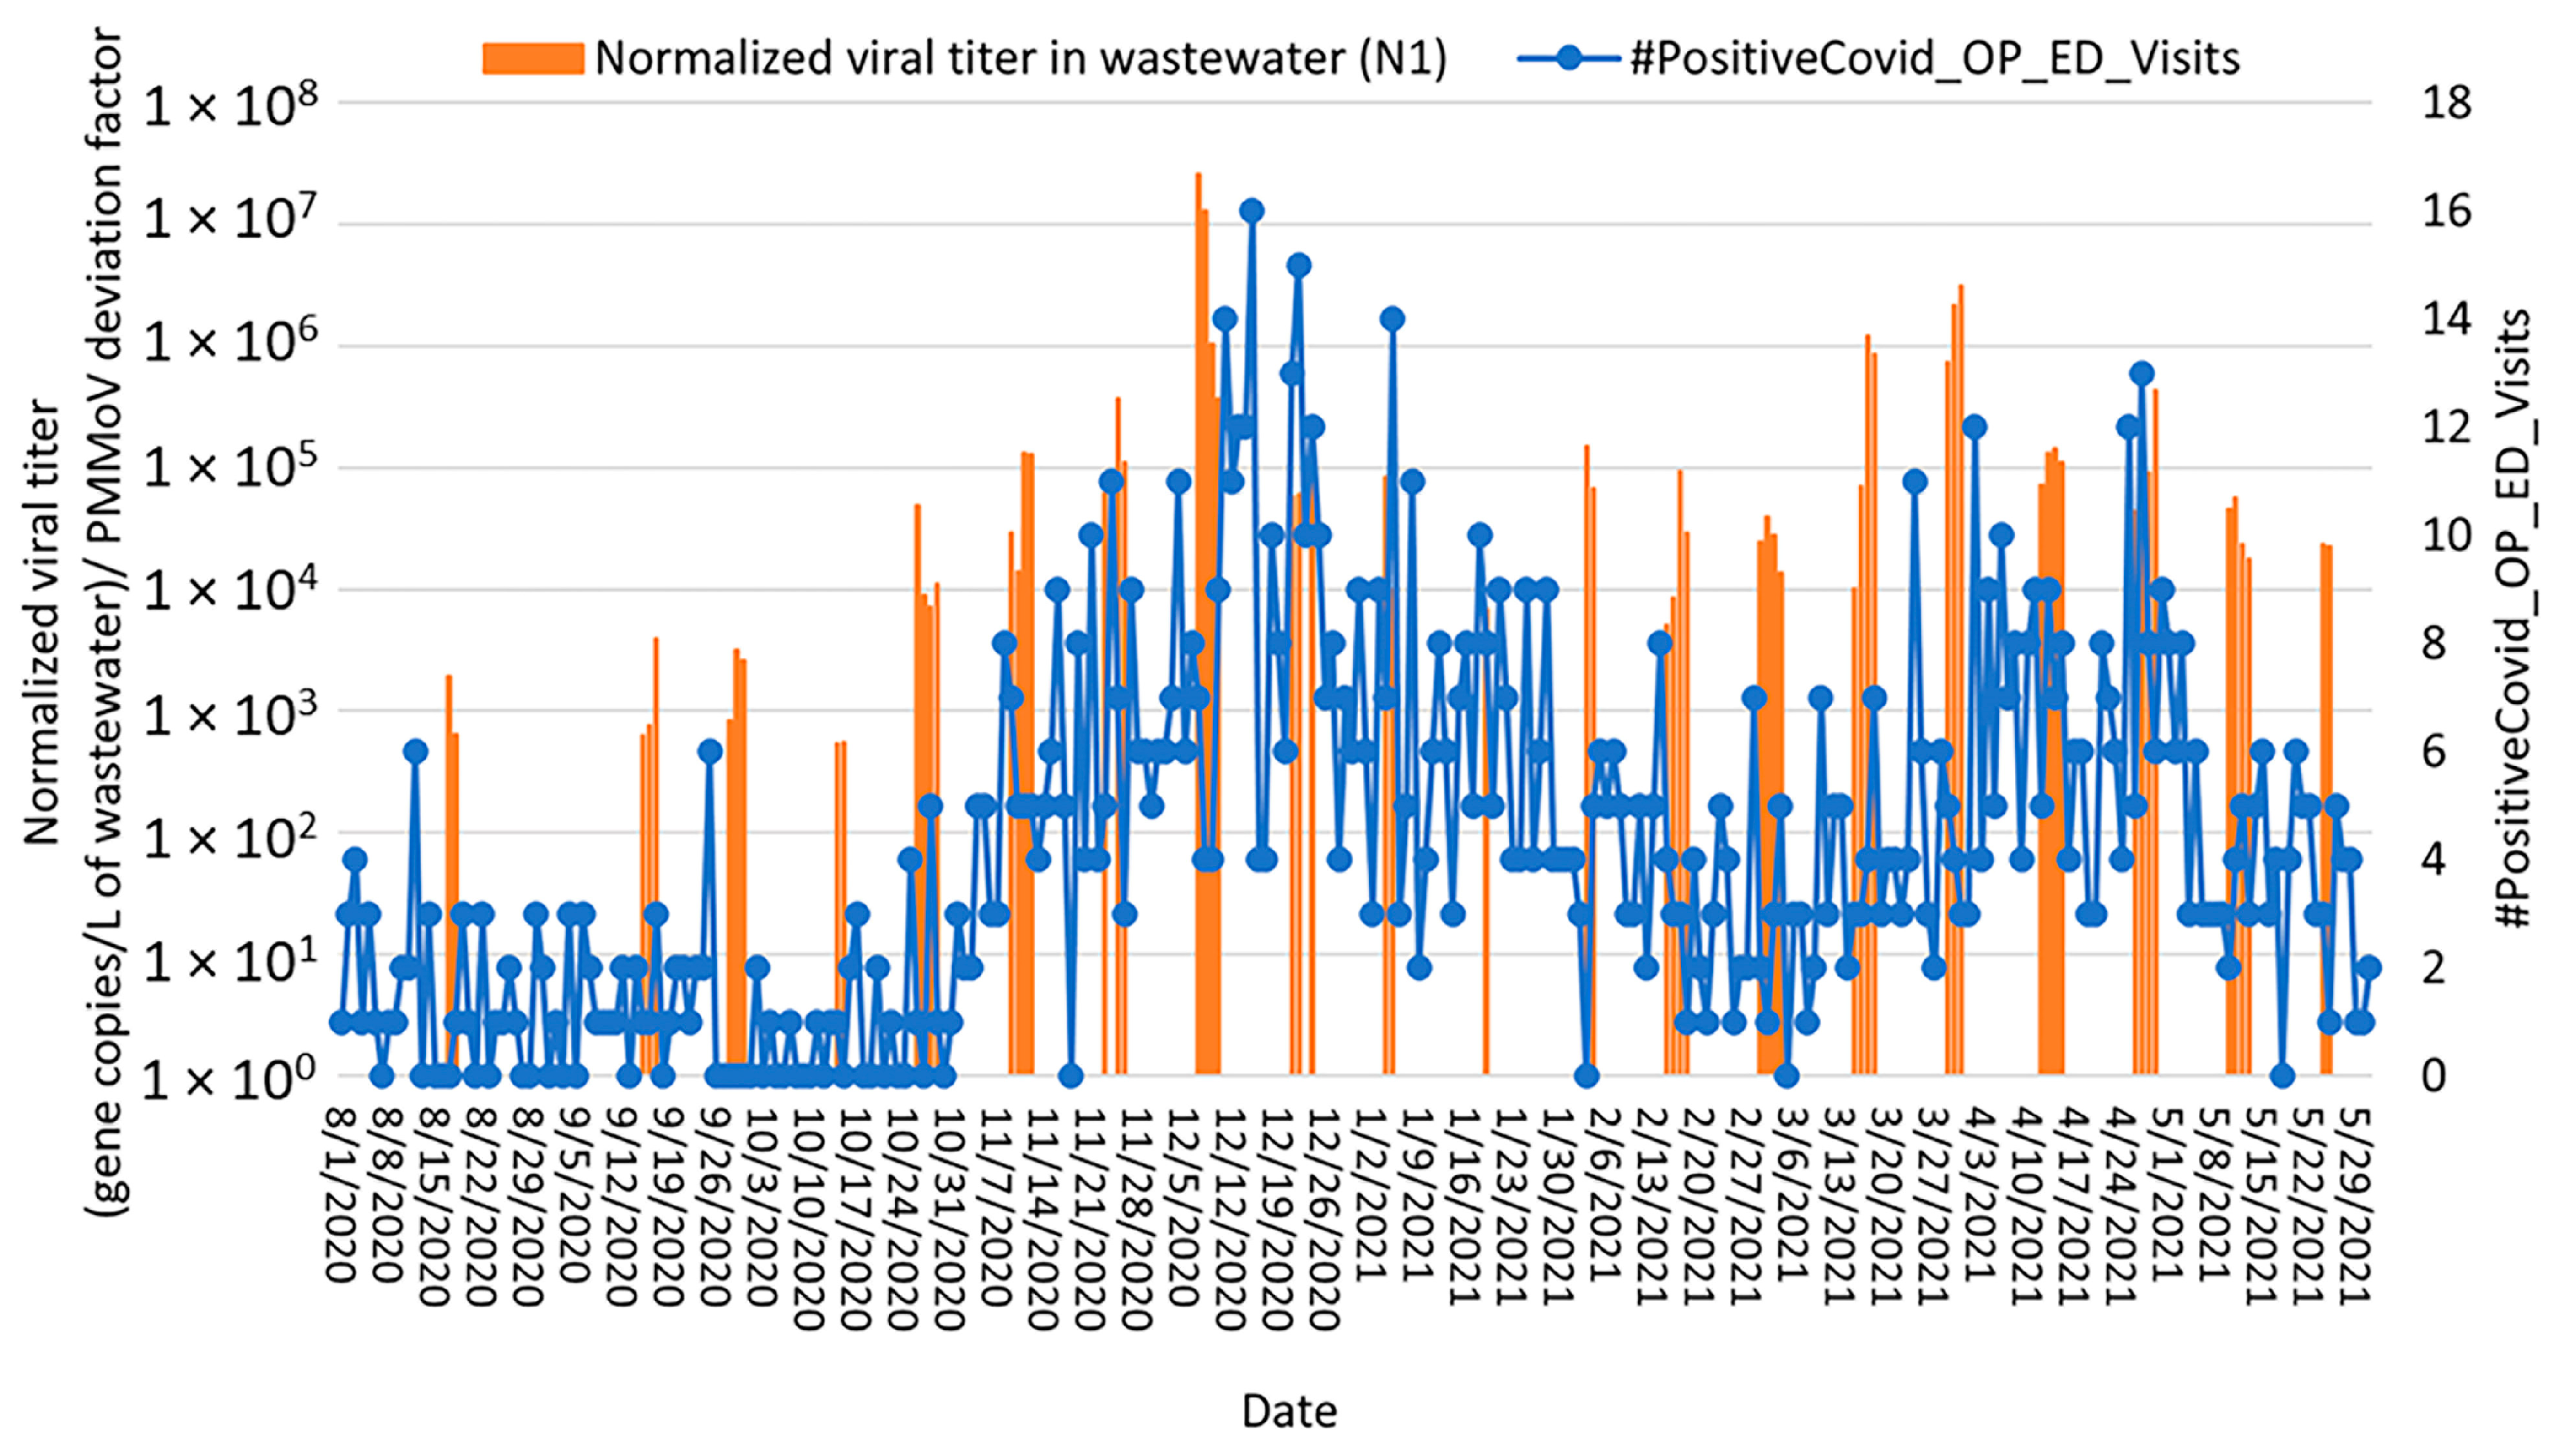
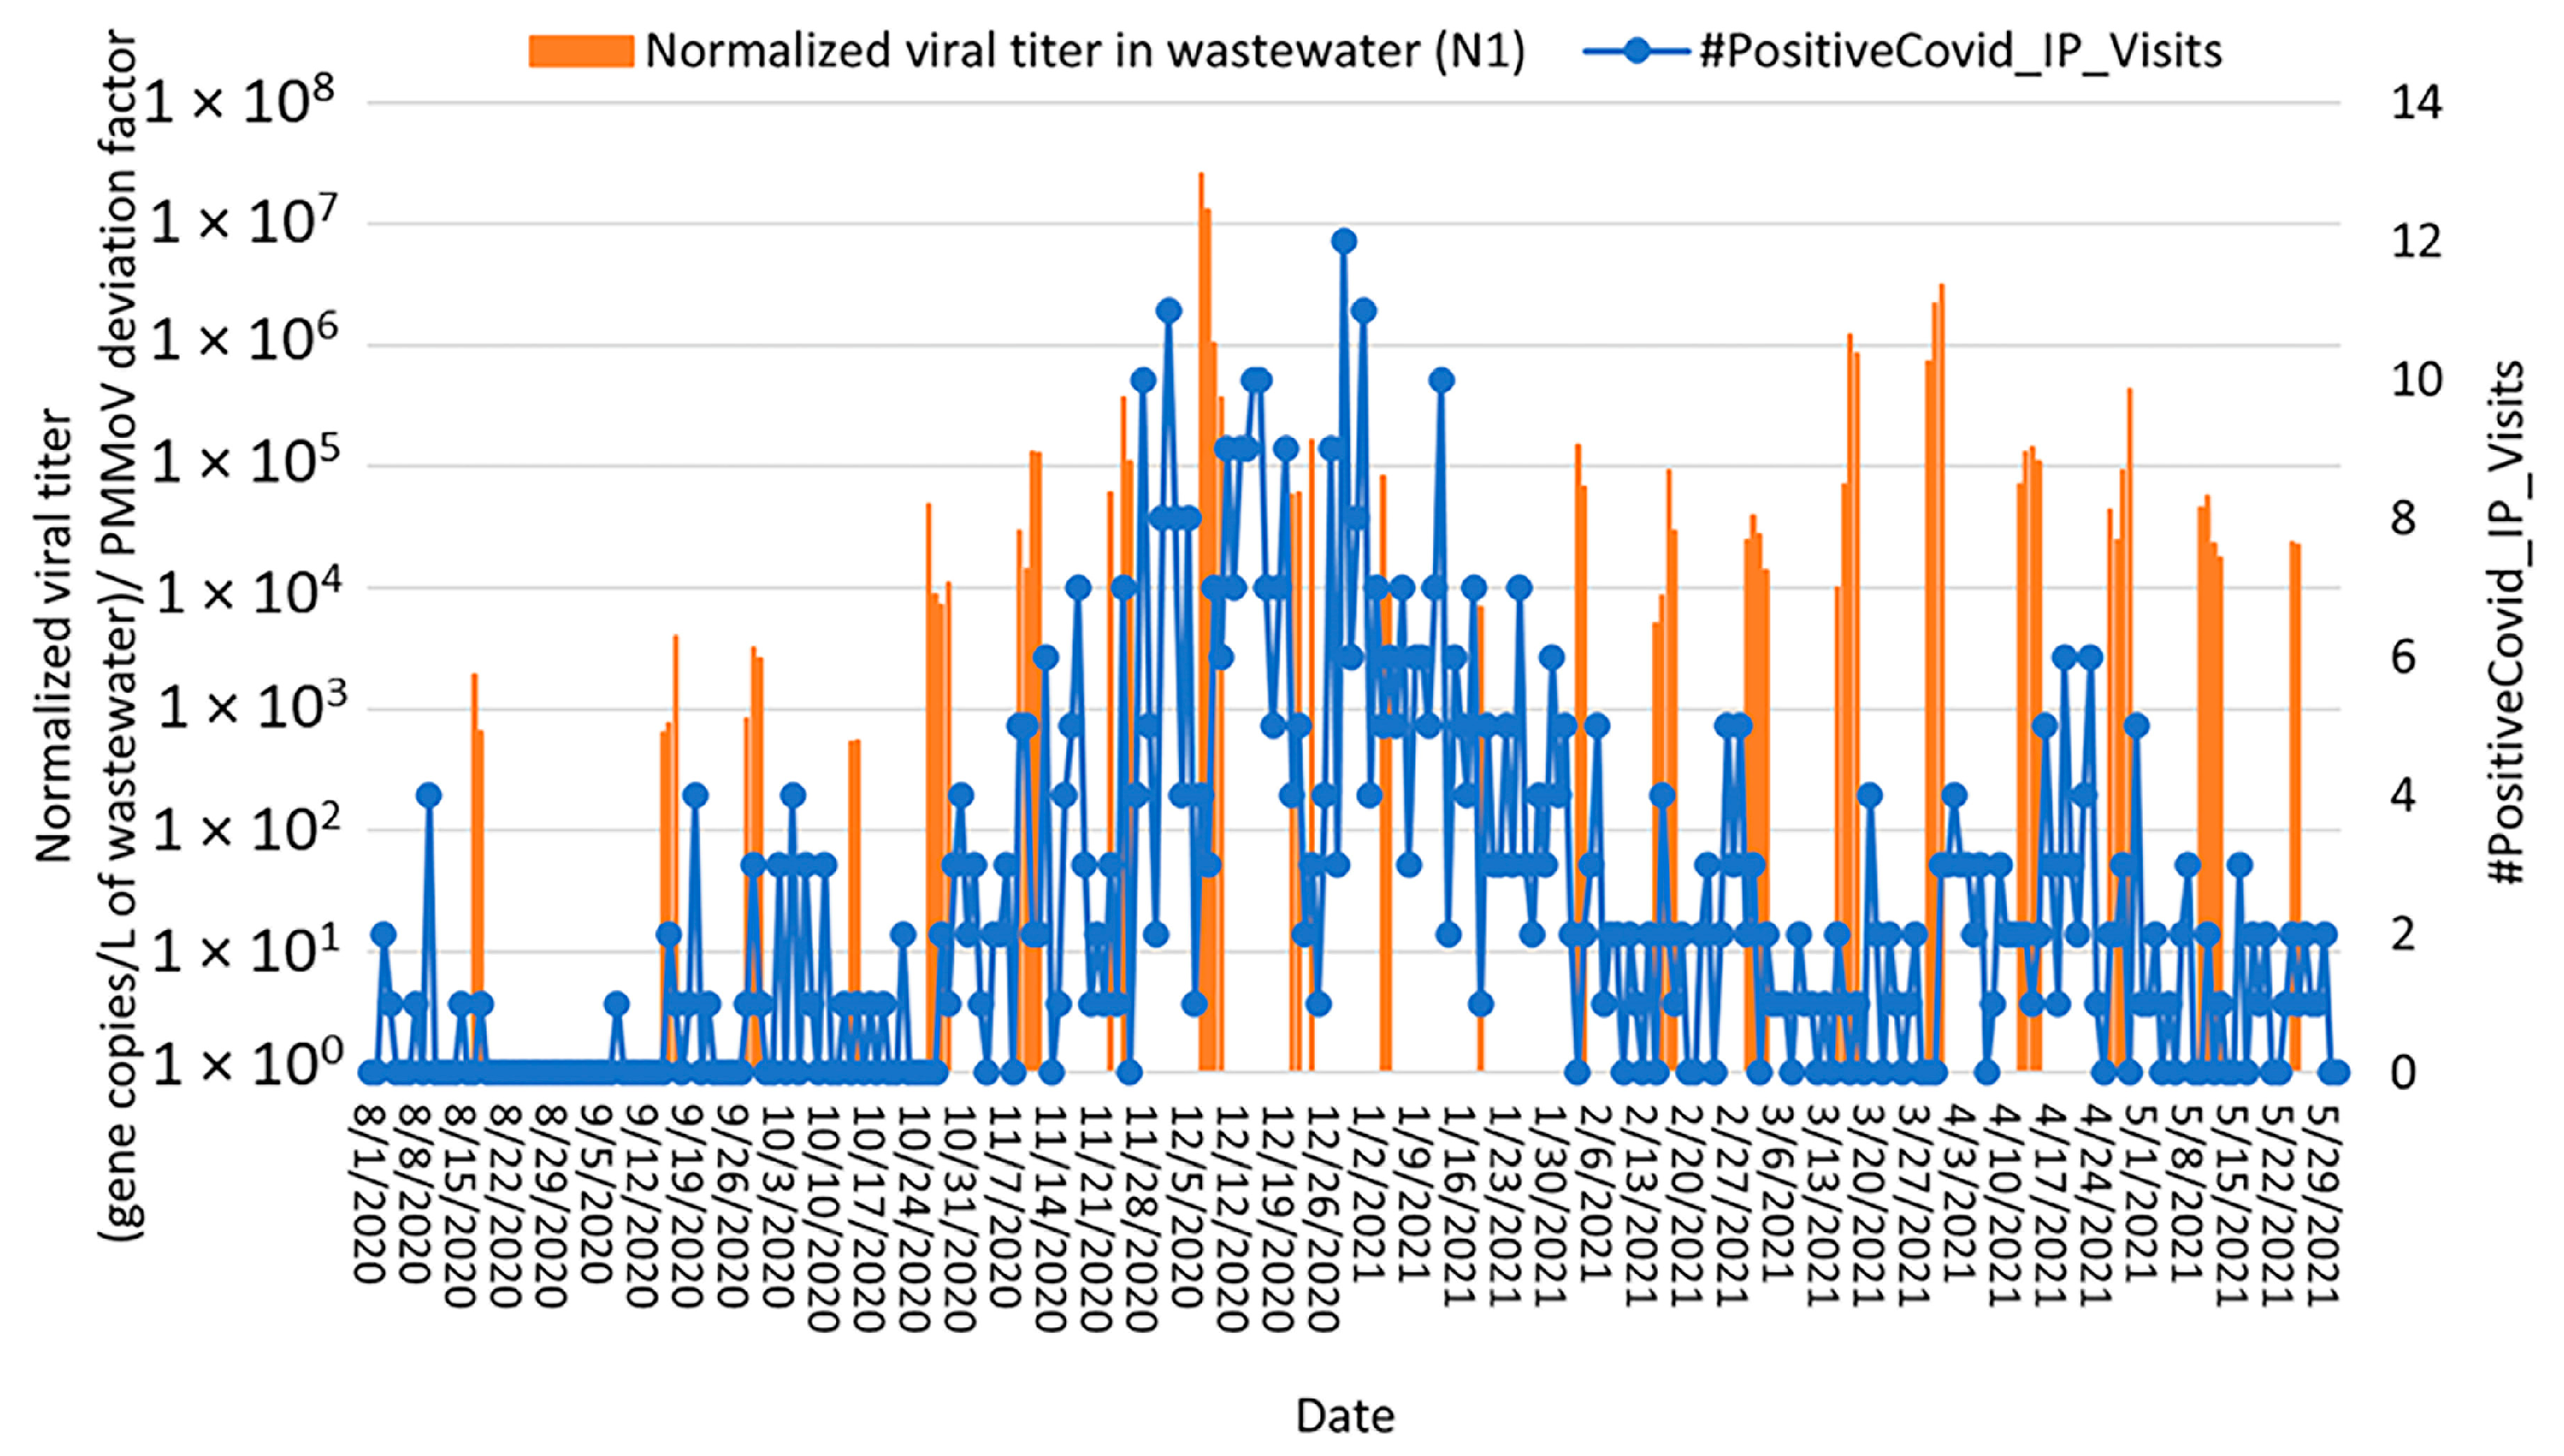
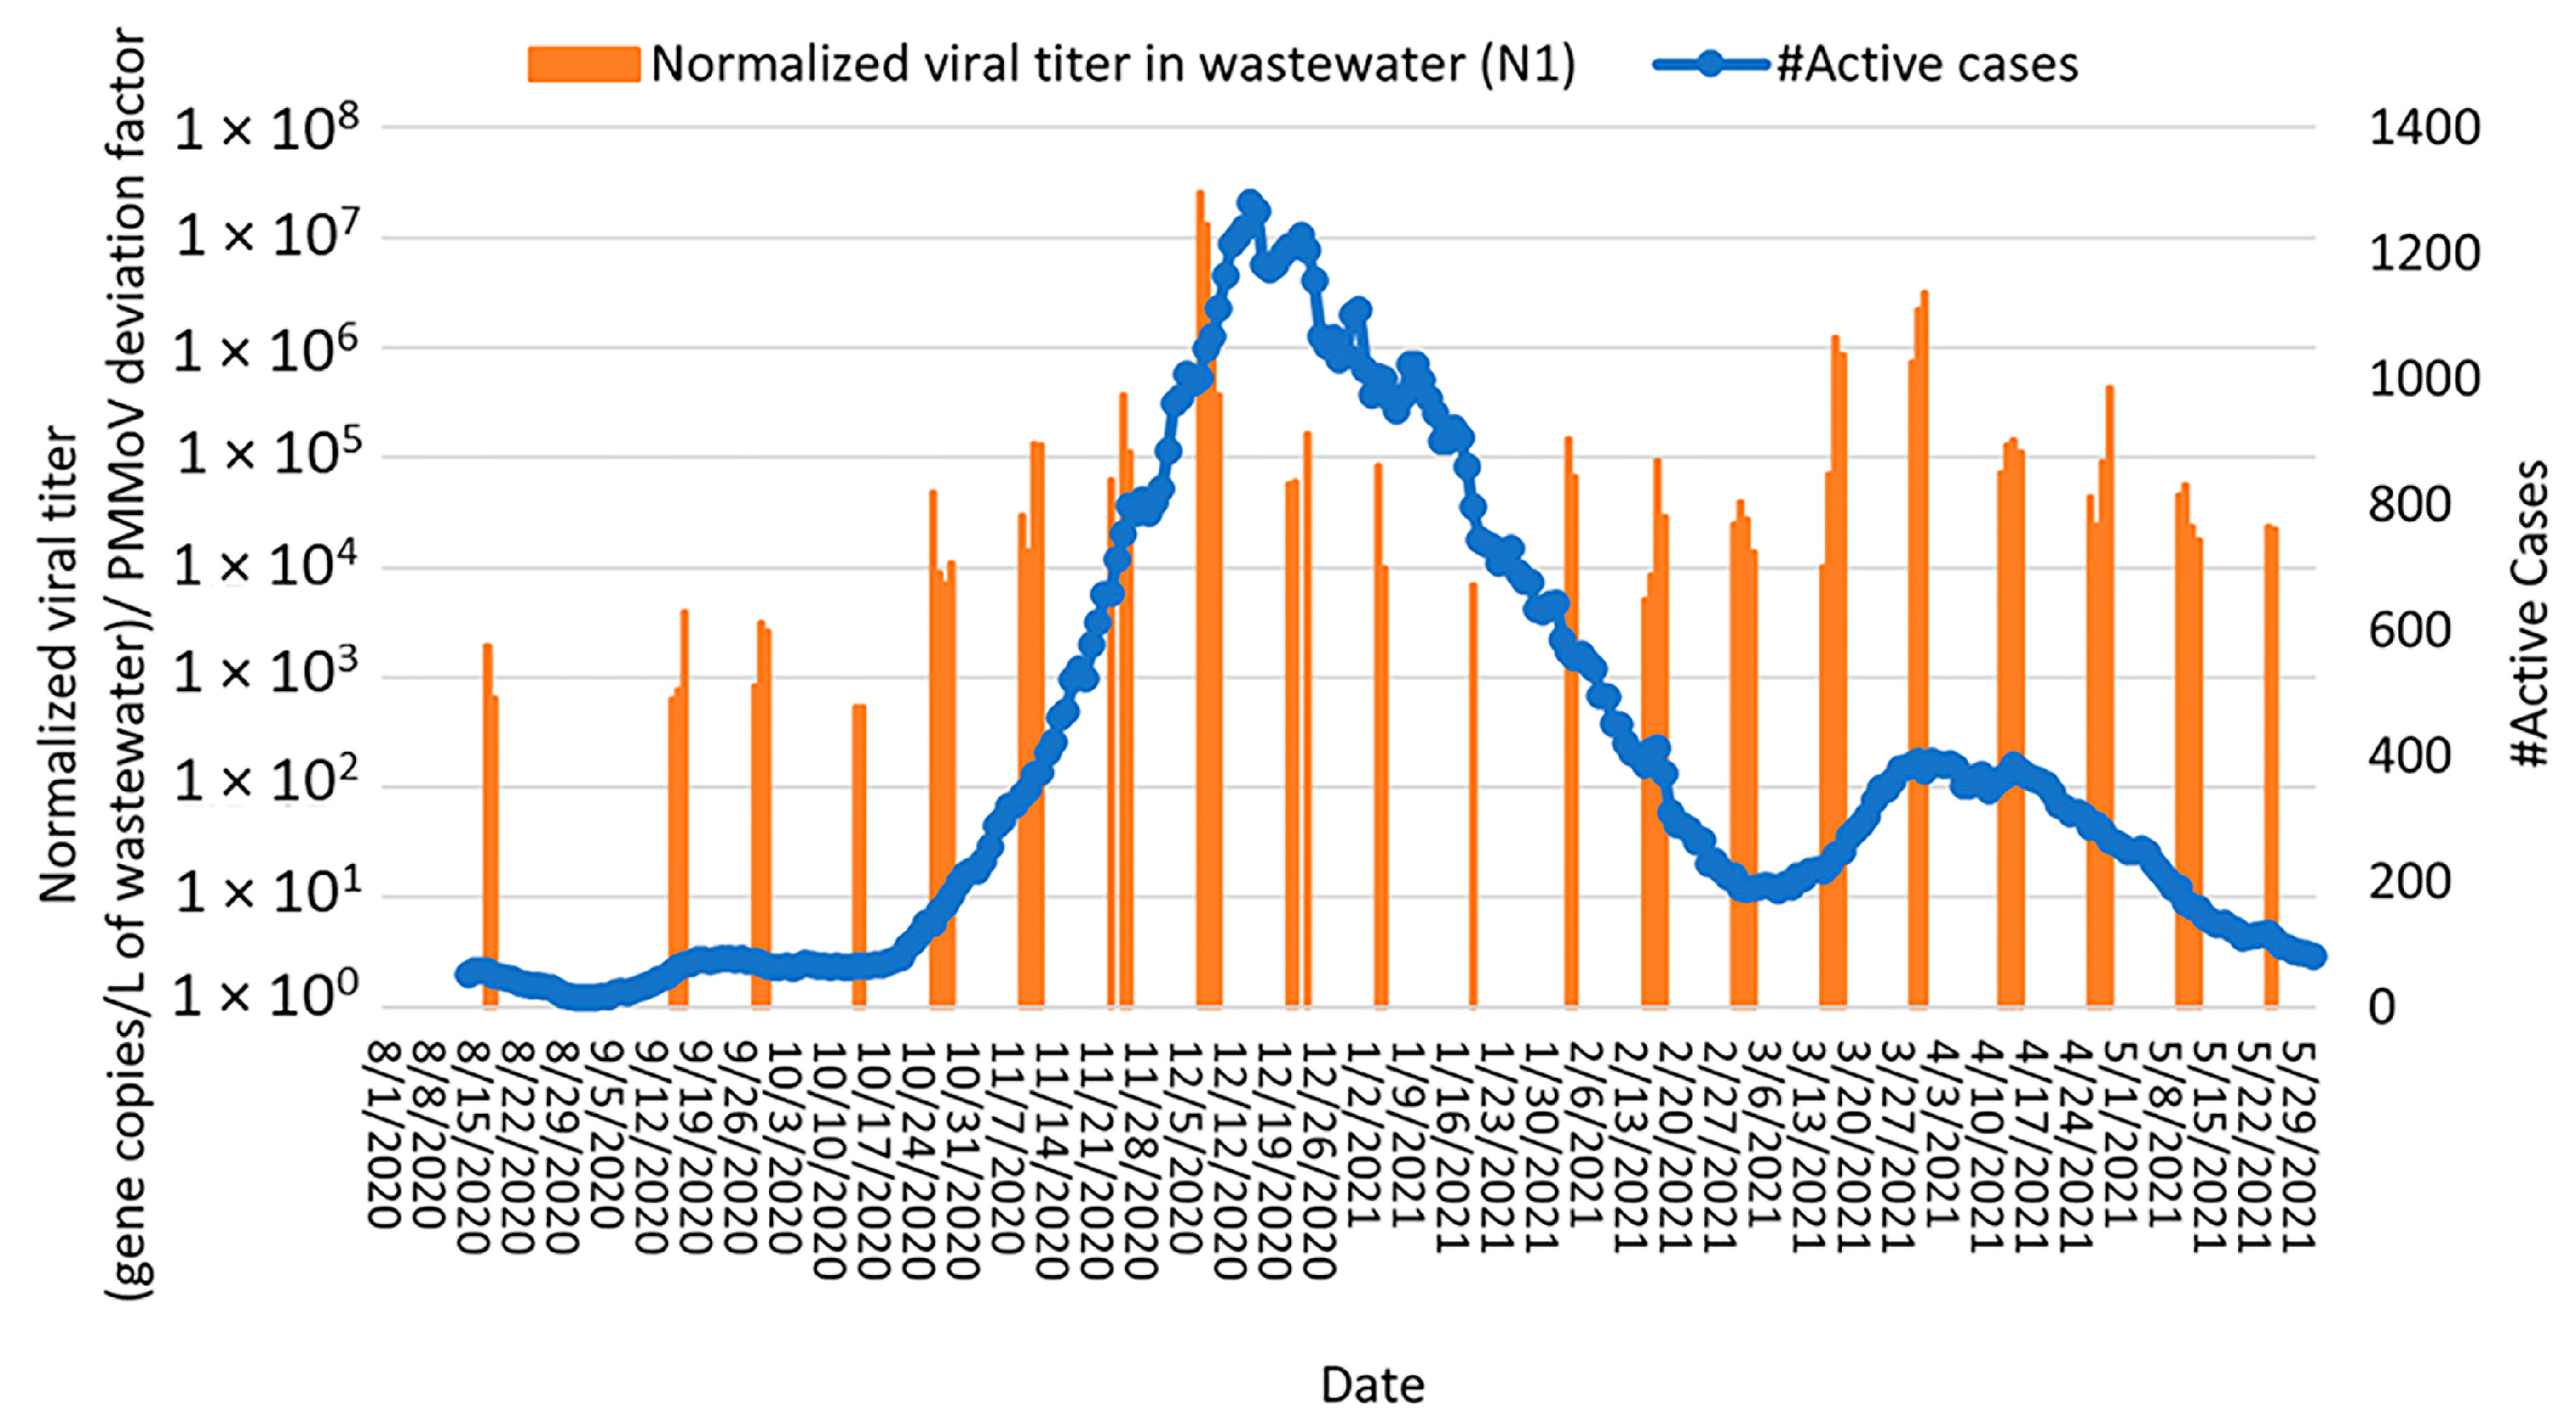
3.5. Correlation of COVID-19 Clinical Data with Normalized SARS-CoV-2 RNA Concentrations in the Bethlehem WWTP

COVID-19 health data for the greater Bethlehem community (representing the population served by the Bethlehem WWTP) included daily positive cases, active cases of COVID-19 within the past 14 days, new patients seeking medical care at the emergency room (ER) but not admitted to the hospital, and new patients admitted to the hospital. For this 38-week study, the daily number of positive COVID-19 cases was compared to the PMMoV-normalized SARS-CoV-2 RNA concentrations detected in wastewater (Figure 5). Two peaks in COVID-19 cases (December 2020 and March 2021, respectively) were observed in the community health data; for the first peak, SARS-CoV-2 loads in wastewater peaked at least 7 days prior to the peak in positive COVID tests, supporting the use of wastewater surveillance as an early warning system for disease transmission in the community. SARS-CoV-2 loads in wastewater increased at the Bethlehem WWTP from 17th August 2020, peaked on 7th December 2020, and decreased through February 2021. During this period, a positive correlation was observed between the daily positive cases and the normalized SARS-CoV-2 wastewater concentrations (Spearman rank correlation coefficient ρ = 0.72 and 0.61 for the N1 and E genes, respectively, p < 0.0000) (Figure 5 and Figure S3), indicating that the concentration of SARS-CoV-2 RNA in the wastewater followed the trend of COVID-19 clinical data and that wastewater surveillance for SARS-CoV-2 may potentially serve as an early warning system for community transmission.
For the second peak (March 2021), SARS-CoV-2 loads in wastewater peaked at about the same time as the community COVID-19 cases, which may be a result of the wastewater not being sampled every day (leaving the possibility that the actual wastewater peak was missed). For February through May 2021 (the time period spanning the second peak), detection of the N1 and E genes was weakly correlated with the COVID-19 case numbers detected (i) on the same day of wastewater sampling (Spearman rank correlation coefficient ρ = 0.41 and 0.4 for the N1 and E genes, respectively, p < 0.0000) and (ii) a week after wastewater sampling (Spearman rank correlation coefficient ρ = 0.26 and 0.23 for the N1 and E genes, respectively p < 0.0000) (Figure 5). Notably, the SARS-CoV-2 RNA levels decreased from March 2021 to May 2021, which corresponded with the decline in daily positive COVID-19 cases and the availability of vaccines in our study area. The overall lower number of daily positive cases in the second peak, combined with the similar magnitude of virus detection in wastewater, is also likely due to widespread vaccination in spring 2021 (especially people working on the front lines of health care and public service, as well as elderly people and individuals with underlying health conditions) as similar levels of virus transmission would lessen clinical symptoms and subsequent COVID testing in a vaccinated population.
Two peaks in the number of positive cases that visited the emergency department (ER) at St. Luke’s University Health Network (but were not admitted to the hospital) were observed in the community health data (in December 2020 and March/April 2021, respectively). Over the study period, the virus loads in wastewater peaked more than a week before the positive cases that visited the ER. From August 2020 to January 2021 (the first peak), the highest correlation was observed (Figure 6 and Figure S4) between the normalized viral RNA signal and the number of positive cases that visited the ER two weeks after each wastewater sampling (Spearman rank correlation coefficient, ρ = 0.74 and 0.67 for N1 and E genes, respectively, p < 0.0000). From February 2021 to May 2021 (the second peak), the highest correlation was observed for positive cases that visited the ER 11 days after each wastewater sampling (Spearman rank correlation coefficient, ρ = 0.63 and 0.60 for N1 and E genes, respectively, p < 0.0000).
Two peaks in the number of the hospitalized patients due to COVID-19 (December 2020 and April 2021; Figure 7 and Figure S5) were observed in the Bethlehem community health data. During the first peak, the increase in SARS-CoV-2 concentration in wastewater correlated with the number of newly hospitalized patients with COVID-19. The highest correlation was observed when wastewater data preceded health data by 12 days (Spearman rank correlation coefficient, ρ = 0.74 and 0.58 for N1 and E genes, respectively, p < 0.0000). For the second peak, a weak correlation was observed between the number of the hospitalized patients due to COVID-19 and the detection of both N1 and E genes. The highest correlation was observed with a lag time of 9 days (Spearman rank correlation coefficient, ρ = 0.46 and 0.40 for N1 and E genes, respectively, p < 0.0000).
Two waves of active COVID-19 cases (defined as the cumulative case count for the past 14 days) were observed in December 2020 and March/April 2021, respectively (Figure 8 and Figure S6). During the December 2020 wave, an increase in SARS-CoV-2 concentrations in wastewater corresponded to an increase in active COVID-19 cases. SARS-CoV-2 concentrations in wastewater peaked at least 7 days prior to the active case peak (with a maximum correlation coefficient 12 days prior; Spearman rank correlation coefficient, ρ = 0.77 and 0.52 for N1 and E genes, respectively, p < 0.0000), demonstrating the utility of wastewater surveillance as an early warning system for COVID-19 transmission within a population. Similarly, during the March/April 2021 wave, SARS-CoV-2 concentrations in wastewater showed a moderate correlation with active COVID-19 cases 7 days after wastewater sampling (Spearman rank correlation coefficient, ρ = 0.63 and 0.62 for N1 and E genes, respectively, p < 0.0000) (Figure 8 and Figure S6). Correlations between SARS-CoV-2 concentrations in wastewater and active COVID-19 cases were stronger than correlations between SARS-CoV-2 wastewater concentrations and new COVID-19 cases, possibly due to the fact that active cases reflect the total number of individuals confirmed as positive and shedding virus into the wastewater while the new cases reflect only the reported cases on a particular day. Moreover, the number of active cases offers a more comprehensive view of the virus’s presence in a community, whereas the number of new cases may fluctuate due to daily variations in testing capacity, delays in reporting positive cases, and changes over time in testing criteria.

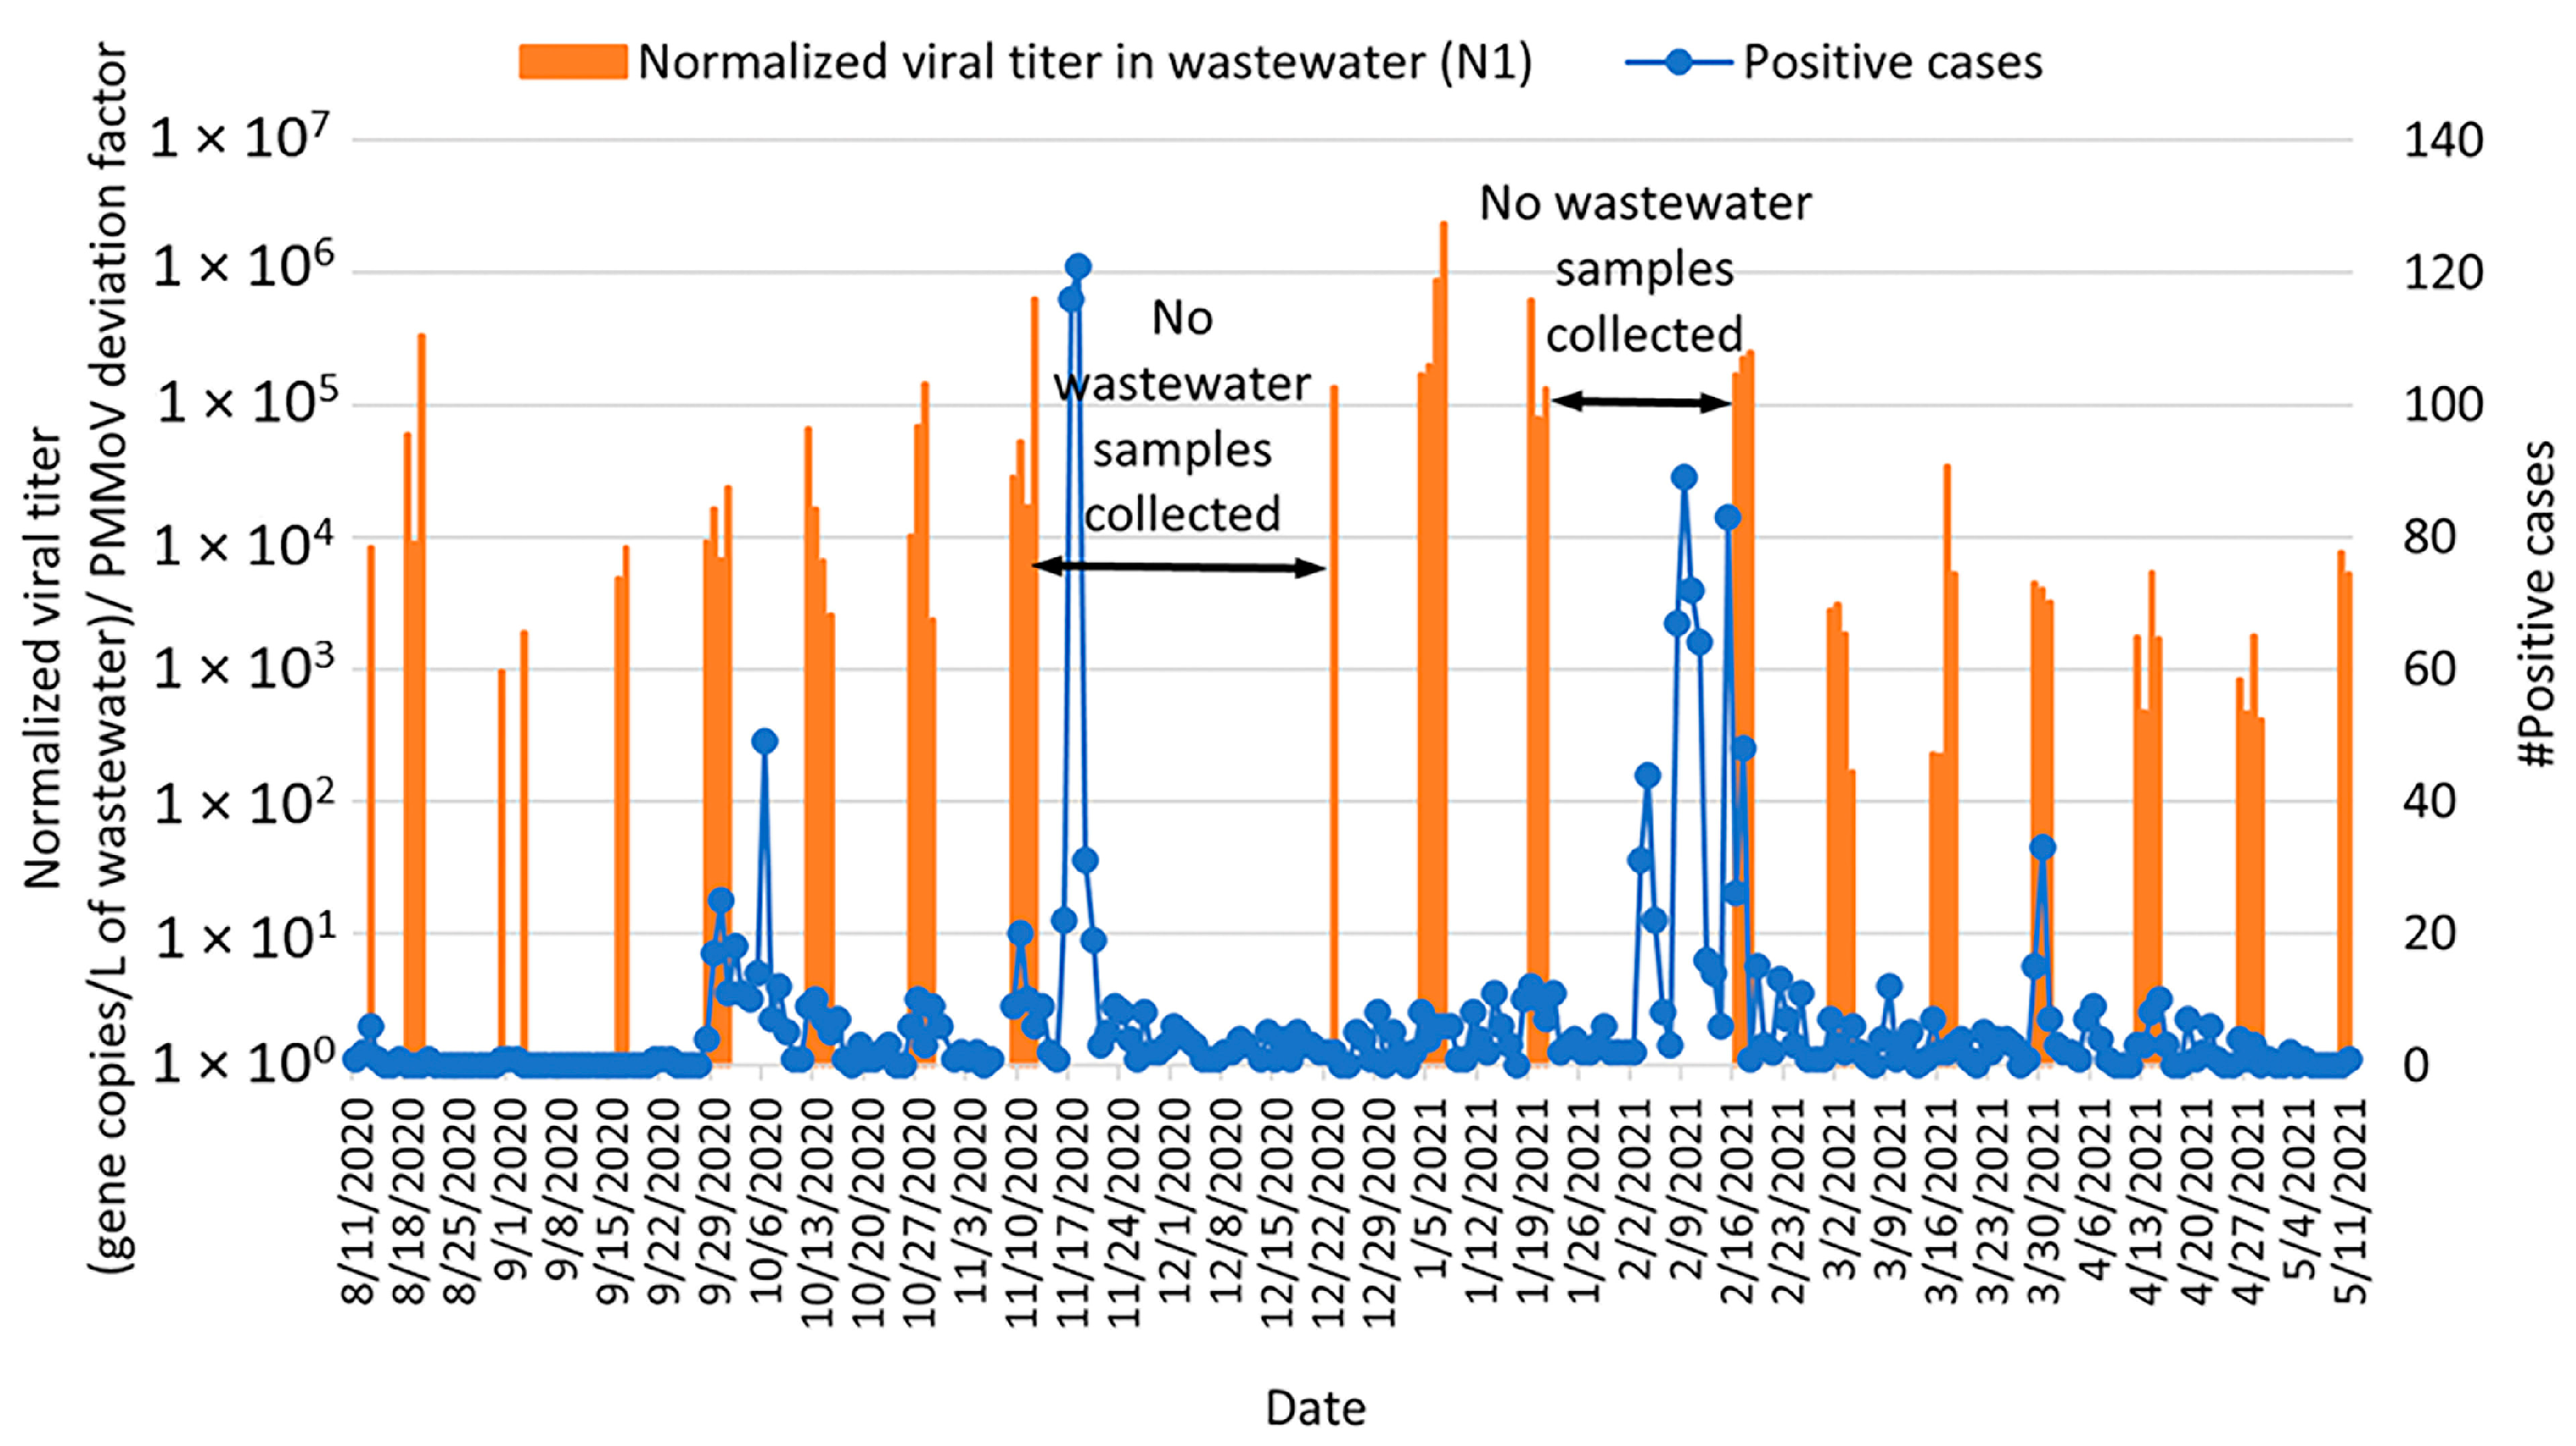
3.6. Correlation of COVID-19 Clinical Data with Normalized SARS-CoV-2 RNA Concentrations in Lehigh University Wastewater

SARS-CoV-2 detection (normalized by PMMoV concentration) in wastewater effluent from Lehigh University is shown in Figure 9 and Figure S7; PMMoV was detected in all wastewater samples collected over the sample period. In general, the observed temporal changes in PMMoV as a human fecal marker were consistent with the timing of students’ arrival to and departure from campus each semester (Figure S2). SARS-CoV-2 RNA was detected during the week of 12–19 August 2020, when some students had returned to campus prior to the start of the fall semester. From September through October 2020, a consistent level of SARS-CoV-2 was detected in campus wastewater without a dramatic spike in community viral loads. It is important to note that there were no wastewater sampling events from 12 November 2020 to 20 December 2020 and from 22 January to 15 February 2021 due to staffing shortages at the Bethlehem WWTP. From 12 August 2020 to 31 December 2020, a total of 787 cases of COVID-19 were detected among students, staff, and faculty at Lehigh University (Figure 9 and Figure S7). Although SARS-CoV-2 RNA was not detected in wastewater on 21–22 December 2020 by the N1 primer set, it was detected by the E primer set with an average concentration of 1.54 × 10⁵ gene copies/L of wastewater (Figure S7). From 23 December 2020 through 21 January 2021, concentrations of SARS-CoV-2 RNA were higher than had been detected in fall 2020. This higher viral concentration tapered off by the end of May 2021. From 1 February 2021 to 11 May 2021, a total of 881 cases of COVID-19 were detected among the Lehigh community (Figure 9 and Figure S7).
Four peaks in COVID-19 cases (one each in October and November 2020, respectively, and two peaks in February 2021) were observed in the Lehigh University community (Figure 9 and Figure S7). For the October 2020 peak, an increase in SARS-CoV-2 concentration in wastewater was observed at the end of September compared to samples collected mid-September. For the November 2020 peak, SARS-CoV-2 loads in wastewater started to increase before wastewater sampling was paused due to staffing shortages. From 23 December 2020 to 21 January 2021, higher concentrations of SARS-CoV-2 RNA were detected compared to earlier in fall 2020, but no increase in community COVID-19 cases was observed; this is likely because the campus health center serves primarily students, and the student population is not on campus during this winter break. The two February 2021 peaks in community COVID-19 cases occurred during a period of no wastewater sampling events, so the relationship between wastewater detection and community transmission of COVID 19 is unclear for that time.

4. Discussion

This study investigated Bethlehem-area wastewater surveillance as an early indicator of changes in COVID-19 transmission in the local community, before symptomatic infections were identified and reported by public health authorities. Previous work has shown that wastewater surveillance for SARS-CoV-2 could be a sensitive tool to monitor circulation of the virus at the community level. A study conducted in Massachusetts in late March 2020 showed that the quantity of SARS-CoV-2 RNA detected in wastewater indicated a significantly higher number of people likely infected with COVID-19 than the reported clinically confirmed cases; wastewater indicated that at least 2300 people in the community were infected with COVID-19, but only 446 cases had been officially reported [43]. In this study, inconsistent positive detection among SARS-CoV-2 N1, E, and N2 genes was observed in wastewater samples collected from both the Bethlehem WWTP and Lehigh University sampling locations. Similarly, Medema et al. [36] observed inconsistent detection among N1 (58%), N2 (0%), N3 (33%), and E (21%) genes; their observation of higher N1 and lower N2 detection, compared to the other genes, matched the findings in this study as well. Randazzo et al. [44] also found inconsistent detection rates when comparing N1 (50%), N2 (55%), and N3 (64%) genes. Hong et al. [45] observed that the frequency of detecting N1 and N2 genes was higher than that for the N3 gene. Moreover, inconsistent positive detection with N1 versus N2 genes was also observed by Sangsanont et al. [46]. Their results showed higher detection rates and mostly lower Ct values for the N1 gene assay compared to the N2 gene assay. These differences could be due to variations in the sensitivity of the PCR primers; the presence of PCR inhibitors in wastewater; differences in wastewater sources and quality, which could affect the integrity of the RNA or virus in wastewater; the location of the genes on the genome, with distal genes (i.e., N2) more susceptible to faster degradation than interior genes; and low concentrations of SARS-CoV-2 RNA in the wastewater samples [9]. Conversely, several other studies [43,47,48] have observed consistent positive detection across the N1, N2, and N3 genes.
Monitoring influent wastewater from municipal WWTPs has proven to be a valuable approach for predicting viral circulation at the community level. Moreover, it offers the advantage of capturing data from a diverse and extensive population [7,24,49,50]. In contrast, monitoring smaller catchment areas, such as a university campus, offers more targeted surveillance since the population is more homogenous and the sewage is mostly from sanitary sources. On the other hand, the smaller population size as well as population fluctuations due to the academic calendar are significant challenges. Smaller population size can limit the generalizability of the results to the entire community. Moreover, population fluctuations over time may lead to inaccurate estimations of viral circulation in communities [51]. Sangsanont et al. [46] have recommended large WWTPs for monitoring SARS-CoV-2 since they reflect the broader estimates of viral loads in communities.
The detection of viruses is highly dependent on the concentration methods used [35]. Earlier studies showed that recovery of non-enveloped F-specific RNA phages was 73 ± 50%, suggesting that using nonenveloped viruses for recovery experiments may overestimate the recovery efficiency of the enveloped coronavirus [36]. Yinyin et al. [52] concentrated viruses by ultrafiltration and reported 55% recovery of MS2 (nonenveloped virus) compared to 25% recovery of murine coronavirus (enveloped virus). The same study also compared the quantity of virus absorbed into wastewater solids and found the percent absorbed to be 6% for MS2 and 26% for murine coronavirus, suggesting that the lower recovery efficiency of enveloped virus compared to nonenveloped virus is due to a larger proportion of the enveloped virus being removed with the wastewater solids during centrifugation [52]. SARS-CoV-2 recovery from seeded wastewater samples in the current study for the entire processing protocol (centrifugation, concentration, and RNA extraction) ranged 18–22.3% and 18.5–24.3% for the N1 and E genes, respectively; viral losses with the wastewater solids during centrifugation were estimated as 8.2–10.8% and 9.4–10.9% for the N1 and E genes, respectively. Dumke et al. reported recoveries of SARS-CoV-2 from untreated wastewater spiked with SARS-CoV-2 and concentrated by polyethylene glycol precipitation versus ultrafiltration to be 59.4–63.7% and 33.0–42.6%, respectively [53]. By comparison, recoveries of SARS-CoV-2 from seeded wastewater samples using the viral concentration protocol in the current study were 22.7–27.3% and 21.7–26% for the N1 and E genes, respectively. A number of factors could contribute to the variation in the recovery of SARS-CoV-2, including differences in wastewater quality (e.g., total and dissolved suspended solids can influence the performance of ultrafiltration as high turbidity may cause filter clogging) and environmental factors such as heavy rainfall events that could dilute the wastewater samples and lead to false negative detection results [54].
In the current study, PMMoV was used as an internal control since several studies have shown that PMMoV is the most abundant RNA virus in human feces and can be used as an indicator of human fecal contamination [55,56,57]. Kitajima et al. [58] found that PMMoV is stable in various water sources without substantial seasonal fluctuations and that an increase in PMMoV concentration typically correlates with an increase in fecal concentration in wastewater. In the current study, normalizing SARS-CoV-2 RNA concentrations by PMMoV increased the correlations between SARS-CoV-2 RNA concentrations in wastewater with all of the health data analyzed (Table S1), including daily COVID-19 positive cases, active cases of COVID-19 within the past 14 days, new patients seeking medical care at the emergency room but not admitted to the hospital, and new patients admitted to the hospital. D’Aoust et al. [40] also showed that PMMoV normalization led to increased correlation of wastewater data with community COVID-19 health data. The observed increase in data correlations after PMMoV-normalization of the wastewater data highlights the importance of accounting for variations in human fecal contamination when comparing SARS-CoV-2 concentrations across samples over an extended period, particularly when sampling from communities in which the population and wastewater flow rates change over time [35].
The concentrations of SARS-CoV-2 RNA (based on detection of both the N1 and E genes) for Bethlehem WWTP samples in this study (2.19 × 10³ to 1.67 × 10⁶ gene copies/L) were higher than those reported by Sherchan et al. [59] in Louisiana, USA (3.1 × 10³–7.5 × 10³ gene copies/L), Ahmed et al. [7] in Australia (1.9 × 101–1.2 × 10² gene copies/L), and Randazzo et al. [60] in Spain (1.4 × 10⁵–3.4 × 10⁵ copies/L). The concentrations of SARS-CoV-2 RNA (based on detection of both the N1 and E genes) for Lehigh University wastewater samples in this study (5.90 × 10² to 9.34 × 10⁵ gene copies/L) were higher than those reported by Scott et al. [47] on a university campus in Louisiana, USA (1.75 × 10⁴–6.76 × 10⁴ gene copies/L) [47]. These differences could be due to variations in the level of SARS-CoV-2 transmission in the community; lockdown orders; mitigation measures; and the protocols used for virus detection, including viral concentration, RNA extraction, and RT-qPCR.
A strong correlation has been observed between viral gene detection in the wastewater of different WWTPs with the number of infected individuals in the community [36,37,48,61,62]. However, significant differences have been observed among WWTPs in their capacity to predict case numbers based on influent viral RNA load [37]. In a study by Fitzgerald et al. [61], a stronger relationship was found between the number of COVID-19 cases and the quantities of SARS-CoV-2 RNA detected in wastewater at larger WWTPs (serving populations ≥ 100,000) compared to smaller WWTPs (serving populations < 100,000). Bethlehem wastewater data (the Bethlehem WWTP serves a population of ~137,000) support the use of wastewater surveillance as a reliable indicator of community COVID-19 transmission, as a significant correlation (ρ = 0.72, p < 0.0000) was observed between SARS-CoV-2 RNA concentrations in wastewater and the number of daily COVID-19 cases. Saguti et al. [24] also found a correlation between the increase in SARS-CoV-2 concentration in wastewater with newly hospitalized patients with COVID-19; SARS-CoV-2 loads in wastewater peaked three to four weeks prior to hospitalization, which is much earlier than was observed in this study. This timeline could be explained by the viral incubation period of 2–14 days and the fact that hospitalization typically occurs about a week after the beginning of symptoms [63]. They concluded that detection and quantification of SARS-CoV-2 in wastewater may be used to predict hospitalization needs, especially in communities where clinical testing is limited to patients severely affected by the virus. In the current study, the variations of SARS-CoV-2 levels in Lehigh University wastewater mirrored the presence of students on campus, further supporting the use of wastewater surveillance for SARS-CoV-2 as an indicator of virus transmission at the community level.
Recent studies have shown that COVID-19 vaccination may affect both the severity and duration of viral shedding, which can significantly influence the interpretation of wastewater surveillance data [64,65,66]. Furthermore, vaccinated individuals with mild or no symptoms may not seek medical care even when infected and shedding the virus into wastewater. In spring 2021 of the current study, a lower number of daily positive cases in the community was reported while high concentrations of virus were detected in wastewater. Wastewater data must therefore be carefully interpreted as vaccination rates can change the dynamics of viral shedding in the community [66].
In conclusion, based on the findings of the current study, wastewater surveillance for SARS-CoV-2 may provide an early warning system to allow decision-makers to enact protective measures in advance of widespread community transmission to minimize public health risks. WBE may be an especially important indicator of disease transmission in communities where the capacity for clinical testing is limited or where high rates of vaccination may mask the severity of symptoms and reduce the number of people seeking clinical care. Of the three gene targets evaluated in this study, N1 provided the highest frequency of SARS-CoV-2 detection in wastewater. The use of PMMoV as an internal reference virus was found to be an effective normalization biomarker to account for changes among the sewershed population throughout the wastewater sampling period.

Supplementary Materials

The following supporting information can be downloaded at: https://www.mdpi.com/article/10.3390/environments11100212/s1, Figure S1: Ct values for PMMoV quantification in Bethlehem wastewater samples collected from August 2020 to May 2021; Figure S2: Ct values for PMMoV quantification in Lehigh University wastewater samples collected from August 2020 to May 2021; Figure S3: Relationship between SARS-CoV-2 detection in Bethlehem wastewater (gene copies per L of wastewater detected by RT-qPCR targeting the E gene) with community cases of COVID-19 (number of confirmed positive cases by St. Luke’s University Health Network) from August 2020 through May 2021; Figure S4: Relationship between SARS-CoV-2 detection in Bethlehem wastewater (gene copies per L of wastewater detected by RT-qPCR targeting the E gene) with number of outpatient positive cases that visited the emergency department (but were not admitted to the hospital) at St. Luke’s University Health Network from August 2020 through May 2021; Figure S5: Relationship between SARS-CoV-2 detection in Bethlehem wastewater (gene copies per L of wastewater detected by RT-qPCR targeting the E gene) with number of positive cases that visited the emergency department (and were admitted to the hospital) at St. Luke’s University Health Network from August 2020 through May 2021; Figure S6: Relationship between SARS-CoV-2 detection in Bethlehem wastewater (gene copies per L of wastewater detected by RT-qPCR targeting the E gene) with number of active cases at St. Luke’s University Health Network from August 2020 through May 2021; Figure S7: Relationship between SARS-CoV-2 detection in Lehigh University wastewater (gene copies per L of wastewater detected by RT-qPCR targeting the E gene) with number of confirmed positive cases by Lehigh University Health Center from August 2020 through May 2021; Table S1: Correlation of COVID-19 health data with SARS-CoV-2 RNA N1 gene concentrations before and after normalization by PMMoV (for the first peak in Fall 2020).

Author Contributions

Conceptualization, V.W. and K.J.; methodology, N.A., V.W. and K.J.; validation, N.A.; formal analysis, N.A., V.W. and K.J.; investigation, N.A.; resources, V.W. and K.J.; data curation, N.A., V.W. and K.J.; writing—original draft preparation, N.A.; writing—review and editing, V.W. and K.J.; visualization, N.A.; supervision, V.W. and K.J.; project administration, V.W. and K.J.; funding acquisition, K.J. All authors have read and agreed to the published version of the manuscript.

Funding

This research was funded by internal research grants from Lehigh University.

Data Availability Statement

The original contributions presented in the study are included in the article/Supplementary Materials; further inquiries can be directed to the corresponding author.

Acknowledgments

The authors acknowledge and thank the Bethlehem Wastewater Treatment Plant for their assistance with wastewater sample collection, as well as St. Luke’s University Health Network and the Lehigh University Health Center (via the Office of Institutional Data) for sharing community health data related to COVID-19.

Conflicts of Interest

The authors declare no conflicts of interest. The funders had no role in the design of the study; in the collection, analyses, or interpretation of data; in the writing of the manuscript; or in the decision to publish the results.

References

  1. Sridhar, J.; Parit, R.; Boopalakrishnan, G.; Rexliene, M.J.; Praveen, R.; Viswananathan, B. Importance of wastewater-based epidemiology for detecting and monitoring SARS-CoV-2. Case Stud. Chem. Environ. Eng. 2022, 6, 100241. [Google Scholar] [CrossRef] [PubMed]
  2. Gao, Q.Y.; Chen, Y.X.; Fang, J.Y. 2019 Novel coronavirus infection and gastrointestinal tract. J. Dig. Dis. 2020, 21, 125–126. [Google Scholar] [CrossRef] [PubMed]
  3. Zafar, T. Novel COVID-19 Outbreak: The Pandemic of the Decade. ACT 2020, 5, 000184. [Google Scholar] [CrossRef]
  4. Johns Hopkins Coronavirus Resource Center. COVID-19 Map [WWW Document]. Johns Hopkins Coronavirus Resource Center. 2022. Available online: https://coronavirus.jhu.edu/map.html (accessed on 26 August 2024).
  5. COVID-19 Economic Crisis: By State. 2021. Available online: https://carsey.unh.edu/publication/archived-covid-19-economic-crisis-state-through-july-2021 (accessed on 20 August 2021).
  6. Sommerstein, R.; Fux, C.A.; Vuichard-Gysin, D.; Abbas, M.; Marschall, J.; Balmelli, C.; Troillet, N.; Harbarth, S.; Schlegel, M.; Widmer, A.; et al. Risk of SARS-CoV-2 transmission by aerosols, the rational use of masks, and protection of healthcare workers from COVID-19. Antimicrob. Resist. Infect. Control 2020, 9, 100. [Google Scholar] [CrossRef]
  7. Ahmed, W.; Angel, N.; Edson, J.; Bibby, K.; Bivins, A.; O’Brien, J.W.; Choi, P.M.; Kitajima, M.; Simpson, S.L.; Li, J.; et al. First confirmed detection of SARS-CoV-2 in untreated wastewater in Australia: A proof of concept for the wastewater surveillance of COVID-19 in the community. Sci. Total Environ. 2020, 728, 138764. [Google Scholar] [CrossRef]
  8. Tang, A.; Tong, Z.; Wang, H.; Dai, Y.; Li, K.; Liu, J.; Wu, W.; Yuan, C.; Yu, M.; Li, P.; et al. Detection of Novel Coronavirus by RT-PCR in Stool Specimen from Asymptomatic Child, China. Emerg. Infect. Dis. 2020, 26, 1337–1339. [Google Scholar] [CrossRef]
  9. Kumblathan, T.; Liu, Y.; Uppal, G.K.; Hrudey, S.E.; Li, X.-F. Wastewater-Based Epidemiology for Community Monitoring of SARS-CoV-2: Progress and Challenges. ACS Environ. Au 2021, 1, 18–31. [Google Scholar] [CrossRef]
  10. Eftekhari, A.; Alipour, M.; Chodari, L.; Maleki Dizaj, S.; Ardalan, M.; Samiei, M.; Sharifi, S.; Zununi Vahed, S.; Huseynova, I.; Khalilov, R.; et al. A Comprehensive Review of Detection Methods for SARS-CoV-2. Microorganisms 2021, 9, 232. [Google Scholar] [CrossRef]
  11. Li, H.; Wang, Y.; Ji, M.; Pei, F.; Zhao, Q.; Zhou, Y.; Hong, Y.; Han, S.; Wang, J.; Wang, Q.; et al. Transmission Routes Analysis of SARS-CoV-2: A Systematic Review and Case Report. Front. Cell Dev. Biol. 2020, 8, 618. [Google Scholar] [CrossRef]
  12. Wölfel, R.; Corman, V.M.; Guggemos, W.; Seilmaier, M.; Zange, S.; Müller, M.A.; Niemeyer, D.; Jones, T.C.; Vollmar, P.; Rothe, C.; et al. Virological assessment of hospitalized patients with COVID-2019. Nature 2020, 581, 465–469. [Google Scholar] [CrossRef]
  13. Cerrada-Romero, C.; Berastegui-Cabrera, J.; Camacho-Martínez, P.; Goikoetxea-Aguirre, J.; Pérez-Palacios, P.; Santibáñez, S.; José Blanco-Vidal, M.; Valiente, A.; Alba, J.; Rodríguez-Álvarez, R.; et al. Excretion and viability of SARS-CoV-2 in feces and its association with the clinical outcome of COVID-19. Sci. Rep. 2022, 12, 7397. [Google Scholar] [CrossRef] [PubMed]
  14. Jones, D.L.; Baluja, M.Q.; Graham, D.W.; Corbishley, A.; McDonald, J.E.; Malham, S.K.; Hillary, L.S.; Connor, T.R.; Gaze, W.H.; Moura, I.B.; et al. Shedding of SARS-CoV-2 in feces and urine and its potential role in person-to-person transmission and the environment-based spread of COVID-19. Sci. Total Environ. 2020, 749, 141364. [Google Scholar] [CrossRef] [PubMed]
  15. Wu, Y.; Guo, C.; Tang, L.; Hong, Z.; Zhou, J.; Dong, X.; Yin, H.; Xiao, Q.; Tang, Y.; Qu, X.; et al. Prolonged presence of SARS-CoV-2 viral RNA in faecal samples. Lancet Gastroenterol. Hepatol. 2020, 5, 434–435. [Google Scholar] [CrossRef]
  16. Buscarini, E.; Manfredi, G.; Brambilla, G.; Menozzi, F.; Londoni, C.; Alicante, S.; Iiritano, E.; Romeo, S.; Pedaci, M.; Benelli, G.; et al. GI symptoms as early signs of COVID-19 in hospitalised Italian patients. Gut 2020, 69, 1547–1548. [Google Scholar] [CrossRef] [PubMed]
  17. Wang, D.; Hu, B.; Hu, C.; Zhu, F.; Liu, X.; Zhang, J.; Wang, B.; Xiang, H.; Cheng, Z.; Xiong, Y.; et al. Clinical Characteristics of 138 Hospitalized Patients With 2019 Novel Coronavirus–Infected Pneumonia in Wuhan, China. JAMA 2020, 323, 1061. [Google Scholar] [CrossRef]
  18. He, X.; Lau, E.H.Y.; Wu, P.; Deng, X.; Wang, J.; Hao, X.; Lau, Y.C.; Wong, J.Y.; Guan, Y.; Tan, X.; et al. Temporal dynamics in viral shedding and transmissibility of COVID-19. Nat. Med. 2020, 26, 672–675. [Google Scholar] [CrossRef]
  19. Lorenzo, M.; Picó, Y. Wastewater-based epidemiology: Current status and future prospects. Curr. Opin. Environ. Sci. Health 2019, 9, 77–84. [Google Scholar] [CrossRef]
  20. Hemalatha, M.; Kiran, U.; Kuncha, S.K.; Kopperi, H.; Gokulan, C.G.; Mohan, S.V.; Mishra, R.K. Surveillance of SARS-CoV-2 spread using wastewater-based epidemiology: Comprehensive study. Sci. Total Environ. 2021, 768, 144704. [Google Scholar] [CrossRef]
  21. Hellmér, M.; Paxéus, N.; Magnius, L.; Enache, L.; Arnholm, B.; Johansson, A.; Bergström, T.; Norder, H. Detection of Pathogenic Viruses in Sewage Provided Early Warnings of Hepatitis A Virus and Norovirus Outbreaks. Appl. Environ. Microbiol. 2014, 80, 6771–6781. [Google Scholar] [CrossRef]
  22. Bibby, K.; Bivins, A.; Wu, Z.; North, D. Making waves: Plausible lead time for wastewater based epidemiology as an early warning system for COVID-19. Water Res. 2021, 202, 117438. [Google Scholar] [CrossRef]
  23. Kumar, M.; Joshi, M.; Jiang, G.; Yamada, R.; Honda, R.; Srivastava, V.; Mahlknecht, J.; Barcelo, D.; Chidambram, S.; Khursheed, A.; et al. Response of wastewater-based epidemiology predictor for the second wave of COVID-19 in Ahmedabad, India: A long-term data Perspective. Environ. Pollut. 2023, 337, 122471. [Google Scholar] [CrossRef] [PubMed]
  24. Saguti, F.; Magnil, E.; Enache, L.; Churqui, M.P.; Johansson, A.; Lumley, D.; Davidsson, F.; Dotevall, L.; Mattsson, A.; Trybala, E.; et al. Surveillance of wastewater revealed peaks of SARS-CoV-2 preceding those of hospitalized patients with COVID-19. Water Res. 2021, 189, 116620. [Google Scholar] [CrossRef] [PubMed]
  25. Abu Ali, H.; Yaniv, K.; Bar-Zeev, E.; Chaudhury, S.; Shagan, M.; Lakkakula, S.; Ronen, Z.; Kushmaro, A.; Nir, O. Tracking SARS-CoV-2 RNA through the Wastewater Treatment Process. ACS EST Water 2021, 1, 1161–1167. [Google Scholar] [CrossRef] [PubMed]
  26. Navarro, A.; Gómez, L.; Sanseverino, I.; Niegowska, M.; Roka, E.; Pedraccini, R.; Vargha, M.; Lettieri, T. SARS-CoV-2 detection in wastewater using multiplex quantitative PCR. Sci. Total Environ. 2021, 797, 148890. [Google Scholar] [CrossRef]
  27. Tiwari, A.; Adhikari, S.; Zhang, S.; Solomon, T.B.; Lipponen, A.; Islam, M.A.; Thakali, O.; Sangkham, S.; Shaheen, M.N.F.; Jiang, G.; et al. Tracing COVID-19 Trails in Wastewater: A Systematic Review of SARS-CoV-2 Surveillance with Viral Variants. Water 2023, 15, 1018. [Google Scholar] [CrossRef]
  28. Tandukar, S.; Thakali, O.; Baral, R.; Tiwari, A.; Haramoto, E.; Tuladhar, R.; Joshi, D.R.; Sherchan, S.P. Application of wastewater-based epidemiology for monitoring COVID-19 in hospital and housing wastewaters. Sci. Total Environ. 2024, 931, 171877. [Google Scholar] [CrossRef]
  29. Haramoto, E.; Malla, B.; Thakali, O.; Kitajima, M. First environmental surveillance for the presence of SARS-CoV-2 RNA in wastewater and river water in Japan. Sci. Total Environ. 2020, 737, 140405. [Google Scholar] [CrossRef]
  30. Gonzalez, R.; Curtis, K.; Bivins, A.; Bibby, K.; Weir, M.H.; Yetka, K.; Thompson, H.; Keeling, D.; Mitchell, J.; Gonzalez, D. COVID-19 surveillance in Southeastern Virginia using wastewater-based epidemiology. Water Res. 2020, 186, 116296. [Google Scholar] [CrossRef]
  31. Tiwari, A.; Lipponen, A.; Hokajärvi, A.-M.; Luomala, O.; Sarekoski, A.; Rytkönen, A.; Österlund, P.; Al-Hello, H.; Juutinen, A.; Miettinen, I.T.; et al. Detection and quantification of SARS-CoV-2 RNA in wastewater influent in relation to reported COVID-19 incidence in Finland. Water Res. 2022, 215, 118220. [Google Scholar] [CrossRef]
  32. Betancourt, W.Q.; Schmitz, B.W.; Innes, G.K.; Prasek, S.M.; Pogreba Brown, K.M.; Stark, E.R.; Foster, A.R.; Sprissler, R.S.; Harris, D.T.; Sherchan, S.P.; et al. COVID-19 containment on a college campus via wastewater-based epidemiology, targeted clinical testing and an intervention. Sci. Total Environ. 2021, 779, 146408. [Google Scholar] [CrossRef]
  33. Gibas, C.; Lambirth, K.; Mittal, N.; Juel, M.A.I.; Barua, V.B.; Roppolo Brazell, L.; Hinton, K.; Lontai, J.; Stark, N.; Young, I.; et al. Implementing building-level SARS-CoV-2 wastewater surveillance on a university campus. Sci. Total Environ. 2021, 782, 146749. [Google Scholar] [CrossRef]
  34. Bridgewater, L.L.; Baird, R.B.; Eaton, A.D.; Rice, E.W. (Eds.) Standard Methods for the Examination of Water and Wastewater, 23rd ed.; American Public Health Association: Washington, DC, USA, 2017. [Google Scholar]
  35. Jafferali, M.H.; Khatami, K.; Atasoy, M.; Birgersson, M.; Williams, C.; Cetecioglu, Z. Benchmarking virus concentration methods for quantification of SARS-CoV-2 in raw wastewater. Sci. Total Environ. 2021, 755, 142939. [Google Scholar] [CrossRef]
  36. Medema, G.; Heijnen, L.; Elsinga, G.; Italiaander, R.; Brouwer, A. Presence of SARS-Coronavirus-2 RNA in Sewage and Correlation with Reported COVID-19 Prevalence in the Early Stage of the Epidemic in The Netherlands. Environ. Sci. Technol. Lett. 2020, 7, 511–516. [Google Scholar] [CrossRef]
  37. Wurtzer, S.; Marechal, V.; Mouchel, J.; Maday, Y.; Teyssou, R.; Richard, E.; Almayrac, J.; Moulin, L. Evaluation of lockdown impact on SARS-CoV-2 dynamics through viral genome quantification in Paris wastewaters. Epidemiology, 2020; preprint. [Google Scholar] [CrossRef]
  38. Ginzinger, D.G. Gene quantification using real-time quantitative PCR: An emerging technology hits the mainstream. Exp. Hematol. 2002, 30, 503–512. [Google Scholar] [CrossRef]
  39. Ahmed, W.; Bertsch, P.M.; Angel, N.; Bibby, K.; Bivins, A.; Dierens, L.; Edson, J.; Ehret, J.; Gyawali, P.; Hamilton, K.A.; et al. Detection of SARS-CoV-2 RNA in commercial passenger aircraft and cruise ship wastewater: A surveillance tool for assessing the presence of COVID-19 infected travellers. J. Travel Med. 2020, 27, taaa116. [Google Scholar] [CrossRef]
  40. D’Aoust, P.M.; Mercier, E.; Montpetit, D.; Jia, J.-J.; Alexandrov, I.; Neault, N.; Baig, A.T.; Mayne, J.; Zhang, X.; Alain, T.; et al. Quantitative analysis of SARS-CoV-2 RNA from wastewater solids in communities with low COVID-19 incidence and prevalence. Water Res. 2021, 188, 116560. [Google Scholar] [CrossRef]
  41. Ahmed, W.; Bivins, A.; Metcalfe, S.; Smith, W.J.M.; Verbyla, M.E.; Symonds, E.M.; Simpson, S.L. Evaluation of process limit of detection and quantification variation of SARS-CoV-2 RT-qPCR and RT-dPCR assays for wastewater surveillance. Water Res. 2022, 213, 118132. [Google Scholar] [CrossRef]
  42. Ahmed, W.; Smith, W.J.M.; Metcalfe, S.; Jackson, G.; Choi, P.M.; Morrison, M.; Field, D.; Gyawali, P.; Bivins, A.; Bibby, K.; et al. Comparison of RT-qPCR and RT-dPCR Platforms for the Trace Detection of SARS-CoV-2 RNA in Wastewater. ACS EST Water 2022, 2, 1871–1880. [Google Scholar] [CrossRef] [PubMed]
  43. Wu, F.; Zhang, J.; Xiao, A.; Gu, X.; Lee, W.L.; Armas, F.; Kauffman, K.; Hanage, W.; Matus, M.; Ghaeli, N.; et al. SARS-CoV-2 Titers in Wastewater Are Higher than Expected from Clinically Confirmed Cases. mSystems 2020, 5, e00614-20. [Google Scholar] [CrossRef] [PubMed]
  44. Randazzo, W.; Cuevas-Ferrando, E.; Sanjuán, R.; Domingo-Calap, P.; Sánchez, G. Metropolitan wastewater analysis for COVID-19 epidemiological surveillance. Int. J. Hyg. Environ. Health 2020, 230, 113621. [Google Scholar] [CrossRef]
  45. Hong, P.-Y.; Rachmadi, A.T.; Mantilla-Calderon, D.; Alkahtani, M.; Bashawri, Y.M.; Al Qarni, H.; O’Reilly, K.M.; Zhou, J. Estimating the minimum number of SARS-CoV-2 infected cases needed to detect viral RNA in wastewater: To what extent of the outbreak can surveillance of wastewater tell us? Environ. Res. 2021, 195, 110748. [Google Scholar] [CrossRef]
  46. Sangsanont, J.; Rattanakul, S.; Kongprajug, A.; Chyerochana, N.; Sresung, M.; Sriporatana, N.; Wanlapakorn, N.; Poovorawan, Y.; Mongkolsuk, S.; Sirikanchana, K. SARS-CoV-2 RNA surveillance in large to small centralized wastewater treatment plants preceding the third COVID-19 resurgence in Bangkok, Thailand. Sci. Total Environ. 2022, 809, 151169. [Google Scholar] [CrossRef]
  47. Scott, L.C.; Aubee, A.; Babahaji, L.; Vigil, K.; Tims, S.; Aw, T.G. Targeted wastewater surveillance of SARS-CoV-2 on a university campus for COVID-19 outbreak detection and mitigation. Environ. Res. 2021, 200, 111374. [Google Scholar] [CrossRef]
  48. Nemudryi, A.; Nemudraia, A.; Wiegand, T.; Surya, K.; Buyukyoruk, M.; Cicha, C.; Vanderwood, K.K.; Wilkinson, R.; Wiedenheft, B. Temporal detection and phylogenetic assessment of SARS-CoV-2 in municipal wastewater. Cell Rep. Med. 2020, 1, 100098. [Google Scholar] [CrossRef]
  49. Hillary, L.S.; Farkas, K.; Maher, K.H.; Lucaci, A.; Thorpe, J.; Distaso, M.A.; Gaze, W.H.; Paterson, S.; Burke, T.; Connor, T.R.; et al. Monitoring SARS-CoV-2 in municipal wastewater to evaluate the success of lockdown measures for controlling COVID-19 in the UK. Water Res. 2021, 200, 117214. [Google Scholar] [CrossRef]
  50. Lu, Z.; Brunton, A.E.; Mohebnasab, M.; Deloney, A.; Williamson, K.J.; Layton, B.A.; Mansell, S.; Brawley-Chesworth, A.; Abrams, P.; Wilcox, K.A.; et al. Community-Based SARS-CoV-2 Testing Using Saliva or Nasopharyngeal Swabs to Compare the Performance of Weekly COVID-19 Screening to Wastewater SARS-CoV-2 Signals. ACS EST Water 2022, 2, 1667–1677. [Google Scholar] [CrossRef]
  51. Sakarovitch, C.; Schlosser, O.; Courtois, S.; Proust-Lima, C.; Couallier, J.; Pétrau, A.; Litrico, X.; Loret, J.-F. Monitoring of SARS-CoV-2 in wastewater: What normalisation for improved understanding of epidemic trends? J. Water Health 2022, 20, 712. [Google Scholar] [CrossRef]
  52. Ye, Y.; Ellenberg, R.M.; Graham, K.E.; Wigginton, K.R. Survivability, partitioning, and recovery of enveloped viruses in untreated municipal wastewater. Environ. Sci. Technol. 2016, 50, 5077–5085. [Google Scholar] [CrossRef]
  53. Dumke, R.; de la Cruz Barron, M.; Oertel, R.; Helm, B.; Kallies, R.; Berendonk, T.U.; Dalpke, A. Evaluation of Two Methods to Concentrate SARS-CoV-2 from Untreated Wastewater. Pathogens 2021, 10, 195. [Google Scholar] [CrossRef]
  54. Gonçalves, J.; Gutiérrez-Aguirre, I.; Balasubramanian, M.N.; Zagorščak, M.; Ravnikar, M.; Turk, V. Surveillance of human enteric viruses in coastal waters using concentration with methacrylate monolithic supports prior to detection by RT-qPCR. Mar. Pollut. Bull. 2018, 128, 307–317. [Google Scholar] [CrossRef]
  55. Colson, P.; Richet, H.; Desnues, C.; Balique, F.; Moal, V.; Grob, J.-J.; Berbis, P.; Lecoq, H.; Harlé, J.-R.; Berland, Y.; et al. Pepper mild mottle virus, a plant virus associated with specific immune responses, fever, abdominal pains, and pruritus in humans. PLoS ONE 2010, 5, e1004. [Google Scholar] [CrossRef]
  56. Rosario, K.; Symonds, E.M.; Sinigalliano, C.; Stewart, J.; Breitbart, M. Pepper mild mottle virus as an indicator of fecal pollution. Appl. Environ. Microbiol. 2009, 75, 7261–7267. [Google Scholar] [CrossRef]
  57. Zhang, T.; Breitbart, M.; Lee, W.H.; Run, J.-Q.; Wei, C.L.; Soh, S.W.L.; Hibberd, M.L.; Liu, E.T.; Rohwer, F.; Ruan, Y. RNA viral community in human feces: Prevalence of plant pathogenic viruses. PLoS Biol. 2006, 4, e3. [Google Scholar] [CrossRef]
  58. Kitajima, M.; Sassi, H.P.; Torrey, J.R. Pepper Mild Mottle Virus as a Water Quality Indicator. NPJ Clean Water 2018, 1, 19. [Google Scholar] [CrossRef]
  59. Sherchan, S.P.; Shahin, S.; Ward, L.M.; Tandukar, S.; Aw, T.G.; Schmitz, B.; Ahmed, W.; Kitajima, M. First detection of SARS-CoV-2 RNA in wastewater in North America: A study in Louisiana, USA. Sci. Total Environ. 2020, 743, 140621. [Google Scholar] [CrossRef]
  60. Randazzo, W.; Truchado, P.; Cuevas-Ferrando, E.; Simón, P.; Allende, A.; Sánchez, G. SARS-CoV-2 RNA in wastewater anticipated COVID-19 occurrence in a low prevalence area. Water Res. 2020, 181, 115942. [Google Scholar] [CrossRef]
  61. Fitzgerald, S.F.; Rossi, G.; Low, A.S.; McAteer, S.P.; O’Keefe, B.; Findlay, D.; Cameron, G.J.; Pollard, P.; Singleton, P.T.R.; Ponton, G.; et al. Site Specific Relationships between COVID-19 Cases and SARS-CoV-2 Viral Load in Wastewater Treatment Plant Influent. Environ. Sci. Technol. 2021, 55, 15276–15286. [Google Scholar] [CrossRef]
  62. Acosta, N.; Bautista, M.A.; Waddell, B.J.; McCalder, J.; Beaudet, A.B.; Man, L.; Pradhan, P.; Sedaghat, N.; Papparis, C.; Bacanu, A.; et al. Longitudinal SARS-CoV-2 RNA wastewater monitoring across a range of scales correlates with total and regional COVID-19 burden in a well-defined urban population. Water Res. 2022, 220, 118611. [Google Scholar] [CrossRef]
  63. Bi, Q.; Wu, Y.; Mei, S.; Ye, C.; Zou, X.; Zhang, Z.; Liu, X.; Wei, L.; Truelove, S.A.; Zhang, T.; et al. Epidemiology and transmission of COVID-19 in 391 cases and 1286 of their close contacts in Shenzhen, China: A retrospective cohort study. Lancet Infect. Dis. 2020, 20, 911–919. [Google Scholar] [CrossRef]
  64. Tiwari, A.; Radu, E.; Kreuzinger, N.; Ahmed, W.; Pitkänen, T. Key considerations for pathogen surveillance in wastewater. Sci. Total Environ. 2024, 945, 173862. [Google Scholar] [CrossRef] [PubMed]
  65. Clark, M.; Severn, M. Wastewater Surveillance for Communicable Diseases. Cjht 2023, 3. [Google Scholar] [CrossRef]
  66. Armas, F.; Chandra, F.; Lee, W.L.; Gu, X.; Chen, H.; Xiao, A.; Leifels, M.; Wuertz, S.; Alm, E.J.; Thompson, J. Contextualizing Wastewater-Based surveillance in the COVID-19 vaccination era. Environ. Int. 2023, 171, 107718. [Google Scholar] [CrossRef] [PubMed]
Figure 1. Bethlehem Wastewater Treatment Plant service area. Map courtesy of Jack Lawrence, Superintendent of Bethlehem WWTP.
Environments 11 00212 g001
Figure 2. SARS-CoV-2 N1, E, and N2 concentrations in Bethlehem WWTP samples (gene copies per liter of wastewater) as measured by RT-qPCR.
Environments 11 00212 g002
Figure 3. SARS-CoV-2 N1, E, and N2 concentrations in Lehigh University samples (gene copies per liter of wastewater) as measured by RT-qPCR.
Environments 11 00212 g003
Figure 4. The range of wastewater quality characteristics for the overall study period (blue bars; n = 73) compared to the range of wastewater quality characteristics for the samples tested for inhibition (gray bars; n = 29).
Environments 11 00212 g004
Figure 5. Relationship between SARS-CoV-2 detection in Bethlehem wastewater (gene copies per L of wastewater detected by RT-qPCR targeting the N1 gene; orange bars) with community cases of COVID-19 (number of confirmed positive cases by St. Luke’s University Health Network; blue curve) from August 2020 through May 2021. Note: SARS-CoV-2 concentrations were normalized by PMMoV.
Environments 11 00212 g005
Figure 6. Relationship between SARS-CoV-2 detection in Bethlehem wastewater (gene copies per L of wastewater detected by RT-qPCR targeting the N1 gene; orange bars) with number of positive cases that visited the emergency department at St. Luke’s University Health Network but were not admitted to the hospital (blue curve) from August 2020 through May 2021. Note: SARS-CoV-2 concentrations were normalized by PMMoV.
Environments 11 00212 g006
Figure 7. Relationship between SARS-CoV-2 detection in Bethlehem wastewater (gene copies per L of wastewater detected by RT-qPCR targeting the N1 gene; orange bars) with the number of positive cases that visited the emergency department at St. Luke’s University Health Network and were admitted to the hospital (blue curve) from August 2020 through May 2021. Note: SARS-CoV-2 concentrations were normalized by PMMoV.
Environments 11 00212 g007
Figure 8. Relationship between SARS-CoV-2 detection in Bethlehem wastewater (gene copies per L of wastewater detected by RT-qPCR targeting the N1 gene; orange bars) with total active cases of COVID-19 (i.e., cumulative number of active cases over the past 14 days; blue curve) from August 2020 through May 2021. Note: SARS-CoV-2 concentrations were normalized by PMMoV.
Environments 11 00212 g008
Figure 9. Relationship between SARS-CoV-2 detection in Lehigh University wastewater (gene copies per L of wastewater detected by RT-qPCR; orange bars) with community cases of COVID-19 (number of confirmed positive cases by the Lehigh University Health Center; blue curve) from August 2020 through May 2021 Note: SARS-CoV-2 concentrations were normalized by PMMoV.
Environments 11 00212 g009
Table 1. Bethlehem WWTP influent wastewater flow rate and quality characterization.
Wastewater ParameterAverage (±s.d.) a
Average flow (m3/d)4.25 × 104 (±5.95 × 10³)
Total suspended solids (TSS; mg\L)322.1 (±114.7)
Volatile suspended solids (VSS; mg\L)296.7 (±109.4)
pH b6.9–7.1
Alkalinity (mg\L)181.8 (±11.5)
Carbonaceous biological oxygen demand (CBOD; mg\L)344.2 (± 89.9)
Biological oxygen demand (BOD; mg\L)412.3 (±106.2)
Chemical oxygen demand (COD; mg\L)806.4 (±201.2)
Ammonia (NH3; mg\L)26.6 (± 3.9)
a Averages (plus/minus standard deviation) are based on the samples collected over the study period (n = 73 samples). b pH range for influent wastewater received by Bethlehem WWTP.
Disclaimer/Publisher’s Note: The statements, opinions and data contained in all publications are solely those of the individual author(s) and contributor(s) and not of MDPI and/or the editor(s). MDPI and/or the editor(s) disclaim responsibility for any injury to people or property resulting from any ideas, methods, instructions or products referred to in the content.

