Article

Spatial Pattern Assessment and Prediction of Water and Sedimentary Mud Quality Changes in Lake Maurepas

Department of Chemistry and Physics, College of Science and Technology, Southeastern Louisiana University, Hammond, LA 70402, USA
*
Author to whom correspondence should be addressed.
Environments 2024, 11(12), 268; https://doi.org/10.3390/environments11120268
Submission received: 6 October 2024 / Revised: 16 November 2024 / Accepted: 21 November 2024 / Published: 25 November 2024

Abstract

:
Lake Maurepas, Louisiana, holds ecological, recreational, and economic significance, but recent concerns have arisen over its water quality due to industrial activities. From June to November 2023, we investigated water and sediment quality at nine sites and three depths. Results showed that NH3-N levels were within safety limits (0.11 ± 0.10 mg/L), while Total Nitrogen (TN, 0.83 ± 0.65 mg/L), Total Phosphorus (TP, 0.32 ± 0.13 mg/L), Chemical Oxygen Demand (COD, 25.94 ± 11.37 mg/L), Arsenic (As, 0.26 ± 0.17 mg/L), and Lead (Pb, 0.23 ± 0.002 mg/L) exceeded acceptable thresholds. Spatial-temporal analysis revealed significant variations across sites, depths, and sampling dates. Major contaminant sources included discharges from the Tickfaw, Amite, and Blind rivers, as well as a vehicle accident on Pass Manchac. Seismic and drilling activities by Air Products and Chemicals had little to no observed impact. Four AI algorithms were also evaluated using different physical parameter inputs to predict December’s chemical pollutant levels, which were missing due to adverse weather. The LSTM model outperformed the others, achieving R2 values of 0.852 for COD, 0.869 for TN, 0.842 for As, and 0.921 for TP and Pb. Predictions indicated decreasing pollutant levels in December, which matched salinity and specific conductance measurements, and reverted to those observed in September and October. This pattern is attributed to the settling of contaminants from the Pass Manchac accident and ongoing pollutant sources from September and October.

1. Introduction

Chemical monitoring of lakes is essential for maintaining healthy aquatic ecosystems, protecting human health, supporting sustainable water management practices, and enhancing our understanding of environmental changes and challenges [1,2]. Although not all inland surface water bodies are used for drinking purposes, many lakes are often used for recreational activities such as swimming, diving, boating, and fishing [3]. Since lakes are good indicators of climate change, monitoring them helps understand its impact on aquatic ecosystems. Changes in water temperature, precipitation patterns, ice cover, and hydrological cycles can affect lake ecology, water quality, and species distribution, emphasizing the need for adaptive management strategies [4].
In addition to the points mentioned above, the need to monitor Lake Maurepas (Southeastern Louisiana, USA) has recently arisen due to concerns about the deterioration of aquatic and water quality from activities associated with restaurants, farms, and chemical and spice manufacturing companies along the Tickfaw, Amite, and Blind Rivers, which recharge the lake [5]. In addition to local concerns, studies across the United States have highlighted the importance of monitoring lakes affected by industrial activities, providing insights into the environmental impacts of anthropogenic pressures on aquatic ecosystems. For instance, studies in the Great Lakes [6,7] region have highlighted how industrial pollution, specifically from heavy metals and nutrients, impacts water quality and aquatic biodiversity. Research in Lake Erie [8,9] and Lake Michigan [10,11,12] has shown how sediment disturbances, either from dredging or industrial runoff, can mobilize contaminants that affect both the lake ecology and human health. Similarly, studies in Florida’s Lake Apopka [13,14,15] have examined agricultural runoff and its long-term effects on nutrient loading, leading to issues such as algal blooms and fish die-offs. These findings emphasize the need for detailed monitoring frameworks, especially in regions like Louisiana, where the impacts of industry on lake ecosystems remain underexplored.
Furthermore, ‘Air Products and Chemicals, Inc.’ (APC), an industrial gases company, has announced plans to capture 95% of the carbon dioxide (CO2) generated from their blue hydrogen manufacturing activities and sequester it in the bed of Lake Maurepas [16]. The main objective is to eliminate the greenhouse gas emissions to the maximum extent possible. APC has selected the bed of Lake Maurepas for this purpose as the geological and hydrogeological characteristics in Lake Maurepas, making it one of the most suitable lands for carbon sequestration. These characteristics include the geologic pore space located one mile beneath the lake, which provides a secure storage site for CO2. This pore space is overlain by a caprock layer that serves as an impermeable seal to permanently contain the CO2. Moreover, Lake Maurepas is a brackish estuarine, and such saline aquifers are often targeted for CO2 storage because they are not used for drinking water or agriculture and can dissolve large amounts of CO2 [17,18]. APC conducted a subsurface seismic survey from December 2022 to June 2023 to map the topography of the lake bed, a process with the potential to disturb aquatic habitats. Following the survey, APC received approval from the Louisiana Department of Natural Resources to construct two test wells, south-STW and north-NTW (Figure 1), to evaluate and confirm the suitability of the lake bed for carbon sequestration. The construction works on STW started during the second week of August 2023 [19].
As a result, the Lake Maurepas Monitoring Project (LMMP) was established to conduct a monitoring study in the Lake Maurepas ecosystem, focusing on both the abiotic and biotic components of the lake and surrounding region. As a part of LMMP, this study was conducted to determine the current contamination level and examine the impacts of the ongoing industrial activities in Lake Maurepas. The major concern is whether the seismic survey and the test well construction process disturbed the lake bed, stirring up toxic chemicals deposited in the sedimentary mud of Lake Maurepas. The primary objectives of this work include; (i) collecting water and sedimentary mud samples from nine different sites in the lake on a weekly basis, (ii) characterizing water quality by determining the physical and chemical properties of the water, including temperature, pH, specific conductance, salinity, and potential contaminant and nutrient concentrations, and assessing the presence heavy metals (HMs), (iii) evaluating sedimentary mud samples by quantifying Mercury (Hg) concentration, (iv) identifying the spatial-temporal variation of these compounds using Inverse Distance Weighting (IDW), and (v) forecasting water quality for the upcoming weeks using the available data.
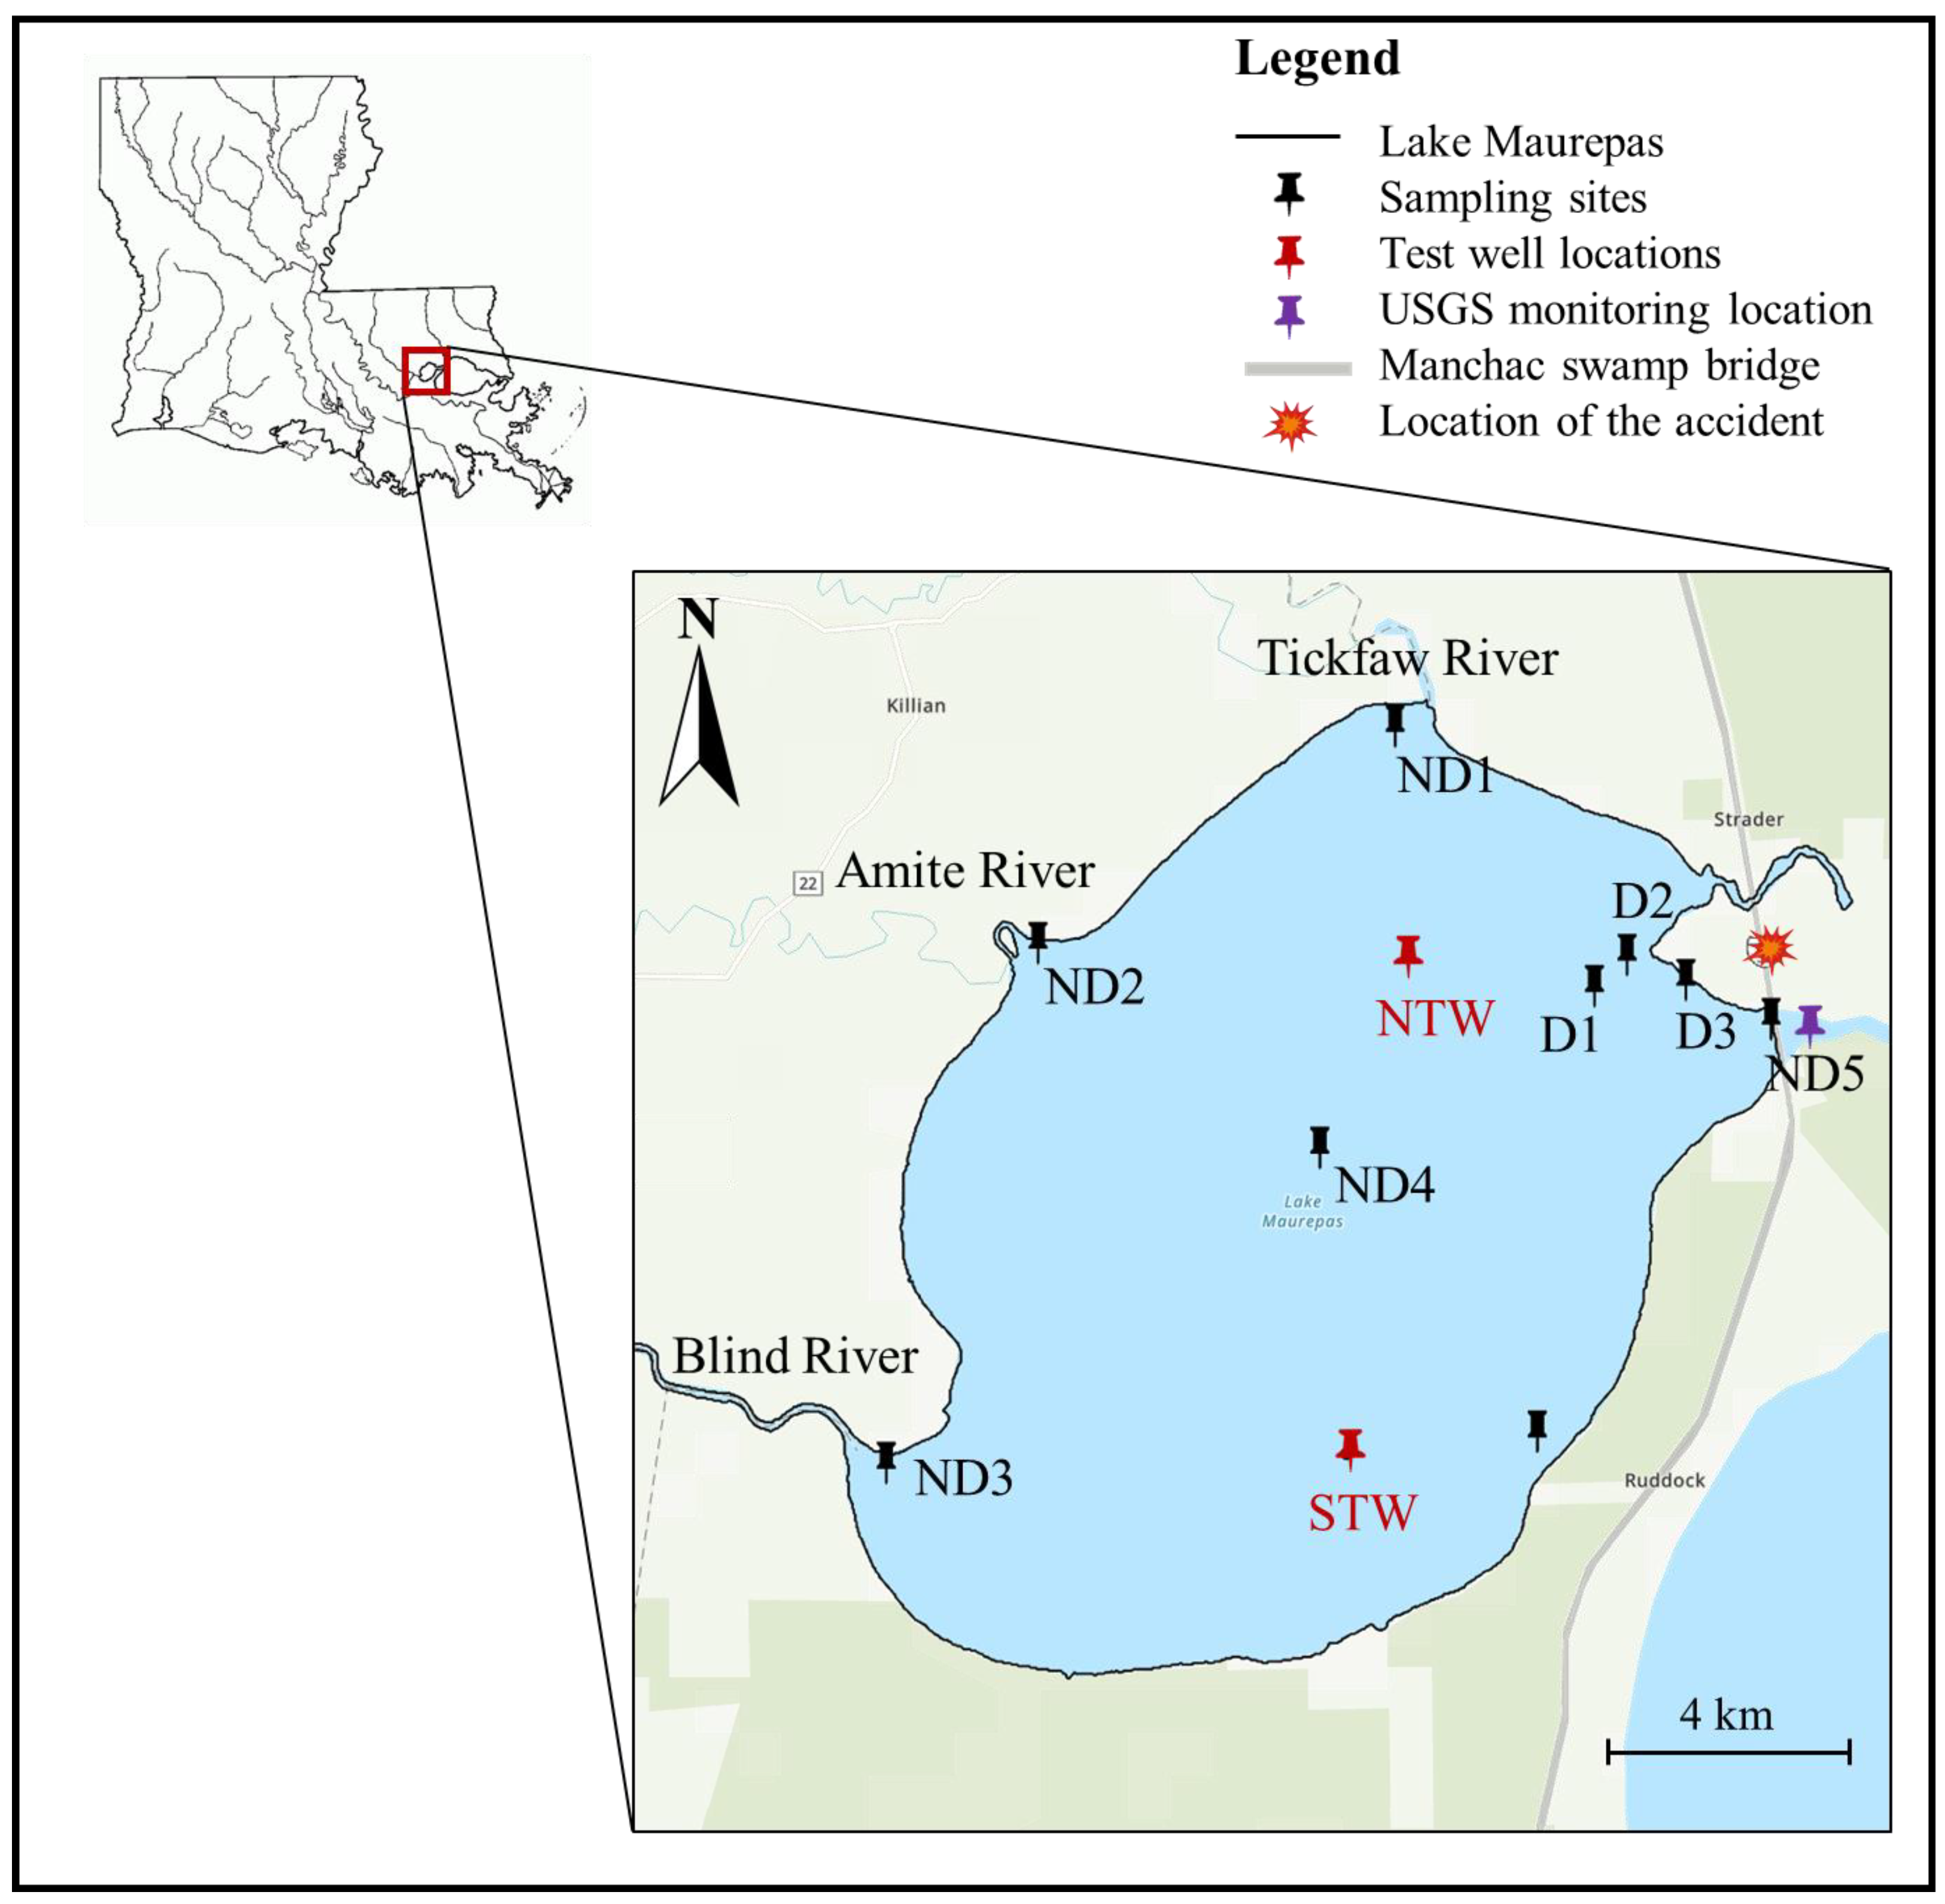
Figure 1. Lake Maurepas in southeastern Louisiana, USA. The black pins indicate the 9 sampling sites. Tickfaw, Amite, and Blind rivers discharge freshwater into the Lake. Black lines indicate model compartment boundaries. The data presented in Figure 2 are extracted from the United States Geological Survey Pass Manchac, Lake Maurepas, LA monitoring station—073802302 and STW (30.208893, −90.491221), NTW (30.209092, −90.491308) indicate the locations of the test wells. The yellow icon indicates the location of a catastrophic ‘super fog’ multi-car pileup on 23 October 2023.
Environments 11 00268 g001
This study is Louisiana’s first detailed monitoring effort for a lake, where previous lake studies have been limited, often survey-based and focused on wetlands, providing only an overview or basic classification of conditions [20,21]. Health concerns have intensified in the state due to pollution from industrial activities. For example, “Cancer Alley”, a 137-km stretch along the Mississippi River between Baton Rouge and New Orleans, contains over two hundred petrochemical plants and refineries. Cancer rates in this region are 95% higher than the national average, with elevated rates of diabetes and respiratory diseases [22]. Hence, establishing a thorough baseline of physical and chemical parameters for this lake, designated for future carbon sequestration and currently experiencing test well construction, is essential. This baseline will provide critical pre-impact data to assess the environmental and ecological effects of carbon sequestration. By examining potential construction impacts on sediment disturbance, heavy metal mobilization, and nutrient redistribution, this study highlights industrial effects and projects potential changes in lake chemistry and ecosystem health. This study initiates a framework for long-term monitoring, offering regulatory insights by identifying key parameters and contamination thresholds. These findings will be valuable for ongoing environmental management and policy-making to ensure sustained ecosystem health in the face of industrial activities.

2. Materials and Methods

2.1. Study Area

Lake Maurepas (30.2734° N, 90.5069° W) is located in Southeastern Louisiana, approximately halfway between Baton Rouge and New Orleans, and directly west of Lake Pontchartrain (Figure 1). The lake is a circular-shaped, shallow, brackish tidal estuarine system. It has a large area of ~240 km2 with an average depth of 3 m and maximum depth of 4.5 m. The lake is recharged mainly by three rivers; Tickfaw River, Amite River, and Blind River. The average freshwater input to Lake Maurepas from these rivers and other minor terrestrial sources is less than 96 m3/s [23]. To the north-east, Lake Maurepas is connected to Lake Pontchartrain by Pass Manchac. The tidal exchange with Lake Pontchartrain through Pass Manchac is a significant influence on Lake Maurepas’ volume and elevation than tributary freshwater discharge. The main land usage patterns of Lake Maurepas basin include forestry areas and marshes. There are a few areas where municipal and industrial activities are occurring, such as residential schemes, restaurants/bars, chemical and spice manufacturing companies, and farms [23] alongside the mentioned rivers.

2.2. Sampling Sites

Establishing sampling sites across the lake is a crucial step in gathering representative data that reflects the spatial variability of water quality parameters, contaminants, and ecological conditions. In order to capture diverse characteristics and potential sources of variability within the lake, such as river discharge and proximity to human activities, we chose five non-drilling (ND) sites and four drilling sites (D). Drilling refers to the areas close to the APC test well construction sites. These sampling sites were named as; ND1, ND2, ND3, ND4, ND5, D1, D2, D3, and D4 (Figure 1 and Table S1). The D1, D2, and D3 locations were selected for sampling due to APC’s plan to construct the NTW around the northern part of the lake. D4 is selected to track any pollutants contaminating the lake water and sedimentary muds from the process of STW construction. Sampling very close to the STW was not possible due to safety restrictions. Sampling was conducted weekly, except during weather conditions such as high tides, fog, rain, or high wind speeds.
The sampling sites were determined using a global positioning system tool (GPS—Garmin eTrex 10). Water samples were collected from three different layers: the surface, middle depth (~1.5 m), and lake bed depth (~3 m), using a water sampler (depth sampler, Vernier, Beaverton, OR, USA). Sedimentary mud samples were collected from the lake bed of each sampling site using a grab sampling dredger (Wildco Ekman dredge, Cole Parmer, Vernon Hills, IL, USA). After collection, the samples were transported to the laboratory and stored in a laboratory freezer at −20 °C until analysis. Essential metadata, including the sampling date, time were carefully documented. More information on sampling methods is available in the Supplementary Materials under Section S1.1.

2.3. Measurements

Water temperature (T), salinity, and specific conductivity (SC) were collected from the USGS monitoring station (Figure 1). pH was measured in situ during field sampling using a pH meter (YSI Environmental, Yellow Springs, OH, USA). The device was calibrated with appropriate solutions prior to every field work. TN, NH3-N and TP were measured using persulfate digestion method (HACH 10071), salicylate TNT method (HACH 10023), and USEPA PhosVer® 3 with acid persulfate digestion method (HACH 8190), respectively. COD was measured by the reactor digestion method (HACH 8000) using sample digestor (HACH DRB 200), UV-visible spectrometer (HACH DR 3900), and manufacturer-provided analysis kits (HACH). Mercury (Hg) measurements were conducted using Direct Mercury Analyzer (Milestone DMA-80 evo, Shelton, CT, USA) while the other heavy metals were measured using Microwave Plasma Atomic Emission Spectrometer (Agilent MP-AES 4210, Santa Clara, CA, USA). Water samples were filtered through syringe filters with a pore-size of 0.45 μm (VWR International, LLC, Radnor, PA, USA) before measuring the chemicals. All measurements were performed in triplicate. Additional information on the measurements is presented in the Supplementary Materials under Section S1.2.

2.4. IDW Interpolation and Predictive Modeling Techniques

2.4.1. Geospatial Contaminant Variation Patterns

Geographic Information Systems (GIS) interpolation modeling is a valuable method for predicting attributes at sites where no direct measurements are available. It does this by estimating values based on data collected from nearby sampled sites within the same temporal context [24,25,26]. Hence, it can be utilized to develop variogram models or generate interpolated maps using sampled data [27,28]. In essence, having access to continuous spatial data is crucial for effectively managing natural resources. The two most commonly used interpolation techniques, Ordinary Kriging (OK) and Inverse Distance Weighting (IDW), produce maps with similar patterns, but their accuracy levels vary [28]. In our study, the IDW method was selected due to its effectiveness in creating isodynamic contours. This interpolation method provides concentration values that fall within the range of the maximum and minimum measured points, ensuring that there is no extrapolation beyond the specified range. As a result, the interpolated results exhibit smooth transitions across the surface [29]. Unlike the OK method, the IDW method is solely based on the distance weighting. The fundamental idea is that points closer to the target location are more similar to it than points further away. Therefore, they have a higher influence on the predicted value. Given the limited dataset available for only 15 weeks from June to November 2023 due to weather conditions, the IDW method is particularly powerful and suitable for this study, as it effectively interpolates values even with a small amount of data. In contrast, the OK method typically requires more than 10 sampling points, which is not feasible or applicable for the current study area [30,31].
The Equation (1) below represents the mathematical expression for the inverse distance weighting (IDW) interpolation technique [31]:
Z S o = i = 1 n W i Z ( S i )
where Z(So) is the concentration value in unsampled site So, Z(Si) is the concentration value at the sampling site Si, n is the number of sampling sites, and Wi represents the weight of the Si which is defined according to the Equation (2);
W i = 1 d i k ( i = 1 n 1 d i k )                   i = 1 ,   2 ,   ,   n
where di is the horizontal distance between the interpolation points and the points observed, and k is the distance exponent. More information about the calculation methods is available in Supplementary Materials under Section S1.3.
All interpolation calculations were performed with ArcGIS Pro 3.3 software (Esri, Redlands, CA, USA) and for the mapping purposes, Lake Maurepas shape files were extracted from the United States Geological Survey (USGS) website [32].

2.4.2. Water Quality Forecasting

We examined four forecasting models, basic curve fitting, exponential smoothing, forest-based approach, and Long Short-Term Memory networks (LSTM), to predict the concentrations of COD, TN, TP, As, and Pb in nine different sampling sites for December 2023. December was selected for analysis due to missed sampling caused by adverse weather conditions and the highest rainfall occurring on 2 December 2023 (see Figure 3G), along with a sudden reduction in salinity and specific conductance in lake water (see Figure 2B). Additionally, STW construction work was ongoing during this month. Therefore, we aimed to assess how these conditions could potentially impact the lake’s water quality.
The curve fit forecast method predicts values across each site of a space-time cube. This cube represents data in a three-dimensional format, where one axis denotes time, and the other two represent spatial dimensions such as latitude and longitude. It employs curve fitting techniques such as linear, parabolic, exponential, and S-shaped/Gompertz. In contrast, the exponential smoothing forecast method uses the Holt-Winters method to predict future values at each site within the space-time cube [33]. This involves decomposing the time series at each site into its seasonal patterns and trends. The forest-based forecast method predicts future values for each site in a space-time cube using a modified version of the random forest algorithm, a supervised machine learning technique developed by Leo Breiman and Adele Cutler [34]. This method trains a forest regression model on time windows at each site within the cube. The LSTM model was employed to predict water quality parameters using past data and associated environmental factors. The approach involved training the LSTM network on time series data to capture temporal dependencies between water quality parameters and environmental factors. Three scenarios were evaluated to determine the optimal input configuration; scenario 1 considered only the environmental factors that showed significant correlation with the specific water quality parameter, scenario 2 excluded any environmental factors that are highly correlated with each other and focused on the remaining factors, while the scenario 3 considered all available environmental factors as input features, without filtering based on correlation (Figure S26). The considered environmental factors for this analysis include pH, temperature, dew point, humidity, pressure, precipitation, wind speed, wind direction, salinity, and specific conductance. While pH values were measured during our sampling, precipitation, wind speed, wind direction data were collected from Kenner, LA Weather History from Louis Armstrong New Orleans International Airport Station and the remaining data were collected from the United States Geological Survey Pass Manchac, Lake Maurepas, LA monitoring station.
More information on the prediction methods is available in the Supplementary Materials under Section S1.3. Finally, the Root Mean Square Error (RMSE) is calculated and compared to evaluate the most suitable model for each site. The Equation (3) gives the forecast RMSE formula:
F o r e c a s t   R M S E = t = 1 T ( c t r t ) 2 T
where T is the number of time steps (15 weeks, in this study), ct is the value of the forest model, and rt is the raw/measured value of the time series at time t.
The measured and forecasted values of the pollutants were statistically compared using one-way analysis of variance (One-way ANOVA) with a 95% confidence interval (CI) library in RStudio software (V: 2023.12.1).

3. Results and Discussion

3.1. Physical Properties of Lake Water in 2023

Measuring physical properties of lake water such as temperature, pH, SC, and salinity is important as these indicators reflect the overall water quality. Changes in temperature, pH, SC, and salinity can signal pollution, nutrient runoff, or other environmental disturbances that may impact the health of the lake ecosystem. Monitoring these properties helps identify potential sources of contamination and guide management efforts to maintain or improve water quality. Figure 2 shows the trends of these properties in Lake Maurepas surface water from January to December 2023, except for pH. pH data was not available from the USGS monitoring station; therefore, in-situ measurements of pH are included in Figure 2A only during the sampling period. The weekly trends of these water quality parameters are presented in Supplementary Materials as Figure S1. The acceptable limits for these properties are presented in Table S2.
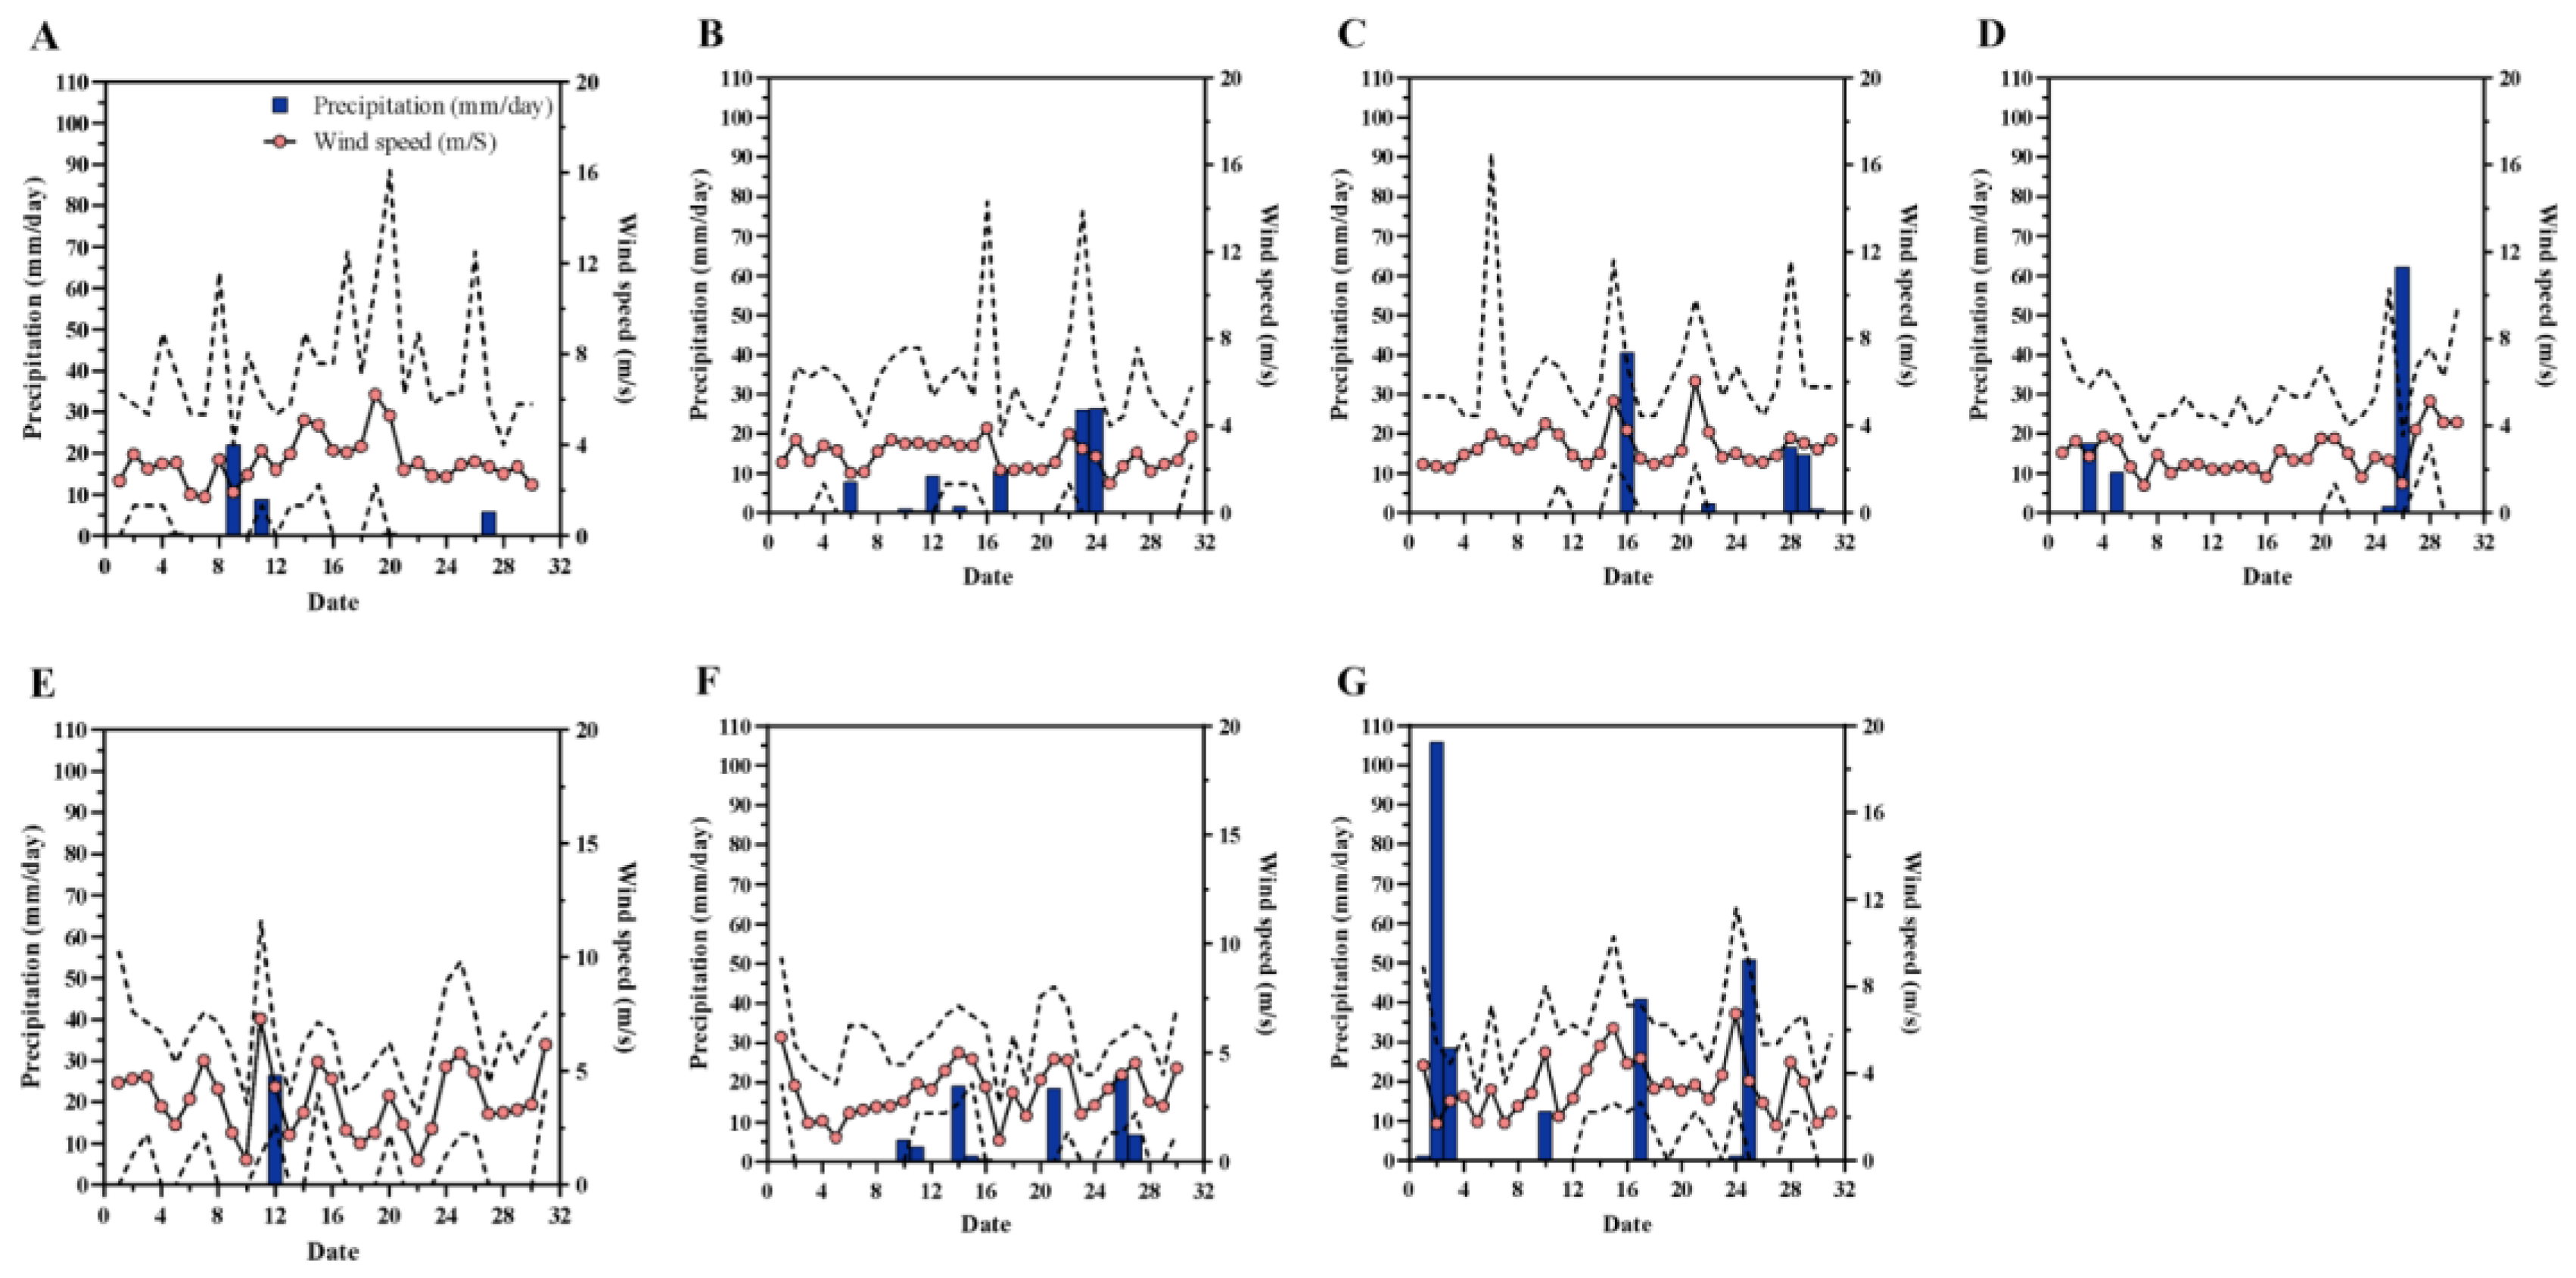
Considering the temperature variation, an increasing trend was observed between January and July, followed by a decreasing trend from August to December. The maximum water temperature was recorded on August 7th (34.44 °C), while the minimum was on December 14th (7.17 °C). pH of the lake water fluctuated between 6.41–8.80 while showing an average value of 7.42 ± 0.19 during the considered period. Compared to other months, July showed a slight increase in average monthly pH (8.18 ± 1.05), with higher values observed during this month (Figure S1C). This pattern aligns with findings in studies of similar lakes, where pH values often increase during warmer months due to enhanced biological activity [35]. There were only a few rainfalls during July (Figure 3B) with intensities of 7.9 mm, 9.4 mm, 10.7 mm, 26.2 mm, and 26.4 mm on the 6th, 12th, 17th, 23rd, and 24th of July, respectively. Despite the subsurface seismic survey-related cleanup work carried out by APC in July—which included collecting and removing all seismic survey equipment such as cables, nodes, and other hardware to ensure no remnants or debris were left in the lake—no significant impact on pH values was observed. The pH values for the closest sampling sites, ND4 and D4, remained within the ranges of 6.9–7.4 and 7.4–7.7, respectively. The pH ranges observed near the inputs of Tickfaw and Amite rivers were 6.6–8.8 and 7.0–9.7, respectively, as the highest ranges of the lake. The pH increase in July could be attributed to discharge inputs from these rivers. Biological processes such as photosynthesis, respiration, and the decomposition of organic matter can also influence pH levels in lake water. During the summer months of June to August, higher temperatures exceeding 30 °C can have complex effects on photosynthesis. These effects include changes in oxygen availability, thermal stratification, metabolic rates, and the composition of algal assemblages [36]. During photosynthesis, aquatic plants absorb carbon dioxide from the water, which can increase pH levels by reducing the concentration of carbonic acid. Although the observed pH values fall within the range defined for drinking water (6.5–8.5), large variations in pH can cause stress to aquatic organisms, as many species are adapted to stable pH conditions. Such stress can adversely affect their growth, behavior, reproduction, and survival (Figure S1E–G).
Both salinity and SC showed an increasing trend up to November and then a sudden decrease in December. The salinity and SC varied between 0.1–0.7 ppt and 110.63–2325.83 µS/cm, respectively. Similar trends have been documented in other estuarine lakes where seasonal variations and saltwater intrusion contribute to fluctuating salinity levels, particularly during periods of high tide or coastal storms [37,38]. Since Lake Maurepas is located in a tidal estuarine system, saltwater intrusion can occur when saline sea water infiltrates freshwater aquifers or via surface water bodies located nearby such as Lake Pontchartrain. This can happen due to sea level rise or changes in coastal hydrology, leading to increased salinity and SC levels in freshwater lakes near the coast [39]. Other than that, various anthropogenic and natural factors affect the salinity and SC levels in Lake Maurepas. Agricultural runoff, which contains excessive concentrations of agrochemicals can lead to the runoff of salts and nutrients whereas urbanization can also contribute to increased salinity and SC levels in lake water through various mechanisms. Previous studies in similar urban-influenced lake systems have also shown how runoff from urban areas elevates SC due to road salts, sewage, and industrial effluents [40,41]. Stormwater runoff (see Figure 3D–G) from urban areas can carry pollutants such as road salts, sewage, and industrial effluents into lakes, elevating salinity and SC levels. The salinity and SC showed a significant increase in September, nearly doubling compared to August, and peaked in November following a major accident near Pass Manchac. The catastrophic ‘super fog’ multi-car pileup on 23 October 2023, involving over 160 vehicles, caused substantial property and environmental damage (Figure S2). The leaking fluids, scrap materials, and wreckage from this incident likely contributed to both air and water pollution [42]. Another potential factor could be disturbances to the lake bed caused by ongoing industrial activities, such as drilling in the STW. Such disturbances can lead to direct and indirect effects on water chemistry, including sediment resuspension, nutrient release, exposure of underlying geology, and alteration of water circulation [43]. However, the impact from drilling appears minimal, given that the STW is located approximately 11.9 km away from the polluted areas (Figure 1), and wind directions were opposite (See Section 3.3).

3.2. Chemical Properties of Lake Water from June-November 2023

Figure 4 illustrates the temporal changes in chemical properties of Lake Maurepas surface water from June to November 2023. Throughout the sampling period, the COD concentration exhibited an upward trend, rising from 11.3 ± 8.04 mg/L in June to 39.6 ± 19.8 mg/L in November, surpassing the safety threshold of 25 mg/L (Figure 4A). In considering nutrient concentrations, TN ranged from 0.70 to 0.99 mg/L (higher than the safety limit (Table S2)), and NH3-N ranged from 0.06 to 0.14 mg/L (below the safety limit (Table S2)), both exhibiting relative stability. However, TP concentration showed a slight increase from June to September, with a notable decrease in October to 0.09 mg/L (Figure 4B). The observed exceedance of the safety thresholds for COD and TN could be attributed to various factors, including polluted stormwater runoff, contamination from the three rivers linked to the lake, and ongoing drilling activities. Pollutants contribute to the COD concentration in lake water by increasing the amount of organic matter and certain inorganic substances that require oxygen for decomposition (see Section S1.2 for COD measurement procedure). They come from various sources, including domestic/municipal wastewater which contains organic substances such as food particles, human waste, and household cleaning products. Agricultural runoff also includes organic materials from fertilizers, pesticides, and animal waste. Aside from that, industrial effluents might release organic chemicals from manufacturing processes. The stormwater runoff carries all of these pollutants to the lake from urban areas, including oils, grease, and organic debris. Certain inorganic substances can also increase COD levels in lake water. These include Ammonia and Nitrites which are commonly found in wastewater and agricultural runoff. Once in the lake, biological processes such as microbial decomposition and nutrient cycling can occur, further altering nutrient levels. Microbial activity in sediments or water columns can convert organic nitrogen compounds into ammonia, affecting overall nutrient concentrations [44]. The presence of reduced metals such as iron (Fe2⁺) and manganese (Mn2⁺) can also contribute to increased COD levels in water samples via converting to their higher oxidation states by consuming oxygen [44]. Our elemental analysis detected trace levels of Fe (0–0.05 mg/L), Hg (0–0.06 mg/L), Zn (0–0.08 mg/L), Cd (0–0.07 mg/L), Ba (0–0.08 mg/L), Cu (0–0.05 mg/L), Mn (0–0.03 mg/L), and Ni (0–0.03 mg/L), which negate this contribution. Similar to findings by previous studies, pollutants that stimulate microbial activity can indirectly increase COD [45]. For instance, high nutrient levels can lead to algal blooms. These blooms result in a large biomass that, upon death, becomes organic matter decomposed by bacteria, significantly raising the COD level. The presence of cyanobacteria and blue-green algae in Lake Maurepas has been reported in a study conducted by Bargu et al., 2023 [46]. Rapid algal blooms result in higher nutrient concentrations and can limit oxygen diffusion from the atmosphere to the water, potentially causing hypoxic events. These events can severely impact aquatic life, particularly less-mobile species like crabs, which cannot move to more oxygenated water. This highlights the interconnectedness of freshwater ecosystems and the importance of managing nutrient inputs to maintain lake water quality.
Figure 4C shows the concentration variations of the three heavy metals in the order of As > Pb > Hg. The significantly higher concentrations detected for As and Pb compared to the thresholds (Table S2) raise concerns about the current health and safety of the lake for aquatic life, fishing, and recreational activities. Both As and Pb are toxic to aquatic organisms even at low concentrations by affecting their growth, reproduction, behavior, and morality [47]. Because of the non-biodegradable and bioaccumulative nature of these heavy metals, they could accumulate and biomagnify in fish and other aquatic animals. As a result, they could enter the human body eventually through the food chain. The highest values of As, Pb, and Hg were observed in August (0.63 ± 0.19 mg/L), September (0.43 ± 0.02 mg/L) and October (0.08 ± 0.03 mg/L), respectively. This month-wise data is used to check whether there is any link between the spikes in heavy metal concentrations to the construction activities of the STW. Even though Hg showed very trace levels in water, it showed higher concentrations in sedimentary mud samples, as illustrated in Figure 4D. The lowest value was observed in July, before STW construction started (10.35 ± 2.09 μg/kg), while the highest concentration was found in November, after STW construction began (32.18 ± 7.82 μg/kg). However, these values are below the USEPA’s defined permissible limit of Hg in sediments, which is 180 μg/kg (Table S2). These heavy metals can enter lake water and sediments through various natural and anthropogenic pathways. Natural sources such as geological weathering of rocks and soils that contain heavy metals can release these elements into water bodies. This process accelerates by factors like acidic pH, higher temperatures, and the presence of organic acids [48].
As shown in Figure 2, the temperatures were higher during summer months, June-September. Overall, water impairment in the lake can be attributed to various sources including industrial point sources, runoff from pasturelands, urban areas, petroleum products, and recreational activities [49]. According to [5], there are between 1 and 25 industries within a five-mile radius, with the highest number located near the Amite River around Baton Rouge. Industries along the Blind River include restaurants, bars, parks offering boat rides, and chemical manufacturing plants; along the Amite River, there are electrical equipment repair shops, spice manufacturing facilities, and pharmacies; and along the Tickfaw River, industries comprise farms, bars, restaurants, vacation spots, golf courses, and smoke and spice companies. These industries could potentially contribute to the heavy metal pollution via processing equipment/machinery involved in manufacturing, contaminated ingredients, infrastructure maintenance, and fertilizers and pesticides in golf courses. Agricultural runoff which has heavy metal containing pesticides and fertilizers during rain events could transport these contaminants into the lake. According to [50], 17.84% of the land in Lake Pontchartrain basin is covered with agricultural lands, while 7.77% is urban areas and the rest is wetland forests/scrubs or marshy lands. The urban runoff could also contain heavy metals from road runoff, atmospheric deposition from vehicle emissions, and waste from urban areas which can enter into the lake through stormwater drainage systems [51]. Furthermore, heavy metals could be emitted into the atmosphere from industrial processes and vehicular emissions. These airborne metals can then settle onto the lake surface or be washed into the lake through precipitation [51]. It is important to note that the values in Figure 4 represent averages for the entire lake on specific sampling dates, and they vary considerably depending on the sampling site. For further details, refer to Section 3.3.

3.3. Geostatistical Modeling of Chemical Properties

We studied the spatial-temporal distribution of COD, TN, TP, As, and Pb using the IDW algorithm in ArcGIS software (version 3.3) on data collected from nine sampling sites. Figure 5 and Figures S3–S16, and Tables S3–S8 demonstrate these distributions for the lake’s surface water, the middle depth (~1.5 m), and the lake bed (~3 m).
COD was recorded in the range of 7–42 mg/L and 14–70 mg/L for summer and winter seasons, respectively, exceeding the standard limit for COD (25 mg/L, Table S2). The highest value was recorded for the bottom layer of site D1 (86.67 ± 4.24 mg/L) and the lowest in the surface layer of D1 (11.67 ± 0.97 mg/L) (Table S3). During winter, surface COD concentrations tend to be higher compared to summer. This increase in COD during winter could result from a higher pollution load on the aquatic system, leading to maximum oxygen consumption. Similar seasonal increases in COD due to enhanced pollution loads have been noted in other studies of freshwater ecosystems [52]. The higher concentrations of COD near Tickfaw River in August (Figure 5(1-C)), near Amite River in September (Figure 5(1-D)), and near Blind River in October (Figure 5(1-E)) indicate higher pollutant loads from these streams. The relatively higher concentrations of COD from September to November compared to other months could be due to leaf fall and the decay of vegetation, which peaks in November, specifically in Southern Louisiana. Noticeably, the COD and As concentrations were alarmingly high near the D1, D2, and D3 sites in November. As discussed earlier, this spike is likely attributable to the catastrophic ‘super fog’ multi-car pileup on Louisiana Highway near Pass Manchac on October 23, 2023. With the rainfall at the end of October and in November (Figure 3F,G), these pollutants could have entered the lake. They were likely transported via wind-induced waves (towards south), as the lake area experienced high wind speeds: 3.73 ± 1.47 m/s in October, and 3.21 ± 1.16 m/s in November. Generally, wind speeds above 3 to 4 m/s are sufficient to generate noticeable waves on a lake [53]. The wind data is presented graphically in Figure 3.
The TN concentration varied between trace levels and ~5 mg/L during the sampling period. Few environmental agencies have set standards for TN in lakes to protect aquatic life. These standards often range from 0.02 mg/L to 2.00 mg/L, depending on the sensitivity of the ecosystem and the designated use of the waterbody [54]. The TN levels were comparatively higher in June and August at sites D1–D3, in July at sites ND2 and ND3, in September at ND2 near Amite River (with the highest recorded value of 4.97 ± 0.19 mg/L), in October at sites ND1-ND4, and in November at sites ND3 and D4. According to Figure 3D–F, the wind speed and direction have likely propagated the high discharge from Amite River towards the east, ultimately settling in the bottom layers near STW (Figure 5(2-D)–(2-F), Figures S5 and S6). The opposing force generated by drilling activities during these months may have prevented further migration towards the D4 site. A similar pattern was observed for NH3-N (Figures S10–S12) and TP (Figures S7–S9) as well. NH3-N concentrations were relatively higher during June and September, particularly near the Amite River, which is highly correlated with TN concentration variation patterns. TP concentrations ranged from 0.09 to 2 mg/L during the sampling period, with higher concentrations observed in August and September compared to the other four months. The highest TP concentration was detected in the surface layer of ND2 (1.71 ± 0.05 mg/L), while the lowest amount was found in the middle layer of D3 and the bottom layer of D2 (0.01 mg/L). Tables S3–S6 provide the average values of these concentrations for each sampling site. Similar to COD, their concentrations were higher near river inputs.
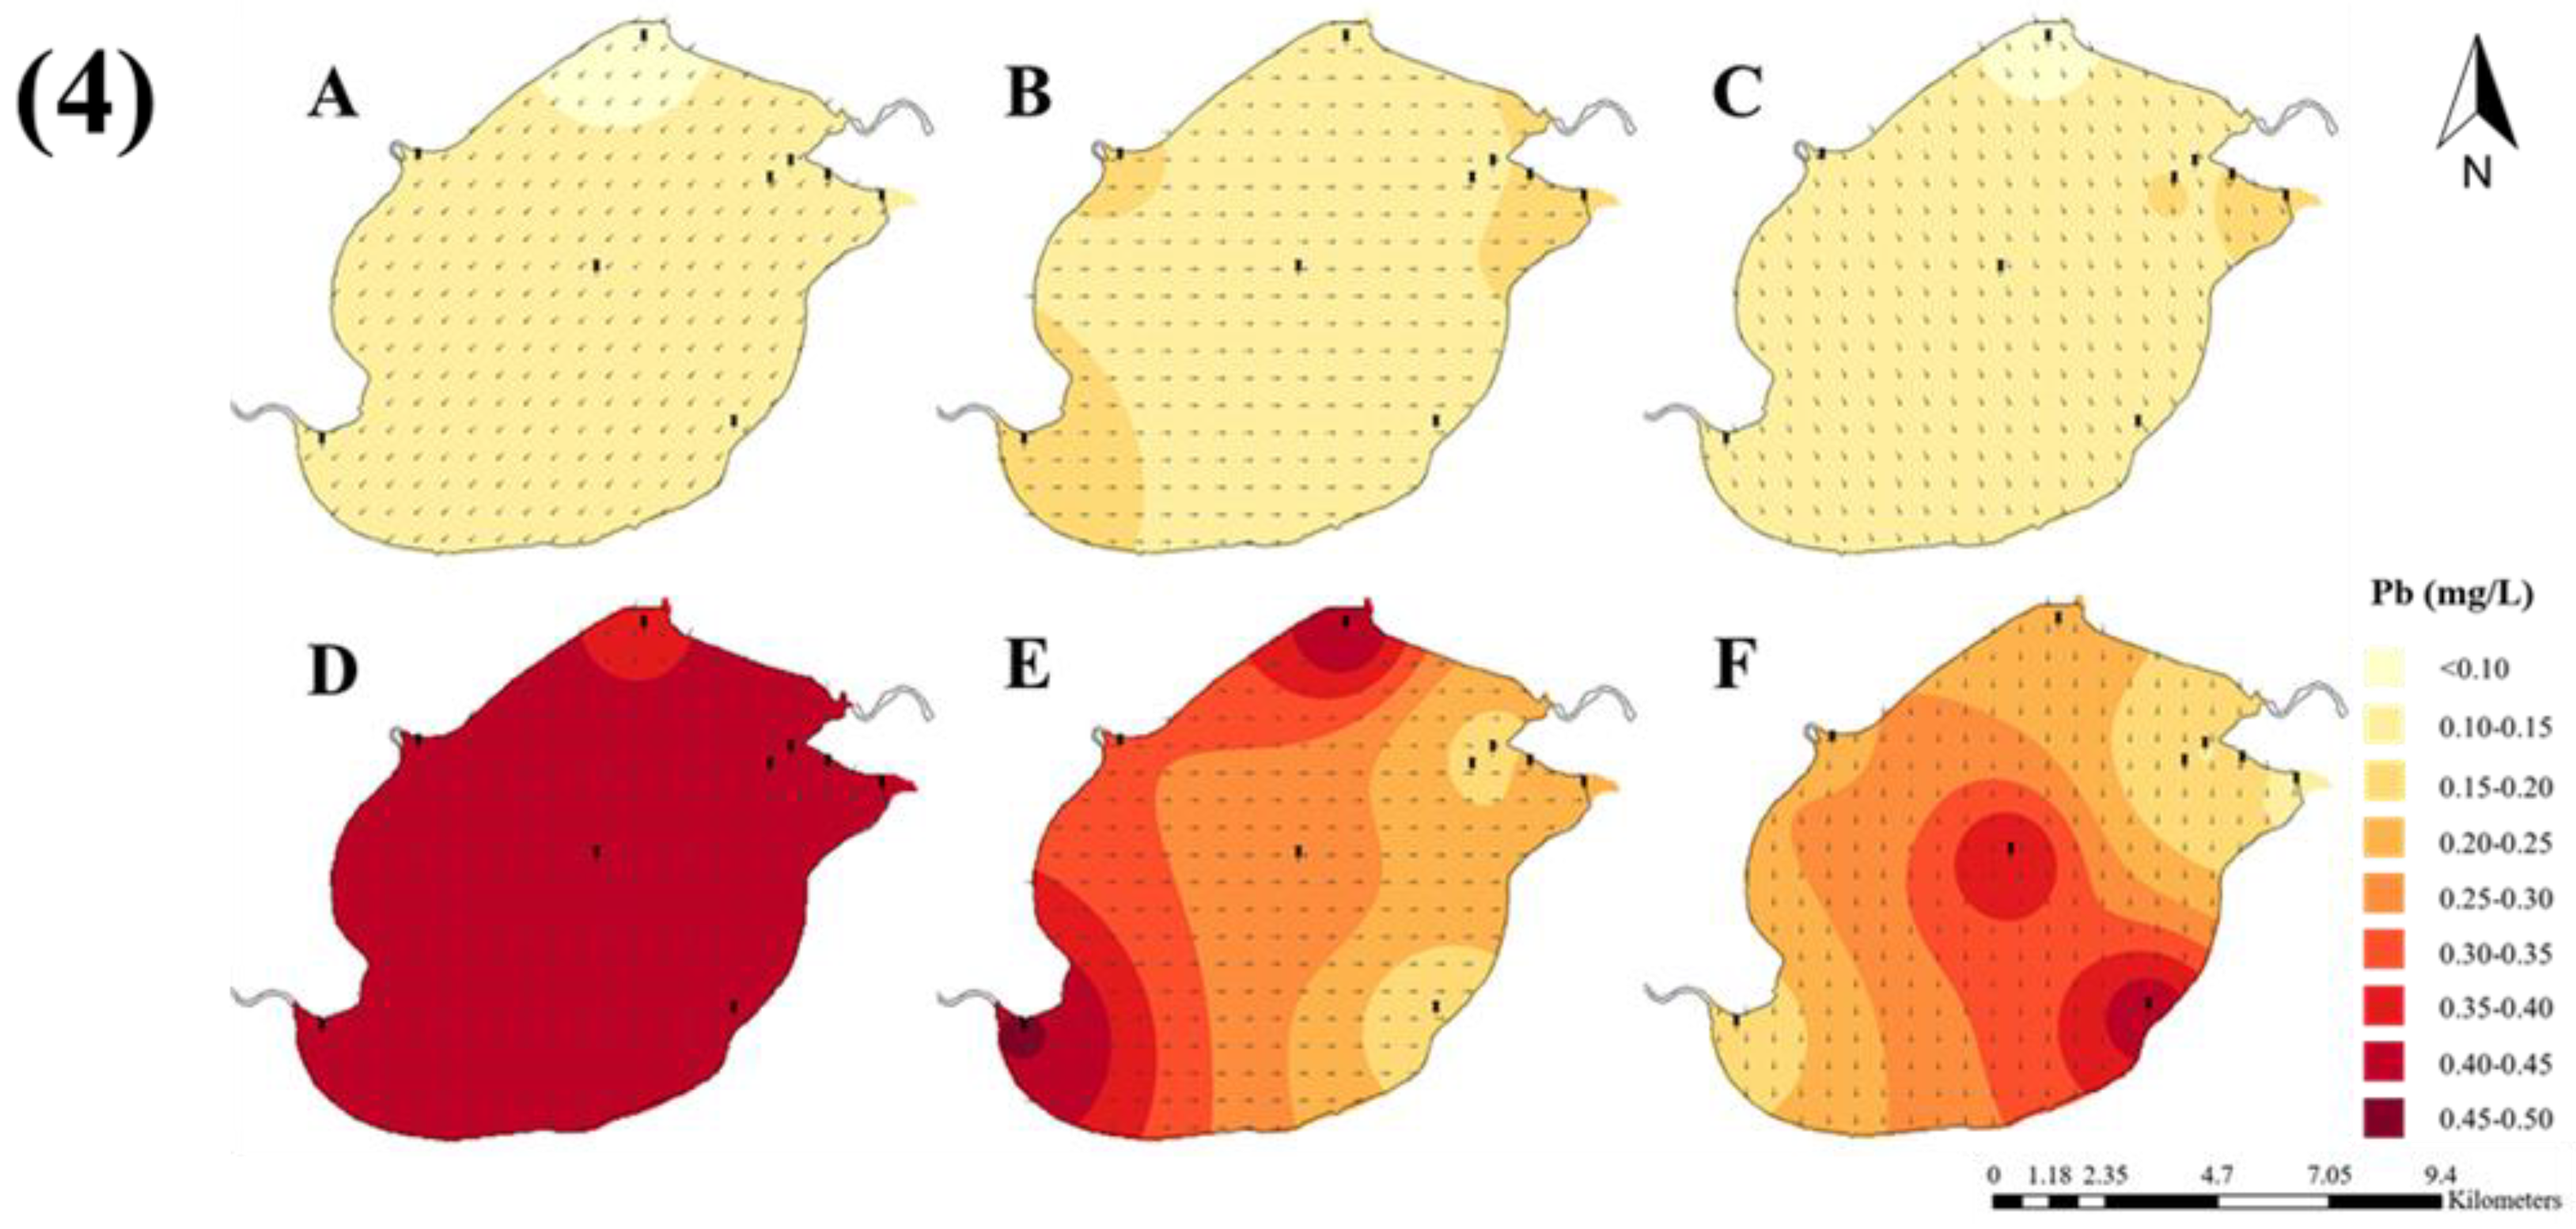
Considering the heavy metals, both As and Pb concentrations exceeded safety limits across Lake Maurepas throughout the sampling period at all three depths (refer to Table S2 and Figure 5(3),(4)). Spatial-temporal analysis reveals an increase in As concentrations from June to August, with the highest contamination observed in August. Pb concentrations were notably higher from September to November compared to other months. The impact of river discharges was most evident in August for As (Figure 5(3), Figures S13 and S14). Similarly, Figure 5(4), Figures S15 and S16 show elevated Pb concentrations near river discharges, highlighting the rivers’ influence on lake water pollution.
The previously conducted subsurface seismic survey and ongoing drilling activities by APC in the lake might also have impacted the contaminant concentration values in water and in sediment. However, Figure 5(1)–(4) shows low concentrations of contaminants near the D4 sampling site, the closest site to the STW, suggesting minimal impact from APC’s drilling and seismic activities on observed contaminant concentrations. The exception was higher Pb concentrations around the D4 site in November 2023 (Figure 5(4-F)).

3.4. Geospatial Analysis of Mercury (Hg) Distribution in Sedimentary Mud of Lake Maurepas

Mercury was not detected in significant amounts in the water samples. Higher concentrations were found in sediment samples but remained below the threshold (Table S2). Figure S17 depicts the distribution of Hg concentrations in sedimentary muds across the lake during the sampling period. Maximum levels were recorded at ND2 (25.61 ± 6.04 µg/kg) in November (Figure S17F), while minimum levels were found at ND3 (7.53 ± 1.09 µg/kg) in September (Figure S17D). Hg concentrations were relatively higher in June, August, and November compared to other months, with peak concentrations observed in November near the Amite River input and at ND4 in the middle of the lake. Increased rainfall and wind inflow can lead to surface, subsurface, or density currents, which transport sediment within the lake [55]. This phenomenon potentially explains the higher sediment Hg concentrations observed throughout ND2, ND4, and D4 in November (Figure S17F). Specifically, on 14th, 21st, and 26th November, the lake received substantial rainfall amounts of 19.3 mm, 18.5 mm, and 22.1 mm respectively, as shown in Figure 3F.

3.5. Predictive Modeling of Water Quality

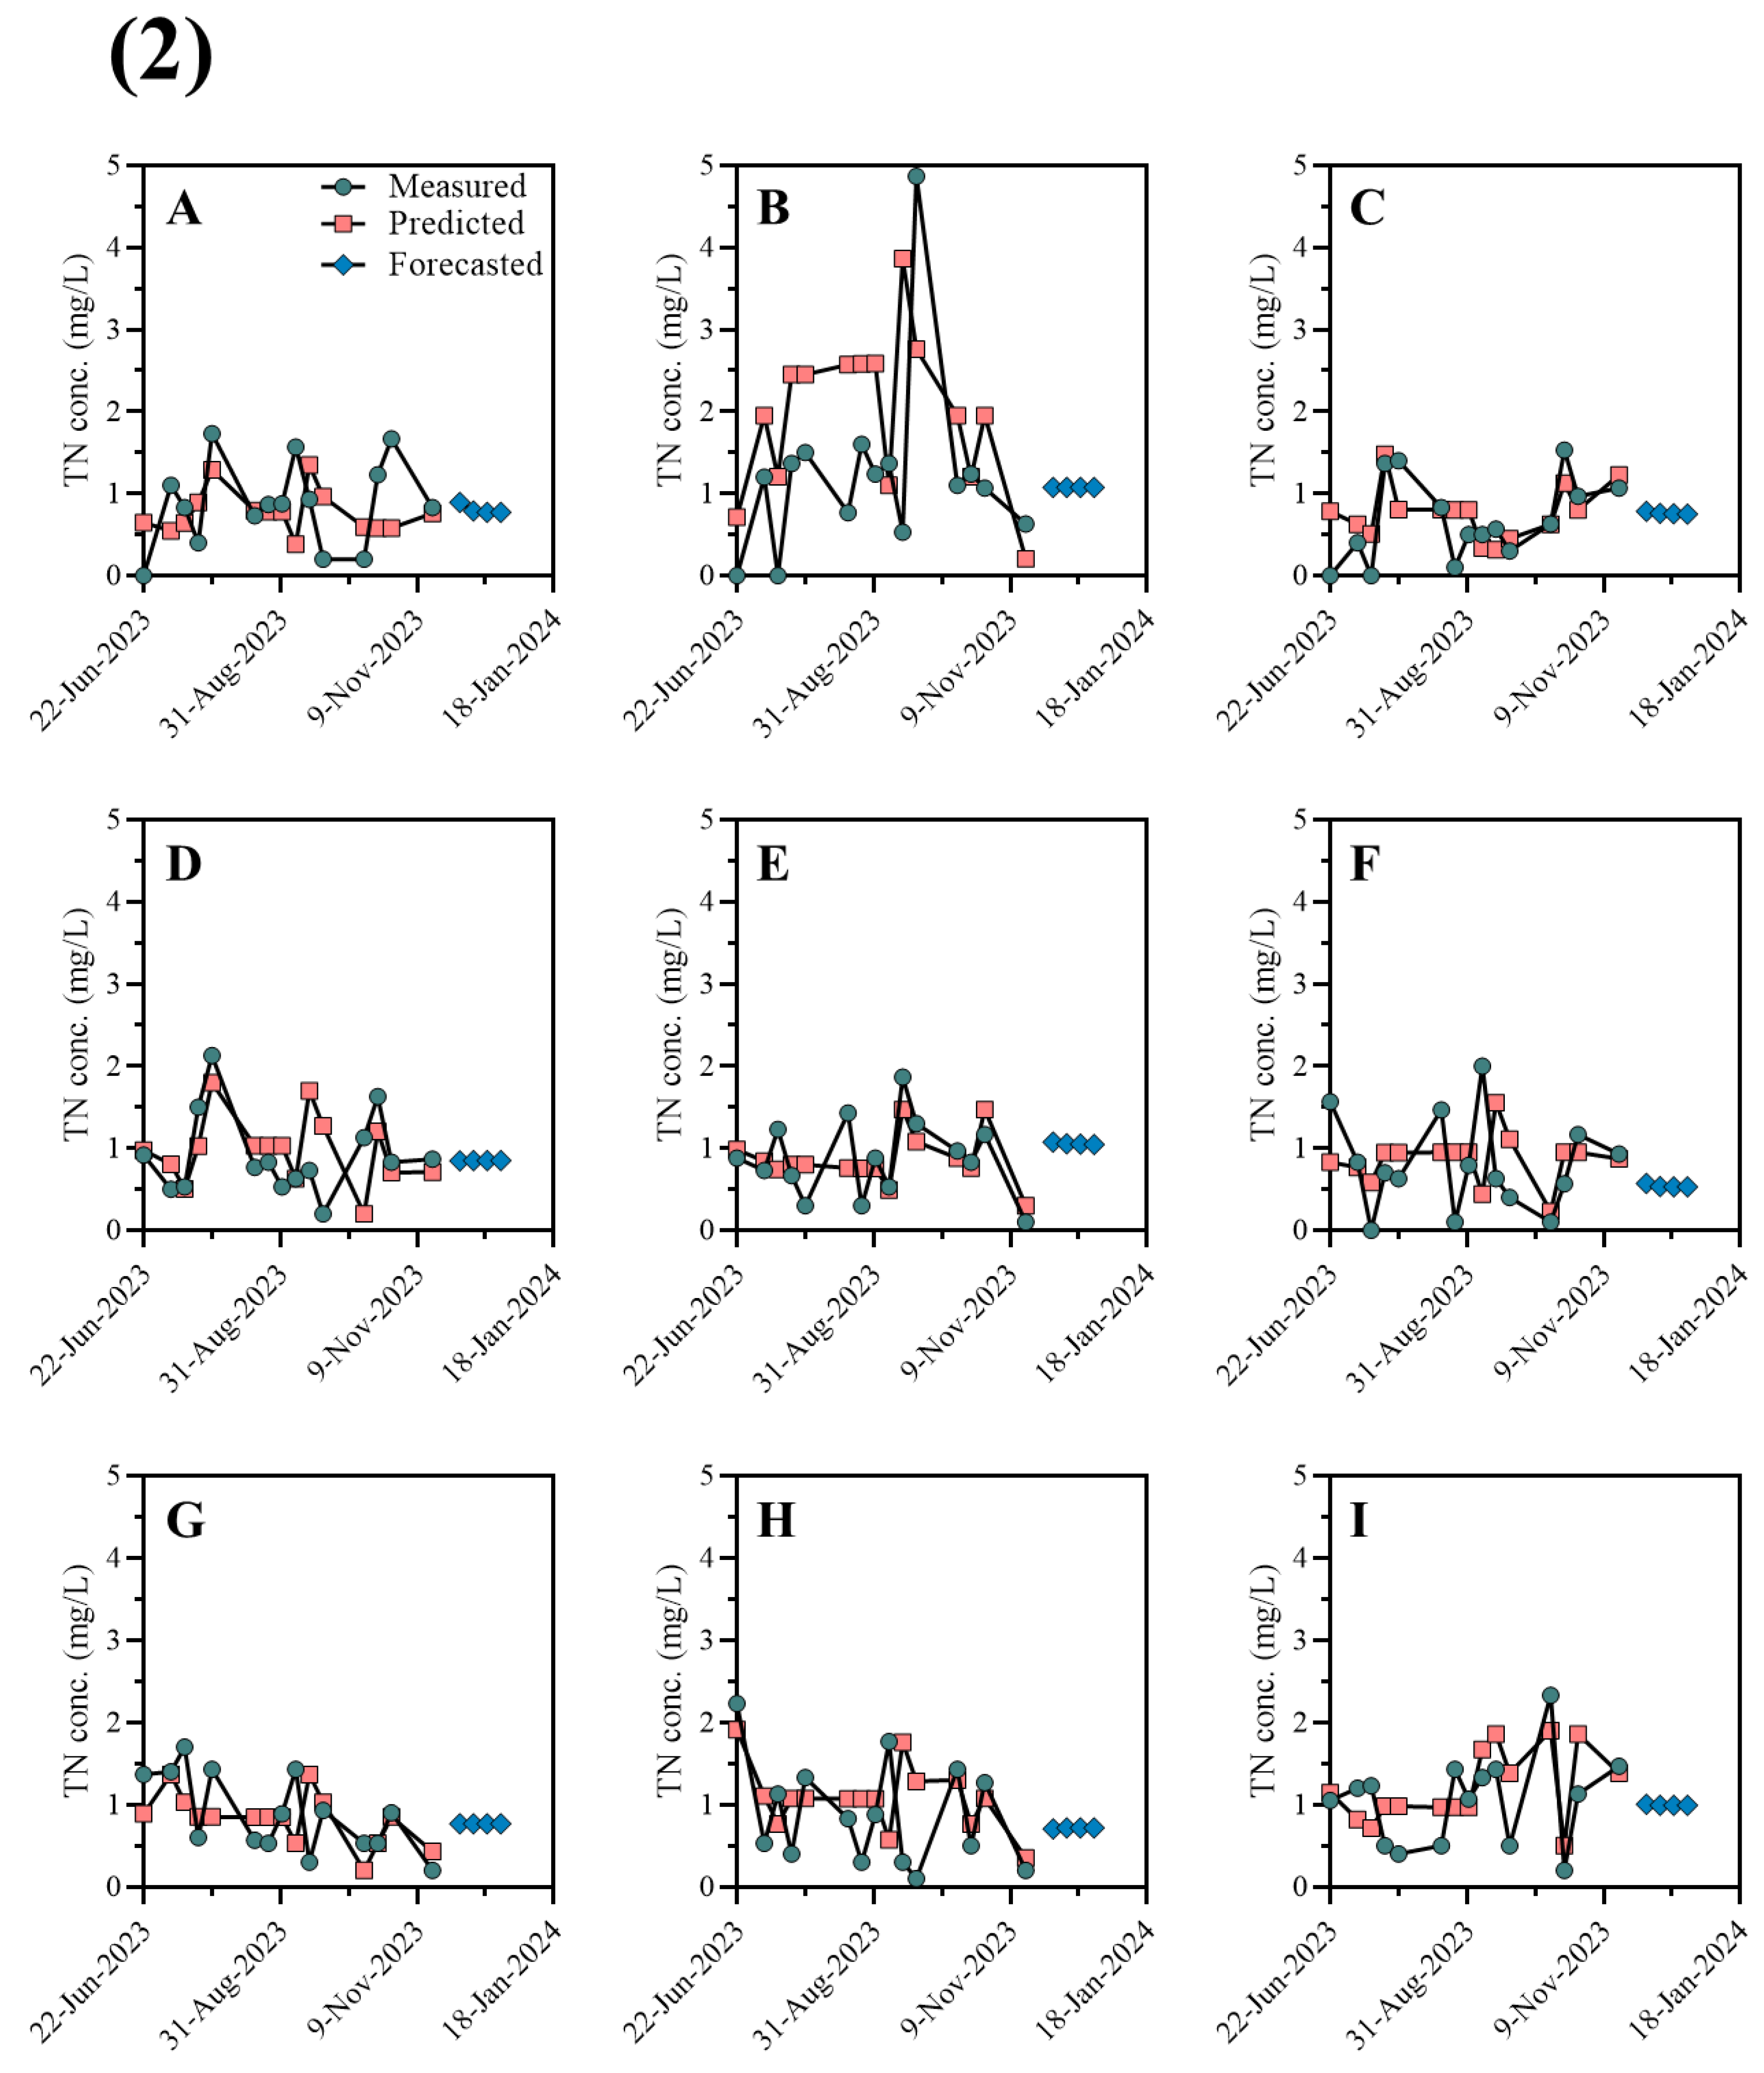
Data collected from the USGS monitoring station (Figure 2B) showed steep increases in salinity and SC parameters until November. This was followed by a decrease of 49.2% and 48.8% for salinity and SC, respectively, in December, bringing the values back to levels observed between September and October. Since the start of our study in June, we have collected samples from the lake at least once a month. Unfortunately, sampling in December 2023 was not possible due to the combination of high precipitation and wind speed (Figure 3G). As such, to predict the spatial-temporal changes of COD, TN, TP, As, and Pb pollutants in this month, we examined several forecasting methods, including curve fitting, exponential smoothing, forest-based, and LSTM models. These pollutants showed correlations with salinity and SC (see Section 3.2 and Section 3.3). The question was whether the spatial-temporal patterns of the pollutants align with the decreasing trends in salinity and SC observed for December.
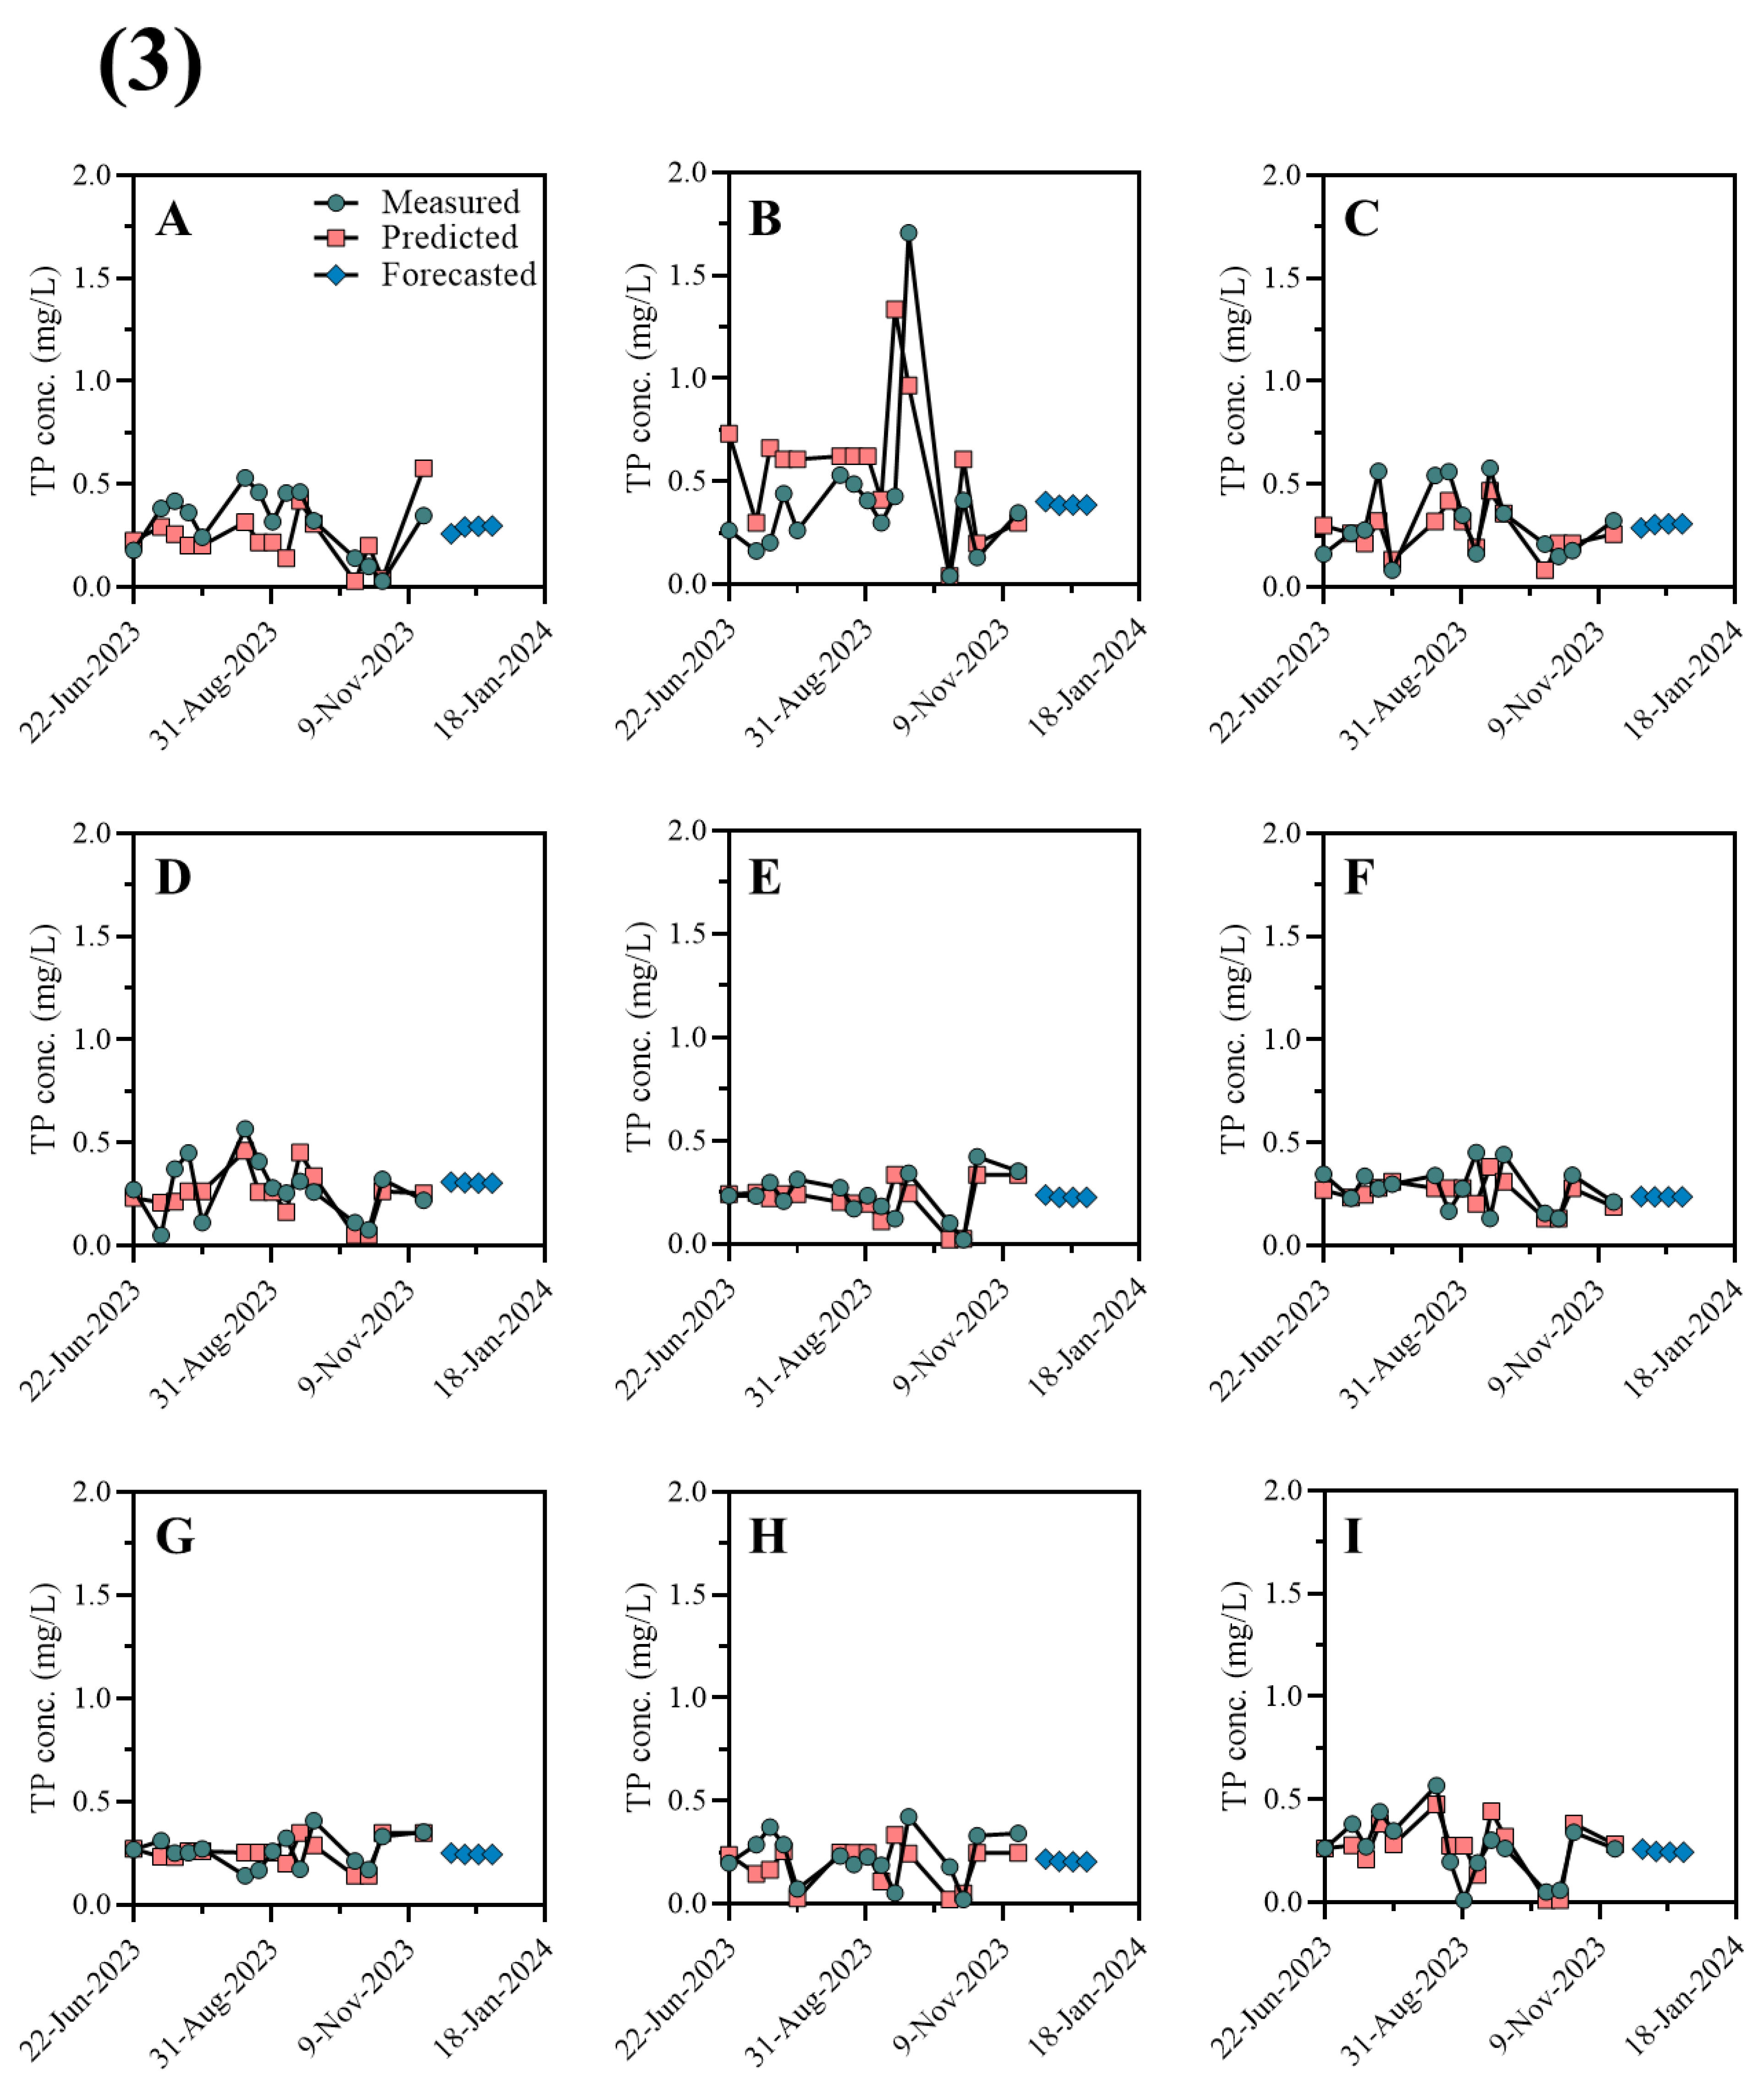
The forecasting results for all tested models are presented in Figure 6 and Supplementary Materials (Figures S18–S25, S28, and S29). Among the evaluated methods, the forest-based machine learning model demonstrated robust performance, as indicated by the lowest Root Mean Squared Error (RMSE) values shown in Table 1 and Table S9. Predictions were based solely on the water quality data collected from June to November 2023, due to the limitations in ArcGIS. The forest-based model was trained using hundred trees with a maximum depth of 10. The resulting predictions for COD, TN, TP, As, and Pb are illustrated in Figure 6 and Figures S20, and S23, respectively. The average R2 values for the nine sampling sites are 0.746 for COD, 0.759 for TN, 0.819 for As, 0.731 for TP, and 0.838 for Pb (Figure S25). All parameters showed decreasing trends in December across almost all the sampling sites. The LSTM model also demonstrated strong performance, as indicated by the RMSE values presented in Table 1. While both models exhibited satisfactory predictive capabilities, LSTM offers the advantage of potentially greater robustness due to its ability to incorporate a broader range of physical parameters as inputs. This inclusion of diverse variables may enhance the model’s capacity for more reliable predictions while reducing the risk of overfitting. The predicted concentration trends in December did not significantly differ from the measured values for September and October in most cases (p > 0.05). Exceptions included COD in ND3 and D4, TN in ND4 and D4, TP in ND1, and Pb in ND1 and ND5 (Table 2). These anomalies may be attributed to the connections of ND1, ND3, and ND5 to the Tickfaw and Blind Rivers and Manchac, which are independent sources of COD, TP, TN, and Pb, as well as the proximity of D4 to the STW. The observed similarity between salinity and SC behaviors in December with the predicted trends of these pollutants, particularly for COD in D1-D3, may be explained by the removal or settlement of contaminants from the Pass Manchac vehicle accident. This aligns with the persistence of pollutant sources previously identified in September and October.

4. Conclusions

This study was the first to quantitatively and predictively evaluate physical parameters, contaminants, nutrients, and heavy metals at different sites and depths of Lake Maurepas. By examining monthly trends and the spatial distribution of these chemicals throughout the lake, we have reached the following conclusions: (1) Our quantitative evaluation of water and sedimentary mud samples revealed alarming results: except for Hg and NH3-N, COD, TN, TP, As, and Pb levels in the lake exceeded safety thresholds. Moreover, the COD concentration in the lake water exhibits a consistent upward trend during the sampling period. (2) The spatial-temporal study showed significant monthly variations in COD, nutrient, and HMs levels, with higher concentrations during the months with increased rainfall, likely due to increased pollutant runoff. This analysis also indicated elevated concentrations of these pollutants in areas closer to the inputs from the Tickfaw, Amite, and Blind Rivers, as well as Pass Manchac. (3) The developed time series machine learning model predicted the spatial-temporal patterns of COD, TN, TP, As, and Pb concentrations for December 2023, filling in the data for this missing month. The predictions revealed decreasing trends, indicating that the concentrations of COD, TN, TP, As, and Pb in December are not significantly different from those in September and October at most sampling sites, aligning with the salinity and SC levels for December. In summary, pollution hotspots are concentrated near the stream inputs to the lake and Pass Manchac, which connects to Lake Pontchartrain. This work is highly significant for decision-makers as it enables them to understand the impact of pollutant loading—potentially from urban runoff, industrial activities, and agriculture—on the long-term evolution of the lake’s water quality. Additionally, it highlights the necessity for targeted remediation efforts to reduce pollutant concentrations in these critical spots. We note that while the IDW interpolation method used in ArcGIS is effective for estimating contaminant concentrations at unsampled sites it assumes spatial homogeneity among nearby points, which may overlook finer-scale variations, especially in areas with sparse sampling. Furthermore, environmental variability, such as flow patterns and seasonal shifts in lake dynamics, may introduce uncertainties that are not fully captured by the IDW method. The forest-based model’s accuracy can be limited by the relatively small dataset used in training, which may reduce its ability to generalize effectively across the lake area. Additionally, the model’s predictive performance may be affected by missing or unevenly distributed data points, potentially leading to reduced accuracy in predictions for less-sampled regions. Although LSTM models are effective for time-series predictions, their accuracy depends heavily on the quantity and quality of the data. In this study, the limited amount of data may impact the LSTM model’s ability to capture long-term patterns or seasonal cycles accurately. The model’s performance may also be influenced by any unobserved factors affecting contaminant levels, which are not explicitly accounted for in the dataset.
Our ongoing research focuses on continuously monitoring the water and sedimentary mud quality of the lake, expanding to include more compounds. We are also analyzing biological samples (catfish and blue crab) collected from the lake at different time intervals to assess contaminant concentrations, particularly focusing on the potential accumulation of heavy metals. Apart from these, we are conducting Non-Targeted Analysis (NTA) to identify unknown hazardous chemicals such as Halogenated Organic Compound (HOC) and polyfluoroalkyl substances (PFAS) in the water, sedimentary mud, and biological samples. Furthermore, we are deploying real-time sensors in the lake to collect big data, enhancing our capability to forecast and manage water quality issues.

Supplementary Materials

The supporting information file can be downloaded at: https://www.mdpi.com/article/10.3390/environments11120268/s1. References [42,56,57,58,59,60,61,62,63,64,65,66,67,68,69,70,71,72,73,74,75] cited in the supplementary material file. List of figures in the supplementary material file: Figure S1: Weekly trends of physical properties of water quality parameters: (A–D; water temperature, E–G; pH, H–K; salinity and L–O; specific conductance). The symbols indicate the weekly average values while the error bars indicate the standard deviation from the mean (n = 7). Figure S2: ‘super fog’ multi-car pileup on Louisiana highway near Pass Manchac on 23rd October 2023 [9]. Figure S3: Maps generated for geospatial variation of COD (middle, ~1.5 m from surface) from June-November 2023 using IDW function in ArcGIS: (A) June, (B) July, (C) August, (D) September, (E) October, (F) November. The black pins indicate the sampling locations. Figure S4: Maps generated for geospatial variation of COD (bottom, 3 m from surface) from June-November 2023 using IDW function in ArcGIS: (A) June, (B) July, (C) August, (D) September, (E) October, (F) November. The black pins indicate the sampling locations. Figure S5: Maps generated for geospatial variation of TN (middle, ~1.5 m from surface) from June-November 2023 using IDW function in ArcGIS: (A) June, (B) July, (C) August, (D) September, (E) October, (F) November. The black pins indicate the sampling locations. Figure S6: Maps generated for geospatial variation of TN (bottom, 3 m from surface) from June-November 2023 using IDW function in ArcGIS: (A) June, (B) July, (C) August, (D) September, (E) October, (F) November. The black pins indicate the sampling locations. Figure S7: Maps generated for geospatial variation of Total Phosphorus (TP) (surface water) from June-November 2023 using IDW function in ArcGIS: (A) June, (B) July, (C) August, (D) September, (E) October, (F) November. The black pins indicate the sampling sites and the arrows indicate the wind direction ~9.00 am in the specific sampling dates (6/22/2023, 7/20/2023, 8/18/2023, 9/22/2023, 10/20/2023, 11/17/2023). 9.00 am was selected considering the sampling time. Figure S8: Maps generated for geospatial variation of TP (middle, ~1.5 m from surface) from June-November 2023 using IDW function in ArcGIS: (A) June, (B) July, (C) August, (D) September, (E) October, (F) November. The black pins indicate the sampling locations. Figure S9: Maps generated for geospatial variation of TP (bottom, 3 m from surface) from June-November 2023 using IDW function in ArcGIS: (A) June, (B) July, (C) August, (D) September, (E) October, (F) November. The black pins indicate the sampling locations. Figure S10: Maps generated for geospatial variation of NH3-N (surface water) from June-November 2023 using IDW function in ArcGIS: (A) June, (B) July, (C) August, (D) September, (E) October, (F) November. The black pins indicate the sampling locations and the arrows indicate the wind direction. Figure S11: Maps generated for geospatial variation of NH3-N (middle, ~1.5 m from surface) from June-November 2023 using IDW function in ArcGIS: (A) June, (B) July, (C) August, (D) September, (E) October, (F) November. The black pins indicate the sampling locations. Figure S12: Maps generated for geospatial variation of NH3-N (bottom, 3 m from surface) from June-November 2023 using IDW function in ArcGIS: (A) June, (B) July, (C) August, (D) September, (E) October, (F) November. The black pins indicate the sampling locations. Figure S13: Maps generated for geospatial variation of As (middle, ~1.5 m from surface) from June-November 2023 using IDW function in ArcGIS: (A) June, (B) July, (C) August, (D) September, (E) October, (F) November. The black pins indicate the sampling locations. Figure S14: Maps generated for geospatial variation of As (bottom, 3 m from surface) from June-November 2023 using IDW function in ArcGIS: (A) June, (B) July, (C) August, (D) September, (E) October, (F) November. The black pins indicate the sampling locations. Figure S15: Maps generated for geospatial variation of Pb (middle, ~1.5 m from surface) from June-November 2023 using IDW function in ArcGIS: (A) June, (B) July, (C) August, (D) September, (E) October, (F) November. The black pins indicate the sampling locations. Figure S16: Maps generated for geospatial variation of Pb (bottom, 3 m from surface) from June-November 2023 using IDW function in ArcGIS: (A) June, (B) July, (C) August, (D) September, (E) October, (F) November. The black pins indicate the sampling locations. Figure S17: Maps generated for geospatial variation of Hg in sedimentary mud samples from June-November 2023 using IDW function in ArcGIS: (A) June, (B) July, (C) August, (D) September, (E) October, (F) November. The black pins indicate the sampling sites. Figure S18: Forecasted values of COD for December 2023 based on the data from June-November 2023 using different forecasting methods for sampling location ND1: (A) Linear curve fit, (B) Parabolic curve fit, (C) Exponential curve fit, (D) Gompertz (S-shaped) curve fit, (E) Exponential smoothing forecast, and (F) Forest-based forecast. The shaded area gives the 95% confidence interval of the forecasted value. Figure S19: Forecasted values of TN for December 2023 based on the data from June-November 2023 using different forecasting methods for sampling location ND4: (A) Linear curve fit, (B) Parabolic curve fit, (C) Exponential curve fit, (D) Gompertz (S-shaped) curve fit, (E) Exponential smoothing forecast, and (F) Forest-based forecast. The shaded area gives the 95% confidence interval of the forecasted value. Figure S20: Forecasted values of TP for December 2023 based on the data from June-November 2023 using Forest-based forecasting method: (A) ND1, (B) ND2, (C) ND3, (D) ND4, (E) D4, (F) ND5, (G) D1, (H) D2 and (I) D3. The shaded area gives the 95% confidence interval of the forecasted value. Figure S21: Forecasted values of TP for December 2023 based on the data from June-November 2023 using different forecasting methods for sampling location D4: (A) Linear curve fit, (B) Parabolic curve fit, (C) Exponential curve fit, (D) Gompertz (S-shaped) curve fit, (E) Exponential smoothing forecast, and (F) Forest-based forecast. The shaded area gives the 95% confidence interval of the forecasted value. Figure S22: Forecasted values of As for December 2023 based on the data from June-November 2023 using different forecasting methods for sampling location ND5: (A) Linear curve fit, (B) Parabolic curve fit, (C) Exponential curve fit, (D) Gompertz (S-shaped) curve fit, (E) Exponential smoothing forecast, and (F) Forest-based forecast. The shaded area gives the 95% confidence interval of the forecasted value. Figure S23: Forecasted values of Pb for December 2023 based on the data from June-November 2023 using Forest-based forecasting method: (A) ND1, (B) ND2, (C) ND3, (D) ND4, (E) D4, (F) ND5, (G) D1, (H) D2 and (I) D3. The shaded area gives the 95% confidence interval of the forecasted value. Figure S24: Forecasted values of Pb for December 2023 based on the data from June-November 2023 using different forecasting methods for sampling location ND2: (A) Linear curve fit, (B) Parabolic curve fit, (C) Exponential curve fit, (D) Gompertz (S-shaped) curve fit, (E) Exponential smoothing forecast, and (F) Forest-based forecast. The shaded area gives the 95% confidence interval of the forecasted value. Figure S25: Forecasted values of contaminants for December 2023 based on the data from June-November 2023 using Forest-based forecasting method: (1) COD, (2) TN, (3) As. The subgraphs indicate: (A) ND1, (B) ND2, (C) ND3, (D) ND4, (E) ND5, (F) D1, (G) D2, (H) D3 and (I) D4. The black color dotted lines indicate the range of 95% confidence interval of forecasted values. Figure S26: Measured values vs forecasted values of training data for 9 sampling sites: (A) COD, (B) TN, (C) TP, (D) As and (E) Pb. The dotted line indicates the trend line, equation and the R2 value of each trend line is shown in the graph. Figure S27: Correlation analysis among the environmental factors and water quality parameters considered for LSTM prediction model for 9 sampling sites: (A) correlation among environmental factors, correlation among environmental factors and water quality parameter (B) COD, (C) TN, (D) TP, (E) As and (F) Pb. R2 values were calculated using the Pearson correlation coefficient (pandas, Python). The darker the red color, the higher the positive correlation. Figure S28: Measured, predicted and forecasted values for 9 sampling sites using the model, LSTM1: (1) COD, (2) TN, (3) TP, (4) As and (5) Pb. Subfigures A–I represent the sampling sites of ND1, ND2, ND3, ND4, ND5, D1, D2, D3 and D4, respectively. Green circles show the measured values, orange boxes represent the predicted values using model LSTM1, while the blue diamond shape symbols represent the predicted values using model LSTM1 as stated in the subfigure (A) of each (1)–(5). Figure S29: Measured, predicted and forecasted values for 9 sampling sites using the model, LSTM3: (1) COD, (2) TN, (3) TP, (4) As and (5) Pb. Subfigures A–I represent the sampling sites of ND1, ND2, ND3, ND4, ND5, D1, D2, D3 and D4, respectively. Green circles show the measured values, orange boxes represent the predicted values using model LSTM3, while the blue diamond shape symbols represent the predicted values using model LSTM3 as stated in the subfigure (A) of each (1)–(5). List of tables in the supplementary material file: Table S1. Location and gauge heights details of the sampling sites. Table S2. Maximum permissible limits of water quality parameters for inland surface water. Table S3. COD concentration variation (mg/L) in different sampling sites between June-November 2023. Table S4. Total Nitrogen (TN) concentration variation (mg/L) in different sampling sites between June-November 2023. Table S5. Ammonia Nitrogen (NH3-N) concentration variation (mg/L) in different sampling sites between June-November 2023. Table S6. Total Phosphorus (TP) concentration variation (mg/L) in different sampling sites between June-November 2023. Table S7. Heavy metals (As, Pb) concentration variation (mg/L) in different sampling sites between June-November 2023. Table S8. Hg concentration in water (mg/L) and sedimentary mud (μg/kg) in different sampling sites between June-November 2023. Table S9. Evaluating the accuracy of water quality forecasting models in terms of RMSE for each sampling location for COD, TN, and As (All the values are in mg/L).

Author Contributions

Conceptualization, T.G. and F.E.; methodology, T.G., M.A.R. and F.E.; software, T.G. and M.A.R.; validation, T.G., M.A.R. and F.E.; formal analysis, T.G. and M.A.R.; investigation, T.G., M.A.R., E.E. and F.E.; resources, F.E.; data curation, T.G., M.A.R., Z.L. and E.E.; writing—original draft preparation, T.G.; writing—review and editing, T.G. and F.E.; visualization, T.G.; supervision, F.E.; project administration, F.E.; funding acquisition, F.E. All authors have read and agreed to the published version of the manuscript.

Funding

This research was funded by the Air Products and Chemicals, Inc., grant number GR201353, Lake Maurepas Monitoring Phase III (53798).

Data Availability Statement

The raw data supporting the conclusions of this article will be made available by the authors on request.

Conflicts of Interest

The authors declare no conflicts of interest. The funders had no role in the design of the study; in the collection, analyses, or interpretation of data; in the writing of the manuscript; or in the decision to publish the results.

References

  1. Ho, L.T.; Goethals, P.L. Opportunities and Challenges for the Sustainability of Lakes and Reservoirs in Relation to the Sustainable Development Goals (SDGs). Water 2019, 11, 1462. [Google Scholar] [CrossRef]
  2. Reid, A.J.; Carlson, A.K.; Creed, I.F.; Eliason, E.J.; Gell, P.A.; Johnson, P.T.; Kidd, K.A.; MacCormack, T.J.; Olden, J.D.; Ormerod, S.J.; et al. Emerging Threats and Persistent Conservation Challenges for Freshwater Biodiversity. Biol. Rev. 2019, 94, 849–873. [Google Scholar] [CrossRef] [PubMed]
  3. Koski, V.; Kotamäki, N.; Hämäläinen, H.; Meissner, K.; Karvanen, J.; Kärkkäinen, S. The Value of Perfect and Imperfect Information in Lake Monitoring and Management. Sci. Total Environ. 2020, 726, 138396. [Google Scholar] [CrossRef] [PubMed]
  4. Hassan, B.; Qadri, H.; Ali, M.N.; Khan, N.A.; Yatoo, A.M. Impact of Climate Change on Freshwater Ecosystem and Its Sustainable Management. In Fresh Water Pollution Dynamics and Remediation; Qadri, H., Bhat, R., Mehmood, M., Dar, G., Eds.; Springer: Singapore, 2020; pp. 105–121. [Google Scholar] [CrossRef]
  5. Bhattarai, S. Spatial Distribution of Heavy Metals in Louisiana Sediments and Study of Factors Impacting the Concentrations. Master’s Thesis, Louisiana State University and Agricultural and Mechanical College, Baton Rouge, LA, USA, 2006. [Google Scholar]
  6. Burlakova, L.E.; Hinchey, E.K.; Karatayev, A.Y.; Rudstam, L.G. US EPA Great Lakes National Program Office Monitoring of the Laurentian Great Lakes: Insights from 40 Years of Data Collection. J. Great Lakes Res. 2018, 44, 535–538. [Google Scholar] [CrossRef]
  7. Carlson, D.L.; Swackhamer, D.L. Results from the US Great Lakes Fish Monitoring Program and Effects of Lake Processes on Bioaccumulative Contaminant Concentrations. J. Great Lakes Res. 2006, 32, 370–385. [Google Scholar] [CrossRef]
  8. Heidtke, T.; Hartig, J.H.; Zarull, M.A.; Yu, B. PCB Levels and Trends within the Detroit River-Western Lake Erie Basin: A Historical Perspective of Ecosystem Monitoring. Environ. Monit. Assess. 2006, 112, 23–33. [Google Scholar] [CrossRef]
  9. Boegehold, A.G.; Burtner, A.M.; Camilleri, A.C.; Carter, G.; DenUyl, P.; Fanslow, D.; Fyffe Semenyuk, D.; Godwin, C.M.; Gossiaux, D.; Johengen, T.H.; et al. Routine Monitoring of Western Lake Erie to Track Water Quality Changes Associated with Cyanobacterial Harmful Algal Blooms. Earth Syst. Sci. Data Discuss. 2023, 15, 3853–3868. [Google Scholar] [CrossRef]
  10. Seelbach, P.W.; Fogarty, L.R.; Bunnell, D.B.; Haack, S.K.; Rogers, M.W. A Conceptual Framework for Lake Michigan Coastal/Nearshore Ecosystems, with Application to Lake Michigan Lakewide Management Plan (LaMP) Objectives; U.S. Geological Survey: Reston, VI, USA, 2013; No. 2013-1138. [Google Scholar] [CrossRef]
  11. McCormick, M.J.; Pazdalski, J.D. Monitoring Midlake Water Temperature in Southern Lake Michigan for Climate Change Studies. Clim. Chang. 1993, 25, 119–125. [Google Scholar] [CrossRef]
  12. Zhang, X.; Rygwelski, K.R.; Rossmann, R. The Lake Michigan Contaminant Transport and Fate Model, LM2-Toxic: Development, Overview, and Application. J. Great Lakes Res. 2009, 35, 128–136. [Google Scholar] [CrossRef]
  13. Ji, G.; Havens, K. Periods of Extreme Shallow Depth Hinder but Do Not Stop Long-Term Improvements of Water Quality in Lake Apopka, Florida (USA). Water 2019, 11, 538. [Google Scholar] [CrossRef]
  14. Waters, M.N.; Schelske, C.L.; Brenner, M. Cyanobacterial Dynamics in Shallow Lake Apopka (Florida, USA) Before and After the Shift from a Macrophyte-Dominated to a Phytoplankton-Dominated State. Freshw. Biol. 2015, 60, 1571–1580. [Google Scholar] [CrossRef]
  15. Schelske, C.L.; Coveney, M.F.; Aldridge, F.J.; Kenney, W.F.; Cable, J.E. Wind or Nutrients: Historic Development of Hypereutrophy in Lake Apopka, Florida. Adv. Limnol. 2000, 55, 543–563. [Google Scholar]
  16. Louisiana Clean Energy Complex USA. 2024. Available online: https://www.airproducts.com/louisiana-clean-energy (accessed on 28 April 2024).
  17. Hunt, A.J.; Sin, E.H.; Marriott, R.; Clark, J.H. Generation, Capture, and Utilization of Industrial Carbon Dioxide. ChemSusChem 2010, 3, 306–322. [Google Scholar] [CrossRef]
  18. Massarweh, O.; Al-Khuzaei, M.; Al-Shafi, M.; Bicer, Y.; Abushaikha, A.S. Blue Hydrogen Production from Natural Gas Reservoirs: A Review of Application and Feasibility. J. CO2 Util. 2023, 70, 102438. [Google Scholar] [CrossRef]
  19. Air Products and Chemicals, Inc. Project Updates USA. 2024. Available online: https://www.airproducts.com/louisiana-clean-energy/project-updates (accessed on 2 May 2024).
  20. Khalil, S.M.; Forrest, B.M.; Lowiec, M.; Suthard, B.C.; Raynie, R.C.; Haywood, E.L.; Robertson, Q.; Andrews, J. Overview of Statewide Geophysical Surveys for Ecosystem Restoration in Louisiana. Shore Beach 2020, 88, 102–109. [Google Scholar] [CrossRef]
  21. Burden, D.G.; Malone, R.F.; Geaghan, J. Development of a Condition Index for Louisiana Lakes. Lake Reserv. Manag. 1985, 1, 68–72. [Google Scholar]
  22. Singer, M. Down Cancer Alley: The Lived Experience of Health and Environmental Suffering in Louisiana’s Chemical Corridor. Med. Anthropol. Q. 2011, 25, 141–163. [Google Scholar] [CrossRef]
  23. Montanio, P.A. Bayou Dupont Marsh and Ridge Creation CWPPRA Project, Fed No. BA-48: Environmental Assessment; Jefferson and Plaquemines Parishes: Barataria, LA, USA, 2011. Available online: https://repository.library.noaa.gov/view/noaa/4124 (accessed on 2 May 2024).
  24. Li, J.; Huang, J.F.; Wang, X.Z. A GIS-Based Approach for Estimating Spatial Distribution of Seasonal Temperature in Zhejiang Province, China. J. Zhejiang Univ.-Sci. A 2006, 7, 647–656. [Google Scholar] [CrossRef]
  25. Zhou, W.; Chen, G.; Li, H.; Luo, H.; Huang, S.L. GIS Application in Mineral Resource Analysis—A Case Study of Offshore Marine Placer Gold at Nome, Alaska. Comput. Geosci. 2007, 33, 773–788. [Google Scholar] [CrossRef]
  26. Baustian, M.M.; Clark, F.R.; Jerabek, A.S.; Wang, Y.; Bienn, H.C.; White, E.D. Modeling Current and Future Freshwater Inflow Needs of a Subtropical Estuary to Manage and Maintain Forested Wetland Ecological Conditions. Ecol. Indic. 2018, 85, 791–807. [Google Scholar] [CrossRef]
  27. Nijmeijer, R.; de Haas, A.; Dost, R.J.J.; Budde, P.E. ILWIS 3.0 Academic: User’s Guide, ITC, ILWIS: Enschede, The Netherlands, 2001.
  28. Shyu, G.S.; Cheng, B.Y.; Chiang, C.T.; Yao, P.H.; Chang, T.K. Applying Factor Analysis Combined with Kriging and Information Entropy Theory for Mapping and Evaluating the Stability of Groundwater Quality Variation in Taiwan. Int. J. Environ. Res. Public Health 2011, 8, 1084–1109. [Google Scholar] [CrossRef] [PubMed]
  29. Kushwaha, S.P.S.; Khan, A.; Habib, B.; Quadri, A.; Singh, A. Evaluation of Sambar and Muntjak Habitats Using Geostatistical Modeling. Curr. Sci. 2004, 86, 1390–1400. [Google Scholar]
  30. Zarco-Perello, S.; Simões, N. Ordinary Kriging vs Inverse Distance Weighting: Spatial Interpolation of the Sessile Community of Madagascar Reef, Gulf of Mexico. PeerJ 2017, 5, e4078. [Google Scholar] [CrossRef] [PubMed]
  31. Karydas, C.G.; Gitas, I.Z.; Koutsogiannaki, E.; Lydakis-Simantiris, N.; Silleos, G.N. Evaluation of Spatial Interpolation Techniques for Mapping Agricultural Topsoil Properties in Crete. EARSeL eProceedings 2009, 8, 26–39. [Google Scholar]
  32. USGS Earth Explorer USA. 2024. Available online: https://earthexplorer.usgs.gov/ (accessed on 23 April 2024).
  33. Barazzetti, L.; Previtali, M.; Roncoroni, F. Visualization and Processing of Structural Monitoring Data Using Space-Time Cubes. In Proceedings of the International Conference on Computational Science and Its Applications, Malaga, Spain, 4–7 July 2022; Springer International Publishing: Cham, Switzerland, 2022; pp. 19–31. [Google Scholar] [CrossRef]
  34. Asmat, A.; Hazali, N.A.; Nor, A.N.M.; Zuhan, F.K. Seasonal-Spatial of Putrajaya Lake Water Quality Parameter (WQP) Concentration Using Geographic Information System (GIS). Int. J. Eng. Technol. (UAE) 2018, 7, 176–181. [Google Scholar] [CrossRef]
  35. Schindler, D.W.; Bayley, S.E.; Parker, B.R.; Beaty, K.G.; Cruikshank, D.R.; Fee, E.J.; Schindler, E.U.; Stainton, M.P. The Effects of Climatic Warming on the Properties of Boreal Lakes and Streams at the Experimental Lakes Area, Northwestern Ontario. Limnol. Oceanogr. 1996, 41, 1004–1017. [Google Scholar] [CrossRef]
  36. Vasistha, P.; Ganguly, R. Water quality assessment in two lakes of Panchkula, Haryana, using GIS: Case study on seasonal and depth wise variations. Environ. Sci. Pollut. Res. 2022, 29, 43212–43236. [Google Scholar] [CrossRef]
  37. Cieśliński, R. Extreme Changes in Salinity Levels in the Waters of Coastal Lakes in Poland. Limnol. Rev. 2009, 9, 73–80. [Google Scholar]
  38. Obolewski, K.; Glińska-Lewczuk, K.; Szymańska, M.; Mrozińska, N.; Bąkowska, M.; Astel, A.; Lew, S.; Paturej, E. Patterns of Salinity Regime in Coastal Lakes Based on Structure of Benthic Invertebrates. PLoS ONE 2018, 13, e0207825. [Google Scholar] [CrossRef]
  39. Yang, W.; Zhao, Y.; Wang, D.; Wu, H.; Lin, A.; He, L. Using principal components analysis and IDW interpolation to determine spatial and temporal changes of surface water quality of Xianjiang river in Huangshan, China. Int. J. Environ. Res. Public Health 2020, 17, 2942. [Google Scholar] [CrossRef]
  40. VanLandeghem, M.M.; Meyer, M.D.; Cox, S.B.; Sharma, B.; Patiño, R. Spatial and Temporal Patterns of Surface Water Quality and Ichthyotoxicity in Urban and Rural River Basins in Texas. Water Res. 2012, 46, 6638–6651. [Google Scholar] [CrossRef] [PubMed]
  41. Baalousha, M.; McNeal, S.; Scott, G.I. An Assessment of Nonpoint Source Pollution in Stormwater Pond Systems in Coastal South Carolina. Stormwater Ponds Coast. South Carol. 2019, 192. [Google Scholar]
  42. WBRZ-TV (News) Public File. Available online: https://www.wbrz.com/news/death-toll-rises-to-8-in-i-55-pileup-caused-by-super-fog-bridge-will-need-significant-repairs/ (accessed on 2 May 2024).
  43. Xu, R.; Lu, L.; Hu, Y.; Liu, S. Spatio-temporal characteristics of the impacts of land-use change on carbon emission: A case study of Hangzhou, China. In Proceedings of the 2023 11th International Conference on Agro-Geoinformatics, Wuhan, China, 25–28 July 2023; IEEE: Piscataway, NJ, USA, 2023; pp. 1–6. [Google Scholar] [CrossRef]
  44. Gao, K.; Beardall, J.; Häder, D.P.; Hall-Spencer, J.M.; Gao, G.; Hutchins, D.A. Effects of ocean acidification on marine photosynthetic organisms under the concurrent influences of warming, UV radiation, and deoxygenation. Front. Mar. Sci. 2019, 6, 322. [Google Scholar] [CrossRef]
  45. Lv, Z.; Ran, X.; Liu, J.; Feng, Y.; Zhong, X.; Jiao, N. Effectiveness of Chemical Oxygen Demand as an Indicator of Organic Pollution in Aquatic Environments. Ocean.-Land-Atmos. Res. 2024, 3, 0050. [Google Scholar] [CrossRef]
  46. Bargu, S.; Hiatt, M.; Maiti, K.; Miller, P.; White, J.R. The Future of Cyanobacteria Toxicity in Estuaries Undergoing Pulsed Nutrient Inputs: A Case Study from Coastal Louisiana. Water 2023, 15, 3816. [Google Scholar] [CrossRef]
  47. Mance, G. Pollution Threat of Heavy Metals in Aquatic Environments; Springer Science & Business Media: Berlin/Heidelberg, Germany, 2012. [Google Scholar]
  48. Chigira, M.; Oyama, T. Mechanism and effect of chemical weathering of sedimentary rocks. Dev. Geotech. Eng. 2000, 84, 267–278. [Google Scholar] [CrossRef]
  49. Wu, Z.; Zhang, D.; Cai, Y.; Wang, X.; Zhang, L.; Chen, Y. Water quality assessment based on the water quality index method in Lake Poyang: The largest freshwater lake in China. Sci. Rep. 2017, 7, 17999. [Google Scholar] [CrossRef]
  50. USGS Coastal and Marine Geology Program USA, 2020–2030. Available online: https://pubs.usgs.gov/of/2002/of02-206/biology/pg71fig1.html (accessed on 25 April 2024).
  51. Wicke, D.; Cochrane, T.A.; O’Sullivan, A.D. Atmospheric deposition and storm induced runoff of heavy metals from different impermeable urban surfaces. J. Environ. Monit. 2012, 14, 209–216. [Google Scholar] [CrossRef]
  52. Huang, J.; Huang, Y.; Zhang, Z. Coupled Effects of Natural and Anthropogenic Controls on Seasonal and Spatial Variations of River Water Quality During Baseflow in a Coastal Watershed of Southeast China. PLoS ONE 2014, 9, e91528. [Google Scholar] [CrossRef]
  53. Dökmen, F. Temporal variation of biological oxygen demand (BOD), chemical oxygen demand (COD), and pH values in surface waters of Gölcük-Kocaeli, Turkey. Plants Pollut. Remed. 2015, 341–347. [Google Scholar] [CrossRef]
  54. Zou, D.; Chi, Y.; Dong, J.; Fu, C.; Wang, F.; Ni, M. Supercritical water oxidation of tannery sludge: Stabilization of chromium and destruction of organics. Chemosphere 2013, 93, 1413–1418. [Google Scholar] [CrossRef] [PubMed]
  55. Renaut, R.W.; Owen, R.B. Lake processes and sedimentation. In The Kenya Rift Lakes: Modern and Ancient: Limnology and Limnogeology of Tropical Lakes in a Continental Rift; Springer: Berlin/Heidelberg, Germany, 2023; pp. 129–160. [Google Scholar] [CrossRef]
  56. Hach Chemical Company. Oxygen Demand, Chemical Using Reactor Digestion Method; HACH 8000, 40 CFR 136.3(a), 2007. Available online: https://law.resource.org/pub/us/cfr/ibr/004/index.html (accessed on 28 April 2024).
  57. Hach Chemical Company. Persulfate Digestion Method; Method 10071, 2007. Available online: https://www.hach.com/asset-get.download.jsa?id=7639984837&srsltid=AfmBOopqI9kaeRsLjtGbV00M-3QS4NOopgLknfKU_SzVy6HmY3wyMaf0 (accessed on 28 April 2024).
  58. Hach Chemical Company. Salicylate Method; Method 10023, Nitrogen, Ammonia, 2007. Available online: https://ca.hach.com/nitrogen-ammonia-reagent-set-tnt-amver-salicylate-low-range/product-details?id=14533975510&srsltid=AfmBOopnj2izfds5futzZepshZhfo1yzPgcbysI8GJdrJXwbUHxaynh3 (accessed on 28 April 2024).
  59. USEPA. PhosVer® 3 with Acid Persulfate Digestion Method; Phosphorus, Total, Method 8190. Available online: https://www.hach.com/asset-get.download-en.jsa?id=7639983838&srsltid=AfmBOoqITSvmiv0zS9ozjDkWkwYY94-F1vWyKCgwC7fkXKnU79P3Jkp6 (accessed on 28 April 2024).
  60. Esri. How Inverse Distance Weighted Interpolation Works. 2024. Available online: https://help.supermap.com/iDesktopX/1101/en/tutorial/Analyst/Raster/interpolation/IDWinterpolation (accessed on 28 April 2024).
  61. Esri. Curve Fit Forecast (Space Time Pattern Mining). 2024. Available online: https://pro.arcgis.com/en/pro-app/latest/tool-reference/space-time-pattern-mining/curvefitforecast.htm (accessed on 28 April 2024).
  62. Esri. How Exponential Smoothing Forecast Works. 2024. Available online: https://pro.arcgis.com/en/pro-app/latest/tool-reference/space-time-pattern-mining/learnmoreexponentialsmoothingforecast.htm (accessed on 29 April 2024).
  63. Esri. Forest-Based and Boosted Classification and Regression (Spatial Statistics). 2024. Available online: https://pro.arcgis.com/en/pro-app/latest/tool-reference/spatial-statistics/forestbasedclassificationregression.htm (accessed on 29 April 2024).
  64. World Health Organization. WHO Guidelines for Drinking Water Quality, 3rd ed.; World Health Organization: Geneva, Switzerland, 2011. [Google Scholar]
  65. Sudha, R.; Sangeetha, T. Comparative study of water quality parameters of lake water (Chinna Eri) with surrounding bore well water samples, Thuraiyur (Tk), Tiruchirappalli (Dt), Tamil Nadu. Int. J. Curr. Res. Chem. Pharm. Sci. 2017, 4, 14–18. [Google Scholar]
  66. Abdul Hameed, M.; Jawad, A.; Haider, S.A.; Bahram, K.M. Application of water quality index for assessment of Dokan Lake ecosystem, Kurdistan region, Iraq. J. Water Resour. Prot. 2010, 2, 792–798. [Google Scholar]
  67. Tambekar, D.; Waghode, S.; Ingole, S.; Gulhane, S. Water quality index (WQI), analysis of the salinity-affected villages from Purna River basin of Vidarbha region. Nat. Environ. Pollut. Technol. 2008, 7, 707–711. [Google Scholar]
  68. Abate, B.; Woldesenbet, A.; Fitamo, D. Water quality assessment of Lake Hawassa for multiple designated water uses. Water Utility J. 2015, 9, 47–60. [Google Scholar]
  69. Puri, P.J.; Yenkie, M.K.N.; Battalwar, D.G.; Gandhare, N.V.; Dhanorkar, D.B. Study and interpretation of physico-chemical characteristics of lake water quality in Nagpur city (India). Rasayan J. Chem. 2010, 3, 800–810. [Google Scholar]
  70. Chapman, D.; Kimstach, V. Selection of water quality variables. In Water Quality Assessment: A Guide to the Use of Biota, Sediments, and Water in Environmental Monitoring, 2nd ed.; Chapman, D., Ed.; Taylor and Francis: London, UK; New York, NY, USA, 1996; p. 609. [Google Scholar]
  71. Worako, A.W. Physicochemical and biological water quality assessment of Lake Hawassa for multiple designated water uses. J. Urban Environ. Eng. 2015, 9, 146–157. [Google Scholar] [CrossRef]
  72. Mamdouh, S.M.; Abdel Samie, A.E.E.; Alaa, E.A.; Essam, A.M. Metal distribution in water and sediments of Lake Edku, Egypt. Egypt. Sci. Mag. 2004, 1, 13–22. [Google Scholar]
  73. Wu, J.; Xue, C.; Tian, R.; Wang, S. Lake water quality assessment: A case study of Shahu Lake in the semiarid loess area of northwest China. Environ. Earth Sci. 2017, 76, 1–15. [Google Scholar] [CrossRef]
  74. Edition, F. Guidelines for drinking-water quality. WHO Chron. 2011, 38, 104–108. [Google Scholar]
  75. Pontius, F.W. Update on USEPA’s drinking water regulations. J. Am. Water Works Assoc. 2003, 95, 57–68. [Google Scholar] [CrossRef]
Figure 2. Monthly trends of physical properties of water: (A) water temperature and pH, (B) Salinity and specific conductance (measured at 25 °C). The symbols indicate the monthly average values while the error bars indicate the standard deviation from the mean (n = 30 or 31) (Except pH, other data was extracted from the United States Geological Survey Pass Manchac, Lake Maurepas, LA monitoring station—073802302, 30.28356667, −90.3978389).
Environments 11 00268 g002
Figure 3. Precipitation (mm/day) (bar graph) and wind speed (m/S) (point graph) data from June–December 2023: (A) June, (B) July, (C) August, (D) September, (E) October, (F) November, (G) December. The dotted lines represent the lowest and highest wind speeds observed in the specific dates while the points represent the average wind speed. Bar graphs represent the precipitation data. The data was extracted from the nearest weather station to Lake Maurepas (Kenner, LA Weather History from Louis Armstrong New Orleans International Airport Station (29.99, −90.24)).
Environments 11 00268 g003
Figure 4. P Time series variation of contaminant concentrations during the sampling period: (A) COD in water, (B) TN, NH3-N, and TP in water, (C) As, Pb, and Hg in water, (D) Hg in sedimentary mud. The symbols represent the monthly average values where the error bars represent the standard deviation from the mean (n = 27).
Environments 11 00268 g004
Figure 5. Maps generated for geospatial variation of contaminants (surface water) from June–November 2023 using IDW function in ArcGIS: (1) COD, (2) TN, (3) As and (4) Pb. The subgraphs indicate: (A) June, (B) July, (C) August, (D) September, (E) October, (F) November. The black pins indicate the sampling sites and the arrows indicate the wind direction ~9.00 am in the specific sampling dates (22 June 2023, 20 July 2023, 18 August 2023, 22 September 2023, 20 October 2023, 17 November 2023). 9.00 am was selected considering the sampling time.
Environments 11 00268 g005aEnvironments 11 00268 g005b
Figure 6. Measured, predicted, and forecasted values for 9 sampling sites using the model, LSTM2: (1) COD, (2) TN, (3) TP, (4) As and (5) Pb. Subfigures A–I represent the sampling sites of ND1, ND2, ND3, ND4, ND5, D1, D2, D3 and D4, respectively. Green circles show the measured values, orange boxes represent the predicted values using model LSTM2, while the blue diamond shape symbols represent the predicted values using model LSTM2 as stated in the subfigure (A) of each (1)–(5).
Environments 11 00268 g006aEnvironments 11 00268 g006bEnvironments 11 00268 g006cEnvironments 11 00268 g006dEnvironments 11 00268 g006e
Table 1. Evaluating the capability of water quality forecasting by the models for each sampling location for COD, TN, TP, As, and Pb (All the values are in mg/L).
ParameterModelND1ND2ND3ND4ND5D1D2D3D4
CODForest-based9.166.587.875.168.3910.479.697.878.64
LSTM17.068.446.393.224.8310.837.907.1814.48
LSTM28.5314.0419.543.006.5716.3115.0917.5815.99
LSTM37.628.295.233.325.0010.938.217.5313.46
TNForest-based0.350.750.260.310.300.260.330.290.40
LSTM10.461.280.330.420.470.550.440.450.57
LSTM20.521.480.470.630.570.550.460.610.68
LSTM30.481.300.330.490.480.570.520.490.57
TPForest-based0.110.110.100.090.080.100.080.070.08
LSTM10.120.440.170.150.070.110.080.120.15
LSTM20.160.550.150.170.110.100.080.120.17
LSTM30.130.440.180.150.090.110.080.120.16
AsForest-based0.110.110.090.070.110.120.080.090.08
LSTM10.210.170.130.110.150.170.080.070.14
LSTM20.230.220.160.130.220.260.110.100.17
LSTM30.220.200.160.130.180.180.100.090.16
PbForest-based0.100.090.080.070.080.070.070.060.08
LSTM10.150.140.280.110.130.110.110.100.12
LSTM20.130.140.320.120.130.120.140.140.11
LSTM30.150.140.280.120.120.100.120.100.12
Table 2. Evaluating the differences between September–October measurements and forecasted levels in December for water quality parameters using ANOVA.
ParameterModelF and p-ValuesND1ND2ND3ND4ND5D1D2D3D4
CODForest-
based
F value0.20052.875261.81430.43630.29321.42080.38590.492316.7613
Pr (>F)0.67750.18860.00430.54500.61690.29920.56810.52130.0264
LSTM 1F value0.63930.46770.31553.98622.69580.34730.39201.57830.9475
Pr (>F)0.43010.49910.57830.05470.11070.55990.53580.21840.3379
LSTM 2F value0.54340.58310.04890.01270.06462.36922.86061.52040.0099
Pr (>F)0.46710.45150.82660.91100.80130.13490.10190.22780.9213
LSTM 3F value1.26830.64050.00015.67140.51130.00470.23454.31792.3387
Pr (>F)0.26850.42940.99320.02340.47980.94560.63150.04580.1360
TNForest-
based
F value0.10110.12820.57598.47440.18950.00475.88590.709723.3348
Pr (>F)0.77140.74400.50310.10050.69280.95140.09370.46140.0403
LSTM 1F value0.37060.52180.01911.42820.26132.16000.97000.20582.2248
Pr (>F)0.54710.47550.89090.24110.61280.15170.33230.65320.1459
LSTM 2F value0.47643.65690.34290.12390.216610.02281.11500.71480.0163
Pr (>F)0.49580.06610.56280.72750.64520.71030.30000.40500.8994
LSTM 3F value0.00230.74671.06644.74023.37111.07620.57590.00070.1553
Pr (>F)0.96220.39390.30950.03690.07570.30730.45350.97930.6962
TPForest-
based
F value0.00000.25690.47940.44720.26240.22870.77380.86180.4584
Pr (>F)0.99770.64710.53850.55150.64380.66520.14730.42170.5682
LSTM 1F value0.30750.17130.06990.75810.41340.46321.00430.02550.5442
Pr (>F)0.58320.68180.79330.39060.52490.50120.32400.87410.4663
LSTM 2F value2.01721.70780.80510.21950.49610.03000.94980.01080.3430
Pr (>F)0.16660.20190.37720.64300.48700.86370.33810.91780.5628
LSTM 3F value4.25121.10930.15750.03720.54971.98070.52990.00850.3723
Pr (>F)0.04740.30010.69410.84830.46380.16890.47190.92710.8188
AsForest-
based
F value0.75820.29160.80740.08290.19390.16322.76792.55310.5196
Pr (>F)0.44790.64330.46370.80050.68240.72540.17150.18530.5459
LSTM 1F value0.75460.83820.22491.03990.02700.49620.01340.09610.6305
Pr (>F)0.39170.36690.63860.31570.87050.48640.90850.75870.4332
LSTM 2F value3.87790.02530.09460.09220.04010.13461.70210.39920.2219
Pr (>F)0.05890.87470.76070.76370.84280.71650.20260.53260.6413
LSTM 3F value1.04321.45591.15190.64613.20171.18053.41130.07470.2046
Pr (>F)0.31470.23640.29120.42740.08300.28540.07400.78630.6541
PbForest-
based
F value0.00000.01120.27530.58880.00130.36113.77380.78781.3885
Pr (>F)0.99920.92540.63610.29660.97330.60890.14730.44010.3236
LSTM 1F value4.43070.89020.51301.38050.57091.75430.50042.11092.8127
Pr (>F)0.04350.35270.47920.24890.45560.19500.48460.15630.1036
LSTM 2F value0.73310.07581.37891.92746.88610.08420.27870.96180.8095
Pr (>F)0.39910.78510.25020.17590.01390.77380.60170.33510.3759
LSTM 3F value3.29172.65141.58493.32341.63021.49320.60183.39231.1976
Pr (>F)0.07900.11330.21720.07770.21090.23060.44360.07480.2819
Disclaimer/Publisher’s Note: The statements, opinions and data contained in all publications are solely those of the individual author(s) and contributor(s) and not of MDPI and/or the editor(s). MDPI and/or the editor(s) disclaim responsibility for any injury to people or property resulting from any ideas, methods, instructions or products referred to in the content.