


Critical Review of Life Cycle Assessment of Hydrogen Production Pathways


 ,
, 


Abstract
1. Introduction
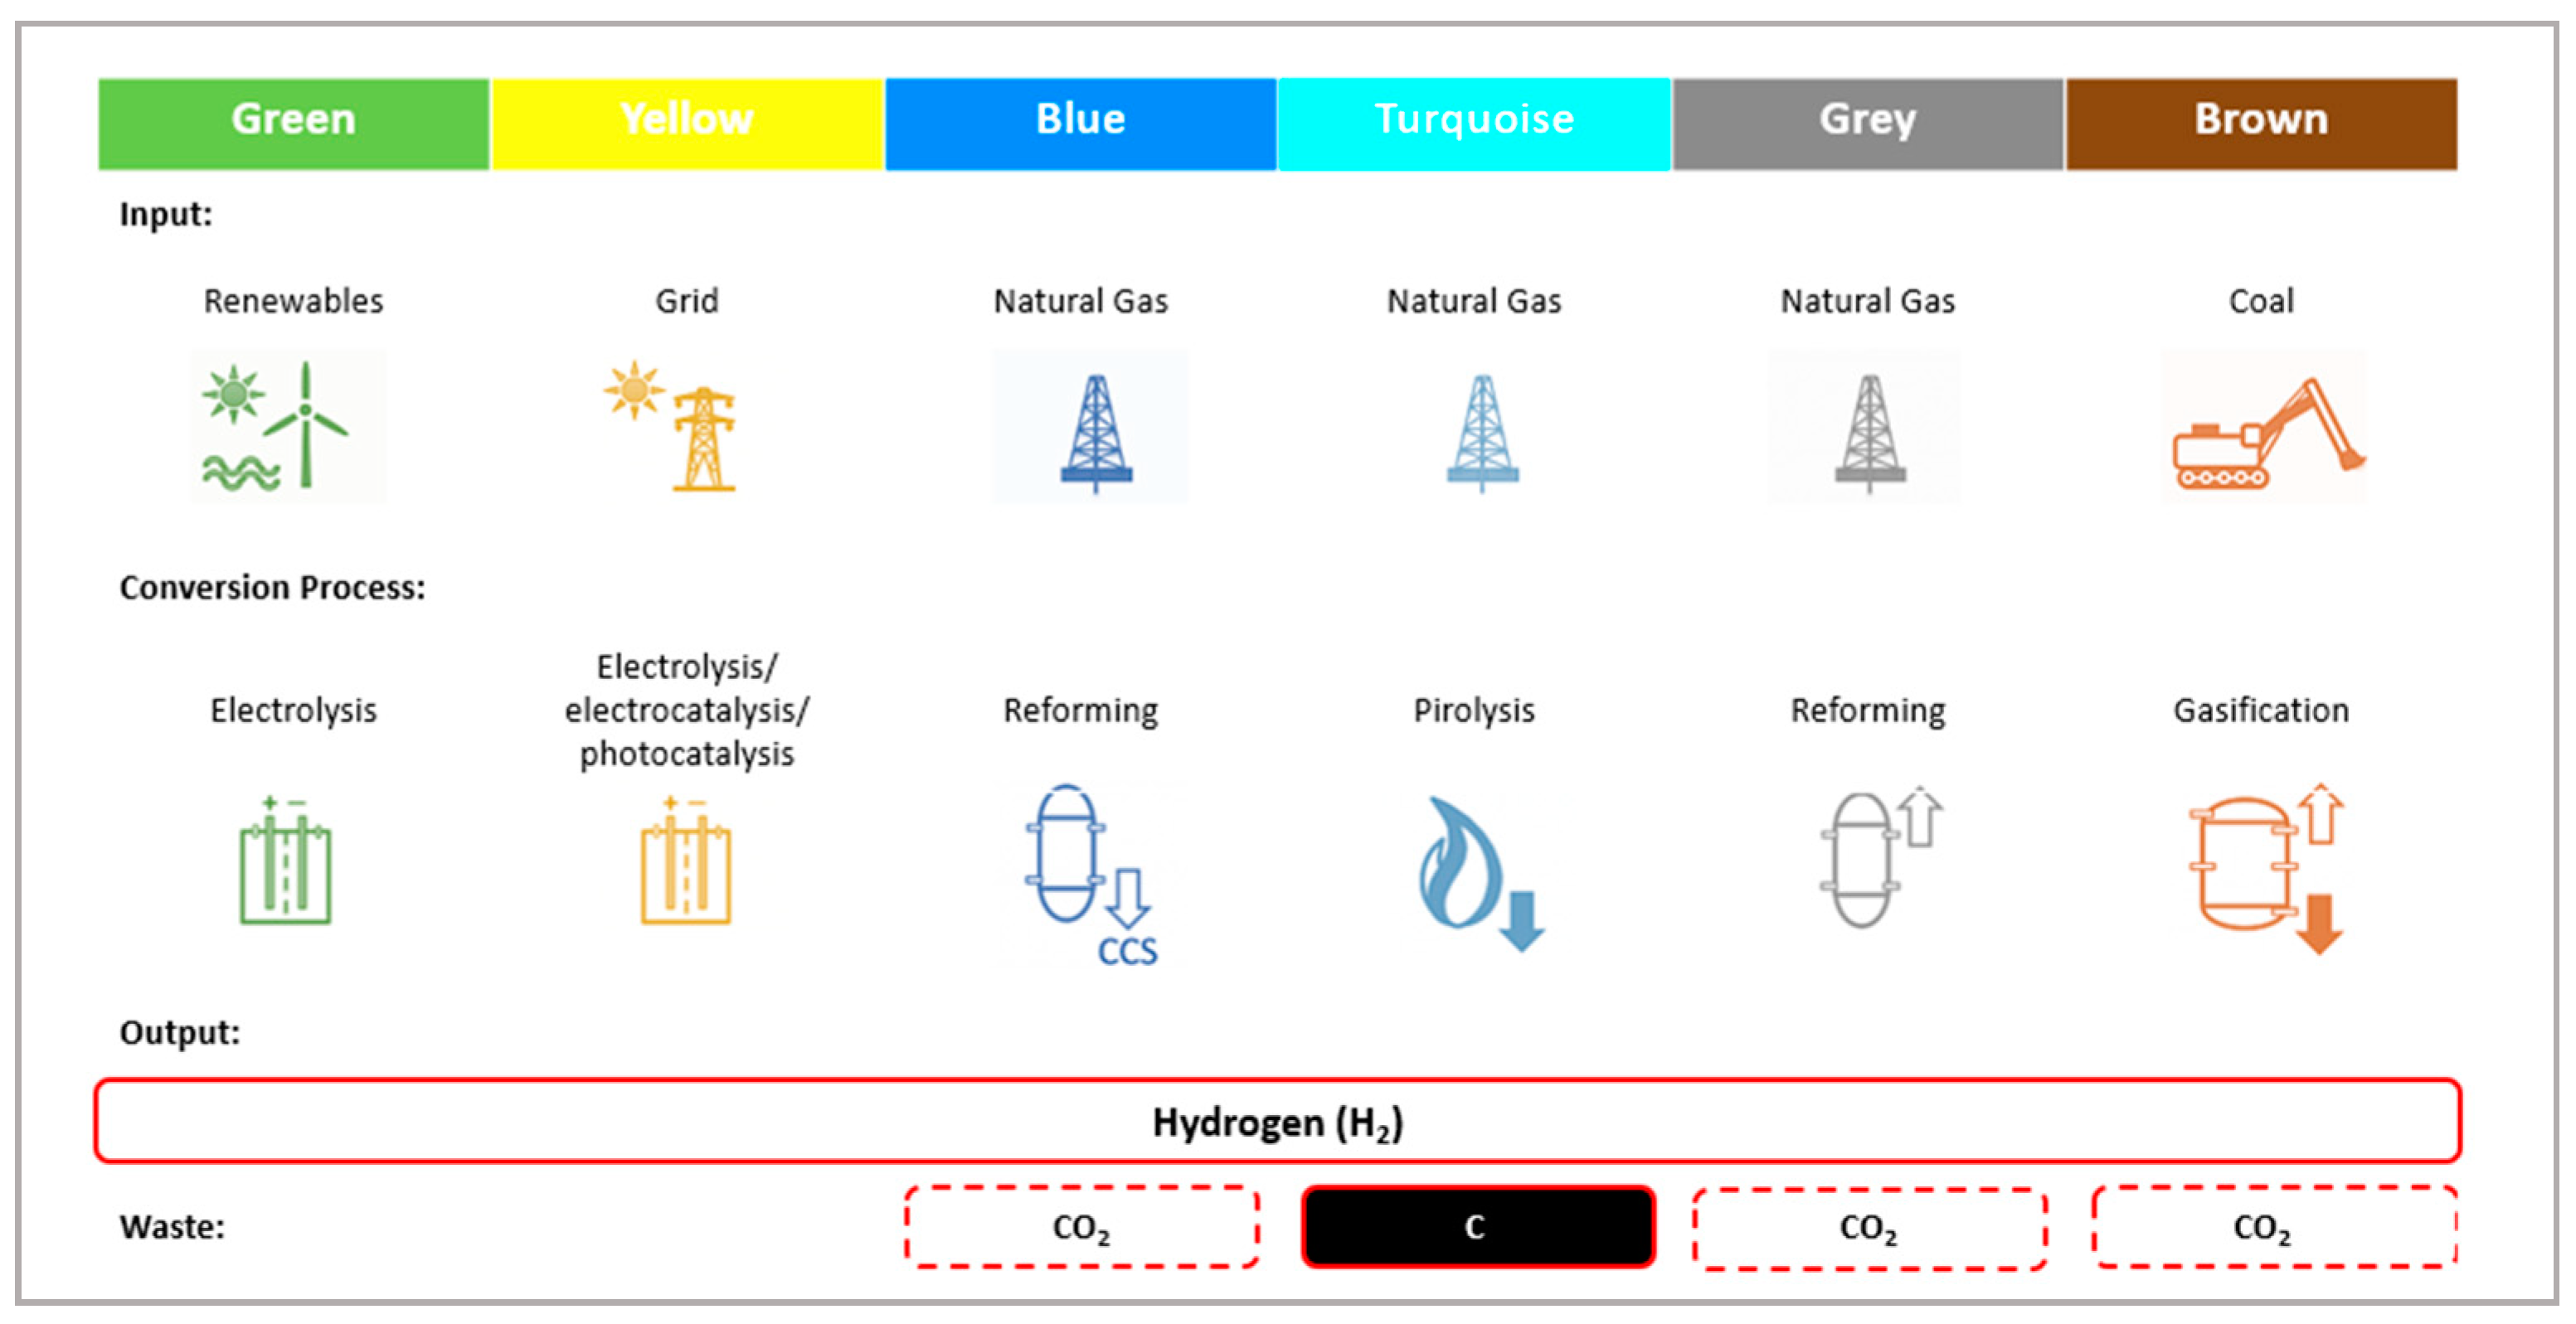
2. Context
- Brown Hydrogen: produced via coal gasification, followed by syngas processes and gas purification.
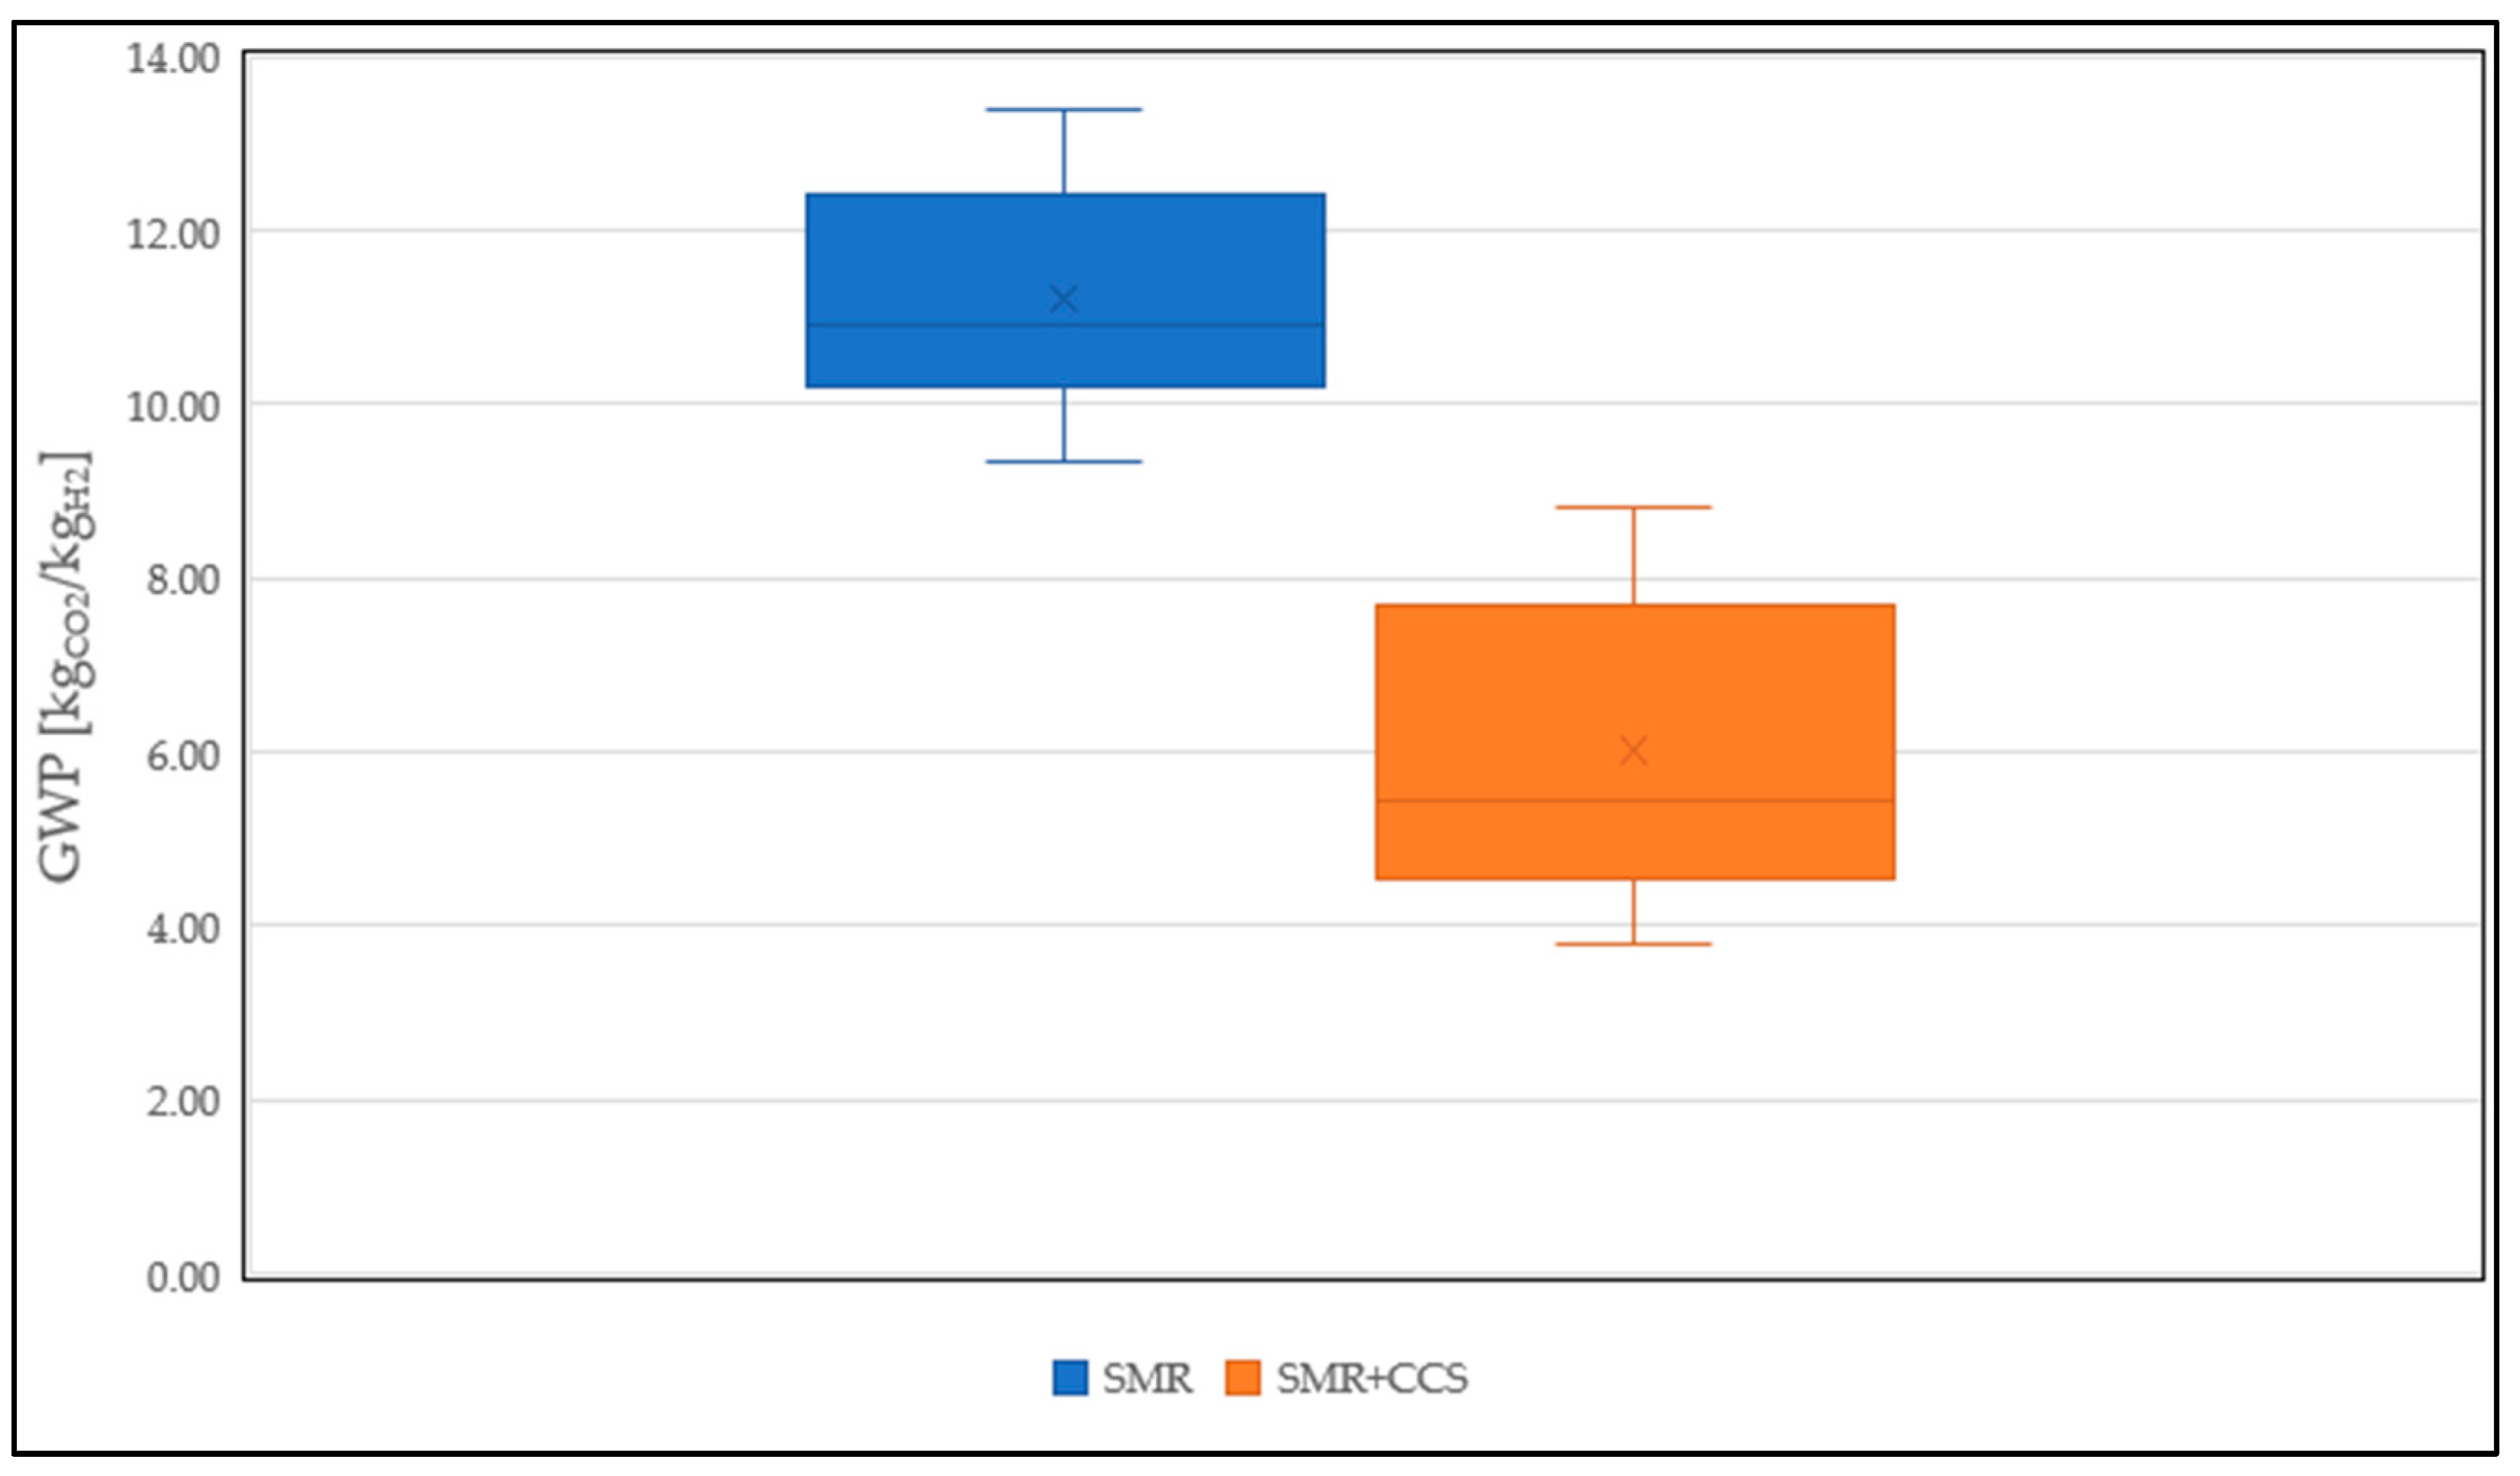
- Grey and Blue Hydrogen: Derived from Steam Methane Reforming (SMR). The distinction between ‘grey’ and ‘blue’ lies in the CO2 management; while grey results in direct CO2 emissions, blue employs carbon capture techniques to mitigate the greenhouse gas release.
- Turquoise Hydrogen: Produced through Methane Pyrolysis. Methane pyrolysis involves the thermal decomposition of methane under oxygen-absent conditions, leading to the formation of hydrogen and solid carbon.
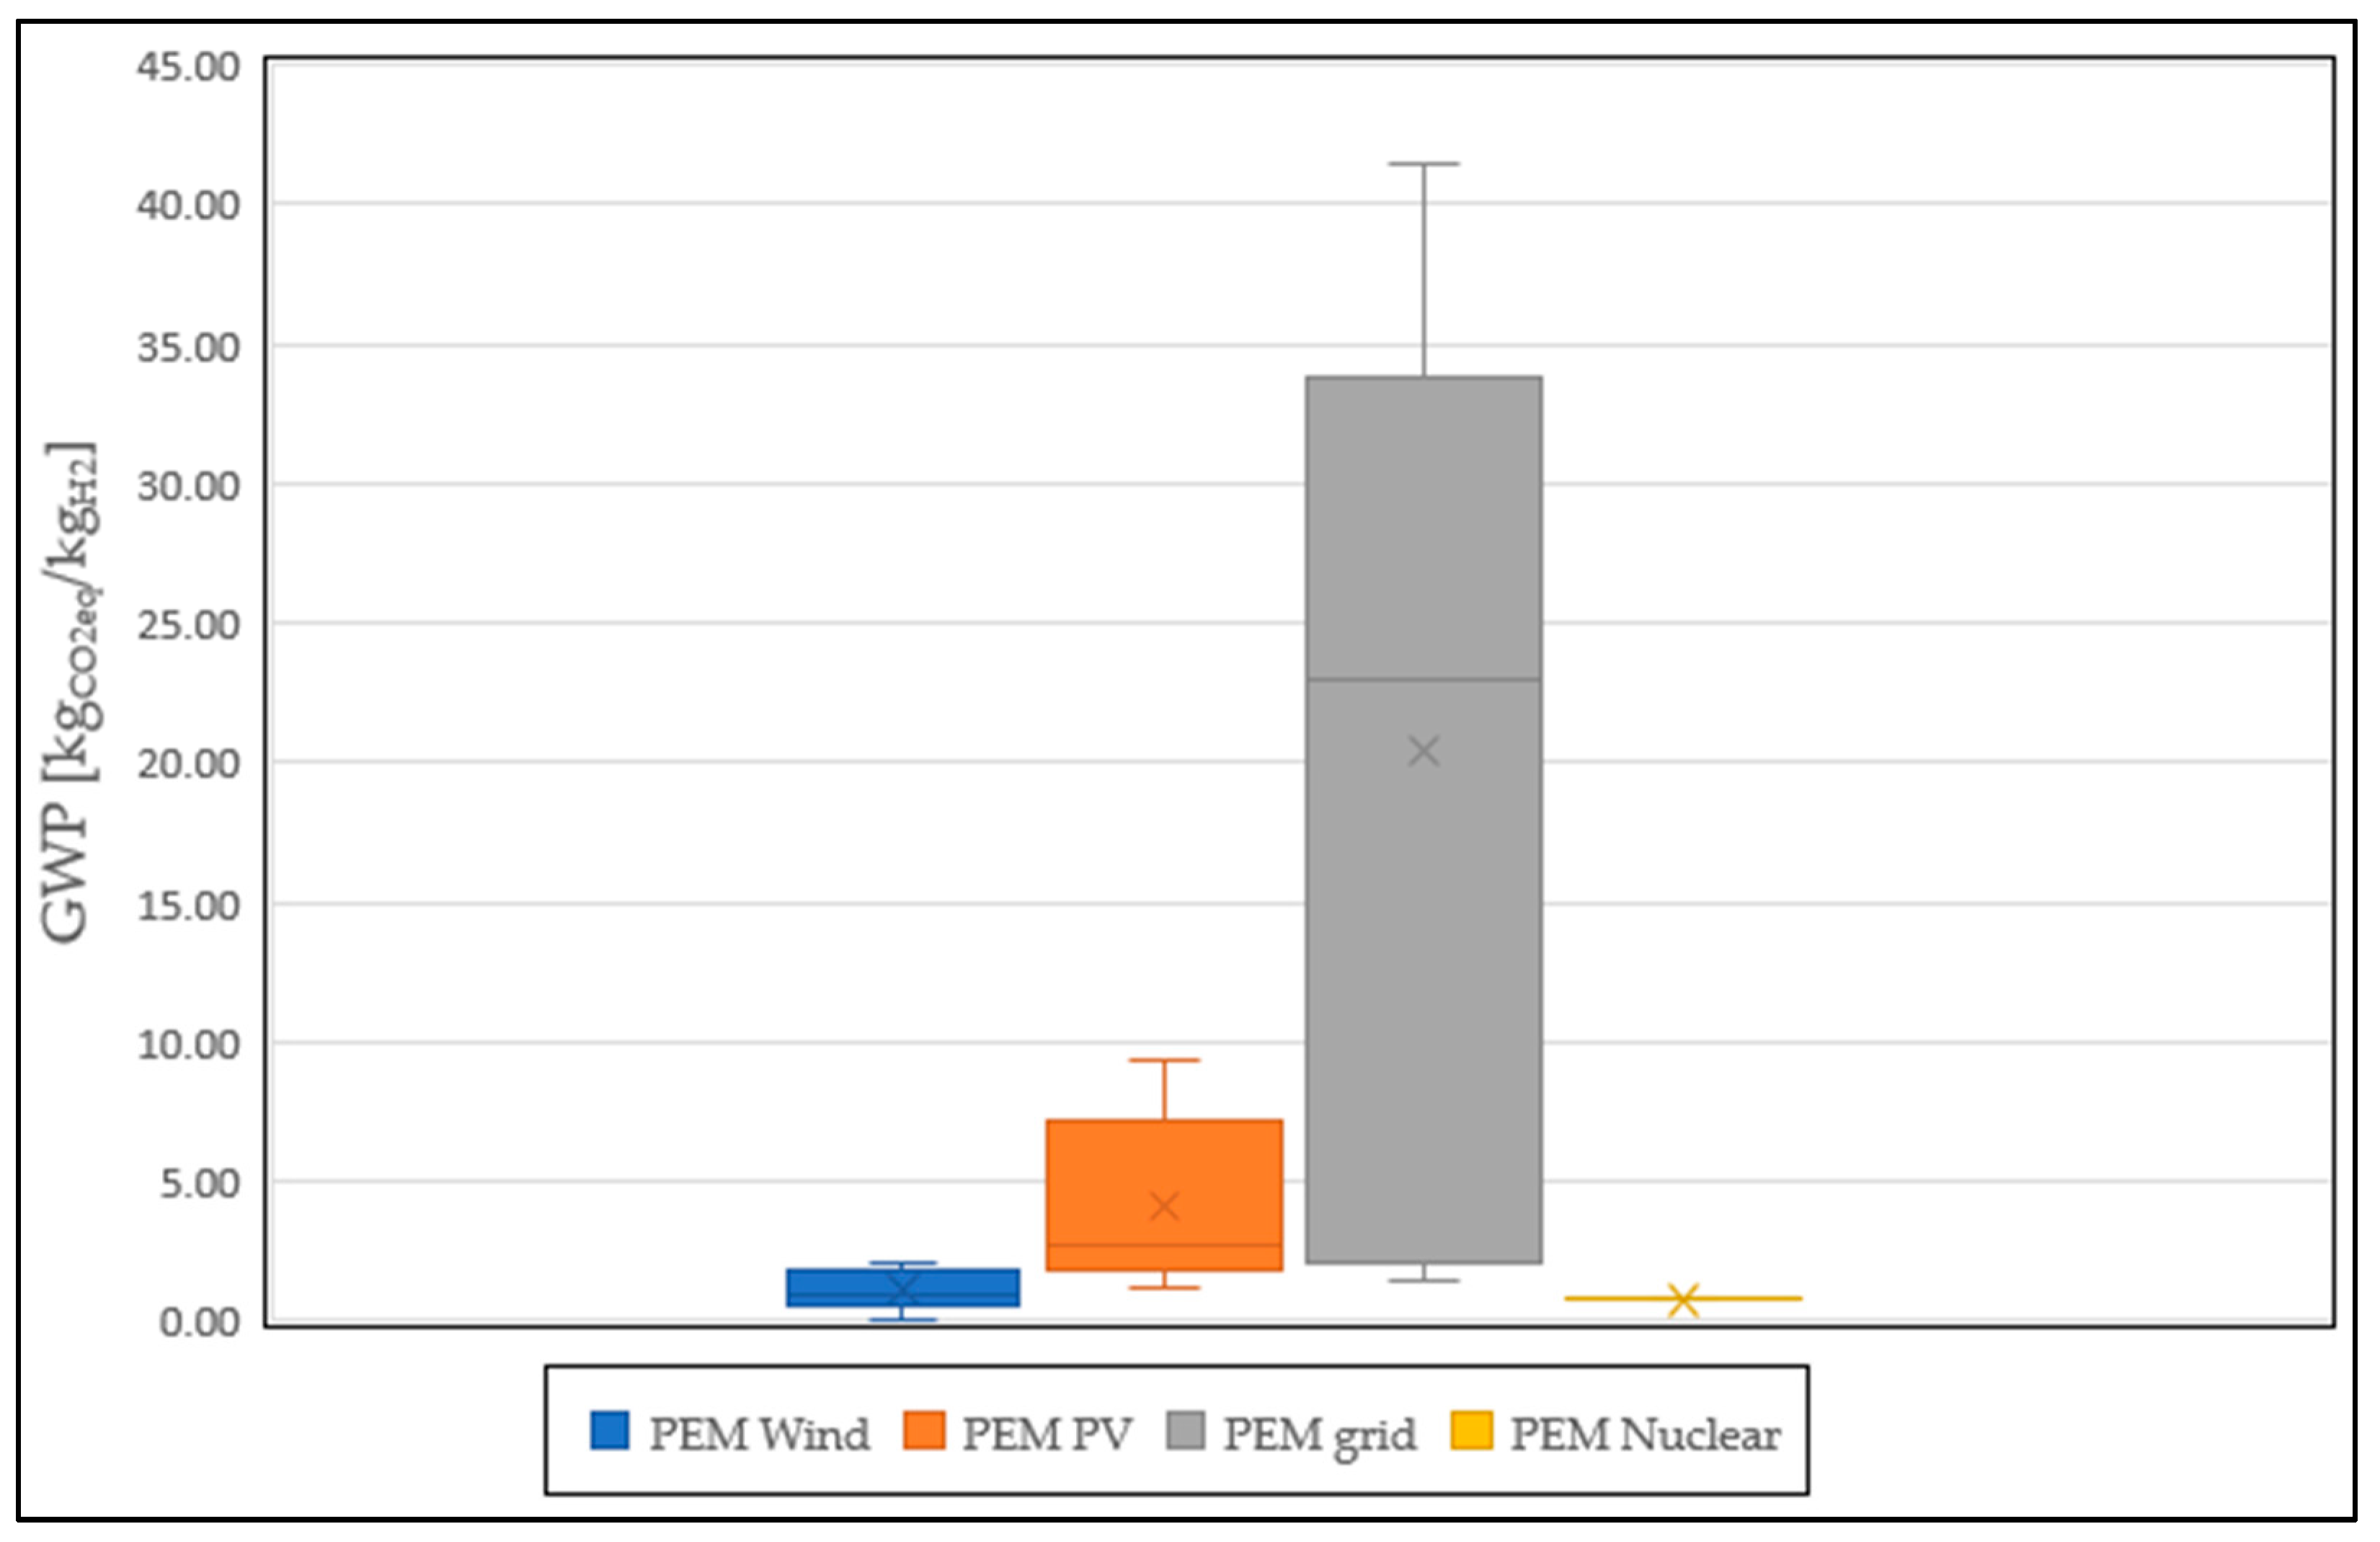
- Yellow Hydrogen: Obtained via grid-connected electrolysis. Electrolysis is the electrochemical process of water decomposition into hydrogen and oxygen using electrical energy.
- Green Hydrogen: generated from electrolysis powered exclusively by renewable energy sources.
- Pink hydrogen: refers to hydrogen produced via water electrolysis powered by a nuclear plant.
- Copper–Chlorine (Cu-Cl) water splitting.
- Sulfur–Iodine (S-I) cycles.
- Plastic wastes pyrolysis and gasification.
- Waste biomass pyrolysis.
- Anaerobic digestion, hydrolysis and the fermentation of biological waste.
3. Life Cycle Assessment
3.1. Methodological Insight
3.2. GHG Emissions
3.3. Acidification Potential
3.4. Material Depletion
3.5. Human Toxicity Non-Cancer
4. Discussion
5. Conclusions
Author Contributions
Funding
Data Availability Statement
Conflicts of Interest
Abbreviations
| ADP | Abiotic Depletion Potential |
| AD | Anaerobic Digestion |
| AE | Alkaline Electrolysis |
| AEM | Anion Exchange Membrane |
| AP | Acidification Potential |
| BECCS | Bioenergy with Carbon Capture and Storage |
| BG | Biomass Gasification |
| bMtoH2 | Biomass to Hydrogen |
| bWtoH2 | Biowaste to Hydrogen |
| CCS | Carbon Capture and Storage |
| CG | Coal Gasification |
| CSP | Concentrated Solar Power |
| EU | European |
| FU | Functional unit |
| GHG | Greenhouse gas |
| GWP | Global Warming Potential |
| HTP | Human Toxicity Potential |
| LCA | Life Cycle Assessment |
| LCI | Life Cycle Inventory |
| LCIA | Life Cycle Impact Assessment |
| MSW | Municipal Solid Waste |
| PEM | Proton-Exchange Membrane |
| PTL | Porous Transport Layer |
| PV | Photovoltaic |
| NG | Natural Gas |
| LNG | Liquefied Natural Gas |
| SMR | Steam Methane Reforming |
| SOEC | Solid Oxide Electrolyzer Cell |
| wPG | Waste Plastic Gasification |
References
- Intergovernmental Panel on Climate Change Technical Summary. In Climate Change 2021—The Physical Science Basis; Cambridge University Press: Cambridge, UK, 2023; pp. 35–144.
- European Hydrogen Observatory. Available online: https://observatory.clean-hydrogen.europa.eu/hydrogen-landscape/production-trade-and-cost/hydrogen-production (accessed on 27 February 2024).
- IEA. Global Hydrogen Review 2023; IEA: Paris, France, 2023. [Google Scholar]
- Chelvam, K.; Hanafiah, M.M.; Woon, K.S.; Ali, K. Al A Review on the Environmental Performance of Various Hydrogen Production Technologies: An Approach towards Hydrogen Economy. Energy Rep. 2024, 11, 369–383. [Google Scholar] [CrossRef]
- Borges, P.T.; Sales, M.B.; César Guimarães, C.E.; de França Serpa, J.; de Lima, R.K.C.; Sanders Lopes, A.A.; de Sousa Rios, M.A.; Desai, A.S.; da Silva Lima, A.M.; Lora, E.E.S.; et al. Photosynthetic Green Hydrogen: Advances, Challenges, Opportunities, and Prospects. Int. J. Hydrogen Energy 2024, 49, 433–458. [Google Scholar] [CrossRef]
- Teke, G.M.; Anye Cho, B.; Bosman, C.E.; Mapholi, Z.; Zhang, D.; Pott, R.W.M. Towards Industrial Biological Hydrogen Production: A Review. World J. Microbiol. Biotechnol. 2024, 40, 37. [Google Scholar] [CrossRef] [PubMed]
- González-Arias, J.; Zhang, Z.; Reina, T.R.; Odriozola, J.A. Hydrogen Production by Catalytic Aqueous-Phase Reforming of Waste Biomass: A Review. Environ. Chem. Lett. 2023, 21, 3089–3104. [Google Scholar] [CrossRef]
- Busch, P.; Kendall, A.; Lipman, T. A Systematic Review of Life Cycle Greenhouse Gas Intensity Values for Hydrogen Production Pathways. Renew. Sustain. Energy Rev. 2023, 184, 113588. [Google Scholar] [CrossRef]
- Wilkinson, J.; Mays, T.; McManus, M. Review and Meta-Analysis of Recent Life Cycle Assessments of Hydrogen Production. Clean. Environ. Syst. 2023, 9, 100116. [Google Scholar] [CrossRef]
- Singh, S.; Pandey, G.; Rath, G.K.; Veluswamy, H.P.; Molokitina, N. Life Cycle Assessment of Biomass-Based Hydrogen Production Technologies: A Review. Int. J. Green Energy 2023, 1–16. [Google Scholar] [CrossRef]
- Morya, R.; Raj, T.; Lee, Y.; Kumar Pandey, A.; Kumar, D.; Rani Singhania, R.; Singh, S.; Prakash Verma, J.; Kim, S.-H. Recent Updates in Biohydrogen Production Strategies and Life–Cycle Assessment for Sustainable Future. Bioresour. Technol. 2022, 366, 128159. [Google Scholar] [CrossRef]
- Masilela, P.; Pradhan, A. Systematic Literature Review of the Sustainability and Environmental Performance of Dark Fermentative Biohydrogen Production. J. Clean. Prod. 2022, 372, 133541. [Google Scholar] [CrossRef]
- Nandhini, R.; Berslin, D.; Sivaprakash, B.; Rajamohan, N.; Vo, D.-V.N. Thermochemical Conversion of Municipal Solid Waste into Energy and Hydrogen: A Review. Environ. Chem. Lett. 2022, 20, 1645–1669. [Google Scholar] [CrossRef]
- Hermesmann, M.; Müller, T.E. Green, Turquoise, Blue, or Grey? Environmentally Friendly Hydrogen Production in Transforming Energy Systems. Prog. Energy Combust. Sci. 2022, 90, 100996. [Google Scholar] [CrossRef]
- Hosseinzadeh, A.; Zhou, J.L.; Li, X.; Afsari, M.; Altaee, A. Techno-Economic and Environmental Impact Assessment of Hydrogen Production Processes Using Bio-Waste as Renewable Energy Resource. Renew. Sustain. Energy Rev. 2022, 156, 111991. [Google Scholar] [CrossRef]
- Özen Daş, İ.T.; Özmıhçı, S.; Büyükkamacı, N. Environmental Impact Analysis of Different Wastes to Biohydrogen, Biogas and Biohytane Processes. Int. J. Hydrogen Energy 2024, 56, 1446–1463. [Google Scholar] [CrossRef]
- Hassan, N.S.; Jalil, A.A.; Rajendran, S.; Khusnun, N.F.; Bahari, M.B.; Johari, A.; Kamaruddin, M.J.; Ismail, M. Recent Review and Evaluation of Green Hydrogen Production via Water Electrolysis for a Sustainable and Clean Energy Society. Int. J. Hydrogen Energy 2024, 52, 420–441. [Google Scholar] [CrossRef]
- Melideo, D.; Ortiz Cebolla, R.; Weidner, E. Workshop on Lifecycle Analysis of Fuel Cell and H2 Technologies; Publications Office of the European Union: Luxembourg, 2020. [Google Scholar]
- Erbach, G.; Svensson, S. BRIEFING towards Climate Neutrality; EU Rules for Renewable Hydrogen; European Parliament Research Service, European Union: Luxembourg, 2023. [Google Scholar]
- Ajanovic, A.; Sayer, M.; Haas, R. The Economics and the Environmental Benignity of Different Colors of Hydrogen. Int. J. Hydrogen Energy 2022, 47, 24136–24154. [Google Scholar] [CrossRef]
- Valente, A.; Iribarren, D.; Dufour, J. Harmonised Life-Cycle Global Warming Impact of Renewable Hydrogen. J. Clean. Prod. 2017, 149, 762–772. [Google Scholar] [CrossRef]
- Kolahchian Tabrizi, M.; Famiglietti, J.; Bonalumi, D.; Campanari, S. The Carbon Footprint of Hydrogen Produced with State-of-the-Art Photovoltaic Electricity Using Life-Cycle Assessment Methodology. Energies 2023, 16, 5190. [Google Scholar] [CrossRef]
- Zhang, J.; Wang, Z.; He, Y.; Li, M.; Wang, X.; Wang, B.; Zhu, Y.; Cen, K. Comparison of Onshore/Offshore Wind Power Hydrogen Production through Water Electrolysis by Life Cycle Assessment. Sustain. Energy Technol. Assess. 2023, 60, 103515. [Google Scholar] [CrossRef]
- Krishnan, S.; Corona, B.; Kramer, G.J.; Junginger, M.; Koning, V. Prospective LCA of Alkaline and PEM Electrolyser Systems. Int. J. Hydrogen Energy 2024, 55, 26–41. [Google Scholar] [CrossRef]
- Mio, A.; Barbera, E.; Massi Pavan, A.; Bertucco, A.; Fermeglia, M. Sustainability Analysis of Hydrogen Production Processes. Int. J. Hydrogen Energy 2024, 54, 540–553. [Google Scholar] [CrossRef]
- Hermesmann, M.; Tsiklios, C.; Müller, T.E. The Environmental Impact of Renewable Hydrogen Supply Chains: Local vs. Remote Production and Long-Distance Hydrogen Transport. Appl. Energy 2023, 351, 121920. [Google Scholar] [CrossRef]
- Terlouw, T.; Bauer, C.; McKenna, R.; Mazzotti, M. Large-Scale Hydrogen Production via Water Electrolysis: A Techno-Economic and Environmental Assessment. Energy Environ. Sci. 2022, 15, 3583–3602. [Google Scholar] [CrossRef]
- Henriksen, M.S.; Matthews, H.S.; White, J.; Walsh, L.; Grol, E.; Jamieson, M.; Skone, T.J. Tradeoffs in Life Cycle Water Use and Greenhouse Gas Emissions of Hydrogen Production Pathways. Int. J. Hydrogen Energy 2024, 49, 1221–1234. [Google Scholar] [CrossRef]
- Patel, G.H.; Havukainen, J.; Horttanainen, M.; Soukka, R.; Tuomaala, M. Climate Change Performance of Hydrogen Production Based on Life Cycle Assessment. Green Chem. 2024, 26, 992–1006. [Google Scholar] [CrossRef]
- Zhang, J.; Ling, B.; He, Y.; Zhu, Y.; Wang, Z. Life Cycle Assessment of Three Types of Hydrogen Production Methods Using Solar Energy. Int. J. Hydrogen Energy 2022, 47, 14158–14168. [Google Scholar] [CrossRef]
- Schropp, E.; Campos-Carriedo, F.; Iribarren, D.; Naumann, G.; Bernäcker, C.; Gaderer, M.; Dufour, J. Environmental and Material Criticality Assessment of Hydrogen Production via Anion Exchange Membrane Electrolysis. Appl. Energy 2024, 356, 122247. [Google Scholar] [CrossRef]
- Salah, C.; Cobo, S.; Pérez-Ramírez, J.; Guillén-Gosálbez, G. Environmental Sustainability Assessment of Hydrogen from Waste Polymers. ACS Sustain. Chem. Eng. 2023, 11, 3238–3247. [Google Scholar] [CrossRef]
- Ji, M.; Shi, M.; Wang, J. Life Cycle Assessment of Nuclear Hydrogen Production Processes Based on High Temperature Gas-Cooled Reactor. Int. J. Hydrogen Energy 2023, 48, 22302–22318. [Google Scholar] [CrossRef]
- Weidner, T.; Tulus, V.; Guillén-Gosálbez, G. Environmental Sustainability Assessment of Large-Scale Hydrogen Production Using Prospective Life Cycle Analysis. Int. J. Hydrogen Energy 2023, 48, 8310–8327. [Google Scholar] [CrossRef]
- Chisalita, D.-A.; Petrescu, L.; Galusnyak, S.C.; Cormos, C.-C. Environmental Evaluation of Hydrogen Production Employing Innovative Chemical Looping Technologies—A Romanian Case Study. Int. J. Hydrogen Energy 2023, 48, 12112–12128. [Google Scholar] [CrossRef]
- Williams, J.M.; Bourtsalas, A.C. Assessment of Co-Gasification Methods for Hydrogen Production from Biomass and Plastic Wastes. Energies 2023, 16, 7548. [Google Scholar] [CrossRef]
- Cho, H.H.; Strezov, V.; Evans, T.J. Environmental Impact Assessment of Hydrogen Production via Steam Methane Reforming Based on Emissions Data. Energy Rep. 2022, 8, 13585–13595. [Google Scholar] [CrossRef]
- Ali, S.M.; Alkhatib, I.I.I.; AlHajaj, A.; Vega, L.F. How Sustainable and Profitable Are Large-Scale Hydrogen Production Plants from CH4 and H2S? J. Clean. Prod. 2023, 428, 139475. [Google Scholar] [CrossRef]
- Wijayasekera, S.C.; Hewage, K.; Hettiaratchi, P.; Siddiqui, O.; Razi, F.; Pokhrel, D.; Sadiq, R. Sustainability of Waste-to-Hydrogen Conversion Pathways: A Life Cycle Thinking-Based Assessment. Energy Convers. Manag. 2022, 270, 116218. [Google Scholar] [CrossRef]
- Arfan, M.; Eriksson, O.; Wang, Z.; Soam, S. Life Cycle Assessment and Life Cycle Costing of Hydrogen Production from Biowaste and Biomass in Sweden. Energy Convers. Manag. 2023, 291, 117262. [Google Scholar] [CrossRef]
- Zheng, X.; Wang, J.; Huang, J.; Xu, X.; Tang, J.; Hou, P.; Han, W.; Li, H. Environmental Impact Assessment of a Combined Bioprocess for Hydrogen Production from Food Waste. Waste Manag. 2024, 173, 152–159. [Google Scholar] [CrossRef] [PubMed]
- Sadeghi, S.; Ghandehariun, S. Environmental Impacts of a Standalone Solar Water Splitting System for Sustainable Hydrogen Production: A Life Cycle Assessment. Int. J. Hydrogen Energy 2023, 48, 19326–19339. [Google Scholar] [CrossRef]
- Environmental Performance Indicator. Available online: https://www.environdec.com/resources/indicators (accessed on 16 February 2024).
- Bauer, C.; Treyer, K.; Antonini, C.; Bergerson, J.; Gazzani, M.; Gencer, E.; Gibbins, J.; Mazzotti, M.; McCoy, S.T.; McKenna, R.; et al. On the Climate Impacts of Blue Hydrogen Production. Sustain. Energy Fuels 2022, 6, 66–75. [Google Scholar] [CrossRef]
- Spath, P.L.; Mann, M.K. Life Cycle Assessment of Hydrogen Production via Natural Gas Steam Reforming; National Renewable Energy Laboratory: Golden, CO, USA, 2000. [Google Scholar]
- Alhamdani, Y.A.; Hassim, M.H.; Ng, R.T.L.; Hurme, M. The Estimation of Fugitive Gas Emissions from Hydrogen Production by Natural Gas Steam Reforming. Int. J. Hydrogen Energy 2017, 42, 9342–9351. [Google Scholar] [CrossRef]
- Uekert, T.; Wikoff, H.M.; Badgett, A. Electrolyzer and Fuel Cell Recycling for a Circular Hydrogen Economy. Adv. Sustain. Syst. 2024, 8, 2300449. [Google Scholar] [CrossRef]
- Matz, L.; Bensmann, B.; Hanke-Rauschenbach, R.; Minke, C. Resource-Efficient Gigawatt Water Electrolysis in Germany—A Circular Economy Potential Analysis. In Circular Economy and Sustainability; Springer: Berlin/Heidelberg, Germany, 2024. [Google Scholar] [CrossRef]
- Kiemel, S.; Smolinka, T.; Lehner, F.; Full, J.; Sauer, A.; Miehe, R. Critical Materials for Water Electrolysers at the Example of the Energy Transition in Germany. Int. J. Energy Res. 2021, 45, 9914–9935. [Google Scholar] [CrossRef]


| Ref. | Software | Type of Data | Background Database | F.U. | System Boundaries | LCIA |
|---|---|---|---|---|---|---|
| [22] | SimaPro 9.4 | Secondary data | ecoinvent 3.5 | 1 kg H2_harmonized | cradle-to-gate | E. F. 3.0 |
| [23] | undefined | Secondary data | ecoinvent | 1 kg H2 | cradle-to-gate | CML 2001 |
| [24] | SimaPro | Secondary data | ecoinvent + literature + state of the art from producers | 1 kg H2 | cradle-to-gate | E. F. 3.0 |
| [25] | undefined | Software sim. + secondary data | Background data source + ecoinvent | 1 kg H2 | cradle-to-gate | ReCiPe |
| [26] | undefined | Secondary data | ecoinvent | 1 kg H2, 80 bar, 10 °C | cradle-to-gate | IPCC 2013 GWP 100a |
| [27] | BrightWay 2 LCA | Secondary data | ecoinvent 3.7 | 1 kg H2 80 bar | cradle-to-gate | IPCC 2013 GWP 100a |
| [28] | OpenLCA v 1.11 | Secondary data | NETL Reports + literature | 1 kg H2, >99.9%; 925 psig | cradle-to-gate | IPCC 2013 GWP 100a; water balance |
| [29] | GaBi v 10.5.1.124 | Secondary data | GaBi Database | 1 kg H2 | cradle-to-gate | undefined |
| [30] | undefined | Secondary data | ecoinvent | 1 kg H2 | cradle-to-gate | CML 2001 |
| [31] | undefined | Secondary data | ecoinvent 3.8 | 1 kg H2, 30 bar, 50 °C, 99.99% wt | undefined | E. F. 3.1 |
| [32] | SimaPro 9.2 | Secondary data | ecoinvent 3.5 | 1 kg H2 | cradle-to-gate | IPCC 2013 GWP 100a |
| [33] | GaBi | Primary (mining; fuel prep) + secondary data | Literature | 1 kg H2 | cradle-to-gate | CML 2001 |
| [34] | SimaPro 9.2 | Secondary data | ecoinvent 3.8 + literature | 1 kg H2, 25 bar | cradle-to-gate | E. F. 3.0 |
| [35] | GaBi 10 | Secondary data | undefined | 1 kg H2 | cradle-to-gate | ReCiPe |
| [36] | undefined | Software sim. + secondary data | Background data source + undefined secondary data | 1 ton H2; 1 MW power | cradle-to-gate | undefined |
| [37] | OpenLCA 1.10.2 | Primary data (plant emission) + secondary data | undefined | 1 kg H2 | gate-to-gate | ReCiPe |
| [38] | OpenLCA | Software sim. + secondary data | Background data source + Agribase + literature + ecoinvent | 1 kg H2 200 bar | gate-to-gate | Impact 2002+; AWARE |
| [39] | SimaPro 8.5.2 | Software sim. + secondary data | Background data source + ecoinvent + GREET 2021 | 1 kg H2 | cradle-to-gate | ReCiPe 2016 |
| [40] | SimaPro 9.13 | primary (AD) + secondary data | ecoinvent 3.8 | 1 kg H2; 99.99% | gate-to-gate | CML 2001 |
| [41] | SimaPro 9.0 | Software sim. + secondary data | Pilot scale + ecoinvent | 1 kg H2; 99.99% | cradle-to-gate | IPCC 2013 GWP 100a |
| [42] | undefined | Secondary data | undefined | 1 kg H2 | cradle-to-grave | CML 2001 |
| Impact Category | N. of Papers | % |
|---|---|---|
| GWP | 21 | 100% |
| Ozone depletion | 8 | 38% |
| Ionizing radiation | 5 | 24% |
| Phot. O3 form | 5 | 24% |
| Ozone form., terr. Ecosyst | 4 | 19% |
| Ozone form., human health | 4 | 19% |
| Part. matter form | 6 | 29% |
| Human tox., non-carc | 9 | 43% |
| Human tox., carc. | 8 | 38% |
| Acidification | 13 | 62% |
| Eutroph. Freshwater | 11 | 52% |
| Eutroph marine | 4 | 19% |
| Ecotox terrestrial | 6 | 29% |
| Ecotox freshw | 7 | 33% |
| Marine Ecotox. | 3 | 14% |
| Land use | 5 | 24% |
| Water use | 6 | 29% |
| Mat. Res., met/min | 7 | 33% |
| Energy resources, non-ren | 7 | 33% |
| Technology | Allocation | F.U. | System Boundaries | kgCO2eq/kgH2 | Ref. |
|---|---|---|---|---|---|
| AE_mono PV baseline | Not applicable | 1 kg H2 _harm. | cradle-to-gate | 4.28 | [22] |
| AE_mono PV updated | 1.76 | [22] | |||
| AE_multi PV baseline | 3.78 | [22] | |||
| AE_multi PV updated | 1.83 | [22] | |||
| AE_onshore | Not applicable | 1 kg H2 | cradle-to-gate | 0.11 | [23] |
| AE_offshore | Not applicable | 1 kg H2 | cradle-to-gate | 0.92 | [23] |
| AE_wind_base | Not applicable | 1 kg H2 | cradle-to-gate | 2.08 | [24] |
| AE_wind_adv | Not applicable | 1 kg H2 | cradle-to-gate | 1.15 | [24] |
| AE (Ita grid mix) | Not applicable | 1 kg H2 | cradle-to-gate | 4.32 | [25] |
| AE + floating PV | Not applicable | 1 kg H2 | cradle-to-gate | 23.5 | [25] |
| PEM_wind_base | Not applicable | 1 kg H2 | cradle-to-gate | 1.79 | [24] |
| PEM_wind_adv | Not applicable | 1 kg H2 | cradle-to-gate | 1.03 | [24] |
| PEM_wind (500 h/year) | Not applicable | 1 kg H2, 80 bar, 10 °C | cradle-to-gate | 5.78 | [26] |
| PEM_wind (4000 h/year) | 0.73 | [26] | |||
| PEM_PV (500 h/year) | 9.45 | [26] | |||
| PEM_PV (4000 h/year) | 1.19 | [26] | |||
| PEM_grid Crete | Cut off | 1 kg H2 80 bar | cradle-to-gate | 41.4 | [27] |
| PEM_hybrid Crete | 27.4 | [27] | |||
| PEM_grid Tenerife | 21.6 | [27] | |||
| PEM_hybrid Tenerife | 12.6 | [27] | |||
| PEM_grid Eigeroy | 1.47 | [27] | |||
| PEM_hybrid Eigeroy | 1.26 | [27] | |||
| PEM (US mix) | Not applicable | 1 kg H2, >99.9%; 925 psig | cradle-to-gate | 31.3 | [28] |
| PEM (PV) | Not applicable | cradle-to-gate | 2.76 | [28] | |
| PEM (Wind) | Not applicable | cradle-to-gate | 1.83 | [28] | |
| PEM-Solar | Not applicable | 1 kg H2 | cradle-to-gate | 2.50 | [29] |
| PEM-Wind | Not applicable | 1 kg H2 | cradle-to-gate | 0.60 | [29] |
| PEM + CSP | Not applicable | 1 kg H2 | cradle-to-gate | 8.67 | [30] |
| PEM + PV | Not applicable | 1 kg H2 | cradle-to-gate | 9.37 | [30] |
| PEM_onshore | Not applicable | 1 kg H2 | cradle-to-gate | 0.09 | [23] |
| PEM_offshore | Not applicable | 1 kg H2 | cradle-to-gate | 0.89 | [23] |
| PEM_EU grid | Not applicable | 1 kg H2, 30 bar, 50 °C, 99.99% | Undefined | 2.37 | [31] |
| PEM-BECCS (bio en + ccs) | Cut off | 1 kg H2 | cradle-to-gate | −101.12 | [32] |
| PEM nuclear | Cut off | 1 kg H2 | cradle-to-gate | 0.77 | [32] |
| PEM Wind | Cut off | 1 kg H2 | cradle-to-gate | 2.05 | [32] |
| PEM Hydro | Cut off | 1 kg H2 | cradle-to-gate | 3.25 | [32] |
| PEM Solar | Cut off | 1 kg H2 | cradle-to-gate | 4.96 | [32] |
| SOEC (US mix) | Not applicable | 1 kg H2, >99.9%; 925 psig | cradle-to-gate | 25.2 | [28] |
| SOEC (PV) | Not applicable | cradle-to-gate | 2.93 | [28] | |
| SOEC (Wind) | Not applicable | cradle-to-gate | 2.20 | [28] | |
| Nuclear SOEC w/N2 | Not applicable | 1 kg H2 | cradle-to-gate | 0.62 | [33] |
| Nuclear SOEC without/N2 | Not applicable | 1 kg H2 | cradle-to-gate | 0.21 | [33] |
| SOEC_onshore | Not applicable | 1 kg H2 | cradle-to-gate | 0.21 | [23] |
| SOEC_offshore | Not applicable | 1 kg H2 | cradle-to-gate | 1.49 | [23] |
| PV_electrol 2019 | Not applicable | 1 kg H2 25 bar | cradle-to-gate | 3.90 | [34] |
| PV_electrol 2050 | Not applicable | 1 kg H2 25 bar | cradle-to-gate | 1.40 | [34] |
| Wind_electrol 2019 | Not applicable | 1 kg H2 25 bar | cradle-to-gate | 1.00 | [34] |
| Wind_electrol 2050 | Not applicable | 1 kg H2 25 bar | cradle-to-gate | 0.50 | [34] |
| Water el. + ren. e.e | Allocation by energy | 1 kg H2 | cradle-to-gate | 0.31 | [35] |
| AEM_EU grid | Not applicable | 1 kg H2, 30 bar, 50 °C, 99.99% | undefined | 2.42 | [31] |
| BG | Not applicable | 1 kg H2, >99.9%; 925 psig | cradle-to-gate | 5.31 | [28] |
| BG + CCS | Not applicable | 1 kg H2, >99.9%; 925 psig | cradle-to-gate | −15.40 | [28] |
| BG | Cut off | 1 kg H2 | cradle-to-gate | 1.11 | [32] |
| BG + CCS | Cut off | 1 kg H2 | cradle-to-gate | −13.80 | [32] |
| CG | Not applicable | 1 kg H2, >99.9%; 925 psig | cradle-to-gate | 20.00 | [28] |
| CG + CCS | Not applicable | 1 kg H2, >99.9%; 925 psig | cradle-to-gate | 3.92 | [28] |
| Gasification–Coal Oxyfuel | Not applicable | 1 ton H2; 1 MW power | cradle-to-gate | 11.00 | [36] |
| Gasification–Plastic Oxyfuel | Not applicable | 1 ton H2; 1 MW power | cradle-to-gate | 16.00 | [36] |
| Gasification–Plastic Steam | Not applicable | 1 ton H2; 1 MW power | cradle-to-gate | 40.00 | [36] |
| Gasification–Plastic Air | Not applicable | 1 ton H2; 1 MW power | cradle-to-gate | 24.00 | [36] |
| SMR | Not applicable | 1 ton H2; 1 MW power | cradle-to-gate | 10.00 | [36] |
| SMR | Not applicable | 1 kg H2, >99.9%; 925 psig | cradle-to-gate | 10.40 | [28] |
| SMR-pipeline | Not applicable | 1 kg H2 | cradle-to-gate | 12.20 | [29] |
| SMR-LNG | Not applicable | 1 kg H2 | cradle-to-gate | 13.40 | [29] |
| SMR | Allocation by energy | 1 kg H2 | cradle-to-gate | 9.65 | [35] |
| CH4 SMR | Not applicable | 1 kg H2 | cradle-to-gate | 12.60 | [25] |
| SMR | Not applicable | 1 kg H2, 30 bar, 50 °C, 99.99% | undefined | 10.80 | [31] |
| SMR | Not applicable | 1 kg H2 | gate-to-gate | 9.35 | [37] |
| SMR_2019 | Not applicable | 1 kg H2 25 bar | cradle-to-gate | 10.90 | [34] |
| SMR_2050 | Not applicable | 1 kg H2 25 bar | cradle-to-gate | 10.60 | [34] |
| SMR | Not applicable | 1 kg H2 200 bar | gate-to-gate | 11.60 | [38] |
| SMR | Cut off | 1 kg H2 | cradle-to-gate | 12.70 | [32] |
| SMR + CCS-pipeline | Not applicable | 1 kg H2 | cradle-to-gate | 7.60 | [29] |
| SMR + CCS-LNG | Not applicable | 1 kg H2 | cradle-to-gate | 8.80 | [29] |
| SMR + CCS | Allocation by energy | 1 kg H2 | cradle-to-gate | 3.78 | [35] |
| SMR + CCS | Cut off | 1 kg H2 | cradle-to-gate | 5.62 | [32] |
| SMR + CCS 2019 | Not applicable | 1 kg H2 25 bar | cradle-to-gate | 5.00 | [34] |
| SMR + CCS 2050 | Not applicable | 1 kg H2 25 bar | cradle-to-gate | 4.20 | [34] |
| SMR + CCS | Not applicable | 1 kg H2, >99.9%; 925 psig | cradle-to-gate | 4.37 | [28] |
| SMR-CCS | Not applicable | 1 kg H2 200 bar | gate-to-gate | 7.70 | [38] |
| CH4 SMR + CCS | Not applicable | 1 kg H2 | cradle-to-gate | 5.27 | [25] |
| CH4_pyrolysis | Not applicable | 1 kg H2 200 bar | gate-to-gate | 6.92 | [38] |
| CH4 pyr-pipeline | Not applicable | 1 kg H2 | cradle-to-gate | 5.90 | [29] |
| CH4 pyr-LNG | Not applicable | 1 kg H2 | cradle-to-gate | 8.10 | [29] |
| H2S_pyrolysis | Not applicable | 1 kg H2 200 bar | gate-to-gate | 5.25 | [38] |
| MSW Pyrolysis + SMR | System expansion | 1 kg H2 | cradle-to-gate | 0.35 | [39] |
| H2S_MR | Not applicable | 1 kg H2 200 bar | gate-to-gate | 4.50 | [38] |
| wPG (Waste Polym Gas) | Cut off | 1 kg H2 | cradle-to-gate | 9.75 | [32] |
| wPG + CCS | Cut off | 1 kg H2 | cradle-to-gate | 1.34 | [32] |
| MSW Pyrolysis + Gasif | System expansion | 1 kg H2 | cradle-to-gate | 21.5 | [39] |
| MSW Gasification + WGS | System expansion | 1 kg H2 | cradle-to-gate | 26.7 | [39] |
| bMtoH2 | System expansion | 1 kg H2; 99.99% | gate-to-gate | 1.54 | [40] |
| Chem. loop.-iron based O2 carr | Allocation by energy | 1 kg H2 | cradle-to-gate | 1.01 | [35] |
| Sorp. Enh. Ref_Ca sorbent | Allocation by energy | 1 kg H2 | cradle-to-gate | 1.77 | [35] |
| Sorp. Enh. Ref_Ca sorbent + Cu bas O2 carr | Allocation by energy | 1 kg H2 | cradle-to-gate | 1.94 | [35] |
| CSP + Cu-Cl water splitting | Not applicable | 1 kg H2 | cradle-to-grave | 0.94 | [33] |
| Nuclear S-I | Not applicable | 1 kg H2 | cradle-to-gate | 0.31 | [30] |
| bWtoH2 | System expansion | 1 kg H2; 99.99% | gate-to-gate | 2.13 | [40] |
| MSW Landfill bior + SMR (heating w/hydro) | System expansion | 1 kg H2 | cradle-to-gate | −31.70 | [39] |
| MSW Landfill bior + SMR (react heat w/NG) | System expansion | 1 kg H2 | cradle-to-gate | 14.20 | [39] |
| Enzym Hydrol + Fermentation | Economic allocation | 1 kg H2; 99.99% | cradle-to-gate | 10.10 | [41] |
| S-I cycle + CSP | Not applicable | 1 kg H2 | cradle-to-gate | 1.02 | [30] |
| Green H2 | Yellow H2 | Blue H2 | Pink H2 | Turquoise H2 | Waste Gasif. | Biow./Biom. Gasif | |
|---|---|---|---|---|---|---|---|
| Mean [kgCO2eq/kgH2] | 2.02 | 17.20 | 6.02 | 0.41 | 6.97 | 33.90 | 2.52 |
| St. dev. [kgCO2/kgH2] | 1.99 | 14.90 | 1.79 | 0.29 | 1.10 | 18.50 | 1.90 |
| num. LCAs | 22 | 9 | 8 | 2 | 4 | 11 | 4 |
| Green H2 | Yellow H2 | Blue H2 | Pink H2 | Waste Gas | Biow/Biom to H2 | SMR | |
|---|---|---|---|---|---|---|---|
| Mean [molH+/kgH2] | 0.019 | 0.025 | 0.012 | 0.0018 | 0.14 | 0.0023 | 0.0061 |
| St. dev. [molH+/kgH2] | 0.029 | 0.0087 | 0.017 | 0.0011 | 0.049 | 0.0027 | 0.0067 |
| num LCAs | 13 | 3 | 2 | 2 | 5 | 2 | 4 |
Disclaimer/Publisher’s Note: The statements, opinions and data contained in all publications are solely those of the individual author(s) and contributor(s) and not of MDPI and/or the editor(s). MDPI and/or the editor(s) disclaim responsibility for any injury to people or property resulting from any ideas, methods, instructions or products referred to in the content. |
© 2024 by the authors. Licensee MDPI, Basel, Switzerland. This article is an open access article distributed under the terms and conditions of the Creative Commons Attribution (CC BY) license (https://creativecommons.org/licenses/by/4.0/).
Share and Cite
Maniscalco, M.P.; Longo, S.; Cellura, M.; Miccichè, G.; Ferraro, M. Critical Review of Life Cycle Assessment of Hydrogen Production Pathways. Environments 2024, 11, 108. https://doi.org/10.3390/environments11060108
Maniscalco MP, Longo S, Cellura M, Miccichè G, Ferraro M. Critical Review of Life Cycle Assessment of Hydrogen Production Pathways. Environments. 2024; 11(6):108. https://doi.org/10.3390/environments11060108
Chicago/Turabian StyleManiscalco, Manfredi Picciotto, Sonia Longo, Maurizio Cellura, Gabriele Miccichè, and Marco Ferraro. 2024. "Critical Review of Life Cycle Assessment of Hydrogen Production Pathways" Environments 11, no. 6: 108. https://doi.org/10.3390/environments11060108
APA StyleManiscalco, M. P., Longo, S., Cellura, M., Miccichè, G., & Ferraro, M. (2024). Critical Review of Life Cycle Assessment of Hydrogen Production Pathways. Environments, 11(6), 108. https://doi.org/10.3390/environments11060108