Article

Influence of Hydrothermal Carbonization (HTC) Temperature on Hydrochar and Process Liquid for Poultry, Swine, and Dairy Manure

by
Bilash Devnath
1,
Sami Khanal
2,
Ajay Shah
3 and
Toufiq Reza
1,*
1
Department of Chemistry and Chemical Engineering, Florida Institute of Technology, 150 West University Boulevard, Melbourne, FL 32901, USA
2
Department of Food, Agricultural and Biological Engineering, Ohio State University, 590 Woody Hayes Dr, Columbus, OH 43210, USA
3
Department of Food, Agricultural and Biological Engineering, Ohio State University, 1680 Madison Avenue, Wooster, OH 44691, USA
*
Author to whom correspondence should be addressed.
Environments 2024, 11(7), 150; https://doi.org/10.3390/environments11070150
Submission received: 12 June 2024 / Revised: 8 July 2024 / Accepted: 11 July 2024 / Published: 14 July 2024
(This article belongs to the Special Issue Thermochemical Treatments of Biomass)

Abstract

:
Hydrothermal carbonization (HTC) is a promising technology for wet manure treatment by converting animal manure into valuable fuels, materials, and chemicals. Among other HTC process parameters, the temperature influences HTC products the most. As various animal manures have different compositions, it is not certain how the HTC temperature influences the hydrochar and HTC process liquid. To evaluate the temperature’s effect on HTC, three different manures (poultry, swine, and dairy) were hydrothermally carbonized at three different temperatures (180, 220, and 260 °C), and solid and liquid products were characterized for their morphology, elemental compositions, and ions. The carbon contents of the hydrochar reached as high as 38.98 ± 0.36% and 40.05 ± 0.57% for poultry and swine manure, respectively, when these manures were treated at 260 °C. Ammonium showed an around 30% increase in poultry manure hydrochar with the increase in the HTC temperature. In contrast, in swine manure, it decreased by around 80%, and in dairy manure, the HTC temperature did not have any remarkable effect on the ammonium content. The process liquids from HTC of dairy manure at 220 °C showed the most balanced distribution of different ions, with 4970 ± 673 ppm of sodium, 4354 ± 437 ppm of ammonium, 2766 ± 417 ppm of potassium, 978 ± 82 ppm of magnesium, 953 ± 143 ppm of calcium, 3607 ± 16 ppm of chloride, and 39 ± 7 ppm of phosphate. These results emphasize the manure-specific effects of the HTC temperature on both solid and liquid products, indicating the need for optimized strategies to enhance HTC processes for various types of animal manures.

1. Introduction

Around 1.4 billion tons of animal manure is produced annually in the U.S. [1]. This number is increasing as animal production rises to meet the population’s growing demand for meat and dairy products. Although animal manure contains essential nutrients such as nitrogen, phosphorous, and potassium, which are vital for plant growth and development, there are limited practices for applying animal manure (especially dairy manure) onto land as fertilizer. As the production of animal manure is larger than its application, much of this manure is treated as waste and disposed of in landfills or lagoons [2]. Consequently, such improper application of manure affects the soil’s health by altering its acidity, temperature, and bulk density [3]. Animal manure, rich in nitrogen and phosphorus, can increase the severity of algal blooms through eutrophication when leached into water bodies, resulting in the depletion of oxygen levels below 2–3 ppm [4,5]. Similarly, when animal manure is exposed to the open environment, it can result in greenhouse gas emissions, including methane, nitrous oxide, and ammonia [6]. Untreated animal manure also creates odors, decreasing the quality of life of people nearby. Implementing sustainable animal manure treatment practices is crucial for preventing environmental pollution and ensuring the protection of human health.
Hydrothermal carbonization (HTC) could be a wet manure treatment practice, as it has proven to be an emerging pathway to convert biomass waste into valuable products [7]. At 100–374 °C and the corresponding saturation pressure (ranging from 1 atm to 217.7 atm), water becomes subcritical and can be used as a reaction medium for biomass [8]. HTC uses subcritical water behavior to degrade biomass into solid hydrochar and liquid products through hydrolysis, dehydration, aromatization, condensation, and polymerization [9]. Mainly, biomass with a high moisture content, like sewage sludge and food waste, has been converted into valuable products like carbon-rich solids (hydrochar) and macronutrient-rich HTC process liquids through HTC [10,11]. The high moisture content in animal manure makes it attractive for HTC [12]. However, the composition of various animal manures can be different based on the animals’ diet, bedding, storage, and handling system [13]. While poultry manure contains a high percentage of dry matter, swine and dairy manure hold high amounts of moisture (a combination of animal feces and urine). As a result, different animal manures could respond to HTC differently.
Reza et al. studied the carbon and nitrogen distribution in HTC of cow (dairy) manure and found that around 50% of the nitrogen and most of the potassium dissolved in the liquid phase [14], but in another study, HTC of poultry manure reduced the solubility of potassium [15]. While HTC of dairy manure caused a decrease in the carbon content in hydrochar, HTC of swine and poultry manure showed an increasing trend of carbon content with HTC temperature [9,15,16]. As different manures can react differently with HTC because of their heterogeneous characteristics and chemical composition, a study on the comparison of the effect of HTC temperature on different animal manures could reveal valuable information on HTC products for different animal manures. Moreover, research reports on HTC of different animal manures focused on the solid product as a potential solid fuel and fertilizer [17,18]. Independent studies on poultry [19,20], dairy [21,22], and swine manure [23,24] have investigated the possibility of obtaining solid fuel through HTC. Still, different valuable products like biofuel, bacteriostatic agents, and nutrient sources have been found in the aqueous phase of hydrothermal treatment [25]. As water goes through a subcritical condition in HTC, the process liquid from HTC could have significant chemical characteristics, but there is not much research available that compares the composition of liquid HTC products made from different manures.
This study aimed to explore the variability in chemical characteristics of three different animal manures (poultry, swine, and dairy) and the effect of HTC on them. Furthermore, the impact of the HTC temperature was analyzed, and the change in significant chemical characteristics between hydrochar and process liquid was compared.

2. Materials and Methods

2.1. Feedstock Preparation and Hydrothermal Carbonization

Three different animal manures (poultry, swine, dairy) were collected from commercial farms in Ohio. Before collection, they were stored in separate manure storage facilities by the farms. To avoid heterogeneity in sampling, each batch of sample was manually agitated.
The moisture contents were measured by following the oven-drying method (CEN/TS 15414-1:2010) [26] and found to be 36.88 ± 0.42%, 97.37 ± 0.36%, and 96.58 ± 0.03% for poultry, swine, and dairy manure, respectively. As swine and dairy manure had more than 90% moisture content, they were strained using grade 100 cheesecloth, and the strained liquid was re-added to the slurry to maintain a solid-to-liquid ratio of 1:10, as this ratio provides adequate reaction severity and hydrochar yield [27]. In contrast, deionized water was used for poultry manure to maintain its 90% moisture content.
HTC was performed for each manure in a 600 mL Parr reactor (Moline, IL, USA) at three different temperatures (180, 220, 260 °C) with a 30 min residence time. Solid hydrochars were separated through vacuum filtration. Process liquids were stored in a refrigerator until further characterization. Meanwhile, the hydrochar was oven-dried at 105 °C for 24 h, then ground and stored. The hydrochars were labeled PM HT, SM HT, and DM HT for poultry, swine, and dairy manure hydrochar, respectively, where HT stands for HTC temperature. For the process liquid samples, PL was added to the label of the corresponding hydrochar. For example, PM H180 indicates hydrochar produced from poultry manure at 180 °C, and PM-PL-H180 is its corresponding process liquid.
To ensure the reliability and reproducibility of our results, each condition was tested in replicate. Separate runs were conducted for each HTC condition (180 °C, 220 °C, and 260 °C) for all three types of manure. All characterizations of the hydrochars and process liquids were performed independently for each run. The data obtained from these characterizations were averaged, and the standard deviation was calculated to quantify the variability within each set of conditions. The results are presented as mean ± standard deviation.

2.2. Product Characterization

Elemental analysis was performed on dried manures and their hydrochars using an Organic element analyzer from Flashsmart (Thermo Scientific, Grand Island, NY, USA) for carbon, hydrogen, nitrogen, and sulfur weight %. Ash in the solid samples was measured following the ASTM D1102 Technique using a muffle furnace (Thermo Scientific, Model # FB1415M, Waltham, MA, USA). The oxygen content was calculated using the difference method.
Thermogravimetric analysis was performed on the dried samples with a PerkinElmer TGA 4000 (Waltham, MA, USA). Every TGA run included the circulation of 20 mL/min of nitrogen gas to keep the inert atmosphere. The samples were heated isothermally for 5 min, at a rate of 50 °C/min, from their initial temperature of 35 °C to 105 °C for additional moisture removal. After that, the samples were heated to 900 °C at the same rate and held there for five more min. Volatile matter was responsible for the mass loss that occurred between 105 °C and 900 °C.
A Thermo Scientific Attenuated Total Reflector (ATR) FTIR (Model: Nicolet iS5, Madison, WI, USA) with a Diament crystal was used to detect the functionalities of dry manure and their hydrochar’s surface. Solid samples were ground to a fine powder and placed on the ATR scanner from 400 cm−1 to 4000 cm−1 wavenumbers, with 64 scans per second and 8 cm−1 resolution. One blank run was carried out before every measurement for atmospheric air correction of the baseline.
Dried solid samples were ground using a mortar and pestle. The ground fine powder of dried manures and their hydrochars were gold-sputtered with a Denton Vacuum Desk III vacuum sputter (Moorestown, NJ, USA). Then, a JEOL JSM 6380LV Scanning Electron Microscope (SEM) (Tokyo, Japan) was used to visualize the sample surface with 500x magnification. Semi-quantitative inorganic analysis was performed using an energy-dispersive spectrometer (EDX) (Genesis, EDAX, Los Angeles, CA, USA) on four different sites on the surface of each solid sample. The average values of the elemental concentrations from the four sites were calculated. Additionally, the standard deviation of these measurements was determined to quantify the variability and precision of the analysis.
Dionex Aquion from the ion chromatography system of Thermo Scientific (Waltham, MA, USA) was used for ion analysis. The HTC process liquids were diluted with Milli-Q water, and solid samples were digested with sulfuric acid (98%) and hydrogen peroxide (30%) and diluted with Milli-Q water for ion analysis. For anion detection, a liquid sample was injected into a Dionex ionpacTM AS22 column, and the Dionex ASRSTM suppressor with 4.5 mM Sodium carbonate/Sodium bicarbonate solution was used as the eluent with a 1.2 mL/min flowrate. A Dionex ionpacTM CS12A column and Dionex CSRSTM suppressor were used for cation detection with 20 mM methanesulfonic acid as eluent. Moreover, the process liquid’s pH, dissolved oxygen (DO), and conductivity were measured with Orion Versastar Pro from Thermo Scientific (Waltham, MA, USA).

2.3. Statistical Analysis

To find the statistical significance of different manure types and temperatures on HTC, a regression analysis was performed with Minitab Software, Version 19 (Minitab Inc., State College, PA, USA). The following regression model was fitted:
Response = β0 + β1(Temperature) + β2(Manure Type) + ϵ
where Yield was the response variable and temperature and manure type were selected as the continuous predictor and the categorial predictor, respectively.

3. Results and Discussion

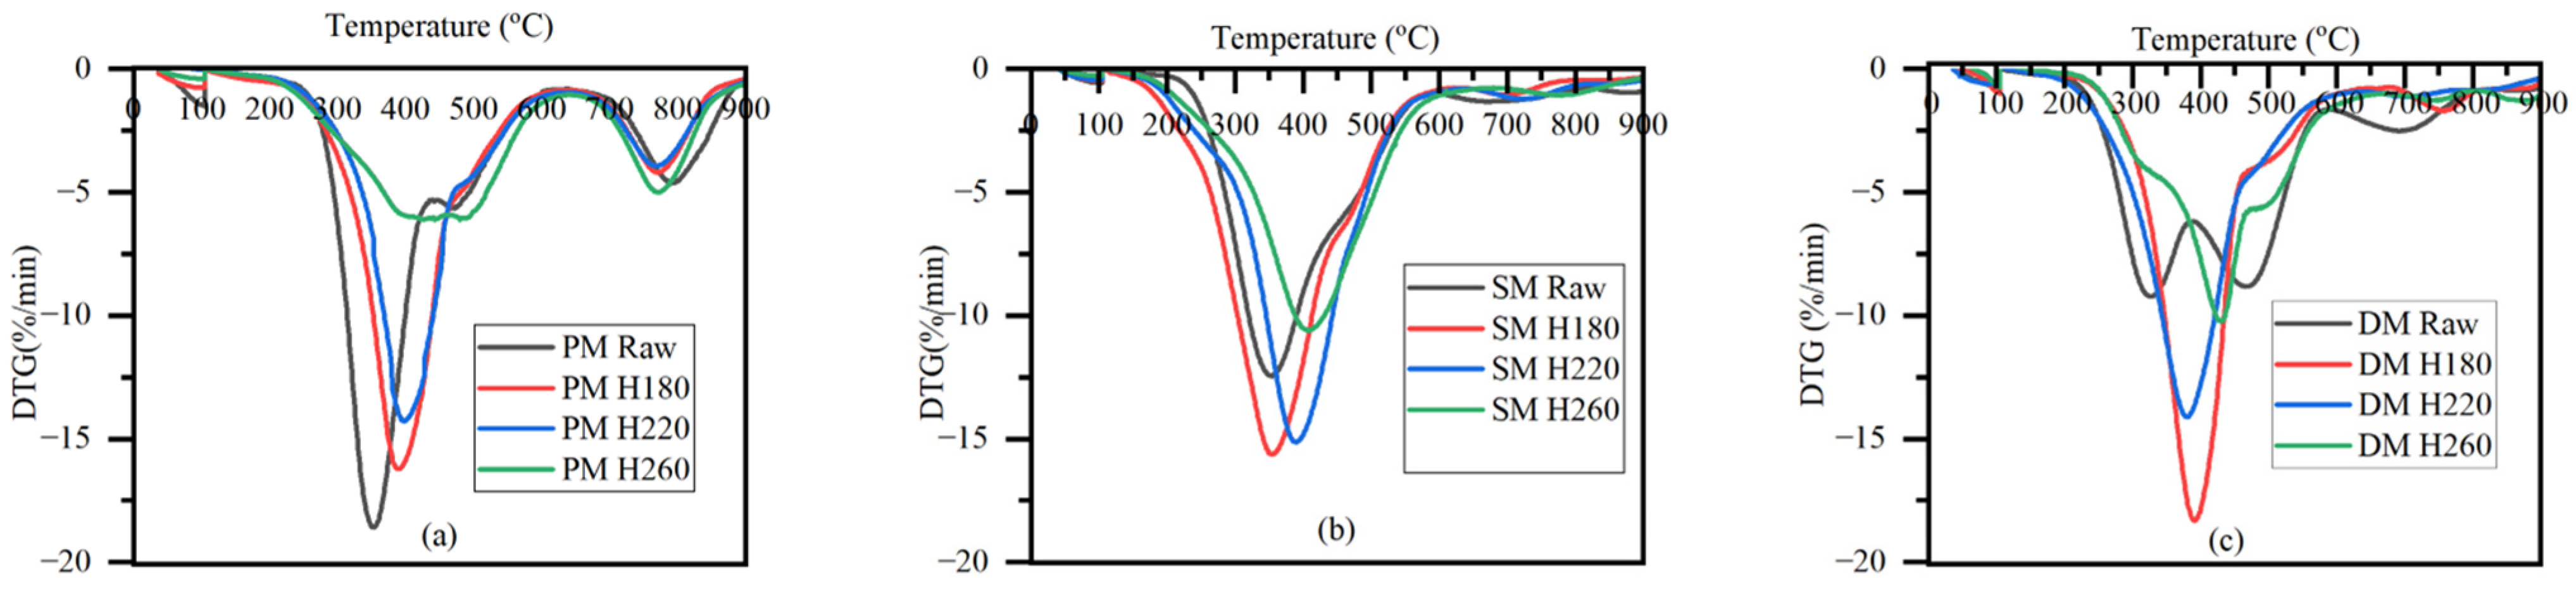
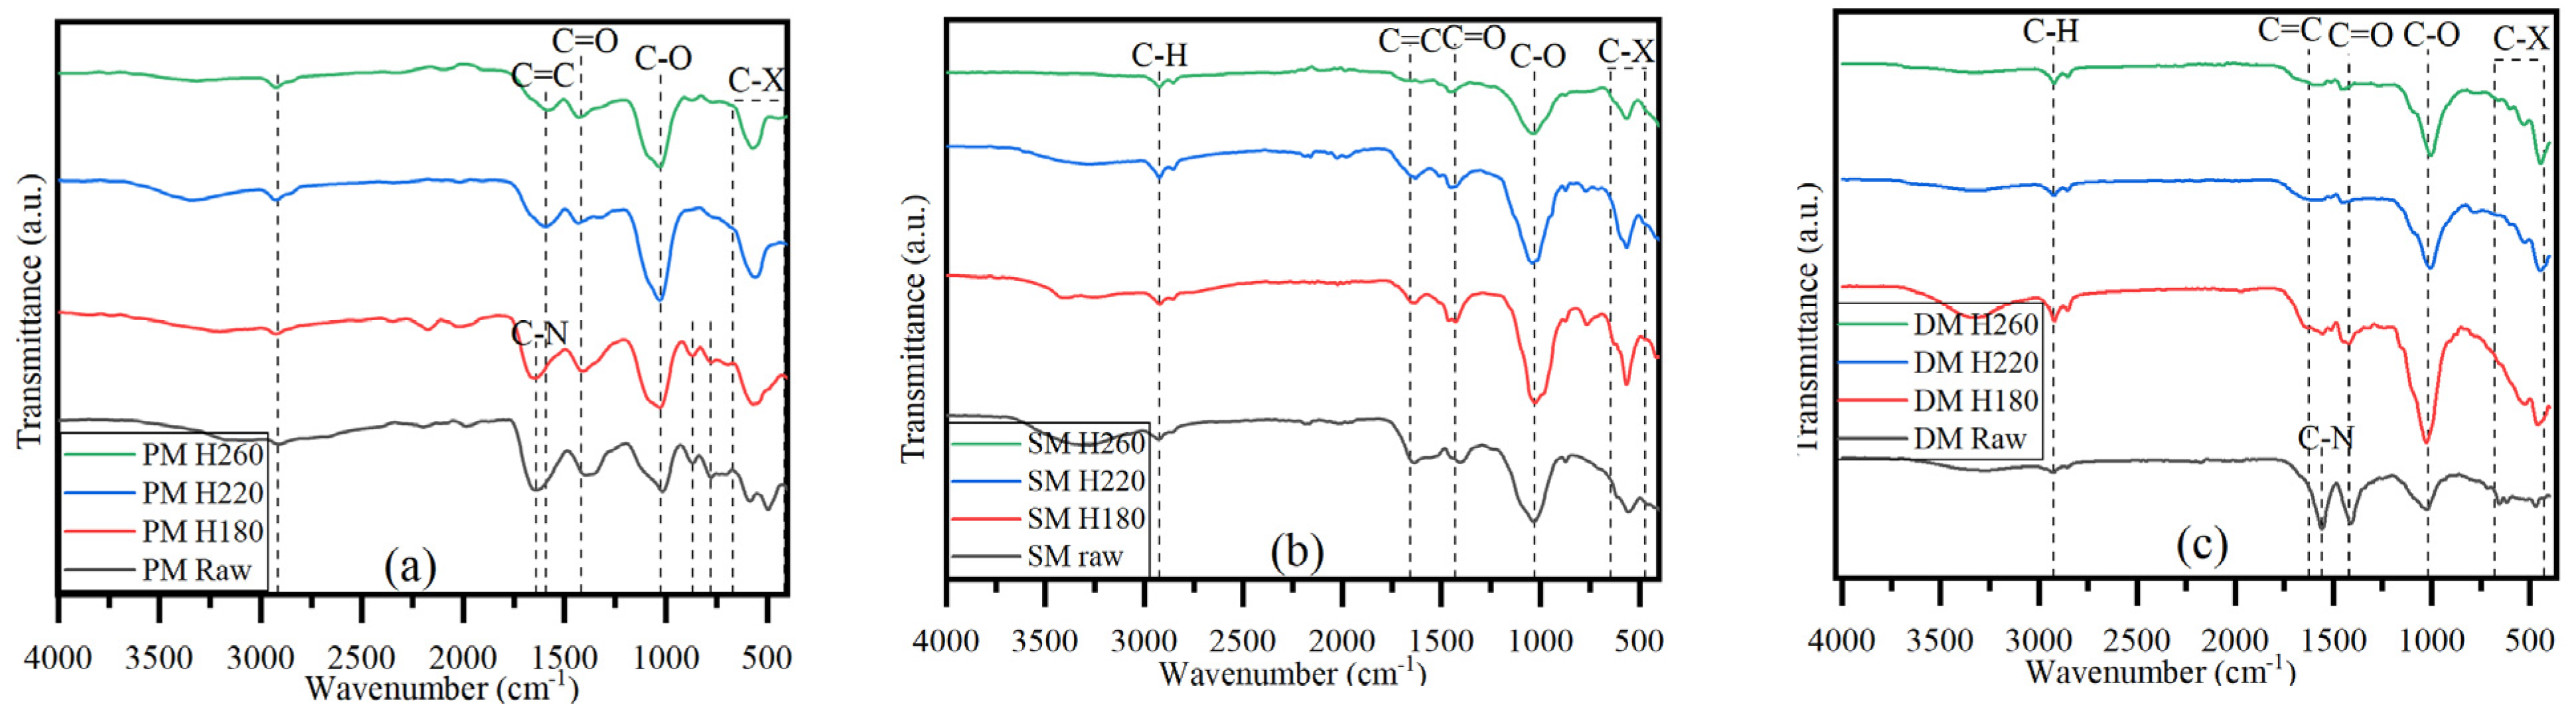
3.1. Effect of HTC Temperature on Thermophysical Properties of Hydrochars and Process Liquids

The characteristics of the hydrochars, including the mass yield, elemental composition, and characteristics of their corresponding process liquid—including pH, DO, and conductivity—are listed in Table 1. After HTC, solid hydrochar is produced, and the hydrochar yield decreases with an increasing HTC temperature; however, the mass yield varies from manure to manure. For instance, the hydrochar yield decreased gradually from 32.12 ± 2.00% to 29.12 ± 093% and 28.08 ± 0.42% for 180, 220, and 260 °C, respectively, for PM with the increase in temperature. In SM, the hydrochar yield decreased from 65.90 ± 2.44% to 54.07 ± 0.77% for SM H180 to SM H220, and the yield remained similar for SM H260 (53.02 ± 1.94%). The hydrochar yield of DM decreased gradually with the HTC temperature, but the difference was more prominent in DM than in PM. The yield for DM H180 was 46.08 ± 1.44%, but for DM H220 and DM H260, it dropped to 33.59 ± 0.45% and 28.52 ± 1.56%, respectively. PM HTC produced 40–90% less hydrochar than SM HTC and DM HTC. A lower protein-to-lignocellulosic-compound ratio in a biomass causes a synergistic effect, increasing the hydrochar formation during HTC [28]. The diet of poultry includes less lignocellulosic compounds compared to dairy and swine, causing a higher protein-to-lignocellulosic-compound ratio in PM, resulting in a comparatively lower yield in HTC [29]. The gradual decrease in yield can be explained by the increasing reaction severity in HTC with an increasing HTC temperature [30]. Cellulose degrades into organic acids at temperatures higher than 200 °C thorough hydrolyzation, and this process is favored in acidic media [31]. At 220 °C, the cellulose in SM could degrade into organic acid, lowering the pH of the process liquid to 7.58 ± 0.18 from the 7.95 ± 0.19 of SM PL H180. The similar yields and process liquid pH of SM H220 and SM H260 indicates the low amount of cellulose in swine manure, which mostly degrades at 220 °C, whereas further degradation at 260 °C is seen in DM HTC, indicating a high amount cellulose being present in DM. A gradually decreasing pH of the process liquid enhances the degradation of cellulose compounds in DM, causing a significant decrease in yield at higher temperatures.
The results of the statistical analysis for yield are presented in Table S1. The overall regression model for yield was statistically significant (p-value = 0.001), indicating that the predictors (temperature and manure type) collectively influence the yield of HTC products. The p-values for temperature and manure type were 0.015 and 0.001, respectively, suggesting a significant effect of temperature and manure type on yield. The statistical significance of the temperature and manure type on yield provides a foundation for expecting similar significance in the characteristics of HTC products from different animal manures, as previous studies show correlations between yield and other characteristics in HTC processes [32,33].
A higher amount of crude protein in dietary supplements fed to poultry causes a high amount of elemental nitrogen in raw PM [27]; 6.17 ± 0.42% was found in this study. On the other hand, swine and dairy are fed grains and forages with high fiber, causing comparatively lower levels of nitrogen: 3.69 ± 0.19% and 2.64 ± 0.06% in raw SM and raw DM, respectively. The difference in nitrogen content in swine and dairy manure can be explained by the difference in the digestive systems of the animals. Cow is a ruminant animal with ruminal bacteria in its digestive system, which increases the nitrogen use efficiency of cow compared to swine, which is not a ruminant animal [34]. The increased presence of sulfur in the swine’s diet caused a high amount of sulfur in raw SM (1.86 ± 0.07%) [35] compared to raw PM (0.97 ± 0.04%) and raw DM (0.98 ± 0.03%). Table 1 shows that HTC of PM at 180 °C did not cause any significant change in carbon content due to an increasing amount of ash from 40.67 ± 0.06% to 45.85 ± 2.42%, but its oxygen content decreased from 17.2 ± 3.75% to 9.15 ± 3.96, along with a slight decrease in hydrogen content indicating a dehydration and deoxygenation reaction taking place at lower-temperature HTC of PM. In contrast, HTC of SM at 180 °C increased the carbon and hydrogen contents from 34.97 ± 1.23% to 39.05 ± 0.68% and 4.41 ± 0.23 to 5.56 ± 0.06%, respectively, with no significant change in oxygen content, showing the possibility of a carbonization reaction taking place. DM showed similar behavior, with an increase in carbon content from 36.3 ± 0.33% to 39.52 ± 1.99%, but its hydrogen content decreased after HTC at 180 °C from 5.78 ± 0.44% to 5.04 ± 0.22%. This could be a result of both carbonization and dehydration taking place simultaneously during HTC of DM at 180 °C. With an increasing HTC temperature, the carbon content in the PM hydrochar increased with no significant difference in hydrogen content. Meanwhile, a decreasing trend in oxygen content is observed. This behavior may be due to carbonization increasing with the HTC temperature [20]. On the other hand, the carbon content in the SM hydrochar showed an about 3% increment from 180 to 260 °C, while the pH of the process liquid was 7.95 ± 0.19, 7.58 ± 0.18, and 7.57 ± 0.37 for SM PL H180, SM PL H220, and SM PL H260, respectively. The simultaneous increase in the amount of organic acid formation and carbonization with the HTC temperature may have caused this little increase in carbon content with a decrease in the pH of the process liquid at 220 °C. As already discussed based on the insignificant difference in yield and pH value of SM H220 and SM H260, there is no significant increase in organic acid formation because of an increasing HTC temperature from 220 to 260 °C. DM reacts differently with the HTC temperature compared to PM and SM, showing a decrease in carbon content with HTC temperature; 39.52 ± 1.99%, 37.51 ± 0.59%, and 36.26 ± 1.31% for DM H180, DM H220, and DM H260, respectively. The increasing production of organic acids with the HTC temperature could cause this difference [9]; the decreasing pH of the process liquid from 6.51 ± 0.11 to 5.77 ± 0.08 with the temperature also supports this behavior.
The nitrogen content in animal manure mostly comes from their dietary protein [29]. Previous studies have shown that biomass protein degrades in hydrothermal treatment at a wide range of temperatures (130–240 °C), and the presence of a lignocellulose component influences the condensation and polymerization of protein-derived substances in the solid phase of HTC [36,37]. Similar behavior was seen in this study on PM. The nitrogen content in raw PM was 6.17 ± 0.42%. It dropped to 3.57 ± 0.87% in PM H180. A higher amount of lignocellulose caused less destruction of protein in HTC of SM and DM. The nitrogen content was not significantly different between raw SM and SM H180, whereas there was a slight decrease in nitrogen content from raw DM (2.64 ± 0.06%) to DM H180 (2.13 ± 0.06). With an increasing HTC temperature, a decreasing trend was seen for poultry and swine manure, but it was not that significant due to the interaction between HTC-produced carbohydrates and protein [37]. The condensation and polymerization of nitrogen components with increasing HTC temperature was seen in DM. The nitrogen content increased around 14% from DM H180 to DM H260. Another reason behind the increment could be the adsorption of nitrogen into the solid phase at higher temperatures [14].
The sulfur contents in raw manures were 0.97 ± 0.04%, 1.86 ± 0.07%, and 0.98 ± 0.03% for PM, SM, and DM, respectively. Among the manures studied, SM had the highest sulfur content with 1.86 ± 0.07%, whereas PM and DM had 0.97 ± 0.04% and 0.98 ± 0.03% of sulfur, respectively. Organic sulfur in biomass converts into an inorganic form through hydrothermal treatment [38]. After HTC at 180 °C, the sulfur content decreased in PM and SM to 0.68 ± 0.05% (PM H180) and 1.66 ± 0.04% (SM H180), respectively. This could be due to the formation of soluble sulfide in the aqueous phase [39]. Meanwhile, in DM, the sulfur content increased to 1.25 ± 0.14%, indicating the conversion of organic sulfur compounds to their inorganic form and their condensation in the solid phase [39]. With an increasing temperature, the sulfur content increased in the PM and SM hydrochars, showing a dissolution effect of the sulfur component from the aqueous phase to the solid phase [39]. No significant difference among the sulfur contents of DM hydrochars was seen, indicating a possible formation of stable soluble sulfur compounds in the aqueous phase.
Inorganics in animal manure form ash in the hydrochar after HTC [40]. The ash content in PM increased from raw PM (40.67 ± 0.06%) to PM H180 (45.85 ± 2.42%) but decreased from 40.67 ± 0.06% to 31.68 ± 1.54% and 41.5 ± 0.13% to 35.04 ± 1.84% from raw SM to SM H180 and raw DM to DM H180, respectively. In PM, the inorganics condensed in the hydrochar, whereas in SM and DM, the inorganics transferred into the aqueous phase. It can be found that more soluble inorganics were present in SM and DM compared to PM, but with an increasing HTC temperature, inorganics form a higher melting point, and oxides tend to remain in the hydrochar of animal manure [21,41,42]. An around 5% increase in ash content in PM H260 compared with PM H180 supports this idea. Although a significant number of inorganics dissolved in the aqueous phase of SM 180 and DM 180, at higher temperatures, they tend to condense in the solid phase by increasing their ash contents by around 30% and 38% for SM H260 compared with SM H180 and DM H260 compared with DM H180, respectively.
Figure S1 and Figure 1 show the mass loss, TG (%) and rate of mass loss, DTG (%/min) of manures, and their hydrochars, respectively. The DTG curves shown in Figure 1 focus on the pyrolytic decomposition of samples above 100 °C. A marginal weight loss is noticed at 100 °C, which is the mass loss from water evaporation and the removal of partially bounded water from samples before pyrolytic decomposition. The weight loss between 225 °C and 600 °C is due to the devolatilization of hemicellulose, cellulose, protein, and starch [42]. Each raw manure had a major weight loss region in this range, but the presence of a shoulder on the main degradation peak of the raw PM indicates the presence of hydrocarbons with a heterogenous molecular structure [43]. The intensity of the shoulder reduces after HTC and eventually disappears with increasing HTC temperatures. It completely disappears for PM H260, suggesting more homogenous hydrochar molecules at a higher HTC temperature. The same effect is seen for raw SM and its hydrochar, but the shoulder for the raw SM DTG peak was less prominent than for raw PM, indicating less heterogeneity in the raw SM than the raw PM. However, a smooth peak is seen for SM H260 in that region (225 °C to 600 °C), indicating a derivation of homogeneity. For the raw DM, two distinct peaks of the DTG curve are noticed in this region. Hemicellulose and cellulose decompose at different temperatures. The first peak in Figure 1c is at 250 to 350 °C, and the second is from 350 °C to 550 °C for raw DM, which are indeed the decomposition ranges of hemicellulose and cellulose, respectively [44]. A lower ratio of hemicellulose and cellulose in DM may have caused this distinction. After HTC, the distinction disappears, but a small shoulder is still seen for DM H260. This means that DM hydrochar was not as homogenous as PM or SM hydrochar. PM and its hydrochars had a secondary degradation peak between 650 °C and 850 °C, indicating an abundance of biogenic salts in PM as minerals and inorganic salts (carbonates, sulphates, oxalates, and chlorates), which are devolatilized beyond 600 °C [42]. SM and its hydrochar did not have any prominent peaks in that region, but the raw DM had a prominent peak, and it became less prominent after HTC. DM could have some biogenic salts in it, but it transferred into the aqueous phase after HTC. With an increasing temperature, the peaks of DTG curves for every manure hydrochar shifted to higher-temperature regions, and the intensity of those peaks also decreased with increasing temperatures. This means that it took a higher temperature and longer time to degrade any manure hydrochar produced at a higher HTC temperature. All the manure hydrochars were more thermally stable and less volatile with increasing HTC temperatures.

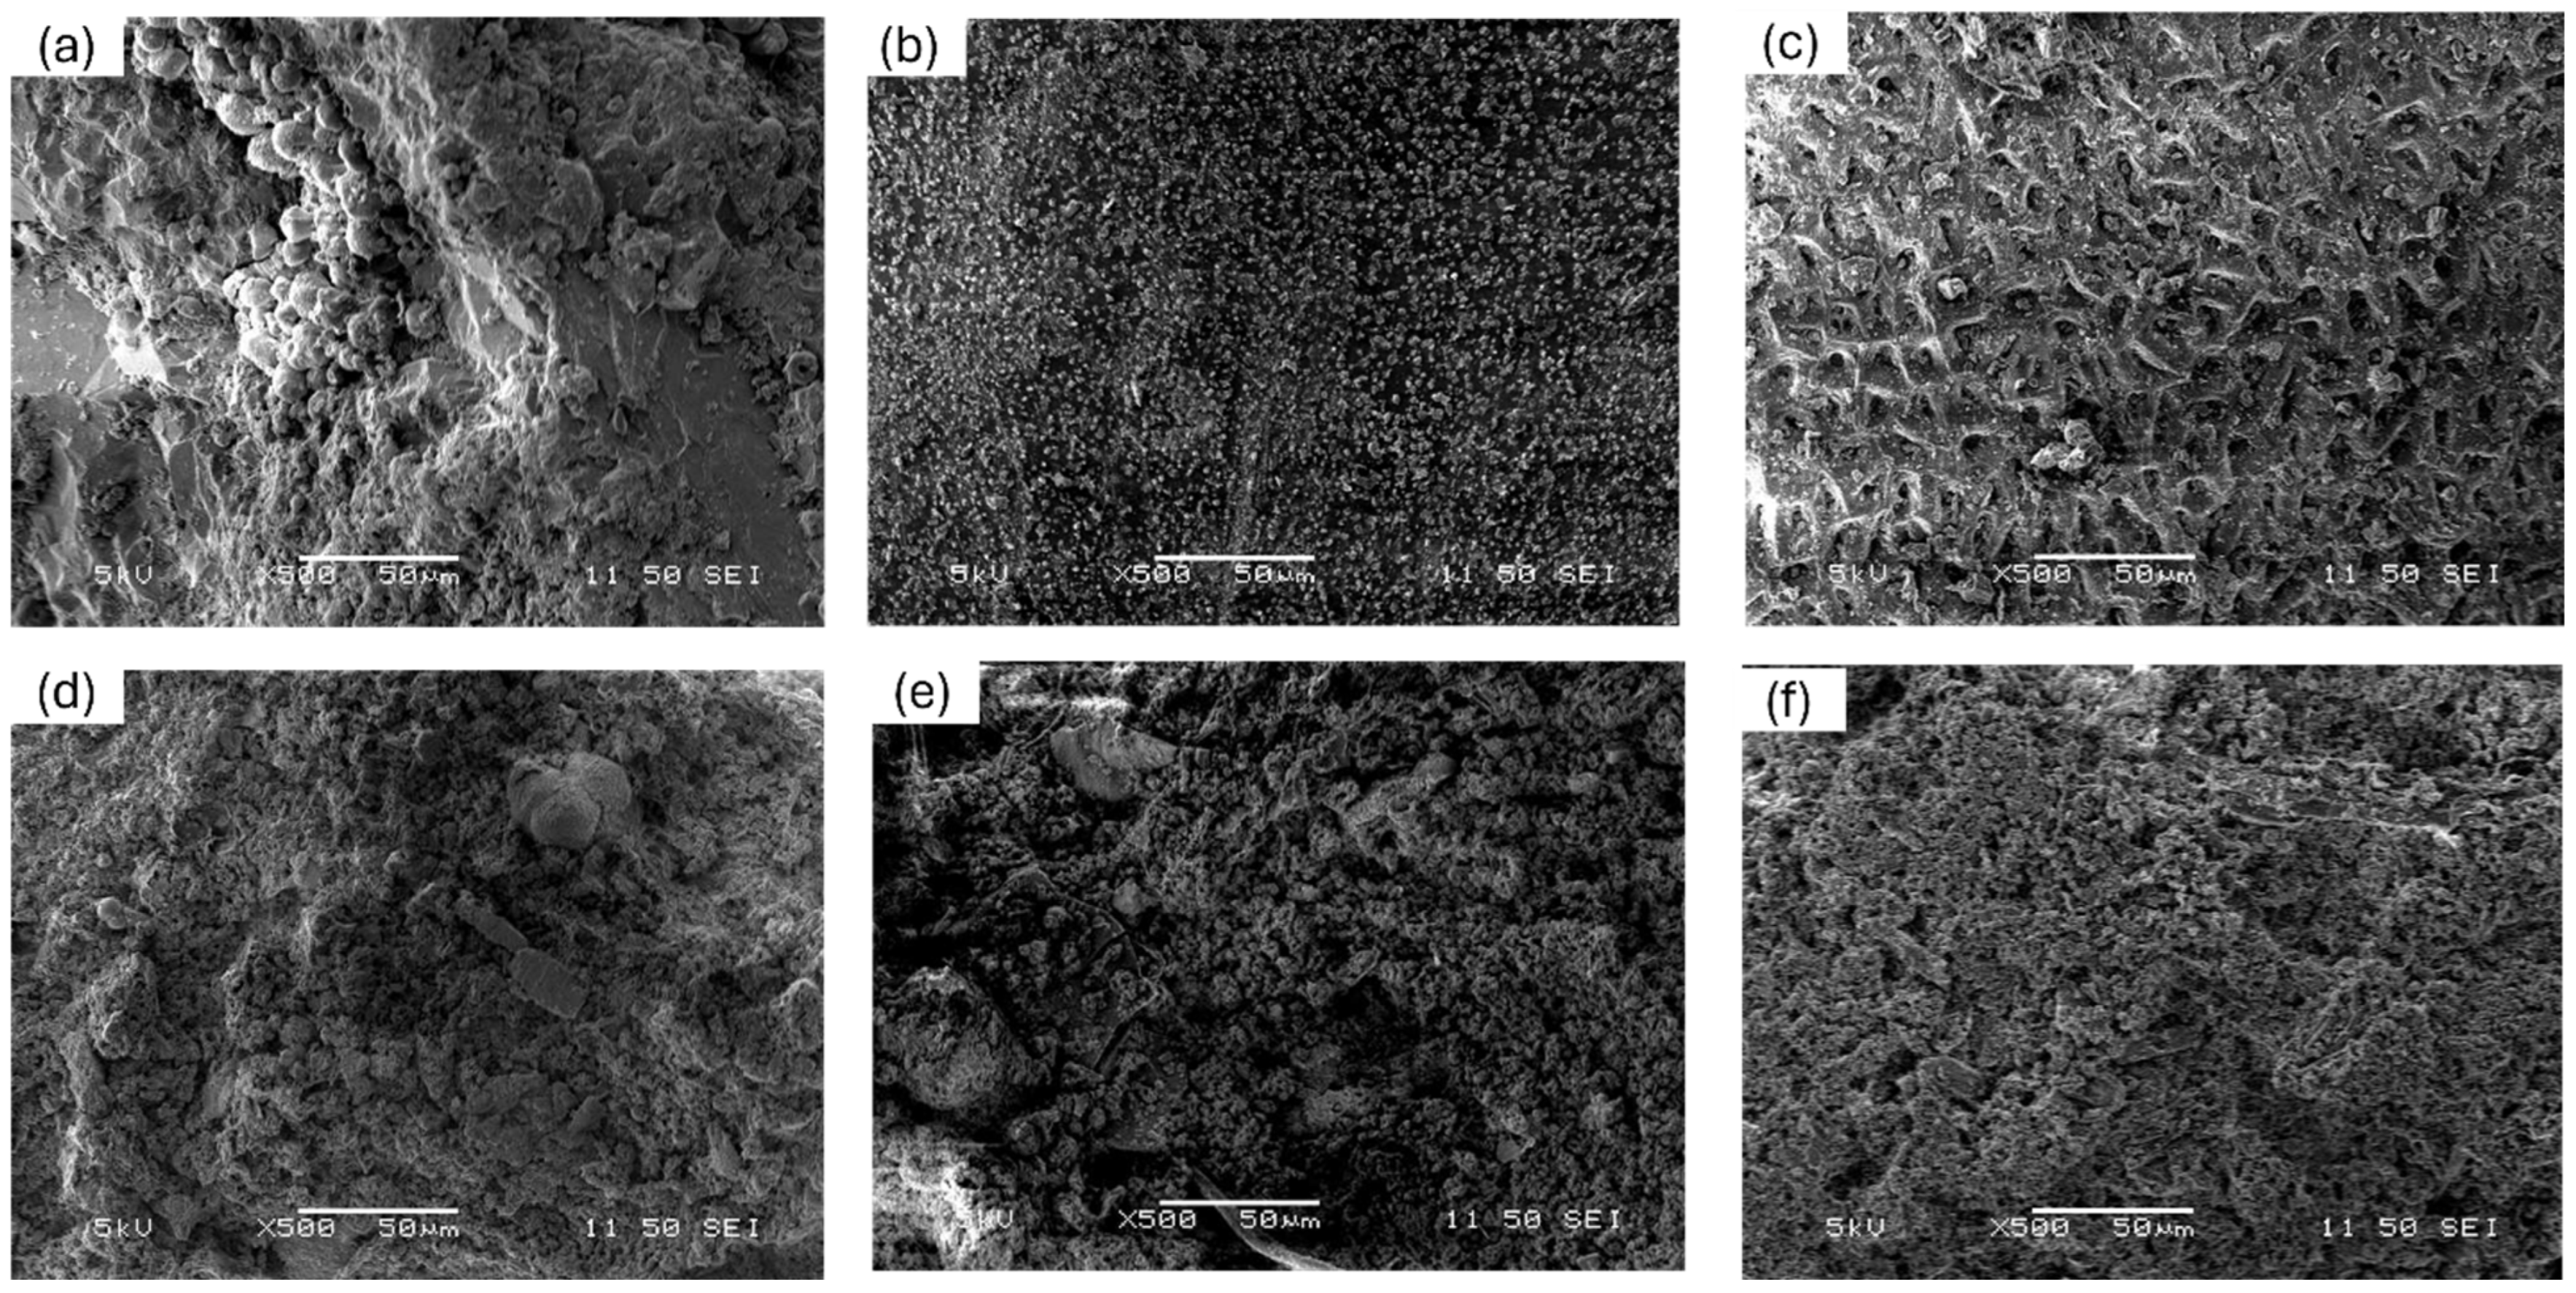
3.2. Surface Morphology Alteration with HTC Temperature for Various Manures
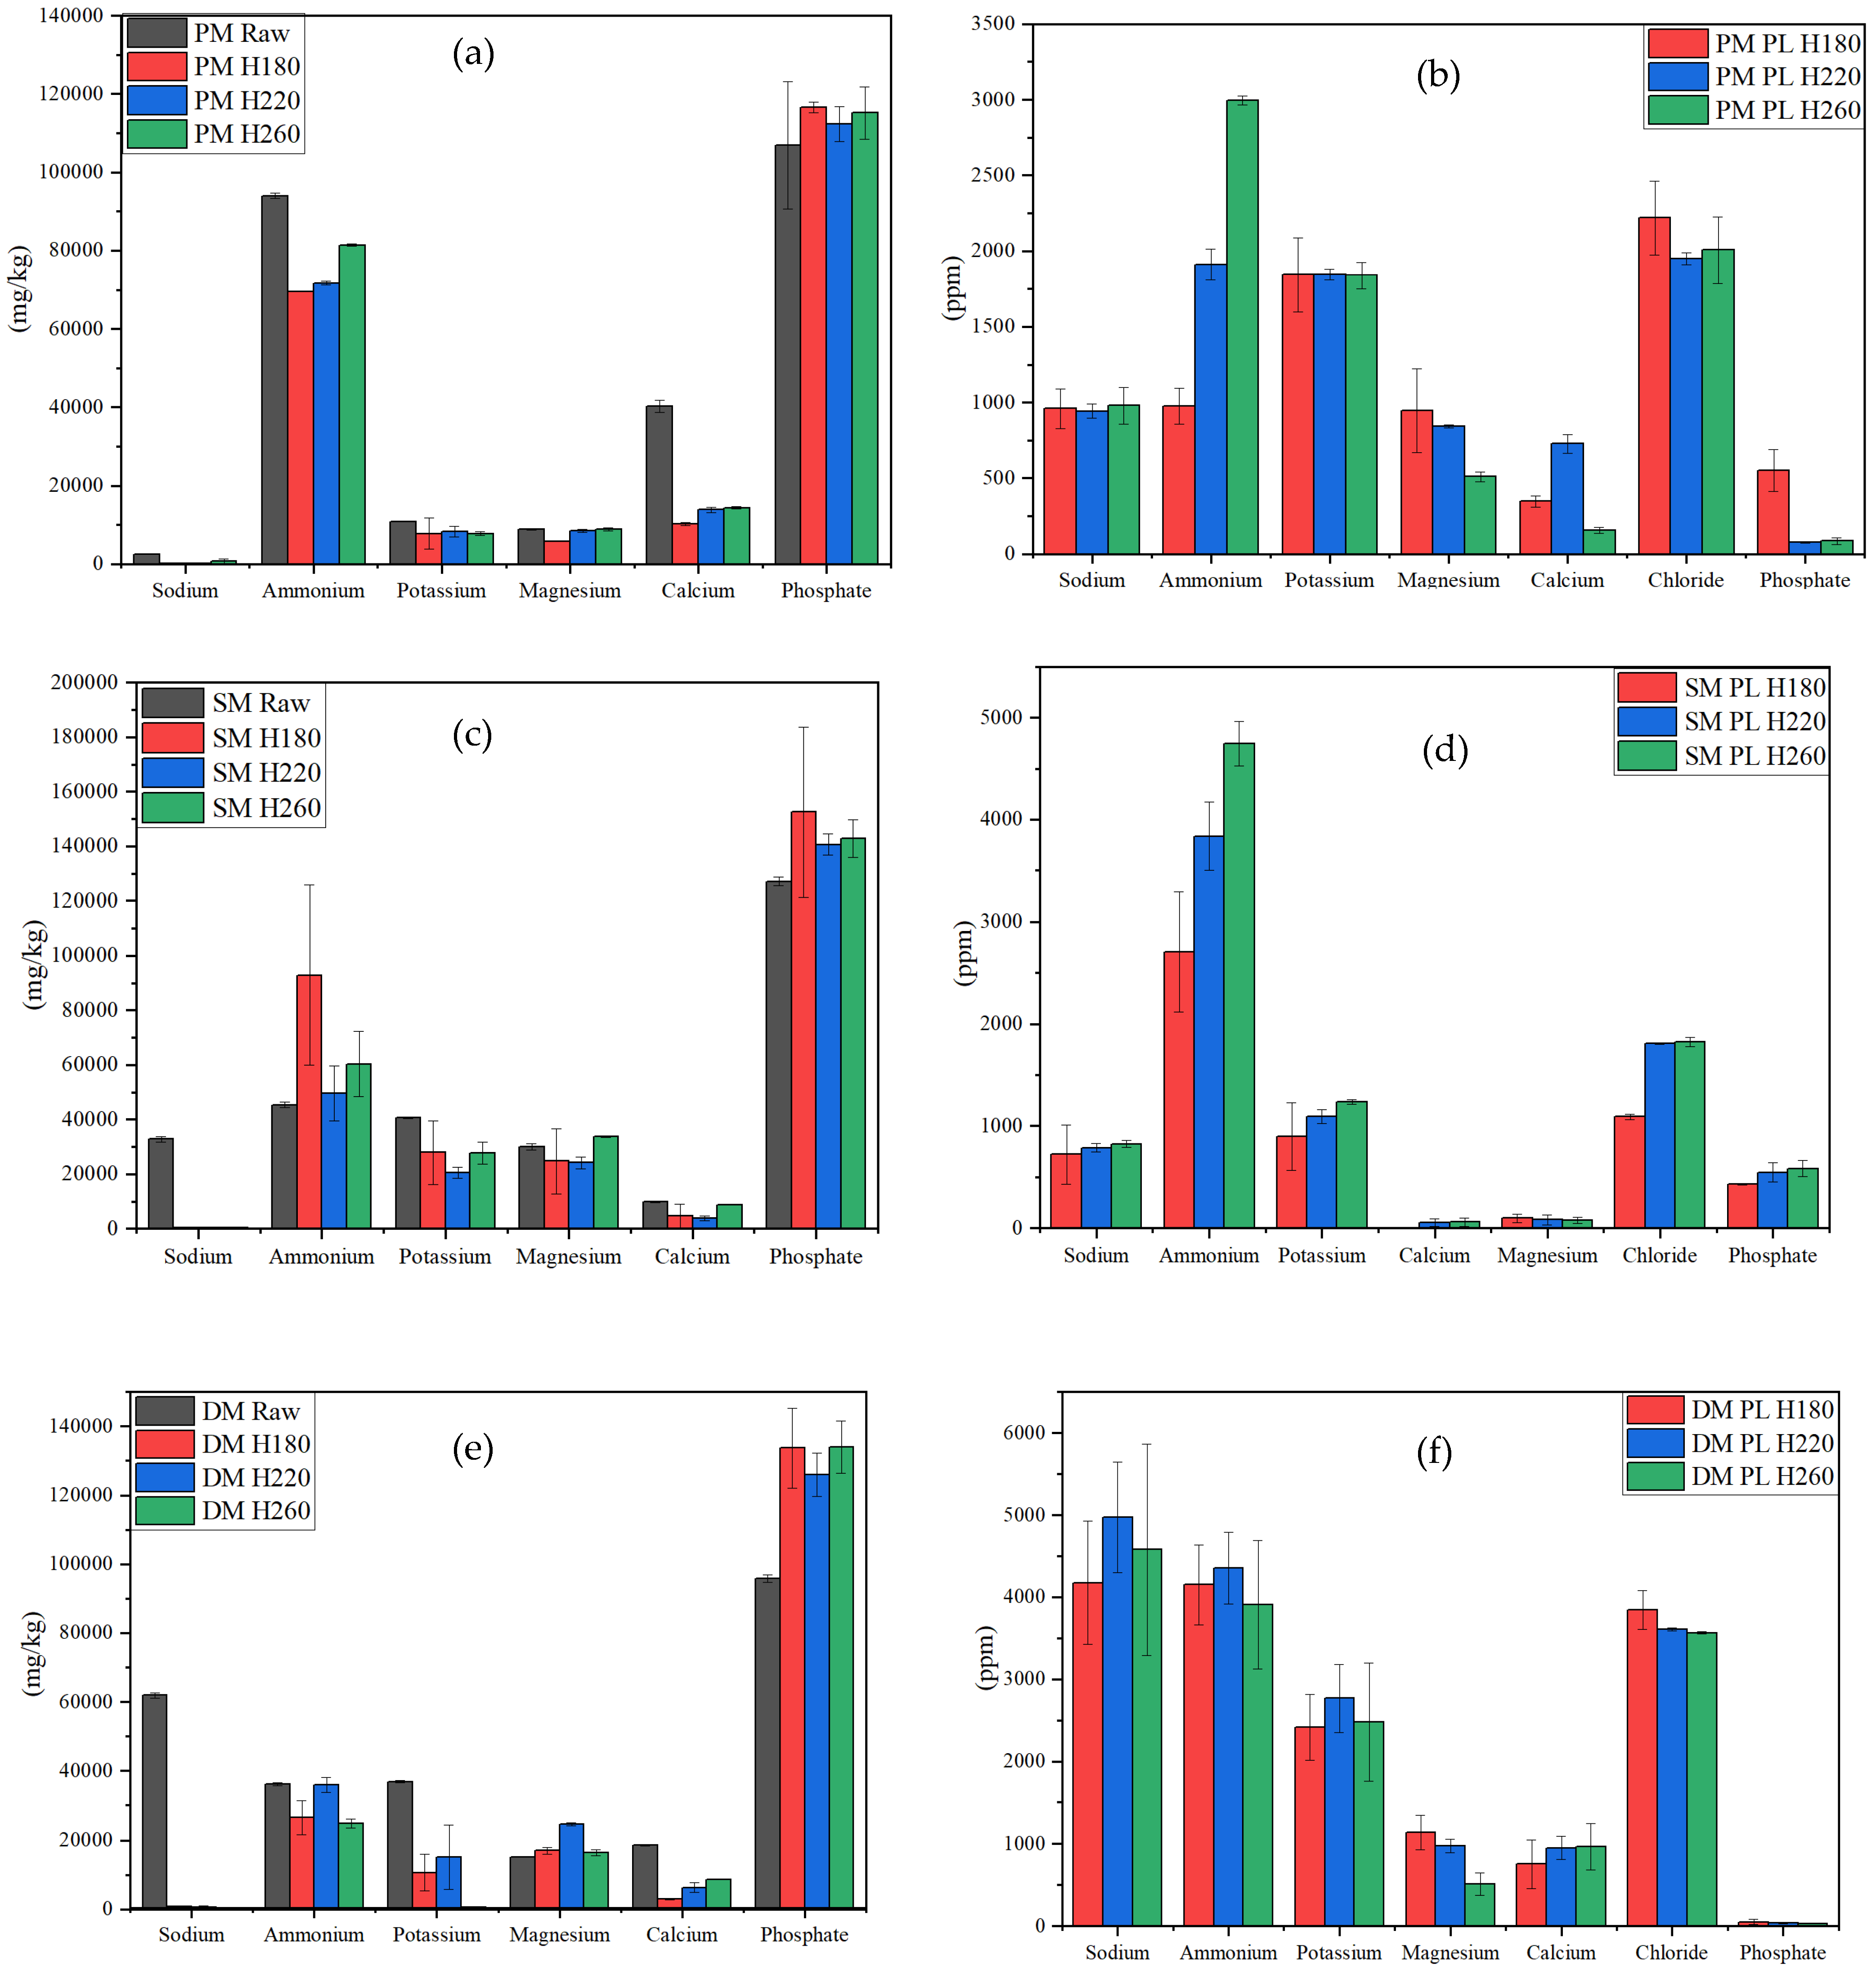
The SEM images of raw manures in Figure 2 exhibit the differences among different manures. Large lumps with small granules were noticed in the raw PM. On the other hand, dry chunks of the raw SM had a smooth surface with small fragments, and porous behavior was seen on the surface of the raw DM. With HTC, homogeneity was derived in each manure, proving the analysis of the thermogram in Section 3.1. The resulting hydrochars contain finer particle sizes, indicating the breakdown of larger molecules and bonds during the process. However, hydrochars from different manures have different textures and particle sizes. PM hydrochars contain small soft lumps, whereas SM hydrochar showed a granular texture. After drying the DM hydrochar, a hard lump particle was seen, but after grinding, it broke into smaller particles. Although HTC achieved homogeneity in all three manures, the resultant breakdown process varied among them.
FTIR spectroscopy was applied on dried raw manures and their hydrochars to understand the chemical changes during the HTC reaction, as presented in Figure 3. The detailed FTIR spectroscopies of individual samples can be found in the supplementary data (Figures S2–S13). Several firm peaks were found at 550–850 cm−1 for the raw PM, representing carbon bonds with halogen compounds, mostly C-Cl bonds [45]. The peak was visible in the raw SM too, but in the raw DM, the intensity was very low, indicating less presence of halogen compounds in DM. However, the peak intensity decreased with an increasing HTC temperature, more prominently in SM H180 to SM H260, confirming the increasing removal of chloride ions from solid to liquid with the HTC temperature, as presented in Section 3.3. A significant broad peak was located at 950 to 1250 cm−1 for every sample, representing C-O stretching from polysaccharides and carbohydrates [14]. The peak intensity for carbohydrates and polysaccharides decreased with an increasing HTC temperature, indicating the increasing decomposition of carbohydrates with the increasing temperature. Also, a peak for the C=O (ketone) group for hemicelluloses was found between 1490 and 1500 cm−1 [14]. This peak was less prominent in the PM hydrochar than in the SM and DM hydrochars, confirming the smaller presence of lignocellulose in PM. In raw PM and PM H180 and in raw DM, a significant peak at 1540–1570 cm−1 was seen, assigned to amide II bonds [45], possibly from protein. This peak disappeared with an increasing HTC temperature, and the C=C stretching in aromatic rings (1600–1640 cm−1; [46]) became more prominent in PM H220-H260 and DM H220-H260. C=C stretching was present in the raw SM, and it became stronger in higher-temperature SM hydrochars. Moreover, the intensity of the peak located at 2840–2920 cm−1 was assigned to C-H stretching from the aliphatic bond [46] and decreased with an increasing HTC temperature. This phenomenon represents the decomposition of nitrogen compounds (protein) in HTC and the manure hydrochar being more aromatic with a higher HTC temperature.
EDS was performed on the surface of dried raw manures and their hydrochars. The results from the SEM-EDS analyses are presented in Table 2. Among the three raw manures, the least amount of sodium was present on the surface of the raw PM with 1.57 ± 0.17%, and it disappeared after HTC. On the raw SM surface, sodium was seen at the highest level with 10.38 ± 0.9%, and it decreased around 80% after HTC, with a decreasing trend with increasing HTC temperatures. The raw DM had 8.24 ± 0.09% sodium on its surface, and it went below the detection limit for SM H220. Magnesium decreased after HTC for each manure. It did not follow any specific trend on the PM and SM hydrochar surfaces, but overall, the magnesium content increased on the PM and SM hydrochar surfaces with increasing HTC temperatures. On the other hand, on the DM hydrochar surface, the magnesium content showed a trend of increasing by around 40% with increasing HTC temperatures. Phosphorus showed an interesting trend in poultry and swine manure, as it increased after HTC for PM H180 by around 40% compared with the raw PM, decreased for PM H220 by about 50%, and increased again for PM H260, but it increased gradually with the HTC temperature from 2.54 ± 0.05% for raw DM to 4.84 ± 0.07% for DM H260. Sulfur increased with the HTC temperature on each manure’s hydrochar surface, which confirms the increasing sulfur content with HTC temperature from the elemental analysis presented in Table 1. The raw PM had 2.43 ± 0.11% chlorine on its surface, but this was not detected after HTC. Meanwhile, the raw SM and raw DM had 2.81 ± 0.05% and 0.71 ± 0.11% chlorine on their surfaces, respectively, and after HTC, they followed a decreasing trend and were not detected in SM260 and DM H220, respectively. This phenomenon indicates the dichlorination in manure hydrochar with a higher HTC temperature, as seen in the FTIR analysis in Figure 3. Potassium decreased after HTC from 7.25 ± 0.75% to 0.21 ± 0.53, 7.97 ± 0.06% to 3.05 ± 0.04%, and 4.15 ± 0.04% to 1.47 ± 0.05% for PM, SM, and DM, respectively. The temperature did not have any significant effect on the potassium content on the surface of the PM and DM hydrochars, but a gradually decreasing trend with increasing HTC temperatures was seen for the SM hydrochar. The calcium percentage increased on the surface of the PM and DM hydrochar after HTC, but it showed the opposite behavior for SM.
The amounts of the micronutrients manganese, iron, copper, and zinc were too low to be detected on the raw manure surface, but they were detectable on the surface after HTC. A micronutrient availability study on different soil conditions found that the availability of these four micronutrients depends on other soil conditions and temperatures [47]. Similarly, the HTC temperature may have affected the availability of these micronutrients on the manure hydrochar surfaces. For SM, no traceable amount of copper, iron, zinc, or manganese was found. After HTC of SM, they were seen on the surface, and their amounts increased with the HTC temperature. DM and PM showed similar effects, but copper and manganese were absent in PM and DM, respectively. The decreasing yield of hydrochar and change in pH with the HTC temperature may have caused a uniform distribution of micronutrients on the surface of hydrochar, and an increasing trend was seen eventually.

3.3. Ion Analysis

Figure 4 represents this study’s ion chromatography results for the digested solids and processed liquids. The digested raw manure samples showed that the raw PM contained the least amount of sodium (2539.06 ± 45.52 mg/kg), whereas the raw SM and DM had 32,825.94 ± 1006.31 and 61,907.19 ± 731.41 mg/kg sodium, respectively. After HTC, a barely detectable amount of sodium remained in each manure hydrochar; almost all the sodium from the solid phase went into the liquid phase. Therefore, the amount of sodium in the process liquids from HTC of each manure did not vary significantly with the HTC temperature.
Nitrogen in solids reacts in digestion and becomes ammonium. Although the nitrogen in the PM hydrochar decreased with the HTC temperature, the ammonium from poultry manure hydrochar increased with the HTC temperature. The opposite behavior was found by Chen et al. when they extracted ammonium from poultry manure hydrochar with a KCl solution. In that study, the ammonium decreased from 132 ± 5.32 mg/kg to 79.5 ± 3.62 mg/kg for HTC temperatures from 180 to 240 °C [48]. In this study, ammonium increased from 69,483.44 ± 56.13 mg/kg to 81,355.31 ± 295.66 mg/kg with temperatures from PM H180 to PM H260. This indicates that inorganic nitrogen is more likely to be extractable in the form of ammonium in acidic environments. C. Song et al. found similar results in their acid extract study of swine manure [23]. This behavior can be explained by an increasing conversion of organic nitrogen to inorganic nitrogen with an increasing HTC temperature. Although the total nitrogen decreased in the PM hydrochar with HTC, the inorganic nitrogen increased with the HTC temperature, and the nitrogen went into the aqueous phase, increasing the ammonium concentration in the process liquid of PM HTC with an increasing HTC temperature. For swine manure, ammonium shows a decreasing trend of around 30% in hydrochar and an around 40% increase in the process liquid with an increasing HTC temperature. On the other hand, no significant effect of temperature on ammonium ions in the DM hydrochar and process liquid was seen. It stayed around 30,000 mg/kg in the DM hydrochar and around 4000 ppm in DM PL.
Potassium showed similar dissolving behavior into an aqueous phase as sodium in each manure, but around 10,000 mg/kg and 25,000 mg/kg of potassium stayed in the PM hydrochar and SM hydrochar, respectively, whereas almost all the sodium went into an aqueous phase. Meanwhile, almost all the potassium went into an aqueous phase during HTC of DM at 260 °C. Similar dissolution behavior of sodium and potassium was found in HTC of swine manure by C. Song et al. [23]. Magnesium and calcium decreased around 20% and 75% to PM H180 from raw PM after HTC. With an increasing HTC temperature, a slight increasing trend of magnesium and calcium was seen for PM, and a decreasing trend was seen in the corresponding liquid process. This means that calcium and magnesium solute in the aqueous phase in HTC of PM, and their solubility decreases with an increasing HTC temperature. Ghanim et al. proposed the possibility of a struvite formation with phosphorus at higher temperatures in their poultry manure HTC study [15]. In DM, most of the magnesium and calcium were retained in the solid phase, and a very little amount went into the process liquid. DM showed similar behavior to PM in HTC for magnesium, but the concentration of calcium in the process liquid of DM HTC stayed at around 1000 ppm at any HTC temperature.
HTC has been proven to help remove chlorine from biomass [49,50,51]. A chloride analysis of the process liquid from HTC of manure re-established this fact. A significant amount of chloride was found in each manure’s HTC process liquid, around 2200 ppm, 2000 ppm, and 3500 ppm in PM PL, SM PL, and DM PL, respectively. This confirms the dichlorination effect of HTC that was discussed in Section 3.2. Increasing amounts of sodium and chloride ions in a process liquid cause rising salinity. Salinity is inversely related to dissolved oxygen (D.O.) [52,53]. This confirms the increasing DO in the process liquid with the HTC temperature, as shown in Table 1. Meanwhile, the conductivity of the process liquids for each manure decreased with increasing temperatures, as presented in Table 1. Xiong et al. conducted an electrical conductivity (EC) study on process liquid derived from swine manure after HTC and found similar results [16]. They explained EC as a parameter of the amount of salt that is dissolved in a sample. Although the salinity of the process liquid increases, the ability of salt to leach into the liquid phase decreases with the HTC temperature, confirming the increasing fixation of inorganics in hydrochar from the ash content analysis.
Raw PM, SM, and DM had 106,901.85 ± 16,208.70 mg/kg, 127,091.53 ± 1617.30 mg/kg, and 95,818.97 ± 1177.30 mg/kg of phosphate, respectively. After HTC, there was an around 10% increase in phosphate content in the PM and SM hydrochars. Around 500 ppm of phosphate was found in PM PL H180, but a very small amount of phosphate was present in PM PL H220 and PM PL H260. On the other hand, around 500 ppm of phosphate was present in the process liquid of SM HTC for each temperature studied. Meanwhile, there was an around 30% increase in phosphate content in the DM hydrochar compared with the raw DM, and a barely detectable amount of phosphate was present in the process liquids from DM HTC. These phenomena match a previous study on the immobilization of phosphorus during HTC of animal manure [54]. In this study, the effect of HTC on phosphorus immobilization was more prominent in DM compared to PM and SM.

4. Conclusions

This study aimed to find differences in the behaviors of different manures following HTC and compare the chemical characteristics of solid and liquid products from HTC at different temperatures. The statistical significance of this study was found through an analysis of variance of yields from different HTC conditions. Heterogenous behavior in different manures after HTC was seen, like the carbon and nitrogen distribution in the DM hydrochar at different temperatures, which showed an opposite trend to the PM and SM hydrochars. The pH of the process liquid for high-moisture-containing manure (SM, DM) after HTC showed a decreasing trend with the temperature. In contrast, the trend was the opposite in low-moisture-containing manure (PM) after HTC. Micronutrients showed significant abundance on the hydrochar surface after HTC. The hydrochars became thermally stable and homogenous with increasing HTC temperatures. Monoatomic ions (sodium, potassium, chloride) dissolved more in liquid products with HTC, and complex ions were absorbed in the hydrochar (phosphate) or became balanced in both the solid and liquid products (ammonium).
Overall, this study provides a comprehensive overview of the heterogeneous behavior of animal manures during HTC, with an understanding of the chemical characteristics of the distribution pathway in solid and liquid products from animal manure after HTC. With these results, further research can be carried out on manure, focusing on using solid and liquid products from animal manure after HTC as soil amendments or fuel.

Supplementary Materials

The following supporting information can be downloaded at https://www.mdpi.com/article/10.3390/environments11070150/s1: Table S1: Analysis of Variance for Yield. Figure S1; Thermogram of (a) poultry manure, (b) swine manure, (c) dairy manure, and their hydrochars; Figure S2: FTIR results of Poultry manure; Figure S3: FTIR results of Poultry manure hydrochar produced at 180 °C; Figure S4: FTIR results of Poultry manure hydrochar produced at 220 °C; Figure S5: FTIR results of Poultry manure hydrochar produced at 260 °C; Figure S6: FTIR results of Swine manure; Figure S7: FTIR results of Swine manure hydrochar produced at 180 °C; Figure S8: FTIR results of Swine manure hydrochar produced at 220 °C; Figure S9: FTIR results of Swine manure hydrochar produced at 260 °C; Figure S10: FTIR results of Dairy manure; Figure S11: FTIR results of Dairy manure hydrochar produced at 180 °C; Figure S12: FTIR results of Dairy manure hydrochar produced at 220 °C; Figure S13: FTIR results of Dairy manure hydrochar produced at 260 °C.

Author Contributions

Conceptualization, T.R. and B.D.; methodology, B.D.; validation, B.D. and T.R.; formal analysis, B.D.; investigation, B.D.; resources, S.K., A.S. and T.R.; data curation, B.D.; writing—original draft preparation, B.D.; writing—review and editing, T.R., A.S., S.K. and B.D.; visualization, B.D.; supervision, T.R.; project administration, S.K., A.S. and T.R.; funding acquisition, S.K., A.S. and T.R. All authors have read and agreed to the published version of the manuscript.

Funding

The material is based upon work partially supported by USDA-NIFA under Grant No. 232801.

Data Availability Statement

The original contributions presented in the study are included in the article and Supplementary Material, further inquiries can be directed to the corresponding author.

Acknowledgments

The authors would like to thank Ashish Manandhar and Amit Prasad Timilina for collecting and providing manure samples for this study. Ayden Weil and Swarna Saha are also acknowledged for their contributions during the experimental work of the study.

Conflicts of Interest

The authors declare no conflicts of interest.

References

  1. Pagliari, P.; Wilson, M.; He, Z. Animal Manure Production and Utilization: Impact of Modern Concentrated Animal Feeding Operations. Anim. Manure Prod. Charact. Environ. Concerns Manag. 2020, 67, 1–14. [Google Scholar]
  2. Qi, J.; Yang, H.; Wang, X.; Zhu, H.; Wang, Z.; Zhao, C.; Li, B.; Liu, Z. State-of-the-art on animal manure pollution control and resource utilization. J. Environ. Chem. Eng. 2023, 11, 110462. [Google Scholar] [CrossRef]
  3. Rayne, N.; Aula, L. Livestock Manure and the Impacts on Soil Health: A Review. Soil Syst. 2020, 4, 64. [Google Scholar] [CrossRef]
  4. Kumar, R.R.; Park, B.J.; Cho, J.Y. Application and environmental risks of livestock manure. J. Korean Soc. Appl. Biol. Chem. 2013, 56, 497–503. [Google Scholar] [CrossRef]
  5. Li, X.; Yan, T.; Yu, R.; Zhou, M. A review of karenia mikimotoi: Bloom events, physiology, toxicity and toxic mechanism. Harmful Algae 2019, 90, 101702. [Google Scholar] [CrossRef] [PubMed]
  6. Shakoor, A.; Shakoor, S.; Rehman, A.; Ashraf, F.; Abdullah, M.; Shahzad, S.M.; Farooq, T.H.; Ashraf, M.; Manzoor, M.A.; Altaf, M.M.; et al. Effect of animal manure, crop type, climate zone, and soil attributes on greenhouse gas emissions from agricultural soils—A global meta-analysis. J. Clean. Prod. 2021, 278, 124019. [Google Scholar] [CrossRef]
  7. Sharma, R.; Jasrotia, K.; Singh, N.; Ghosh, P.; Srivastava, S.; Sharma, N.R.; Singh, J.; Kanwar, R.; Kumar, A. A Comprehensive Review on Hydrothermal Carbonization of Biomass and its Applications. Chem. Afr. 2020, 3, 1–19. [Google Scholar] [CrossRef]
  8. Li, Q.; Zhang, S.; Gholizadeh, M.; Hu, X.; Yuan, X.; Sarkar, B.; Vithanage, M.; Masek, O.; Ok, Y.S. Co-hydrothermal carbonization of swine and chicken manure: Influence of cross-interaction on hydrochar and liquid characteristics. Sci. Total Environ. 2021, 786, 147381. [Google Scholar] [CrossRef]
  9. Khalaf, N.; Shi, W.; Fenton, O.; Kwapinski, W.; Leahy, J.J. Hydrothermal carbonization (HTC) of dairy waste: Effect of temperature and initial acidity on the composition and quality of solid and liquid products. Open Res. Eur. 2022, 2, 83. [Google Scholar] [CrossRef]
  10. Shettigondahalli Ekanthalu, V.; Morscheck, G.; Narra, S.; Nelles, M. Hydrothermal Carbonization—A Sustainable Approach to Deal with the Challenges in Sewage Sludge Management. In Urban Mining and Sustainable Waste Management; Ghosh, S.K., Ed.; Springer: Singapore, 2020; pp. 293–302. [Google Scholar]
  11. Motavaf, B.; Dean, R.A.; Nicolas, J.; Savage, P.E. Hydrothermal carbonization of simulated food waste for recovery of fatty acids and nutrients. Bioresour. Technol. 2021, 341, 125872. [Google Scholar] [CrossRef]
  12. Zhou, S.; Liang, H.; Han, L.; Huang, G.; Yang, Z. The influence of manure feedstock, slow pyrolysis, and hydrothermal temperature on manure thermochemical and combustion properties. Waste Manag. 2019, 88, 85–95. [Google Scholar] [CrossRef] [PubMed]
  13. Irshad, M.; Eneji, A.E.; Hussain, Z.; Ashraf, M. Chemical characterization of fresh and composted livestock manures. J. Soil Sci. Plant Nutr. 2013, 13, 115–121. [Google Scholar] [CrossRef]
  14. Toufiq Reza, M.; Freitas, A.; Yang, X.; Hiibel, S.; Lin, H.; Coronella, C.J. Hydrothermal carbonization (HTC) of cow manure: Carbon and nitrogen distributions in HTC products. Environ. Prog. Sustain. Energy 2016, 35, 1002–1011. [Google Scholar] [CrossRef]
  15. Ghanim, B.M.; Kwapinski, W.; Leahy, J.J. Speciation of Nutrients in Hydrochar Produced from Hydrothermal Carbonization of Poultry Litter under Different Treatment Conditions. ACS Sustain. Chem. Eng. 2018, 6, 11265–11272. [Google Scholar] [CrossRef]
  16. Xiong, J.-B.; Pan, Z.-Q.; Xiao, X.-F.; Huang, H.-J.; Lai, F.-Y.; Wang, J.-X.; Chen, S.-W. Study on the hydrothermal carbonization of swine manure: The effect of process parameters on the yield/properties of hydrochar and process water. J. Anal. Appl. Pyrolysis 2019, 144, 104692. [Google Scholar] [CrossRef]
  17. Mariuzza, D.; Lin, J.-C.; Volpe, M.; Fiori, L.; Ceylan, S.; Goldfarb, J.L. Impact of Co-Hydrothermal carbonization of animal and agricultural waste on hydrochars’ soil amendment and solid fuel properties. Biomass Bioenergy 2022, 157, 106329. [Google Scholar] [CrossRef]
  18. Belete, Y.Z.; Mau, V.; Yahav Spitzer, R.; Posmanik, R.; Jassby, D.; Iddya, A.; Kassem, N.; Tester, J.W.; Gross, A. Hydrothermal carbonization of anaerobic digestate and manure from a dairy farm on energy recovery and the fate of nutrients. Bioresour. Technol. 2021, 333, 125164. [Google Scholar] [CrossRef]
  19. Hejna, M.; Swiechowski, K.; Rasaq, W.A.; Bialowiec, A. Study on the Effect of Hydrothermal Carbonization Parameters on Fuel Properties of Chicken Manure Hydrochar. Materials 2022, 15, 5564. [Google Scholar] [CrossRef] [PubMed]
  20. Kantarli, I.C.; Kabadayi, A.; Ucar, S.; Yanik, J. Conversion of poultry wastes into energy feedstocks. Waste Manag. 2016, 56, 530–539. [Google Scholar] [CrossRef]
  21. Marin-Batista, J.D.; Villamil, J.A.; Qaramaleki, S.V.; Coronella, C.J.; Mohedano, A.F.; Rubia, M.A.d.l. Energy valorization of cow manure by hydrothermal carbonization and anaerobic digestion. Renew. Energy 2020, 160, 623–632. [Google Scholar] [CrossRef]
  22. Lang, Q.; Liu, Z.; Li, Y.; Xu, J.; Li, J.; Liu, B.; Sun, Q. Combustion characteristics, kinetic and thermodynamic analyses of hydrochars derived from hydrothermal carbonization of cattle manure. J. Environ. Chem. Eng. 2022, 10, 106938. [Google Scholar] [CrossRef]
  23. Song, C.; Yuan, W.; Shan, S.; Ma, Q.; Zhang, H.; Wang, X.; Niazi, N.K.; Wang, H. Changes of nutrients and potentially toxic elements during hydrothermal carbonization of pig manure. Chemosphere 2020, 243, 125331. [Google Scholar] [CrossRef] [PubMed]
  24. Xiong, J.; Chen, S.; Wang, J.; Wang, Y.; Fang, X.; Huang, H. Speciation of Main Nutrients (N/P/K) in Hydrochars Produced from the Hydrothermal Carbonization of Swine Manure under Different Reaction Temperatures. Materials 2021, 14, 4114. [Google Scholar] [CrossRef] [PubMed]
  25. Liu, Q.; Kong, G.; Zhang, G.; Cao, T.; Wang, K.; Zhang, X.; Han, L. Recent advances in hydrothermal liquefaction of manure wastes into value-added products. Energy Convers. Manag. 2023, 292, 117392. [Google Scholar] [CrossRef]
  26. CEN/TS 15414-1:2010; Solid recovered fuels - Determination of moisture content using the oven dry method. Part 1: Determination of total moisture by a reference method. European Committee for Standardization: Brussels, Belgium, 2010.
  27. Guo, S.; Dong, X.; Wu, T.; Zhu, C. Influence of reaction conditions and feedstock on hydrochar properties. Energy Convers. Manag. 2016, 123, 95–103. [Google Scholar] [CrossRef]
  28. Wang, R.; Lin, Z.; Meng, S.; Liu, S.; Zhao, Z.; Wang, C.; Yin, Q. Effect of lignocellulosic components on the hydrothermal carbonization reaction pathway and product properties of protein. Energy 2022, 259, 125063. [Google Scholar] [CrossRef]
  29. Sapkota Amy, R.; Lefferts Lisa, Y.; McKenzie, S.; Walker, P. What Do We Feed to Food-Production Animals? A Review of Animal Feed Ingredients and Their Potential Impacts on Human Health. Environ. Health Perspect. 2007, 115, 663–670. [Google Scholar] [CrossRef] [PubMed]
  30. Hoekman, S.K.; Broch, A.; Robbins, C. Hydrothermal carbonization (HTC) of lignocellulosic biomass. Energy Fuels 2011, 25, 1802–1810. [Google Scholar] [CrossRef]
  31. Sevilla, M.; Fuertes, A.B. The production of carbon materials by hydrothermal carbonization of cellulose. Carbon 2009, 47, 2281–2289. [Google Scholar] [CrossRef]
  32. Li, L.; Wang, Y.; Xu, J.; Flora, J.R.; Hoque, S.; Berge, N.D. Quantifying the sensitivity of feedstock properties and process conditions on hydrochar yield, carbon content, and energy content. Bioresour. Technol. 2018, 262, 284–293. [Google Scholar] [CrossRef]
  33. Kieseler, S.; Neubauer, Y.; Zobel, N. Ultimate and proximate correlations for estimating the higher heating value of hydrothermal solids. Energy Fuels 2013, 27, 908–918. [Google Scholar] [CrossRef]
  34. Sutton, A.; Applegate, T.; Hankins, S.; Hill, B.; Sholly, D.; Allee, G.; Greene, W.; Kohn, R.; Meyer, D.; Powers, W. Manipulation of Animal Diets to Affect Manure Production, Composition and Odors: State of the Science; American Society of Agricultural and Biological Engineers: St. Joseph, MI, USA, 2006. [Google Scholar]
  35. Trabue, S.L.; Kerr, B.J.; Scoggin, K.D. Swine diets impact manure characteristics and gas emissions: Part II sulfur source. Sci. Total Environ. 2019, 689, 1115–1124. [Google Scholar] [CrossRef] [PubMed]
  36. Ravber, M. Hydrothermal Degradation of Fats, Carbohydrates and Proteins in Sunflower Seeds after Treatment with Subcritical Water. Chem. Biochem. Eng. Q. 2015, 29, 351–355. [Google Scholar] [CrossRef]
  37. Liu, Z.; Zhao, L.; Yao, Z.; Jia, J.; Wang, Z.; Liu, Z. Behaviors and interactions during hydrothermal carbonization of protein, cellulose and lignin. Chem. Eng. J. 2023, 476, 146373. [Google Scholar] [CrossRef]
  38. Chen, Y.; Zhao, N.; Wu, Y.; Wu, K.; Wu, X.; Liu, J.; Yang, M. Distributions of organic compounds to the products from hydrothermal liquefaction of microalgae. Environ. Prog. Sustain. Energy 2017, 36, 259–268. [Google Scholar] [CrossRef]
  39. Wang, Z.; Zhai, Y.; Wang, T.; Peng, C.; Li, S.; Wang, B.; Liu, X.; Li, C. Effect of temperature on the sulfur fate during hydrothermal carbonization of sewage sludge. Environ. Pollut. 2020, 260, 114067. [Google Scholar] [CrossRef]
  40. Garlapalli, R.K.; Wirth, B.; Reza, M.T. Pyrolysis of hydrochar from digestate: Effect of hydrothermal carbonization and pyrolysis temperatures on pyrochar formation. Bioresour. Technol. 2016, 220, 168–174. [Google Scholar] [CrossRef] [PubMed]
  41. Aliyu, M.; Iwabuchi, K.; Itoh, T. Improvement of the fuel properties of dairy manure by increasing the biomass-to-water ratio in hydrothermal carbonization. PLoS ONE 2022, 17, e0269935. [Google Scholar] [CrossRef] [PubMed]
  42. Yurdakul, S.; Gurel, B.; Varol, M.; Gurbuz, H.; Kurtulus, K. Investigation on thermal degradation kinetics and mechanisms of chicken manure, lignite, and their blends by TGA. Environ. Sci. Pollut. Res. Int. 2021, 28, 63894–63904. [Google Scholar] [CrossRef]
  43. Aich, S.; Behera, D.; Nandi, B.K.; Bhattacharya, S. Relationship between proximate analysis parameters and combustion behaviour of high ash Indian coal. Int. J. Coal Sci. Technol. 2020, 7, 766–777. [Google Scholar] [CrossRef]
  44. Sharara, M.; Sadaka, S. Thermogravimetric Analysis of Swine Manure Solids Obtained from Farrowing, and Growing-Finishing Farms. J. Sustain. Bioenergy Syst. 2014, 04, 75–86. [Google Scholar] [CrossRef]
  45. Subramanian, A.; Prabhakar, V.; Rodriguez-Saona, L. Analytical Methods: Infrared Spectroscopy in Dairy Analysis. In Reference Module in Food Science; Elsevier: Amsterdam, The Netherlands, 2016. [Google Scholar] [CrossRef]
  46. Bekiaris, G.; Bruun, S.; Peltre, C.; Houot, S.; Jensen, L.S. FTIR–PAS: A powerful tool for characterising the chemical composition and predicting the labile C fraction of various organic waste products. Waste Manag. 2015, 39, 45–56. [Google Scholar] [CrossRef] [PubMed]
  47. Najafi-Ghiri, M.; Ghasemi-Fasaei, R.; Farrokhnejad, E. Factors Affecting Micronutrient Availability in Calcareous Soils of Southern Iran. Arid Land Res. Manag. 2013, 27, 203–215. [Google Scholar] [CrossRef]
  48. Chen, X.; Fan, X.; Gao, K.; Cheng, Y.; Zhang, K.; Liu, L.; Fang, L.; Park, J.-H.; Chen, X.; Xiao, R. Impacts of EDTA on the fate of nutrients and heavy metals during the hydrothermal carbonization of poultry manure. J. Environ. Chem. Eng. 2023, 11, 110061. [Google Scholar] [CrossRef]
  49. Xue, Y.; Bai, L.; Chi, M.; Xu, X.; Tai, L.; Chen, Z.; Yu, K.; Liu, Z. Co-hydrothermal carbonization of lignocellulose biomass and polyvinyl chloride: The migration and transformation of chlorine. Chem. Eng. J. 2022, 446, 137155. [Google Scholar] [CrossRef]
  50. Zhao, P.; Huang, N.; Li, J.; Cui, X. Fate of sodium and chlorine during the co-hydrothermal carbonization of high-alkali coal and polyvinyl chloride. Fuel Process. Technol. 2020, 199, 106277. [Google Scholar] [CrossRef]
  51. Zhao, Y.; Jia, G.; Shang, Y.; Zhao, P.; Cui, X.; Guo, Q. Chlorine migration during hydrothermal carbonization of recycled paper wastes and fuel performance of hydrochar. Process Saf. Environ. Prot. 2022, 158, 495–502. [Google Scholar] [CrossRef]
  52. Lange, R.; Staaland, H.; Mostad, A. The effect of salinity and temperature on solubility of oxygen and respiratory rate in oxygen-dependent marine invertebrates. J. Exp. Mar. Biol. Ecol. 1972, 9, 217–229. [Google Scholar] [CrossRef]
  53. Liu, J.-J.; Diao, Z.-H.; Xu, X.-R.; Xie, Q. Effects of dissolved oxygen, salinity, nitrogen and phosphorus on the release of heavy metals from coastal sediments. Sci. Total Environ. 2019, 666, 894–901. [Google Scholar] [CrossRef]
  54. Dai, L.; Tan, F.; Wu, B.; He, M.; Wang, W.; Tang, X.; Hu, Q.; Zhang, M. Immobilization of phosphorus in cow manure during hydrothermal carbonization. J. Environ. Manag. 2015, 157, 49–53. [Google Scholar] [CrossRef]
Figure 1. Thermogram of (a) poultry manure, (b) swine manure, (c) dairy manure, and their hydrochars.
Environments 11 00150 g001
Figure 2. SEM images (500×) of manures: (a) poultry manure, (b) swine manure, (c) dairy manure, and their corresponding hydrochars: (d) PM H260, (e) SM H260, and (f) DM H260.
Environments 11 00150 g002
Figure 3. FTIR results for (a) poultry manure, (b) swine manure, (c) dairy manure, and their hydrochars.
Environments 11 00150 g003
Figure 4. IC results for (a) poultry manure and its hydrochar, (b) process liquids from poultry manure after HTC, (c) swine manure and its hydrochar, (d) process liquids from swine manure after HTC, (e) dairy manure and its hydrochar, and (f) process liquids from dairy manure after HTC.
Environments 11 00150 g004
Table 1. Ash content, elemental composition, and mass yield of animal manures and their derived hydrochar and pH, D.O., and conductivity of corresponding process liquids.
Ultimate Analysis (Elemental Composition)Process Liquid Characteristics
Sample NameYield a
(%)
C
(%)
H
(%)
N
(%)
S
(%)
O b
(%)
Ash
(%)
pHCond. c
(mS/cm)
DO d
(mg/L)
PM Raw 35.97 ± 0.764.42 ± 0.166.17 ± 0.420.97 ± 0.0417.2 ± 3.7540.67 ± 0.06
PM H18032.12 ± 2.002.024.07 ± 0.393.57 ± 0.870.68 ± 0.059.15 ± 3.9645.85 ± 2.425.61 ± 0.3411.65 ± 0.059.16 ± 2.16
PM H22029.12 ± 0.9338.63 ± 0.524.27 ± 0.093.21 ± 0.121.24 ± 0.065.32 ± 5.2346.98 ± 3.767.11 ± 0.117.11 ± 0.118.66 ± 0.74
PM H26028.08 ± 0.4238.98 ± 0.363.71 ± 0.053.13 ± 0.171.33 ± 0.064.95 ± 1.0348.25 ± 0.097.63 ± 0.037.62 ± 0.037.64 ± 0.61
SM Raw 34.97 ± 1.234.41 ± 0.233.69 ± 0.191.86 ± 0.0714.4 ± 2.5240.67 ± 0.06
SM H18065.90 ± 2.4439.05 ± 0.685.56 ± 0.063.56 ± 0.431.66 ± 0.0418.49 ± 3.8931.68 ± 1.547.95 ± 0.198.04 ± 0.066.02 ± 0.58
SM H22054.07 ± 0.7739.13 ± 0.415.08 ± 0.173.18 ± 0.081.78 ± 0.0716.42 ± 3.4634.41 ± 1.547.58 ± 0.187.63 ± 0.255.04 ± 0.72
SM H26053.02 ± 1.9440.05 ± 0.574.43 ± 0.413.02 ± 0.051.67 ± 0.0911.56 ± 3.9342.21 ± 1.667.57 ± 0.377.81 ± 0.144.60 ± 0.27
DM Raw 36.3 ± 0.335.78 ± 0.442.64 ± 0.060.98 ± 0.0312.8 ± 1.4041.5 ± 0.13
DM H18046.08 ± 1.4439.52 ± 1.995.04 ± 0.222.13 ± 0.061.25 ± 0.1421.02 ± 6.0135.04 ± 1.846.51 ± 0.116.54 ± 0.166.93 ± 1.17
DM H22033.59 ± 0.4537.51 ± 0.594.17 ± 0.362.31 ± 0.091.24 ± 0.0312.2 ± 3.4842.57 ± 1.395.89 ± 0.045.89 ± 0.045.63 ± 2.39
DM H26028.52 ± 1.5636.26 ± 1.313.99 ± 0.082.42 ± 0.051.19 ± 0.063.77 ± 4.1648.37 ± 1.445.77 ± 0.085.77 ± 0.084.93 ± 0.29
a yield (wt.%) = (hydrochar weight/dry raw material weight) × 100%. b by difference: O (wt.%) = 100 − C (wt.%) − H (wt.%) − N (wt.%) − S (wt.%) − ash (wt.%). c Cond. = conductivity. d DO = dissolved oxygen.
Table 2. Elemental analysis of manures and their hydrochar surfaces by SEM-EDX.
Sample NameNa
(%)
Mg
(%)
P
(%)
S
(%)
Cl
(%)
K
(%)
Ca
(%)
Mn
(%)
Fe
(%)
Zn
(%)
Cu
(%)
PM Raw1.57 ±0.171.59 ± 0.146.07 ± 0.056.6 ± 0.072.43 ± 0.117.25 ± 0.759.57 ± 0.04ND *ND *ND *ND *
PM H180ND *0.95 ± 0.1110.95 ± 0.060.65 ± 0.73ND *0.21 ± 0.5324.06 ± 0.030.13 ± 0.210.22 ± 0.120.11 ± 0.09ND *
PM H220ND *2.54 ± 0.114.89 ± 0.060.9 ± 0.09ND *0.22 ± 0.1510.3 ± 0.030.3 ± 0.240.34 ± 0.120.44 ± 0.05ND *
PM H260ND *1.25 ± 0.1012.94 ± 0.060.46 ± 0.08ND *0.34 ± 0.0930.22 ± 0.030.63 ± 0.070.69 ± 0.060.48 ± 0.05ND *
SM Raw10.38 ± 0.95.56 ± 0.087.58 ± 0.052.51 ± 0.052.81 ± 0.057.97 ± 0.063.68 ± 0.04ND *ND *ND *ND *
SM H1801.53 ± 0.129.01 ± 0.0910.91 ± 0.063.5 ± 0.061.06 ± 0.043.05 ± 0.045.71 ± 0.030.21 ± 0.190.77 ± 0.050.68 ± 0.030.33 ± 0.11
SM H2201.2 ± 0.155.25 ± 0.095.73 ± 0.063.9 ± 0.060.07 ± 0.052.81 ± 0.043.44 ± 0.040.27 ± 0.160.75 ± 0.080.53 ± 0.290.62 ± 0.39
SM H2600.17 ± 0.348.54 ± 0.0912.23 ± 0.062.5 ± 0.07ND *0.49 ± 0.072.61 ± 0.030.67 ± 0.061.7 ± 0.031.35 ± 0.041.04 ± 0.05
DM Raw8.24 ± 0.098.23 ± 0.082.54 ± 0.057.35 ± 0.040.71 ± 0.114.15 ± 0.0410.32 ± 0.03ND *ND *ND *ND *
DM H1802.57 ± 0.122.47 ± 0.102.72 ± 0.071.92 ± 0.060.35 ± 0.131.47 ± 0.056.95 ± 0.03ND *2.19 ± 0.03ND *ND *
DM H220ND *4.28 ± 0.093.9 ± 0.072.24 ± 0.06ND *0.98 ±0.059.53 ± 0.03ND *3.06 ± 0.030.67 ± 0.04ND *
DM H260ND *5.94 ± 0.094.84 ± 0.072.11 ± 0.07ND *0.82 ± 0.068.67 ± 0.03ND *2.96 ± 0.020.46 ± 0.040.53 ± 0.39
* ND = not detected.
Disclaimer/Publisher’s Note: The statements, opinions and data contained in all publications are solely those of the individual author(s) and contributor(s) and not of MDPI and/or the editor(s). MDPI and/or the editor(s) disclaim responsibility for any injury to people or property resulting from any ideas, methods, instructions or products referred to in the content.

