Article

Ecological Shifts: Plant Establishment in an Animal-Based Ecosystem

1
Department of Biology, University of Central Florida, 4000 Central Florida Blvd., Orlando, FL 32816, USA
2
School of Marine and Atmospheric Sciences, Stony Brook University, 145 Endeavour, Stony Brook, NY 11790, USA
*
Author to whom correspondence should be addressed.
Environments 2024, 11(9), 193; https://doi.org/10.3390/environments11090193
Submission received: 5 July 2024 / Revised: 25 August 2024 / Accepted: 6 September 2024 / Published: 8 September 2024

Abstract

:
Shifts from saltmarsh to mangroves are well-documented at mangrove poleward boundaries. A regime shift from intertidal oyster (Crassostrea virginica) reefs to mangrove islands has recently been documented in transitional phases in Florida, USA. To understand the local drivers of an oyster/mangrove regime shift and potential tipping points leading to a permanent mangrove state, we tracked all mangrove propagules (n = 1681) across 15 intertidal oyster reefs with or without adult mangroves for 15 months in Mosquito Lagoon, FL. While no propagule bottleneck was observed, few (3.2%) mangrove propagules/seedlings survived on reefs with no prior encroachment, compared to 11.3% and 16.1% on reefs with established older (pre-1943) or newer (1943 to present) adult mangrove stands, respectively. In total, 90.6% of the arriving propagules were from the red mangrove Rhizophora mangle; 13.2% of these were alive at the end of this study. Survival was <1% for black (Avicenna germinans) and 0% for white (Laguncularia racemosa) mangroves. Factors that promoted red mangrove success included close proximity (≤0.3 m) to adult mangroves, especially black mangroves; partial, upright burial of propagules in sediment; and arrival on reefs after annual high-water season. Additionally, once reefs had 50% mangrove cover, the density of red mangrove seedlings increased from 0.04 to 0.46 individuals m−2. Although climate change has alleviated the impact of extreme freezes on mangroves, local factors determine whether the regime shift will be complete and permanent; positive feedback loops associated with established mangroves suggest mangrove recruitment on intertidal oyster reefs will continue to increase.

1. Introduction

Regime shifts are persistent changes in ecosystems that frequently alter ecosystem functions and services. These shifts rarely occur as a result of a single environmental change, generally requiring interactions of multi-scale factors, e.g., [1,2]. For example, Caribbean coral reefs shifted to algal-dominated systems after rapid loss of herbivores, e.g., [3], but many local factors, including nutrient enrichment, overfishing, diseases, warming ocean temperatures, and acidification, laid the groundwork for the shift to be persistent [4,5,6,7]. Positive feedback loops are required to entrench the new ecosystem and prevent a shift back to the original state [5,8]. On Caribbean coral reefs, the abundances of sea urchins and herbivorous fishes have rebounded in some locations, but many reefs remain algal-dominated due in part to eutrophication of surrounding waters, storm events, algal chemistry, novel coral diseases, and coral bleaching, e.g., [8,9]. In other systems, such as some kelp forests, positive feedback loops do not occur, and ecosystem dominance continually shifts between kelp and urchin domination [10,11].
In recent decades, a regime shift has begun to occur worldwide with herbaceous saltmarshes transitioning to mangrove-dominated ecosystems at mangrove-poleward limits as global temperatures increase, e.g., [12,13,14,15]. Tropical mangrove species are spatially limited by extreme freeze events that can kill or stunt a tree’s growth [12,16,17,18]. As mangrove-killing freezes decrease in frequency and extent with climate change, multiple mangrove species are expanding poleward and outcompeting flora in saltmarshes traditionally dominated by grasses, such as the saltmarsh cordgrass Sporobolus alterniflorus, e.g., [13,19]. Saltmarsh flora may contribute to this shift by acting as nurseries, trapping mangrove propagules, providing structural support and suitable temperatures plus soil characteristics for mangrove establishment [20,21,22,23]. While both mangroves and S. alterniflorus are foundational species and provide many similar ecosystem services, mangroves often outcompete S. alterniflorus via shading and greater tolerance to stresses, such as drought [24,25,26]. Mangroves recruiting to saltmarshes are, however, subject to nutrient competition with saltmarsh flora; S. alterniflorus can reduce the availability of nitrogen, inhibiting mangrove growth. Moreover, mangroves are subject to herbivory from saltmarsh fauna, which can reduce seedling survival [27].
Along coastlines in the southeastern USA, the change in dominance between saltmarsh and mangroves due to the lack of local occurrences of hard freezes has been well-documented, e.g., [13,28]. In these same areas, a regime shift from intertidal oyster reefs to mangrove islands has been found in transitional phases along the east and west coasts of Florida [29,30]. While a similar shift was documented to have occurred in south Florida approximately 10,000 years ago [31], this shift has not previously been observed in modern times and could drastically change the associated fauna and ecosystem services of foundational oyster reef and mangrove island habitats.
The transition from an intertidal oyster reef to a mangrove island is, at least in part, associated with tropicalization [29], which is focused on the increase in minimum winter temperatures [32]. Black mangroves have a thermal threshold for survival of −6.6 °C [16,18], while red mangroves have a minimum survival tolerance of −4.0 °C [12]. Both species have been increasing in numbers on intertidal oyster reefs in Mosquito Lagoon (east coast of central Florida) at a rate of 6% per year since 1984 [29] (Figure 1). By combining field observations with historic aerial photographs, it was determined that the black mangrove A. germinans was likely the first mangrove species to become established on these intertidal oyster reefs in recent times, but red mangroves are responsible for more recent increases [29]. The year 1989 was the most recent year when temperatures dropped below the thermal tolerance for both species, while 1995 was the most recent year with temperatures below −4.0 °C [29].
Unlike saltmarsh to mangroves shifts, where the tidal range and soil profiles are similar for both taxa, mangrove establishment on oyster reefs is predicted to be more difficult to initiate and maintain as elevations are generally lower, inundation occurs daily, and soils are dominated by oyster shell [33]. The ability for mangroves to colonize and convert intertidal oyster reefs into mangrove islands most likely will be induced not only by broad-scale factors such as temperature and precipitation, but also by local factors including hydrology, oyster reef conditions (e.g., density, shell heights), nutrient availability, the presence of “mangrove nurseries”, and sediment dynamics [34]. Mosquito Lagoon has seen an almost 200% increase in mangrove coverage on oyster reefs since 1943 [29]; however, there are still hundreds of reefs that remain free of mangroves. Temperatures in the region have been above the mortality threshold for both red and black mangroves since 1995, and adjacent shoreline vegetation dominance has shifted from saltmarsh to mangrove [35], suggesting other localized factors are playing a role in the facilitation or deterrence of a regime shift from oyster reefs to mangrove islands.
We focus here on the arrival and early establishment of mangroves on intertidal oyster reefs as this is an essential first step for a regime shift. To understand if oyster reefs facilitate mangrove colonization, we tracked the arrival, retention, growth to seedlings, and survival of mangrove seedlings on 15 oyster reefs monthly for 15 months in Mosquito Lagoon. Reef types included (1) those with older (pre-1943) or (2) newer (1943 to present) adult mangrove stands and (3) reefs with no mangroves growing on them. The year 1943 was used as a baseline as that was the first year that aerial imagery of the region was available. We asked which abiotic and biotic variables determined the survival and growth of seedlings. Combined, these data will enable us to help resource managers and restoration practitioners develop scientifically based plans for long-term conservation of both oyster reefs and mangrove stands in locations where they co-occur.

2. Materials and Methods
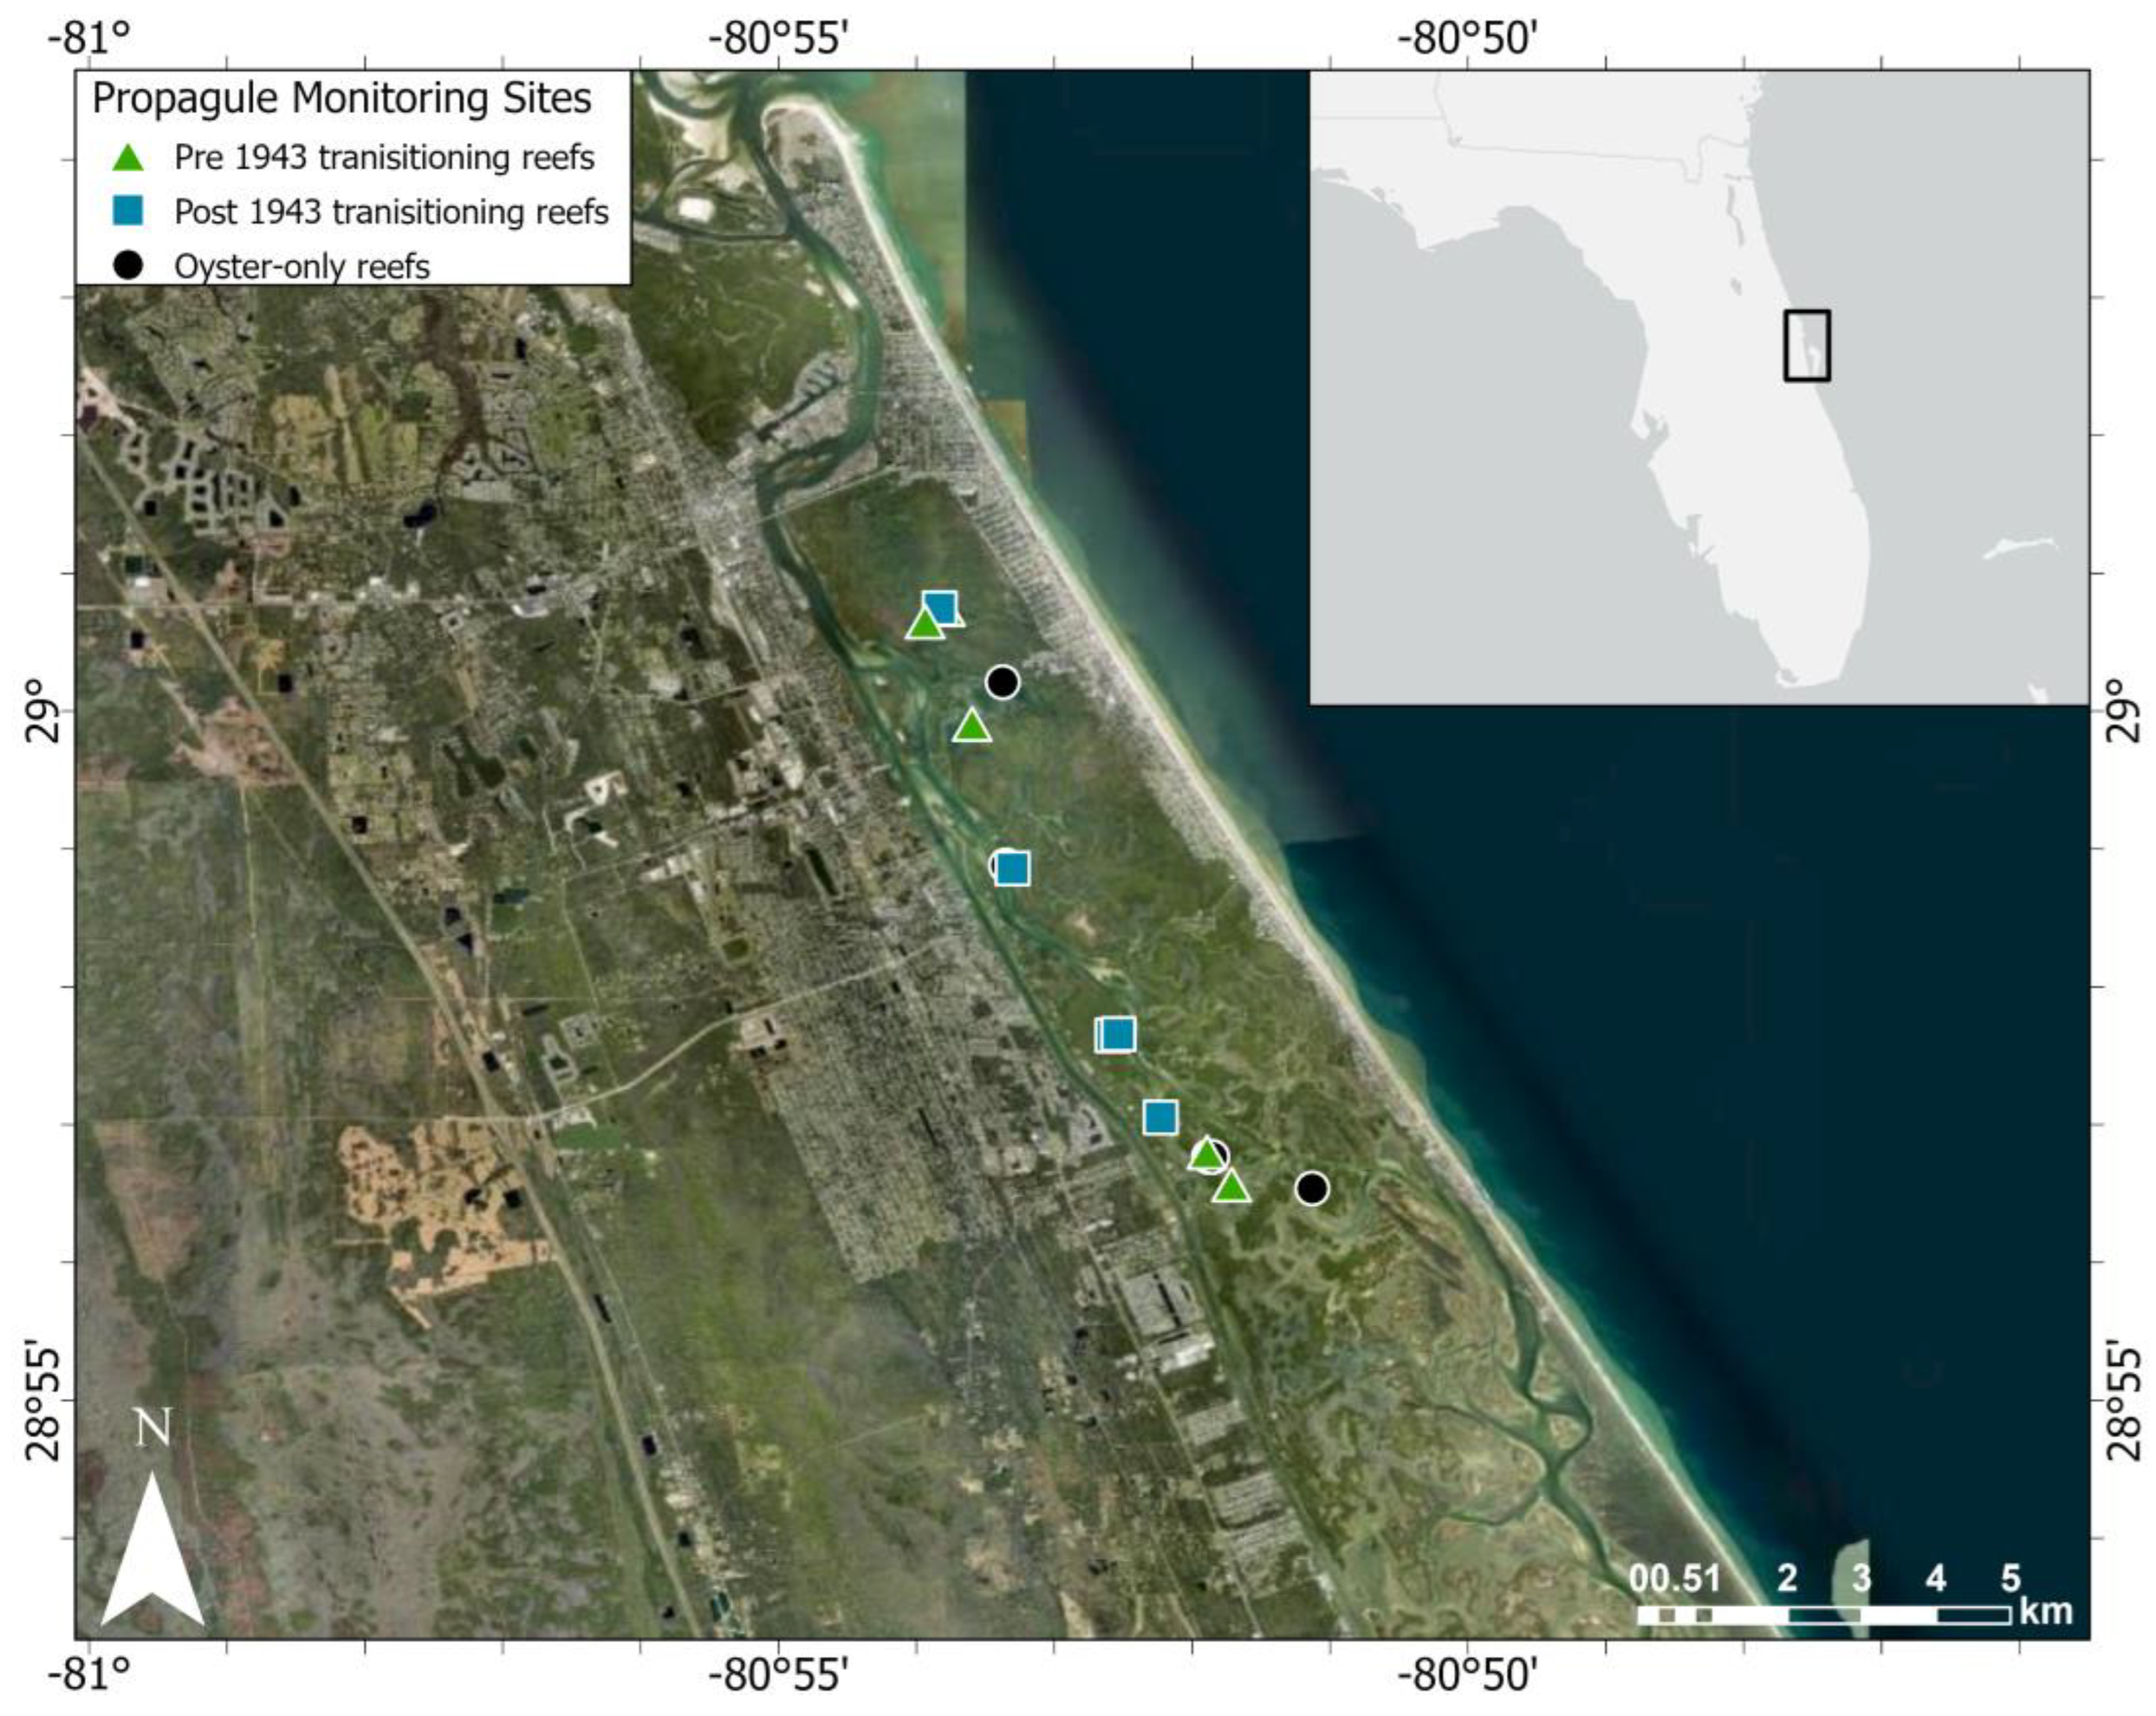
2.1. Study Site

Observational data were collected from September 2020 through December 2021 in Mosquito Lagoon, a salt marsh-mangrove ecotone located in the northernmost portion of the Indian River Lagoon (IRL) system, Florida, USA (Figure 2). The IRL is one of the largest and most biologically diverse estuaries in the USA, extending 251 km along the east coast of central Florida. Mosquito Lagoon is a shallow (average water depth: ~1.7 m), wind-driven, microtidal (range: 1 cm–1 m, ~25 cm in intertidal oyster region) estuary characterized by high salinity (range: 22.6–45.2 ppt) with no freshwater inputs other than local precipitation [36,37]. Water residence time and nutrient loadings in this lagoon are both high [38,39]. An annual high-water season occurs each fall and coincides with Florida’s hurricane season [40]. During the high-water season, intertidal oyster reefs become subtidal reefs.
The eastern oyster Crassostrea virginica is a protandric hermaphrodite with synchronized spawning and external fertilization that occurs in Florida waters when temperatures exceed 26 °C and salinity exceeds 5–6 ppt [41]. Intertidal reefs of C. virginica in Mosquito Lagoon promote biodiversity of invertebrates and vertebrates [42,43,44]; protect shorelines from wave energy and erosion [45,46]; sequester nutrients, e.g., [33,47,48]; and filter suspended particles from the water including microplastics [49]. In this region, adult mangroves provide many similar estuarine ecosystem services as the oysters, i.e., promote biodiversity, enhance fisheries, dissipate hydrodynamic forces, and store carbon [50,51,52,53,54].

2.2. Reefs of the Eastern Oyster Crassostrea virginica in Mosquito Lagoon

Benson et al. [55] documented 3244 intertidal oyster reefs (26 hectares), primarily patch reefs, in Mosquito Lagoon waters using 2021 aerial photographs. Garvis et al. [56] reported that 24% of oyster coverage was lost between 1943 and 2009. This value increased to 62.9% by 2021 [55]. Losses were primarily the result of intensive boating activity eroding live oyster clusters from seaward reef edges along popular boating channels, wind wakes, and reef fragmentation [55]. Community-based oyster reef restoration efforts have been underway since 2007 to reverse wake-induced losses [37,55]. Post-restoration, it took 8 years for reefs to reach a density that stayed statistically similar over time; oyster density on these restored reefs ranged from 922 to 1053 individuals m−2 [37]. Oyster density on nearby reference (natural) reefs was much more variable and ranged from 112 to 795 oysters m−2 [37]. Shell heights of individual oysters averaged 37.1 mm with a range of 2–110 mm [37].

2.3. Mosquito Lagoon Mangroves

Three native species of mangroves occur along Mosquito Lagoon’s shorelines: the red mangrove Rhizophora mangle, the black mangrove Avicennia germinans, and the white mangrove Laguncularia racemosa [57]. All disperse long distances via hydrochory and recruit once washed up on shorelines. Based on their biology, white and black mangroves are considered “pioneer species”, while red mangroves are described as “opportunistic gap species” [58]. Mature propagules of all three species are released annually between August and November in Mosquito Lagoon, with the propagule drop window shortened by strong winds (LJW, personal observation). While both adult and juvenile red and black mangroves have been documented on intertidal oyster reefs in Mosquito Lagoon, no white mangroves (L. racemosa) have been found on reefs to date [29]. Red mangroves dominate the study region and occupy shoreline elevations ranging from +0.06 to +0.49 m, with the bases of the plants being flooded ~30% of each day [59]. With red mangroves, frequent periods of inundation can deplete the stored oxygen, negatively impacting survival, especially for seedlings [60,61,62]. Much regional information has been learned about young red mangrove survival as this species is used extensively for “living shoreline” stabilization [57]. Fillyaw et al. [57] found that 90.7% of red mangrove seedlings deployed for Mosquito Lagoon shoreline stabilization died as a result of flooding stress and wave energy, as seedlings (mean height: 42.7 cm) were partially to fully submerged for 2 months during high-water season. When taller mangroves were deployed, it increased the chances of survival by 1087% [57]. More specifically, survival chances increased by 3.5% for every cm of height and 26.3% for every anchored prop root [57]. For clarity, we will refer to the three mangrove species by their common names for the remainder of this article.

2.4. Tracking Propagule Recruitment

We tracked propagule survival and growth on three categories of intertidal oyster reef that have not fully transitioned into mangrove islands: (1) reefs with adult mangroves present in 1943 that continue to have mangroves and oysters (older transitioning reefs), (2) reefs with adult mangroves that arrived after 1943 and before 2017 (newer transitioning reefs), and (3) reefs with no adult mangroves in 2020 (oyster-only reefs). These categories were selected to complement the categories used to track mangrove encroachment in McClenachan et al. [29]. McClenachan et al. [29] began data collection with 1943 images, when aerial photography commenced in the IRL. Using the GIS mapped layer of oyster reefs in Mosquito Lagoon [63], 15 intertidal oyster reefs (n = 5 per reef type) were randomly selected for tracking using random.org.
Observational data collection began during the first week of September 2020. This was recorded as time 0. Each month for the next 12 months, all newly arrived, visible, live mangrove propagules (all species) were observed in situ at low tide and tagged for monitoring. Numbered, plastic tags (42 × 27 mm, BessonTM, Besson, Noidans-les-Vesoul, France) were attached to an adjacent oyster cluster or adjacent adult mangrove branch with cable ties (length: 19 cm, tensile strength: 23 kg) so as to not interfere with propagules. The distance and compass direction from the tag to propagule were recorded to enable tracking. Because we focused on propagules that could expand mangrove establishment, we only collected propagule data on individuals that extended up to 1 m into these dense stands.
Data collection for each mangrove propagule began on the date first observed and continued on all subsequent dates observed until missing or when the project ended at month 15 (December 2021). Monthly data collection included the following: length of visible propagule; orientation of the propagule categorized into one of three categories (upright and partially buried in sediment, lying flat on top of bare sediment, or lying flat on top of oyster clusters or pneumatophores with no sediment contact); number of leaves; contact with live oysters; distance to closest reproductive mangrove (excluding oyster-only reefs); distance to closest mangrove stand (excluding oyster-only reefs); and distance to closest reef edge.
To account for the height of the buried portion of red mangrove propagules, on 10 additional nearby reefs, we haphazardly extracted a total of 100 propagules partially buried in the sediment and recorded their burial depths. The mean propagule burial depth value of 50.0 ± 2.0 mm (mean ± S.E., range: 5–160 mm) was added to the length of all partially buried red mangroves to facilitate more accurate length comparisons among treatments.

2.5. Oyster Reef Metrics

Universal metrics were used to determine oyster densities, mean shell heights, and canopy heights among all reefs used for natural and assisted recruitment trials [63]. Five replicate quadrats (0.25 m−2) were haphazardly deployed on each reef at low tide when the intertidal reefs were completely exposed [37]. In each quadrat, starting from the upper right corner, the shell heights of the first 50 encountered live oysters were measured with calipers or a ruler (mm). Density data were collected by counting all live oysters within each quadrat, while canopy height was recorded by measuring from the sediment interface to the highest point on an oyster at 10 random points for 10 additional haphazardly selected 0.25 m−2 quadrats per reef [37].

2.6. Temperature, Water Level, and Salinity Data

We acquired air temperature data for 1 September 2020 through 31 December 2021 from the Florida Climate Center for the station in Titusville, Florida (https://climatecenter.fsu.edu/climate-data-access-tools/downloadable-data, accessed on 10 January 2024), located approximately 40 km south of our study area (28°37′ N, 80°48′ W). This was the closest station available with continuous data during our study, collecting data every hour. We extracted the minimum temperature for each day to detect any periods of time that the temperature dropped below the threshold for black (−6.6 °C) or red (−4.0 °C) mangrove survival [12,16,17].
Water level data for Mosquito Lagoon were acquired from the USGS Haulover Canal site from September 2020 through December 2021 [41]. This site (#02248380) provides the only available, continuous water gauge data for Mosquito Lagoon. Salinity in Mosquito Lagoon is high (30–35 ppt) and stable from year to year [64]. The oyster and mangrove species included in this study have wide salinity tolerances; therefore, salinity fluctuations were not considered to be a potential driver in the ecosystem shift from intertidal oyster reefs to mangrove islands [65,66].

2.7. Statistical Analyses for Mangrove Recruitment and Success

ANCOVAs with Tukey HSD post hoc tests and Student’s t-tests were used to determine differences among reef categories, mangrove species, and distance from adult mangrove for the natural recruitment data. All assumptions of ANOVA were met. To best explain growth changes over time and to account for propagule release dates, we considered propagules that arrived from September–November 2020 as arrival cohort 1, December 2020–May 2021 as arrival cohort 2, and June–September 2021 as arrival cohort 3. Arrival cohorts 1 and 2 encompass propagules from the fall 2020 drop season; propagules are separated by those that landed before or during (cohort 1) or after (cohort 2) the annual high-water season. Cohort 3 focused on 2021 propagules.
Using the lme4 package [67] in R, a generalized linear mixed effects model (GLMM) with a binomial family and reefs as random effect was used to determine the significant variables in predicting mangrove propagule survival at month 15 (end of study). This was done for all data (n = 1681 propagules) and the subset of data that included only red mangrove propagules (n = 1523). The same analysis was not done separately for black mangroves as there were not enough propagules that survived to make any significant conclusions.
Next, a classification decision tree based on red mangrove survival (yes/no) at month 15 was built using the rpart function in R. We chose to use a decision tree in order to capture nonlinear relationships and easily extract rules for survival, which could then be used in further analyses. After shuffling the data, an 80/20 split of training/test data was used to predict survival of red mangrove propagules in the decision tree based on the significant variables. The tree was pruned using the complexity parameter. We elected to only use red mangroves for the decision tree as there was only one naturally recruited black mangrove alive at month 15. In addition, no white mangroves were present. A log-rank test in the survival package in R [68] was used to compare survival curves for reef mangroves between reef types and whether the propagule landed far or close (≤0.3 m, rule extracted from the decision tree analysis) from the nearest adult mangrove for the total data as well as for each of the arrival cohorts. R (v4.3.2) within RStudio (v4.1.2) was used for all analyses [69,70].

3. Results

3.1. Temperature Data and Water Levels

The lowest temperature recorded during our study period was 1.7 °C, measured 4–5 February 2021. Thus, there were no days that dropped below the survival threshold for red (−4.0 °C) or black (−6.6 °C) mangroves between September 2020 and December 2021. Using the USGS [40] water level data, values in the region were above 0.46 m (i.e., high water) from 16 September to 25 November 2020 and from 23 September to 18 November in 2021. Intertidal oysters and mangrove propagules that landed on reefs were submerged continuously during the high-water season (LJW, personal observation). For the remainder of the calendar year, the water level for this gauge hovered around 0 m at low tide.

3.2. Mangrove versus Oyster Areas on Oyster Reefs

Adult mangrove stands on intertidal reefs ranged in surface coverage area from 3 to 408 square m, while individual oyster reef surface areas ranged from 44 to 1386 square m. There was no pattern associated with reef type (i.e., older transitioning reefs, newer transitioning reefs, oyster-only reefs) versus reef area (one-way ANOVA: p = 0.17). Mean mangrove stand area and mangrove:oyster reef area did vary with reef type (one-way ANOVA: p = 0.05, 0.02, respectively). Specifically, reefs that had mangroves in 1943 (older transitioning reefs) averaged 46% of area covered by mangroves, while reefs that were encroached between 1943 and 2017 (newer transitioning reefs) had 29% mangrove cover. Oyster-only reefs had 0% mangrove cover.

3.3. Oyster Densities on Reefs

All arriving mangroves were in contact with live oysters, and all partially buried red mangroves were oriented in an upright position. Oyster densities ranged from 332 to 728 live oysters m−2, with a mean (±S.D.) of 582.4 ± 116.8 m−2. No reefs were located along primary boating channels, and no harvesting was witnessed or evident on any study reef (i.e., overturned clusters). Mean shell height (±S.D.) was 41.9 ± 18.1 mm (range: 3–114 mm), suggesting both spat and reproductive oysters were present on all reefs. Canopy height decreased with distance from the closest inlet [47], with an overall mean (±S.D.) of 84.3 ± 38.9 mm above the sediment surface (range: 9–309 mm).

3.4. Natural Recruitment of Propagules

In total, 1943 propagule tags were deployed, and 1681 (86.6%) of these tags were retrieved by the end of the study. Only propagules associated with retrieved tags were used in our analyses. Of the 1681 total propagules that landed on any of the three reef types, 90.6% (1523) were red mangroves (Table 1).
Only one black mangrove individual (0.6%) survived; it was first observed in April 2021 with 2 leaves. This individual had 5 leaves (stem height: 260 cm) 8 months later. The one observed white mangrove propagule (30 mm long) arrived in October 2020, produced initial leaves by early December, but was no longer present in February 2021.
Mangrove propagule arrival was tracked for 12 months plus retention/growth of surviving propagules for 3 additional months (total = 15 months). Red mangrove propagules arrived on reefs during every month of the year except May, with most arrivals occurring August through December (72.5%). Black mangroves had a narrower window of propagule arrival, with 69.4% of propagules first observed on intertidal reefs in December of 2020. The majority of the remaining black mangrove propagules arrived in January (12.7%) or February (10.2%); all arrivals occurred after high-water season ended.
Reef type and distance to the closest adult mangrove were confounding variables, so only one variable was used in the survival GLM, depending on the analysis performed. When assessing differences among all reef types, distance to mangrove was removed. When quantifying the impact of adult mangroves on survival of propagules, distance to the closest adult mangrove was used, and the oyster-only reefs were removed from the analysis. The most significant variables in the model predicting red mangrove survival were arrival date, distance to closest adult mangrove, closest adult mangrove species, placement relative to sediment (above sediment, laying directly on sediment, or partially buried), and mean oyster shell height (all: p < 0.01). The decision tree yielded 89% accuracy. The most important predictors of red mangrove propagule success in order of importance were as follows: 1. Distance to closest adult mangrove tree was ≤0.3 m; 2. Arrival month was between December 2020 and April 2021 or after September 2021; and 3. The propagule was partially buried in the sediment in an upright position.
Timing of initial leaf production for red mangrove propagules was highly variable. Initial leafing of propagules from arrival cohort 1 (i.e., propagules arriving September–November 2020) occurred in all 15 months of this project (October 2020–December 2021). Of the 168 propagules in cohort 1 that produced leaves, December (19.6%) and April through July (44.0%) were the primary times that initial leafing occurred. Not all cohort 1 seedlings that leafed out survived through December 2021; however, nearly half of the cohort with leaves (42.9%) were alive at month 15. Moreover, 30 propagules from cohort 1 remained alive (turgid, green color) but had no leaves in December 2021. These results provide evidence that this species can remain alive but delay initial leafing for long periods of time. No seedlings from any cohort produced flowers or prop roots during the 15 months. Black mangrove propagules were only observed in cohort 2 (i.e., propagules arriving December 2020–May 2021); 23 individuals leafed out in 1 to 8 months, with most initial leafing occurring within 3 months of arrival.

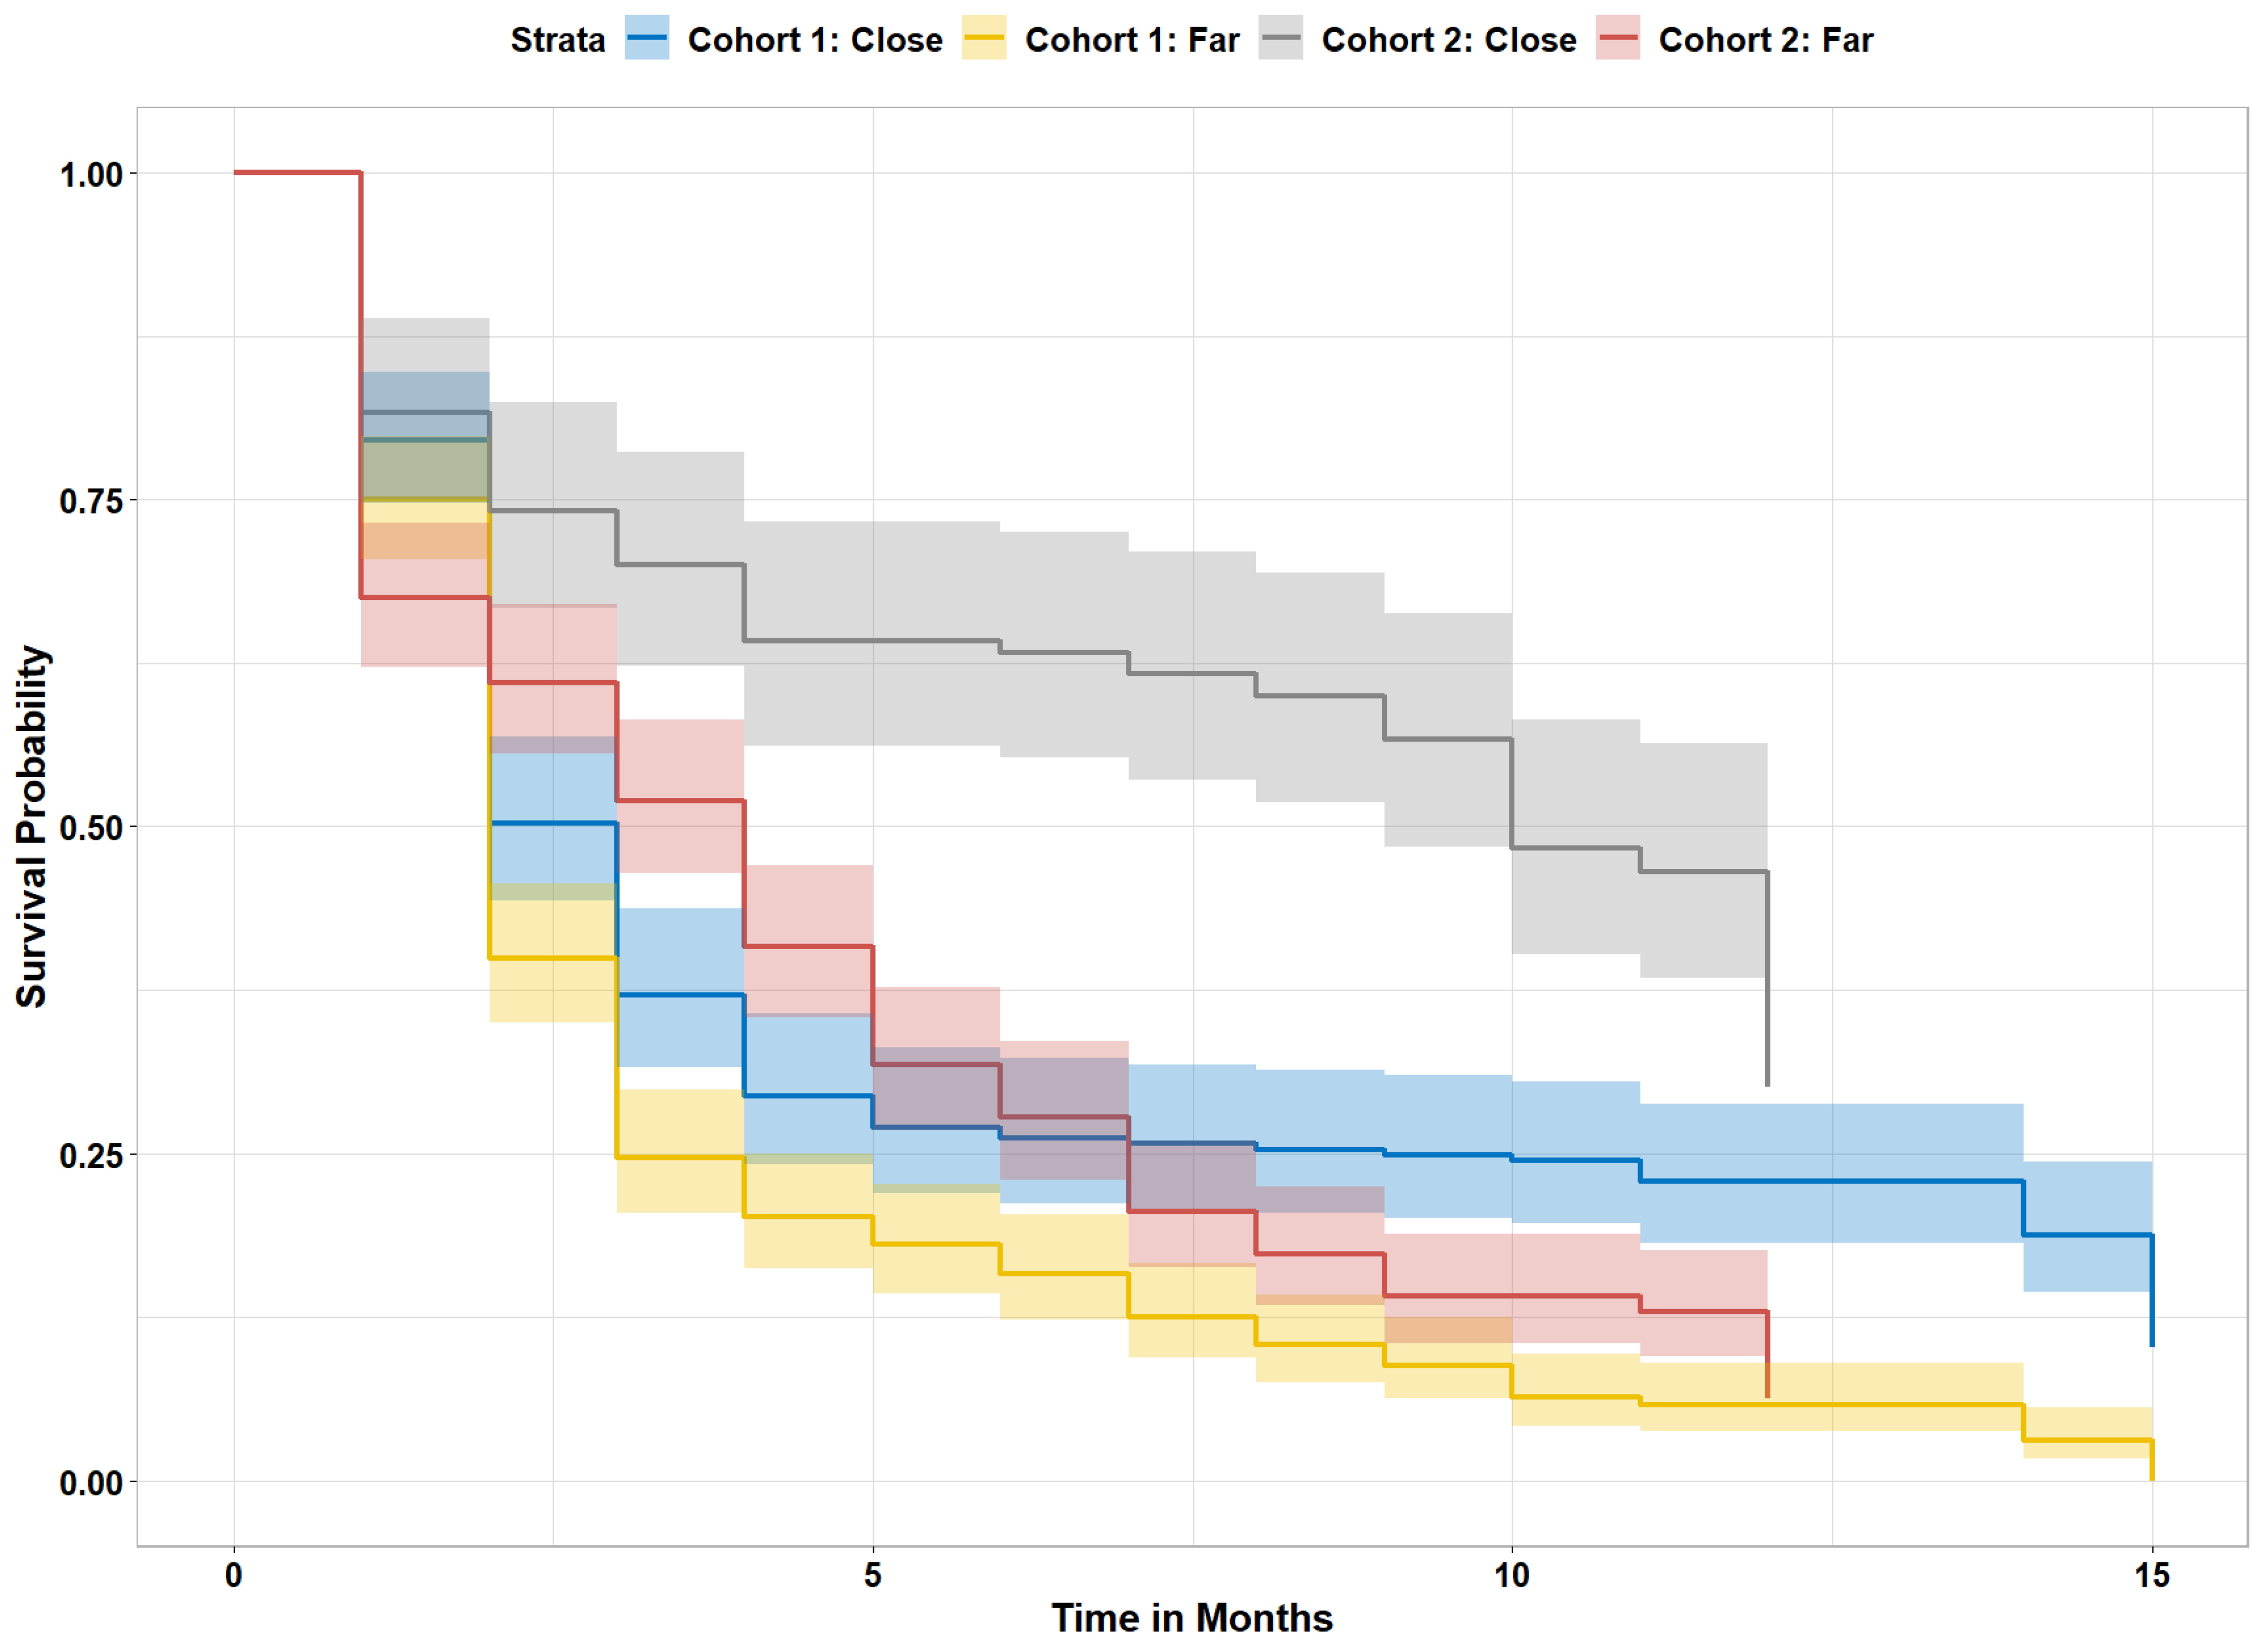
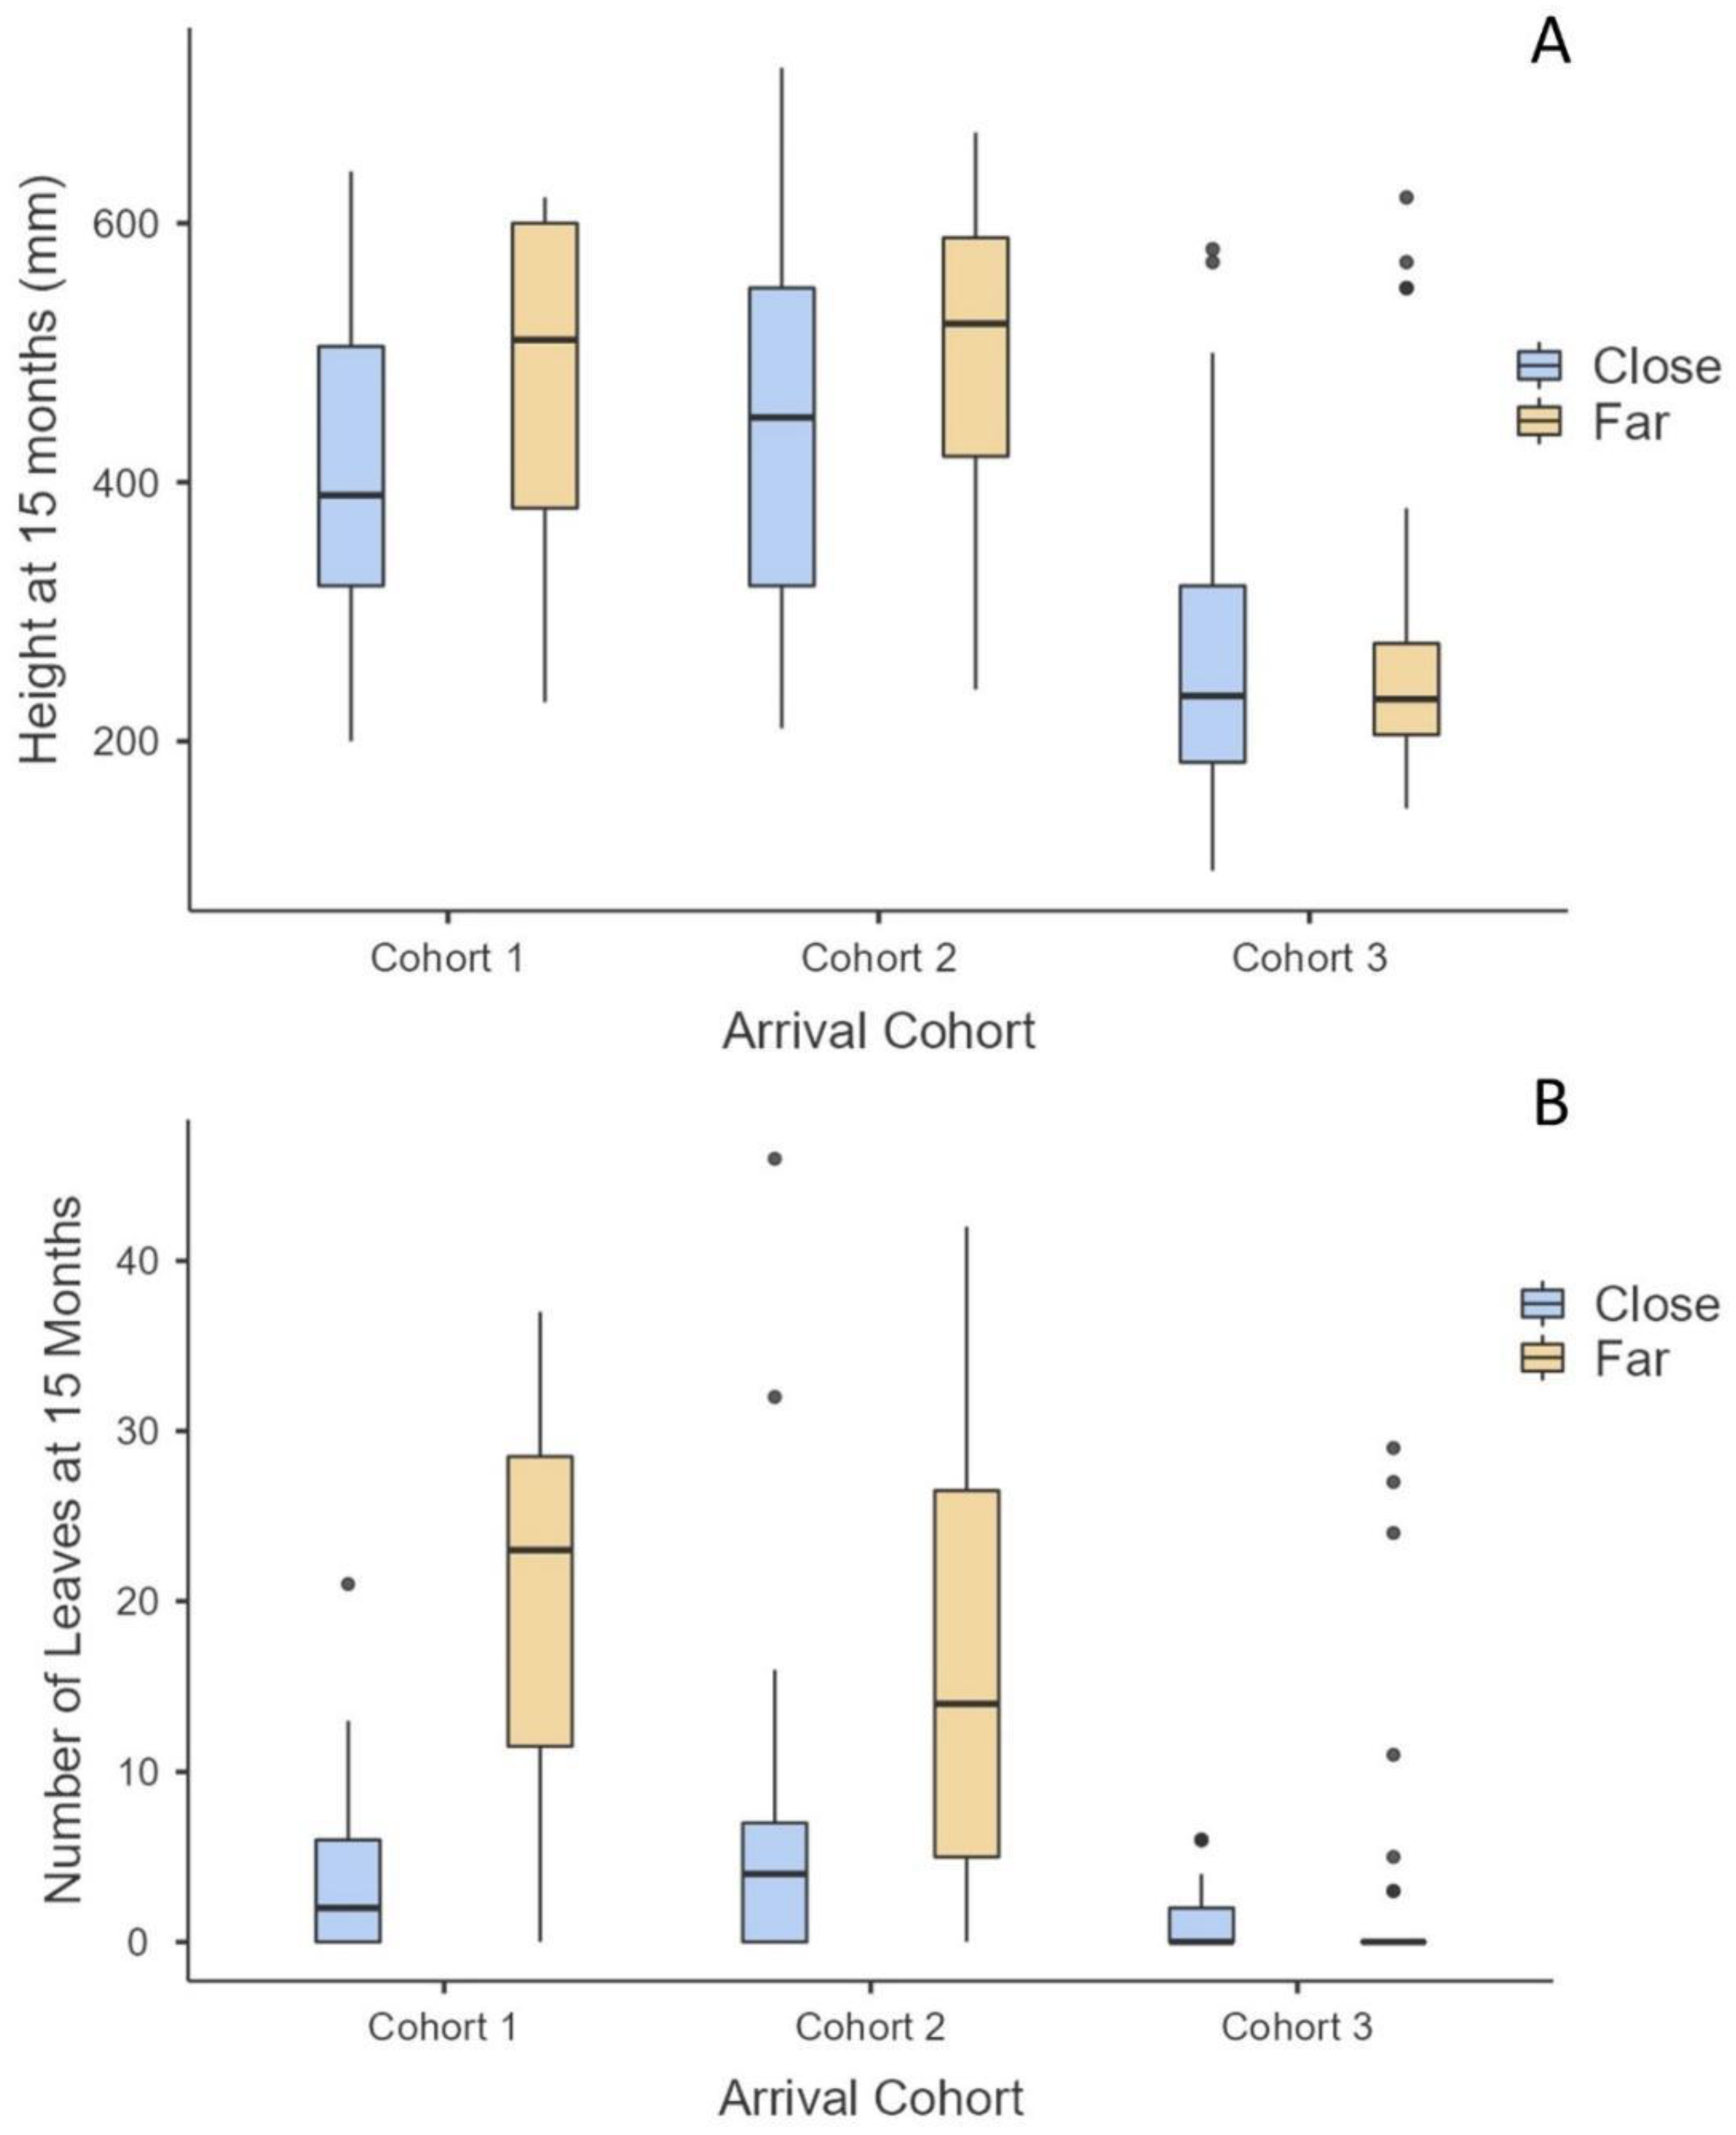
3.5. Propagule Arrival and Survival Densities on Reefs

When assessing all arriving propagules or only red mangroves by reef type, there were no differences in arriving propagule density (propagule m−2 of reef; ANOVA: p = 0.17, 0.15, respectively) or in the density of surviving propagules/seedlings (ANOVA: p = 0.13, 0.14, respectively) at 15 months. The density of propagules/seedlings m−2 in December 2021 was 0.17 for older transitioning reefs, 0.26 for newer transitioning reefs, and 0.02 for oyster-only reefs. However, the mangrove:oyster area as a percent of the total area for each reef significantly predicted increased arrival density (total: r2 = 0.71, p < 0.01; red mangrove: r2 = 0.68, p < 0.01) and survival density (total: r2 = 0.72, p < 0.01; red: r2 = 0.72, p < 0.01) of propagules/seedlings with increasing mangrove:oyster area. Moreover, once the adult mangrove:oyster area was greater than 50%, there was a large rate change in propagule survival (r2 increased from 0.28 to 0.89; Figure 3). This suggests that once the adult mangrove coverage reached 50% of the total reef area, there was an increase in the rate of survival of propagules, potentially leading to a faster and more permanent shift from oyster reef to mangrove island. This rate change was also captured with a quadratic fit of the density of red mangrove survival versus mangrove:oyster area (r2 = 0.93, p < 0.01). Moreover, for red mangrove propagules, survival was higher on the reefs with >50% mangrove:oyster area (0.46 propagule m−2) compared to those reefs with <50% mangrove:oyster area (0.04 propagule m−2). It should be noted that there were only three reefs that had >50% mangrove coverage. More reefs would need to be measured to understand if this pattern holds for all oyster reefs that are colonized by mangroves.

3.6. Adult Mangrove Nursery Impacts

We computed the nursery impact on survival for red mangrove propagules after excluding propagules that landed on oyster-only reefs. The mean distance from the nearest adult mangrove was significantly closer for propagules that survived (1.36 m) compared to those that did not (3.30 m). When we compared propagules that landed directly under an adult mangrove tree (distance to adult mangrove = 0, n = 515) with all other propagules (n = 743), the chance of survival increased from 11% to 30% for propagules under adult trees. Of those propagules that were found directly below an adult mangrove tree, 41% survived if directly under a black mangrove tree, while 23% survived if under a red mangrove tree. There were no adult white mangrove trees on the study reefs. We next calculated the survival probability of red mangrove propagules that were far (>0.3 m) or close (≤0.3 m, distance cutoff determined from decision tree) to adult mangroves, regardless of adult mangrove species. We focused on red mangroves in arrival cohorts 1 and 2 for this analysis, as cohort 3 provided limited time for propagule mortality. Overall, propagules that landed close to an adult mangrove made up 40% of the total arriving propagules, but 67% of the surviving propagules (p < 0.0001; Figure 4). Those propagules that arrived in cohort 2 (after high-water season) and settled close to an adult mangrove had the greatest chance of survival (Figure 3).
For cohorts 1 and 2, the number of leaves at 15 months was significantly greater on those surviving propagules that landed far from an adult mangrove (p < 0.0001), but there was no difference in height within cohorts at months 12 and 15 (Figure 5). There was no difference in number of leaves or height for cohort 3 based on proximity to an adult mangrove (Figure 5).

4. Discussion

Warming minimum air temperatures may be facilitating a regime shift from an animal-based ecosystem (intertidal oyster reefs) to a plant-based system (mangrove islands) in central Florida. Moreover, adult mangroves already established on these oyster reefs may be additionally facilitating new mangrove recruitment and thus creating a positive feedback loop to entrench the shift. In Mosquito Lagoon on Florida’s east coast, we tracked propagule survival during the transitional phase of this regime shift, which is trending toward a tipping point from which oysters may not recover. McClenachan et al. [29] previously reported a 198% increase in mangroves on oyster reefs in this lagoon between 1984 and 2017, with a ~6% increase in mangrove area on reefs per year. Moreover, from 2021 aerial photographs, 16.8% of 3244 intertidal reefs in Mosquito Lagoon had visible mangroves on them [55], and Suchonic [71] reported that 83 of 119 (69.7%) oyster reefs with adult stands (multiple adult trees in contact with each other) in Mosquito Lagoon in observed 1984 imagery had fully converted to mangrove islands by 2021. It is important to note that the minimum mangrove size that could be identified from aerial photographs was approximately 0.5 m2, which equates to a 3–5 year-old red mangrove with prop roots (GM, personal communication). On the west coast of central Florida, the rate of transition appears to be happening faster. Using similar aerial photography methods, Hesterberg et al. [30] reported that complete transition from intertidal oyster reef to mangrove island took 11–49 years. The mean (± S.D.) canopy width at detection observed by Hesterberg et al. [30] was 1.24 ± 0.59 m; they suggest this underestimates transition times by at least 2–3 years. Our propagule study supplements these important results as it focused on transitioning reefs with mangroves too small for aerial photography and the factors driving successful (or unsuccessful) mangrove establishment.
Most mangroves found on Mosquito Lagoon oyster reefs prior to 1984 were individual or small patches of black mangroves, some of which were visible in 1943 aerial photography [29]. However, since 1984, mangrove recruitment on these reefs has been driven predominately by red mangroves. One possible explanation for this change in dominant mangrove recruitment species is that minimum air temperatures have never fell below values that were lethal to red mangroves since 1995, and local and regional red mangrove propagule abundances are increasing with increased red mangrove presence along adjacent shorelines [19,30]. A second explanation for this change in mangrove dominance is that red mangroves are more tolerant of inundation and demonstrate higher survival rates at lower tidal regions compared to black mangroves [61]. Mosquito Lagoon’s annual high-water season continuously submerged oyster reefs for 2–3 months during each fall; this likely promoted greater red mangrove success and hindered black and white mangroves.
On most (83.2% in 2021) oyster reefs, no adult mangroves were present even though these reefs experienced similar daily inundation times as reefs with mangroves [55]. Some of these patch reefs with no mangroves were < 10 m from shorelines where red, black, and white mangroves produced propagules during our study (LJW, personal observation). Likewise, propagules were reported moving with lagoon currents in quarterly seining adjacent to all study reefs in all seasons except spring (May 2021) (LJW, unpublished data). This suggests that propagule availability was not a limiting factor, and additional localized factors that differed among individual reefs played a role in facilitating or preventing a regime shift from oyster reef to mangrove island. The temperature in the region never dropped close to the minimum temperature required to cause mangrove mortality, allowing us to focus on these reef-scale factors that may be dictating propagule arrival and seedling survival.

4.1. Success: Comparisons among Mangrove Species

Red mangroves prevailed in both recruitment and survival on oyster reefs in comparison to black and white mangroves. There are number of potential reasons for this. First, the dimensions of red propagules provided them with greater opportunities to become trapped among prop roots and pneumatophores or wedged between densely packed oyster clusters. Pencil-shaped, red mangrove propagules averaged 245.9 ± 65.1 mm (mean ± S.D.) along their longest axis versus 43.7 ± 22.1 mm for the longest axis of black mangrove propagules or 30 mm for the single white mangrove propagule. Trapping of red mangrove propagules has been documented with early successional plant species in wetlands [20,23,24]. The rigidity of the oyster shells may also provide structural support. Second, larger red mangrove propagules were retained better and produced leaves faster than smaller ones. Red mangrove propagules that produced leaves were larger at the start than those that did not (263 mm versus 243 mm for 1321 propagules; ANOVA: F = 18.82, p = 1.53 × 10⁻¹⁵). Moreover, propagules that produced leaves had a survival rate of 53.9% (110/204) compared to 6.8% (89/1318) for those that did not produce leaves. Propagules that landed on reefs after the high-water season had a greater chance of survival, suggesting that prolonged inundation decreases survivability. The larger red mangrove propagules may decrease the time of inundation compared to the smaller black mangroves. Third, both black and red propagules form roots within days to weeks in Mosquito Lagoon waters, but the anchoring force was significantly greater for red mangrove seedlings [51].
White mangroves have not been observed as adults or seedlings on any reefs in Mosquito Lagoon to date. In total, 13.2% of red and 0.6% of black mangroves, either as propagules or seedlings, were present at the end of the project. Only one white mangrove propagule was observed on a reef during our 15-month trial. It produced leaves within 1 month and was gone within 4 months. As white mangrove propagules are small (<3 cm in length) and thus more difficult to locate among oyster clusters, our number of observations was likely very conservative. Between December 2020 and March 2021, we tracked an additional 60 white and 60 black mangroves on nearby non-study reefs that were newly arrived to increase our understanding of these two species (LJW, unpublished data). By March 2021, 20 black mangrove and 20 white mangrove recruits remained alive. The rest were observed dead with snapped stems. Of the survivors, at 10 mm above the sediment, the black mangrove stems were significantly larger in diameter than white mangrove stems (ANOVA: F = 140.8, p = 2.37 × 10⁻¹⁴; mean stem diameter (±SD) of white mangroves: 2.1 ± 0.3 mm; black mangroves: 3.8 ± 0.6 mm). White mangrove propagules are also intolerant to flooding stress and require higher elevations than red and black propagules to establish [61]. Oyster reefs, submerged twice daily at high tide, likely have elevations too low to foster white mangrove survival. Additionally, multiple studies have documented preferential predation on mangrove propagules for the species rarest in the nearby forest canopy [72,73,74]. Preferential predation on white mangroves may thus be another reason for snapped stems and low survival.

4.2. Positive Feedback Loops

Many regime shifts in ecosystems will not be permanent without positive feedback loops that entrench the new alternative state. Mangroves have been present on the oyster reefs in Mosquito Lagoon since at least 1943, based on historical images [29], with 600 reefs experiencing mangrove expansion as of 2021 [55]. As the number and density of mangroves establishing on each oyster reef increases, there may be a tipping point that accelerates and entrenches mangroves from merely being present on oyster reefs to converting the reefs to mangrove islands. For example, we found that as the percent coverage of mangrove on a reef increased, the arrival and survival density of propagules also increased, with a potential tipping point at 50% coverage. However, it should be noted that this percent is from a small sample size. Multiple positive feedback loops were observed in the transition from oyster reef to mangrove island. Red mangrove propagule survival increased from 7% to 22% when underneath or within 0.3 m of an adult mangrove stand. Mangrove stands act as nurseries for many plant species. For example, adult stands provide more stable microclimates and buffer seedlings from extreme temperatures [16,75]. Adult mangrove root structures (prop roots, pneumatophores) protect seedlings by reducing wave energy, providing structural refugia, and decreasing the likelihood of boat strikes [45,76]. Adult mangroves also increase the amount of sediment and organic matter [77]. Over time, this should provide a more suitable substrate for plants in terms of nutrients plus more sediment overall to facilitate partial burial of propagules. This concept is supported by our result that propagule survival increased with closer proximity to an adult mangrove. Interestingly, propagule survival increased more when ≤0.3 m from an adult black mangrove (28%) compared to an adult red mangrove (22%). Thus, the densely packed pneumatophores of black mangroves are potentially better at trapping/protecting red mangrove propagules than red mangrove prop roots. It is also possible that reefs with larger, more abundant black mangrove adults have been colonized by mangroves for a longer time [29,78], allowing for more positive feedback loops to take hold. While survival of seedlings was enhanced when in close proximity to adult mangrove trees, there appeared to be a tradeoff with growth parameters. The number of leaves was greater for those seedlings growing further from adult mangroves; although not statistically significant, the heights of the seedlings also trended higher. This may be due to light limitations of the mangrove canopy cover. Seedling survival would need to be tracked past 15 months to determine whether the fewer, but more rapidly developing, seedlings would eventually survive to a greater degree than the more, but less developed, seedlings closer to adult mangroves.
Sediment accretion associated with the mangrove stands themselves may contribute to another positive feedback loop. In addition to promoting substrate suitability and partial propagule burial, vertical sediment accretion may lead to the burial and mortality of live oysters on these reefs. Mangroves trap and retain sediment, contributing to accretion rates between 5 and 10 mm year−1 [77]. Furthermore, high densities of mangroves have been shown to double accretion rates compared to areas with sparse or no mangrove presence [78,79]. As sediment accretes within and around mangrove stands on oyster reefs, oysters are likely to be buried over time. Sedimentation and burial lead to increased oyster mortality, where survival significantly declines once 70% or more of an oyster is buried [80,81]. Furthermore, spat settlement is reduced by sedimentation even when only a thin layer of silt is present on adult oyster shells [82]. Other studies conducted in Mosquito Lagoon have noted that few oysters are found growing within mangrove stands on intertidal oyster reefs [55,71], indicating that oyster burial and reduced spat recruitment may be contributing to this ecosystem shift.
Mangroves can contribute to soil acidification [83,84,85,86]; they release organic acids into the rhizosphere to promote nutrient availability and release oxygen through the roots that mix with sulfur in the soil, creating sulfuric acids [83,84,87]. As oysters are buried from sediment accretion, they may be further subject to increased acidity. Oyster shells are calcium carbonate structures prone to dissolution in acidic conditions [88,89,90]. With decreasing pH, the rate of shell dissolution may increase, potentially hastening a regime shift. Waldbusser et al. [89] assessed oyster shell dissolution in a controlled saltwater pH of 7.17 and demonstrated that the rate of oyster shell dissolution significantly increased compared to shells placed in a saltwater pH of 7.67 or the control (pH: 7.90). In Mosquito Lagoon, oyster reefs without mangroves had an average porewater pH of 7.58, while on oyster reefs with adult mangroves, the porewater pH decreased to pH values as low as 6.83 (KH, pers. comm.). Mud “halos” with very few live oysters and fine sediments are common around mangrove stands on transitioning oyster reefs (LJW, unpublished data).
Oyster shells may be a source of nitrogen for mangroves, in the form of ammonium, compared to nutrient limited mangrove forest habitat [47,91,92]. Mangrove-driven acidification may further increase the nitrogen and phosphorus available on oyster reefs for mangrove growth and survival [87,93]. This shift towards sediment acidification may have the added impact of making the reef habitat more suitable for established mangroves and future mangrove recruitment. Simultaneously, acidification rates are predicted to increase with more, larger red mangroves present on a reef. Alterations in sediment pH may be a primary source of mangrove success in taking over intertidal reefs in both historic and present times [31].
As ecosystem engineers, both oysters and adult mangroves can have positive, negative, or neutral impacts on the local abundance and diversity of other species [94,95]. Both engineers provide protection from extreme temperatures and desiccation as well as refuge from predators [96]. Live oysters alter water quality and increase food availability by supporting many species of invertebrates [43,97]. Likewise, researchers have found positive associations for oysters growing on mangrove roots (prop roots, pneumatophores) [98,99]. Moreover, black mangrove pneumatophores promote the trapping of other primary, diversifying local flora [99]. Another example of plant–plant facilitation is marshgrass species functioning as nurse plants for red mangroves by trapping propagules, keeping them upright and attenuating wave energy [23].
The ecosystem shift from intertidal oyster reefs to mangrove islands also has social and economic implications for the surrounding area. In 2011, oyster reef habitats were valued at USD 4123 per hectare per year for their contribution to recreational and commercial fishing industries and between USD 5500 and 99,000 per hectare per year for improvement of local water quality and other ecosystem services [100]. Between 1990 and 2015, shellfish industry value in the Indian River Lagoon (IRL) declined by 80% due to reduced harvestability (Indian River Lagoon Economic Valuation [101]). Additionally, water quality has been identified by the IRL National Estuary Program as a topic of critical concern, with restoration of filter feeder habitats noted as a way to improve this issue [102]. The loss of oyster reefs from mangrove expansion is likely to reduce recreational and commercial fishing associated with oyster reefs and decrease their filtering capability. However, gaining mangrove area can contribute positively to the economy in other ways, such as mitigating flood risk and storm surge during hurricanes [59,103]. Mangrove presence during hurricanes has been estimated to reduce property damages by 25%, and this risk reduction has been valued at USD 7500 per hectare [103]. The ecosystem shift from oyster reef to mangrove island will alter the surrounding area; however, the overall change to economic value may be negative, neutral, or positive depending on the services lost or gained. The impact of losing oyster reef area versus gaining mangrove area should be evaluated on a case-by-case basis and will strongly depend on which services are deemed most important by local resource managers.

5. Conclusions

The stark differences between a functioning intertidal oyster reef and one that has been fully replaced by mangroves suggests that mangrove encroachment is a human-driven regime shift. Hesterberg et al. [30] found that 83% of reefs completely transitioned to mangrove islands within 49 years on Florida’s west coast, with some taking as little as 11 years. Unlike west Florida, 0.03% (83/3244) of the tracked reefs in Mosquito Lagoon that had mangroves present in 1943 (78 years) transitioned into mangrove islands during or prior to our study, suggesting either different factors or different intensities of factors facilitate regime shifts along the two coasts. Factors that promoted the transition from oyster reef toward mangrove island in Mosquito Lagoon included close proximity of propagules to adult mangroves, especially black mangroves; over 50% mangrove coverage on reefs; sufficient sediment to partially bury red mangrove propagules; and lowered pH of reef sediments. Once the mangrove density reaches one adult mangrove m−2, the porewater landscape may become sufficiently acidic to tip the scales toward red mangrove success. As a result of these positive feedback loops, more mangrove recruitment should occur, eventually driving oyster reefs to a tipping point, causing a regime shift from an animal-based ecosystem to a plant-based ecosystem. Because the potential regime shift from oyster reef to mangrove island is occurring in the absence of extreme freeze events, local factors are dictating whether a full ecosystem transition takes hold.

Author Contributions

Conceptualization, L.J.W., P.E.S., K.H. and G.M.; Data curation, L.J.W., K.H. and G.M.; Formal analysis, L.J.W., K.H. and G.M.; Funding acquisition, L.J.W.; Investigation, L.J.W. and P.E.S.; Methodology, L.J.W., P.E.S. and G.M.; Project administration, L.J.W.; Resources, L.J.W.; Supervision, L.J.W.; Validation, G.M.; Visualization, K.H. and G.M.; Writing—Original draft, L.J.W.; Writing—review & editing, P.E.S., K.H. and G.M. All authors have read and agreed to the published version of the manuscript.

Funding

This research was funded by NSF CNH program (#1617374) and UCF Biology.

Data Availability Statement

Data will be made available upon reasonable request and published on UCF STARS Digital Repository within 1 year of publication.

Acknowledgments

We thank Canaveral National Seashore for field access, SJRWMD for access to aerial photographs, and many UCF students for field assistance.

Conflicts of Interest

The authors declare no conflicts of interest.

References

  1. Sousa, W. The role of disturbance in natural communities. Ann. Rev. Ecol. Syst. 1984, 15, 353–391. [Google Scholar] [CrossRef]
  2. Scheffer, M.; Carpenter, E.; Foley, J.; Folke, C.; Walker, B. Catastrophic shifts in ecosystems. Nature 2001, 413, 591–596. [Google Scholar] [CrossRef] [PubMed]
  3. Carpenter, R.C. Mass mortality of Diadema antillarum I. Long term effects on sea urchin population dynamics and coral reef algal communities. Mar. Biol. 1990, 104, 67–77. [Google Scholar] [CrossRef]
  4. Hughes, T.P. Catastrophes, phase shifts, and large-scale degradation of a Caribbean coral reef. Science 1994, 265, 1547–1551. [Google Scholar] [CrossRef] [PubMed]
  5. Mumby, P.J.; Harborne, A.R.; Williams, J.; Kappel, C.V.; Brumbaugh, D.R.; Micheli, F.; Holmes, K.E.; Dahlgren, C.P.; Paris, C.B.; Blackwell, P.G. Trophic cascade facilitates coral recruitment in a marine reserve. Proc. Natl. Acad. Sci. USA 2007, 104, 8362–8367. [Google Scholar] [CrossRef]
  6. Knowlton, N.; Jackson, J.B.C. Shifting baselines, local impacts, and global change on coral reefs. PLoS Biol. 2008, 6, e54. [Google Scholar] [CrossRef]
  7. Adam, T.C.; Burkepile, D.E.; Holbrook, S.J.; Carpenter, R.C.; Claudet, J.; Loiseau, C.; Thiault, L.; Brooks, A.J.; Washburn, L.; Schmitt, R.J. Landscape-scale patterns of nutrient enrichment in a coral reef ecosystem: Implications for coral to algae phase shifts. Ecol. Appl. 2021, 31, e2227. [Google Scholar] [CrossRef]
  8. Knowlton, N. Multiple “stable” states and the conservation of marine ecosystems. Prog. Oceanogr. 2004, 60, 387–396. [Google Scholar] [CrossRef]
  9. Kuffner, I.; Walters, L.; Becerro, M.; Paul, V.; Ritson-Williams, R.; Beach, K. Inhibition of coral recruitment by macroalgae and cyanobacteria. Mar. Ecol. Prog. Ser. 2006, 323, 107–117. [Google Scholar] [CrossRef]
  10. Ling, S.D.; Johnson, C.R.; Frusher, S.D.; Ridgway, K.R. Overfishing reduces resilience of kelp beds to climate-driven catastrophic phase shift. Proc. Natl. Acad. Sci. USA 2009, 106, 22341–22345. [Google Scholar] [CrossRef]
  11. Filbee-Dexter, K.; Scheibling, R.E. Sea urchin barrens as alternative stable states of collapsed kelp ecosystems. Mar. Ecol. Prog. Ser. 2014, 495, 1–25. [Google Scholar] [CrossRef]
  12. Cavanaugh, K.C.; Kellner, J.R.; Forde, A.J.; Gruner, D.S.; Parker, J.D.; Rodriguez, W.; Feller, I.C. Poleward expansion of mangroves is a threshold response to decreased frequency of extreme cold events. Proc. Natl. Acad. Sci. USA 2014, 111, 723–727. [Google Scholar] [CrossRef] [PubMed]
  13. Cavanaugh, K.C.; Dangremond, E.M.; Doughty, C.L.; Park Williams, A.; Parker, J.D.; Hayes, M.A.; Rodriguez, W.; Feller, I.C. Climate-driven regime shifts in a mangrove–salt marsh ecotone over the past 250 years. Proc. Natl. Acad. Sci. USA 2019, 116, 21602–21608. [Google Scholar] [CrossRef]
  14. Giri, C.; Long, J. Is the geographic range of mangrove forests in the conterminous United States really expanding? Sensors 2016, 16, 2010. [Google Scholar] [CrossRef] [PubMed]
  15. Osland, M.J.; Day, R.H.; Hall, C.T.; Brumfield, M.D.; Dugas, J.L.; Jones, W.R. Mangrove expansion and contraction at a poleward range limit: Climate extremes and land-ocean temperature gradients. Ecology 2017, 98, 125–137. [Google Scholar] [CrossRef]
  16. Osland, M.J.; Hartmann, A.M.; Day, R.H.; Ross, M.S.; Hall, C.T.; Feher, L.C.; Vervaeke, W.C. Microclimate influences mangrove freeze damage: Implications for range expansion in response to changing macroclimate. Estuaries Coasts 2019, 42, 1084–1096. [Google Scholar] [CrossRef]
  17. Osland, M.J.; Day, R.H.; Hall, C.T.; Feher, L.C.; Armitage, A.R.; Cebrian, J.; Dunton, K.H.; Hughes, A.R.; Kaplan, D.A.; Langston, A.K.; et al. Temperature thresholds for black mangrove (Avicennia germinans) freeze damage, mortality and recovery in North America: Refining tipping points for range expansion in a warming climate. J. Ecol. 2020, 108, 654–665. [Google Scholar] [CrossRef]
  18. Osland, M.J.; Day, R.H.; Michot, T.C. Frequency of extreme freeze events controls the distribution and structure of black mangroves (Avicennia germinans) near their northern range limit in coastal Louisiana. Divers. Distrib. 2020, 26, 1366–1382. [Google Scholar] [CrossRef]
  19. Steinmuller, H.E.; Foster, T.E.; Boudreau, P.; Ross Hinkle, C.; Chambers, L.G. Tipping points in the mangrove march: Characterization of biogeochemical cycling along the mangrove–salt marsh ecotone. Ecosystems 2020, 23, 417–434. [Google Scholar] [CrossRef]
  20. Milbrandt, E.C.; Tinsley, M.N. The role of saltwort (Batis maritima) in regeneration of degraded mangrove forests. Hydrobiologia 2006, 568, 369–377. [Google Scholar] [CrossRef]
  21. McKee, K.L.; Rooth, J.E.; Feller, I.C. Mangrove recruitment after forest disturbance is facilitated by herbaceous species in the Caribbean. Ecol. Appl. 2007, 17, 1678–1693. [Google Scholar] [CrossRef]
  22. Peterson, J.M.; Bell, S.S. Tidal events and salt-marsh structure influence black mangrove (Avicennia germinans) recruitment across an ecotone. Ecology 2012, 93, 1648–1658. [Google Scholar] [CrossRef] [PubMed]
  23. Donnelly, M.; Walters, L. Trapping of Rhizophora mangle by coexisting early successional species. Estuaries Coasts 2014, 37, 1562–1571. [Google Scholar] [CrossRef]
  24. Stevens, P.W.; Fox, S.L.; Montague, C.L. The interplay between mangroves and saltmarshes at the transition between temperate and sub-tropical climate in Florida. Wetl. Ecol. Manag. 2006, 14, 435–444. [Google Scholar] [CrossRef]
  25. Krauss, K.W.; From, A.S.; Doyle, T.W.; Doyle, T.J.; Barry, M.J. Sea-level rise and landscape change influence mangrove encroachment onto marsh in the Ten Thousand Islands region of Florida, USA. J. Coast. Conserv. 2011, 15, 629–638. [Google Scholar] [CrossRef]
  26. Osland, M.J.; Spivak, A.C.; Nestlerode, J.A.; Lessmann, J.M.; Almario, A.E.; Heitmuller, P.T.; Russell, M.J.; Krauss, K.W.; Alvarez, F.; Dantin, D.D.; et al. Ecosystem development after mangrove wetland creation: Plant-soil change across a 20-year chronosequence. Ecosystems 2012, 15, 848–866. [Google Scholar] [CrossRef]
  27. McKee, K.L.; Rooth, J.E. Where temperate meets tropical: Multi-factorial effects of elevated CO2, nitrogen enrichment, and competition on a mangrove-salt marsh community. Glob. Change Biol. 2008, 14, 971–984. [Google Scholar] [CrossRef]
  28. Osland, M.J.; Enwright, N.; Day, R.H.; Doyle, T.W. Winter climate change and coastal wetland foundation species: Salt marshes vs. mangrove forests in the southeastern United States. Glob. Change Biol. 2013, 19, 1482–1494. [Google Scholar] [CrossRef]
  29. McClenachan, G.; Witt, M.; Walters, L.J. Replacement of oyster reefs by mangroves: Unexpected climate-driven ecosystem shifts. Glob. Change Biol. 2021, 27, 1226–1238. [Google Scholar] [CrossRef]
  30. Hesterberg, S.G.; Jackson, K.; Bell, S.S. Climate drives coupled regime shifts across subtropical estuarine ecosystems. Proc. Natl. Acad. Sci. USA 2022, 119, e2121654119. [Google Scholar] [CrossRef]
  31. Parkinson, R.W. Decelerating Holocene sea-level rise and its influence on southwest Florida coastal evolution: A transgressive/regressive stratigraphy. J. Sediment. Petrol. 1989, 59, 960–972. [Google Scholar] [CrossRef]
  32. Osland, M.J.; Stevens, P.W.; Lamont, M.M.; Brusca, R.C.; Hart, K.M.; Waddle, J.H.; Langtimm, C.A.; Williams, C.M.; Keim, B.D.; Terando, A.J.; et al. Tropicalization of temperate ecosystems in North America: The northward range expansion of tropical organisms in response to warming winter temperatures. Glob. Change Biol. 2021, 27, 3009–3034. [Google Scholar] [CrossRef]
  33. Hurst, N.R.; Locher, B.; Steinmuller, H.E.; Walters, L.J.; Chambers, L.G. Organic carbon dynamics and microbial community response to oyster reef restoration. Limnol. Oceanogr. 2022, 67, 1157–1168. [Google Scholar] [CrossRef]
  34. Balke, T.; Webb, E.; van den Elzen, E.; Galli, D.; Herman, P.; Bouma, T. Seedling establishment in a dynamic sedimentary environment: A conceptual framework using mangroves. J. Appl. Ecol. 2013, 50, 740–747. [Google Scholar] [CrossRef] [PubMed]
  35. Brockmeyer, R.K.; Radabaugh, K.; Mitchell, J.; Simpson, L.; Sweat, H.; Donnelly, M. Indian River Lagoon. In Coastal Habitat Integrated Mapping and Monitoring Program; Report for the State of Florida No. 2; Florida Fish and Wildlife Conservation Commission: St. Petersburg, FL, USA; Fish and Wildlife Research Institute: St. Petersburg, FL, USA, 2022. [Google Scholar]
  36. Phlips, E.; Badylak, S.; Lasi, M.; Chamberlain, R.; Green, W.; Hall, L.; Hart, J.; Lockwood, J.; Miller, J.; Morris, L.; et al. From red tides to green and brown tides: Bloom dynamics in a restricted subtropical lagoon under shifting climatic conditions. Estuaries Coasts 2015, 38, 886–904. [Google Scholar] [CrossRef]
  37. Walters, L.J.; Sacks, P.E.; Campbell, D.E. Boating impacts and boat-wake resilient restoration of the eastern oyster Crassostrea virginica in Mosquito Lagoon, Florida, USA. Fla. Sci. 2021, 84, 173–199. [Google Scholar]
  38. Smith, N. Tidal and nontidal flushing of Florida’s Indian River Lagoon. Estuaries 1993, 16, 739–746. [Google Scholar] [CrossRef]
  39. Steward, J.; Virnstein, R.; Lasi, M.; Morris, L.; Miller, J.; Hall, L.; Tweedale, W. The impacts of the 2004 hurricanes on hydrology, water quality, and seagrass in the Central Indian River Lagoon, Florida. Estuaries Coasts 2006, 29, 954–965. [Google Scholar] [CrossRef]
  40. United States Geological Survey. 2023. Available online: https://waterdata.usgs.gov/monitoring-location/02248380/#parameterCode=00065&period=P7D&showMedian=false (accessed on 20 August 2023).
  41. Kennedy, V.; Newell, R.; Eble, A.; Leffler, M.; Harpe, S.R.D. The Eastern Oyster: Crassostrea virginica; Maryland Sea Grant College, University of Maryland: College Park, MD, USA, 1996. [Google Scholar]
  42. Copertino, J.L.; Harris, K.; Chute, L.; Walters, L.J. Impact of oyster (Crassostrea virginica) reef restoration on benthic invertebrates and coastal birds in a subtropical estuary. Sustainability 2022, 14, 2371. [Google Scholar] [CrossRef]
  43. Searles, A.R.; Gipson, E.E.; Walters, L.J.; Cook, G.S. Oyster reef restoration facilitates the recovery of macroinvertebrate abundance, diversity, and composition in estuarine communities. Nat. Sci. Rep. 2022, 12, 8163. [Google Scholar] [CrossRef]
  44. Troast, B.V.; Walters, L.J.; Cook, G.S. A multi-tiered assessment of fish community responses to habitat restoration in a coastal lagoon. Mar. Ecol. Prog. Ser. 2022, 698, 1–14. [Google Scholar] [CrossRef]
  45. Kibler, K.M.; Kitsikoudis, V.; Donnelly, M.; Spiering, D.W.; Walters, L. Flow–vegetation interaction in a living shoreline restoration and potential effect to mangrove recruitment. Sustainability 2019, 11, 3215. [Google Scholar] [CrossRef]
  46. McClenachan, G.M.; Donnelly, M.J.; Shaffer, M.N.; Sacks, P.E.; Walters, L.J. Does size matter? Quantifying the cumulative impact of small-scale living shoreline and oyster reef restoration projects on shoreline erosion. Restor. Ecol. 2020, 28, 1365–1371. [Google Scholar] [CrossRef]
  47. Chambers, L.G.; Gaspar, S.A.; Pilato, C.J.; Steinmuller, H.E.; McCarthy, K.J.; Sacks, P.E.; Walters, L.J. How well do restored intertidal oyster reefs support key biogeochemical properties in a coastal lagoon? Estuaries Coasts 2018, 41, 784–799. [Google Scholar] [CrossRef]
  48. Fodrie, F.J.; Rodriguez, A.B.; Gittman, R.K.; Grabowski, J.H.; Lindquist, N.L.; Peterson, C.H.; Piehler, M.F.; Ridge, J.T. Oyster reefs as carbon sources and sinks. Proc. R. Soc. B Biol. Sci. 2017, 284, 20170891. [Google Scholar] [CrossRef]
  49. Walters, L.J.; Craig, C.A.; Dark, E.; Wayles, J.; Encomio, V.; Coldren, G.; Sailor-Tynes, T.; Fox, D.W.; Zhai, L. Quantifying spatial and temporal trends of microplastic pollution in surface water and in the Eastern oyster Crassostrea virginica for a dynamic Florida estuary. Environments 2022, 9, 131. [Google Scholar] [CrossRef]
  50. Rifenberg, J.; Litwak, J.; Fillyaw, R. Vertebrate impact on a newly deployed shoreline stabilization project by wildlife camera analysis. Pegasus Rev. UCF Undergrad. Res. J. 2021, 13, 3. Available online: https://stars.library.ucf.edu/urj/vol13/iss2/3 (accessed on 1 January 2024).
  51. Kibler, K.M.; Pilato, C.; Walters, L.J.; Donnelly, M.; Taye, J. Hydrodynamic limitations to mangrove seedling retention in subtropical estuaries. Sustainability 2022, 14, 8605. [Google Scholar] [CrossRef]
  52. Bouillon, S.; Borges, A.V.; Castañeda-Moya, E.; Diele, K.; Dittmar, T.; Duke, N.C.; Kristensen, E.; Lee, S.Y.; Marchand, C.; Middelburg, J.J.; et al. Mangrove production and carbon sinks: A revision of global budget estimates. Glob. Biogeochem. Cycles 2008, 22, GB2013. [Google Scholar] [CrossRef]
  53. Breithaupt, J.L.; Smoak, J.M.; Smith, T.J.; Sanders, C.J.; Hoare, A. Organic carbon burial rates in mangrove sediments: Strengthening the global budget. Glob. Biogeochem. Cycles 2012, 26, GB3011. [Google Scholar] [CrossRef]
  54. Breithaupt, J.L.; Smoak, J.M.; Sanders, C.J.; Troxler, T.G. Spatial variability of organic carbon, CaCO3 and nutrient burial rates spanning a mangrove productivity gradient in the coastal Everglades. Ecosystems 2019, 22, 844–858. [Google Scholar] [CrossRef]
  55. Benson, G.W.; Donnelly, M.J.; Sacks, P.E.; Walters, L.J. Documenting loss and fragmentation of intertidal oyster (Crassostrea virginica) reefs in a subtropical estuary. Environments 2023, 10, 133. [Google Scholar] [CrossRef]
  56. Garvis, S.; Sacks, P.; Walters, L. Assessing the formation, movement, and restoration of dead intertidal oyster reefs over time using remote sensing in Canaveral National Seashore and Mosquito Lagoon, Florida. J. Shellfish Res. 2015, 34, 251–258. [Google Scholar] [CrossRef]
  57. Fillyaw, R.M.; Donnelly, M.J.; Litwak, J.W.; Rifenberg, J.L.; Walters, L.J. Strategies for successful mangrove living shoreline stabilizations in shallow water subtropical estuaries. Sustainability 2021, 13, 11704. [Google Scholar] [CrossRef]
  58. Friess, D.A.; Krauss, K.W.; Horstman, E.M.; Balke, T.; Bouma, T.J.; Galli, D.; Webb, E.L. Are all intertidal wetlands naturally created equal? Bottlenecks, thresholds and knowledge gaps to mangrove and saltmarsh ecosystems. Biol. Rev. 2012, 87, 346–366. [Google Scholar] [CrossRef] [PubMed]
  59. Lewis, R.R. Ecological engineering for successful management and restoration of mangrove forests. Ecol. Eng. 2005, 24, 403–418. [Google Scholar] [CrossRef]
  60. McKee, K.L. Soil physicochemical patterns and mangrove species distribution—Reciprocal effects? J. Ecol. 1993, 81, 477–487. [Google Scholar] [CrossRef]
  61. McKee, K.L. Growth and physiological responses of neotropical mangrove seedlings to root zone hypoxia. Tree Physiol. 1996, 16, 883–889. [Google Scholar] [CrossRef]
  62. Elster, C. Reasons for reforestation success and failure with three mangrove species in Colombia. For. Ecol. Manag. 2000, 131, 201–214. [Google Scholar] [CrossRef]
  63. Baggett, L.; Powers, S.; Brumbaugh, R.; Coen, L.; DeAngelis, B.; Greene, J.; Hancock, B.; Morlock, S.; Allen, B.; Breitburg, D.; et al. Guidelines for evaluating performance of oyster habitat restoration. Restor. Ecol. 2015, 23, 737–745. [Google Scholar] [CrossRef]
  64. Parker, M.L.; Arnold, W.S.; Geiger, S.P.; Gorman, P.; Leone, E.H. Impacts of freshwater management activities on eastern oyster (Crassostrea virginica) density and recruitment: Recovery and long-term stability in seven Florida estuaries. J. Shellfish Res. 2013, 32, 695–708. [Google Scholar] [CrossRef]
  65. McFarland, K.; Vignier, J.; Standen, E.; Volety, A.K. Synergistic effects of salinity and temperature on the eastern oyster Crassostrea virginica throughout the lifespan. Mar. Ecol. Prog. Ser. 2022, 700, 111–124. [Google Scholar] [CrossRef]
  66. Dangremond, E.M.; Feller, I.C.; Sousa, W.P. Environmental tolerances of rare and common mangroves along light and salinity gradients. Oecologia 2015, 179, 1187–1198. [Google Scholar] [CrossRef] [PubMed]
  67. Bates, D.; Mächler, M.; Bolker, B.; Walker, S. Fitting Linear Mixed-Effects Models Using lme4. J. Stat. Softw. 2015, 67, 48. [Google Scholar] [CrossRef]
  68. Therneau, T. A Package for Survival Analysis in R, R Package Version 3.7-0; R Core Team: Vienna, Austria, 2024; Available online: https://CRAN.R-project.org/package=survival (accessed on 10 January 2024).
  69. R Core Team. R: A Language and Environment for Statistical Computing; R Foundation for Statistical Computing: Vienna, Austria, 2021; Available online: https://www.R-project.org/ (accessed on 10 January 2024).
  70. R Core Team. R: A Language and Environment for Statistical Computing; R Foundation for Statistical Computing: Vienna, Austria, 2023; Available online: https://www.R-project.org/ (accessed on 10 January 2024).
  71. Suchonic, E. Climate Change and Coastal Development Impacts on Oyster Abundances in Mosquito Lagoon, FL. Master’s Thesis, University of Central Florida, Orlando, FL, USA, 28 May 2024. Available online: https://stars.library.ucf.edu/etd2023/182 (accessed on 1 June 2024).
  72. Smith, T.J., III. Seed predation in relation to tree dominance and distribution in mangrove forests. Ecology 1987, 68, 266–273. [Google Scholar] [CrossRef]
  73. Smith, T.J., III; Chan, H.T.; McIvor, C.C.; Robblee, M.B. Comparisons of seed predation in tropical, tidal forests from three continents. Ecology 1989, 70, 146–151. [Google Scholar] [CrossRef]
  74. McGuinness, K. Seed predation in a tropical mangrove forest: A test of the dominance-predation model in northern Australia. J. Trop. Ecol. 1997, 13, 293–302. [Google Scholar] [CrossRef]
  75. Devaney, J.L.; Lehmann, M.; Feller, I.C.; Parker, J.D. Mangrove microclimates alter seedling dynamics at the range edge. Ecology 2017, 98, 2513–2520. [Google Scholar] [CrossRef]
  76. Van der Stocken, T.; Wee, A.K.S.; De Ryck, D.J.R.; Vanschoenwinkel, B.; Friess, D.A.; Dahdouh-Guebas, F.; Simard, M.; Koedam, N.; Webb, E.L. A general framework for propagule dispersal in mangroves. Biol. Rev. 2019, 94, 1547–1575. [Google Scholar] [CrossRef]
  77. Ellison, J.C. Impacts of sediment burial on mangroves. Mar. Pollut. Bull. 1999, 37, 420–426. [Google Scholar] [CrossRef]
  78. Phillips, D.H.; Kumara, M.P.; Jayatissa, L.P.; Krauss, K.W.; Huxham, M. Impacts of Mangrove Density on Surface Sediment Accretion, Belowground Biomass and Biogeochemistry in Puttalam Lagoon, Sri Lanka. Wetlands 2017, 37, 471–483. [Google Scholar] [CrossRef]
  79. Kumara, M.P.; Jayatissa, L.P.; Krauss, K.W.; Phillips, D.H.; Huxham, M. High mangrove density enhances surface accretion, surface elevation change, and tree survival in coastal areas susceptible to sea-level rise. Oecologia 2010, 164, 545–553. [Google Scholar] [CrossRef] [PubMed]
  80. Lenihan, H.S. Physical–biological coupling on oyster reefs: How habitat structure influences individual performance. Ecol. Monogr. 1999, 69, 251–275. [Google Scholar]
  81. Colden, A.M.; Lipcius, R.N. Lethal and sublethal effects of sediment burial on the eastern oyster Crassostrea virginica. Mar. Ecol. Prog. Ser. 2015, 527, 105–117. [Google Scholar] [CrossRef]
  82. Poirier, L.A.; Clements, J.C.; Coffin, M.R.; Craig, T.; Davidson, J.; Miron, G.; Davidson, J.D.; Hill, J.; Comeau, L.A. Siltation negatively affects settlement and gaping behaviour in eastern oysters. Mar. Environ. Res. 2021, 170, 105432. [Google Scholar] [CrossRef] [PubMed]
  83. Middelberg, J.; Soetaert, K.; Herman, P.; Heip, C. Denitrification in marine sediments: A model study. Glob. Biogeochem. Cycles 1996, 10, 661–673. [Google Scholar] [CrossRef]
  84. Clark, M.W.; McConchie, D.; Lewis, D.W.; Saenger, P. Redox stratification and heavy metal partitioning in Avicennia-dominated mangrove sediments: A geochemical model. Chem. Geol. 1998, 149, 147–171. [Google Scholar] [CrossRef]
  85. Marchand, C.; Lallier-Vergès, E.; Baltzer, F. The composition of sedimentary organic matter in relation to the dynamic features of a mangrove-fringed coast in French Guiana. Estuar. Coast. Shelf Sci. 2003, 56, 119–130. [Google Scholar] [CrossRef]
  86. Marchand, C.; Baltzer, F.; Lallier-Verges, E.; Alberic, P. Porewater chemistry in mangrove sediments: Relationship with species composition and developmental stages (French Guiana). Mar. Geol. 2004, 208, 361–381. [Google Scholar] [CrossRef]
  87. Dakora, F.D.; Phillips, D.A. Root exudates as mediators of mineral acquisition in low-nutrient environments. In Food Security in Nutrient-Stressed Environments: Exploiting Plants’ Genetic Capabilities; Adu-Gyamfi, J.J., Ed.; Developments in Plant and Soil Sciences; Springer: Dordrecht, The Netherlands, 2002; Volume 95, pp. 201–213. [Google Scholar] [CrossRef]
  88. Beniash, E.; Ivanina, A.; Lieb, N.S.; Kuronchkin, I.; Sokolova, I.M. Elevated level of carbon dioxide affects metabolism and shell formation in oysters Crassostrea virginica. Mar. Ecol. Prog. Ser. 2010, 419, 95–108. [Google Scholar] [CrossRef]
  89. Waldbusser, G.G.; Steenson, R.A.; Green, M.A. Oyster shell dissolution rates in estuarine waters: Effects of pH and shell legacy. J. Shellfish Res. 2011, 30, 659–669. [Google Scholar] [CrossRef]
  90. Keppel, A.G.; Breitburg, D.L.; Burrell, R.B. Effects of co-varying diel-cycling hypoxia and pH on growth in the juvenile Eastern oyster, Crassostrea virginica. PLoS ONE 2016, 11, e0161088. [Google Scholar] [CrossRef]
  91. Reef, R.; Feller, I.C.; Lovelock, C.E. Nutrition of mangroves. Tree Physiol. 2010, 30, 1148–1160. [Google Scholar] [CrossRef]
  92. Kellogg, M.L.; Cornwell, J.C.; Owens, M.S.; Paynter, K.T. Denitrification and nutrient assimilation on a restored oyster reef. Mar. Ecol. Prog. Ser. 2013, 480, 1–19. [Google Scholar] [CrossRef]
  93. Malhotra, H.; Vandana, S.S.; Pandey, R. Phosphorus nutrition: Plant growth in response to deficiency and excess. In: Hasanuzzaman, M., Fujita, M., Oku, H., Nahar, K., Hawrylak-Nowak, B., Eds. Plant Nutr. Abiotic Stress Toler. 2018, 7, 171–190. [Google Scholar]
  94. Jones, C.G.; Lawton, J.H.; Shachak, M. Organisms as ecosystem engineers. Oikos 1994, 69, 373–386. [Google Scholar] [CrossRef]
  95. Jones, C.G.; Lawton, J.H.; Shachak, M. Positive and negative effects of organisms as physical ecosystem engineers. Ecology 1997, 78, 1946–1957. [Google Scholar] [CrossRef]
  96. McAfee, D.; Bishop, M.J. The mechanisms by which oysters facilitate invertebrates vary across environmental gradients. Oecologia 2019, 189, 1095–1106. [Google Scholar] [CrossRef]
  97. Drexler, M.; Parker, M.L.; Geiger, S.P.; Arnold, W.S.; Hallock, P. Biological assessment of eastern oysters (Crassostrea virginica) inhabiting reef, mangrove, seawall, and restoration substrates. Estuaries Coasts 2014, 37, 962–972. [Google Scholar] [CrossRef]
  98. Aquino-Thomas, J.; Proffitt, C.E. Oysters (Crassostrea virginica) on red mangrove Rhizophora mangle prop roots: Facilitation of one foundation species by another. Mar. Ecol. Prog. Ser. 2014, 503, 177–194. [Google Scholar] [CrossRef]
  99. Bishop, M.J.; Byers, J.E.; Marcek, B.J.; Gribben, P.E. Density-dependent facilitation cascades determine epifaunal community structure in temperate Australian mangroves. Ecology 2012, 93, 1388–1401. [Google Scholar] [CrossRef] [PubMed]
  100. Grabowski, J.H.; Brumbaugh, R.D.; Conrad, R.F.; Keeler, A.G.; Opaluch, J.J.; Peterson, C.H.; Piehler, M.F.; Powers, S.P.; Smyth, A.R. Economic valuation of ecosystem services provided by oyster reefs. Bioscience 2012, 62, 900–909. [Google Scholar] [CrossRef]
  101. East Central Florida Regional Planning Council Treasure Coast Regional Planning Council. Indian River Lagoon Economic Valuation Update Final Report; Treasure Coast Regional Planning Council: Stuart, FL, USA, 2016; Available online: https://files.tcrpc.org/portfolio%20of%20work/Economic%20Development/IRL%20Valuation/FinalReportIRL08_26_2016.pdf (accessed on 10 June 2024).
  102. Indian River Lagoon National Estuary Program. Comprehensive Conservation and Management Plan; The Indian River Lagoon NEP: Sebastian, FL, USA, 2019; Available online: https://onelagoon.org/wp-content/uploads/IRLNEP_Final-Draft-CCMP-REVISION_2018-12-07_LowRes__20200204.pdf (accessed on 1 June 2024).
  103. The Nature Conservancy. Valuing the Flood Risk Reduction Benefits of Florida’s Mangroves; Nature Conservancy: Mountainair, NM, USA, 2017; Available online: https://www.conservationgateway.org/SiteAssets/Pages/floridamangroves/Mangrove_Report_digital_FINAL.pdf (accessed on 1 June 2024).
Figure 1. Photos showing (A) red mangroves (Rhizophora mangle) growing on an intertidal oyster reef and (B) R. mangle seedlings growing amongst black mangroves (Avicennia germinans).
Environments 11 00193 g001
Figure 2. Map of the study area.
Environments 11 00193 g002
Figure 3. Density of red mangrove survival increased greatly once the mangrove:oyster area, reported as percent of total area, was above 50% (triangles, solid line) versus below 50% (circles, dotted line).
Environments 11 00193 g003
Figure 4. Survival probability for arrival cohorts 1 and 2, separated by arrival location and time. Close = propagules that landed ≤0.3 m from adult mangroves on reef, far = mangroves that landed over 0.3 m from adult mangroves.
Environments 11 00193 g004
Figure 5. Adult mangrove nursery impact on arrival cohorts 1–3 when the propagule landed ≤0.3 m (=close) or 0.3+ m (=far) from adult mangroves on oyster reefs. (A) Mean height of cohorts at the end of the study (December 2021), (B) mean number of leaves of cohorts at end of study.
Environments 11 00193 g005
Table 1. Mangrove propagule metrics on intertidal oyster reefs in Mosquito Lagoon. Cohort 1 = September–November 2020, Cohort 2 = December 2020–April 2021.
Red MangrovesBlack MangrovesWhite MangrovesAll Mangroves
Number tracked1523 (90.6%)157 (9.3%)1 (0.1%)1681 (100%)
Number alive at month 15201 (13.2%)1 (0.6%)0 (0.0%)202 (12.0%)
Arrival monthsAll months except MayDecember–MarchOctoberAll months except May
Number that produced leaves by month 15168 (cohort 1 only)23 (cohort 2 only)1 (cohort 1 only)192
Month of initial leaf productionAll months of yearJanuary–AugustDecemberAll months of the year
Number alive at month 15 with no leaf production30 (cohort 1 only)0030
Disclaimer/Publisher’s Note: The statements, opinions and data contained in all publications are solely those of the individual author(s) and contributor(s) and not of MDPI and/or the editor(s). MDPI and/or the editor(s) disclaim responsibility for any injury to people or property resulting from any ideas, methods, instructions or products referred to in the content.

