Article

Quantification and Categorization of Macroplastics (Plastic Debris) within a Headwaters Basin in Western North Carolina, USA: Implications to the Potential Impacts of Plastic Pollution on Biota

by
Nathaniel Barrett
1,*,
Jerry Miller
1 and
Suzanne Orbock-Miller
2
1
Department of Geosciences and Natural Resources, Western Carolina University, Cullowhee, NC 28723, USA
2
Tuscola Highschool, Waynesville, NC 28786, USA
*
Author to whom correspondence should be addressed.
Environments 2024, 11(9), 195; https://doi.org/10.3390/environments11090195
Submission received: 11 July 2024 / Revised: 6 September 2024 / Accepted: 6 September 2024 / Published: 10 September 2024
(This article belongs to the Special Issue Plastics Pollution in Aquatic Environments)

Abstract

:
Plastic production on a commercial scale began in the 1950s, reaching an annual production of 460 million metric tons in 2019. The global release of 22% of produced plastics into the environment has raised concerns about their potential environmental impacts, particularly on aquatic ecosystems. Here, we quantify and categorize plastic debris found along Richland Creek, a small, heavily forested watershed in western North Carolina, USA. Plastics within the riparian zone of seven 50 m reaches of Richland Creek and its tributaries were sampled two or three times. The 1737 pieces of collected plastic debris were returned to the lab where they were measured and categorized. A small-scale laboratory study using seven of the items collected was performed to determine their ability to break down into microplastics (particles < 5 mm in size). The majority (76%) of collected items were made of either plastic film (particularly bags and food wrappers, 43%) or hard plastics (e.g., bottles, 2%). However, when viewed on a surface area basis, films and synthetic fabrics (e.g., clothing, sleeping bags) equally dominated. Roughly three-quarters of the items collected had a width less than 10 cm, due primarily to the fragmentation of the original items; over two-thirds of the collected items were fragmented. Items composed of foams and films exhibited the highest fragmentation rates, 93% and 86%, respectively. Most collected plastics were domestic in nature, and the number of items increased downstream through more developed areas. Laboratory studies showed that plastic debris has a propensity to break down into microplastics. We believe the data collected here should be replicated in other streams, as these freshwater environments are the source of plastics that eventually enter the oceans.

1. Introduction

Since the 1950s, plastics have increasingly been produced on a commercial scale, globally reaching an annual production of 460 million metric tons in 2019 alone [1]. The societal benefits of plastics are widespread and include improved health and safety, energy savings [2], and increased convenience and entertainment. However, globally, only about 9% of plastics are recycled, whereas 22% are released to the environment, a significant percentage that ultimately enters aquatic ecosystems [3]. The issue of plastic pollution is growing at an alarming rate. Plastic debris of various sizes can be found in the most remote areas of the planet, including ice and snow in polar regions, the depths of the oceans, and along the banks of secluded mountain streams [4,5,6,7,8]. Reports of plastic waste in oceans date back to at least the 1970s [9,10], and the problem has only become worse since these earliest reports [11].
While there is growing awareness of plastic pollution in oceanic and coastal environments [4,12], much less information is available on the presence and composition of plastics within freshwater environments, especially in rivers and streams [13,14]. Studying plastics in freshwater environments is important not only to better understand how to protect lacustrine and riverine ecosystems, but also because about 80% of the plastics in marine environments is thought to originate from rivers, particularly those draining from urban areas [15].
Plastic debris is often subdivided into four categories, nano-, micro-, meso-, and macroplastics. Nanoplastics, which have particles smaller than 100 μm in their largest dimension, have historically been included with microplastics (particles < 5 mm in size) but are generally considered a separate category today. The plastic litter we typically see along roads and in streams fall into the category of mesoplastics (5 mm to 2.5 cm) and macroplastics (>2.5 cm). The potential environmental consequences of plastic debris of all sizes are now topics of intense study and debate. Nonetheless, plastic pollution is widely accepted as a contaminant of significant concern within freshwater ecosystems on a global scale.
In spite of the potential environmental impacts of plastic debris on aquatic, riparian, and terrestrial biota, we were unable to find a single refereed paper that addressed some of the most basic questions pertaining to meso- and macroplastic debris along freshwater rivers in the southeastern U.S., including the following: (1) What is the abundance of plastic debris along river channels and what factors control its spatial distribution? (2) What are the predominant plastic items found along river channels in terms of their functional origin? (3) What shapes of microplastics can these larger pieces of debris produce? (4) Does the larger debris actually represent a significant source of microplastics in the water column? Here, we investigate the quantity and characteristics of plastic debris and its propensity to break down into microplastics within the Richland Creek watershed, a small (148 km2), predominately forested headwater basin in western North Carolina, USA, to answer these questions. The answers to these questions provide insights into the potential ecological impacts of plastic pollution on aquatic and terrestrial biota and provide data needed to make policy decisions regarding the use of various types of plastic items. The study is unique not only in that it addresses these questions in a new area, but because nearly all previous investigations have been conducted on the downstream portions of larger, highly developed rivers or on freshwater lakes (e.g., the Great Lakes at the Canada–United State border). This is in spite of the fact that about 70% of the total river length in the contiguous U.S. is found in small watersheds [16].

2. Materials and Methods

2.1. Study Area

The Richland Creek watershed is a small headwater basin, roughly 148 km2 long, in the southern Blue Ridge mountains of western North Carolina. Richland Creek originates in high-elevation, forested areas of the mountains before flowing through the town of Waynesville. Although Waynesville is one of the largest towns in western North Carolina, with a population just over 10,000 [17], more than 70% of the basin is forested; about 20% consists of low-, medium-, and high-intensity development. In general, the area of medium- to high-intensity development increases downstream through our study area (Figure 1 and Figure S1). This longitudinal gradient of increasing development allows for the opportunity to study plastic waste deposition from minimally impacted headwater areas through more intensively developed reaches. The watershed studied herein is representative of many similar small watersheds in the Appalachian Mountains of the eastern U.S., which extend from northern Georgia to Maine, and into southeastern Canada. In the Appalachians, we expect many headwater streams to pass through towns such as Waynesville and have similar opportunities for plastic waste to contaminate their waters.

2.2. Collection and Characterization of Plastic Debris

Several different methods have been previously used to assess the amount and nature of plastic debris transported through rivers, including floating debris retention booms [19], manta netting, drift netting, and other forms of netting (300 μm mesh) [20,21,22], and submerged eel fyke nets [23]. Our interest in this study was less on the amount of plastic transported to marine or coastal areas and more on the amount and type of plastic debris deposited within the riparian zone of our study area. Thus, we utilized debris assessment surveys modified from Lippiatt et. al. [24] and Blettler et al. [25] that have often been applied to marine and lacustrine shorelines. In essence, plastic debris was collected along 50 m reaches of the channel banks and inundated areas of the floodplain (which are collectively referred to hereafter as the riparian zone). The width of the sampled area varied between sites, as the width of the riparian zone also varies and is controlled by geomorphologic factors (e.g., bank height, inset benches, topographic relief, and the occurrence of terraces). Here, we defined the riparian zone as an area which has been frequently inundated within the past ~10 years. This area was identified on the basis of topography, vegetation type [26], high water indicators such as flood debris, and direct observations. Initially, the 50 m surveys included the detailed collection of particles between 0.5 mm and 2.5 cm in size within randomly located 1 m2 quadrants. This approach, however, proved ineffective for heavily vegetated riparian areas. Thus, the collection of plastic debris from the quadrants was discontinued and particles >~0.5 cm in size were collected along the 50 m transects. Plastic size categories in the present study were defined as follows: microplastics are plastics less than 5 mm in their largest dimension, mesoplastics are between 5 mm and 2.5 cm in size, and macroplastics are larger than 2.5 cm in their smallest dimension.
The approach does not directly determine the amount of plastic debris that is transported through a river, but it possesses several important advantages over previously used methods, including (1) providing insights into the quantity and characteristics of plastic debris that is deposited and stored along the channel banks and which is most accessible to aquatic and riparian biota; (2) the fact that the surveys can be conducted following major floods and can be used to characterize plastic debris that is deposited by the river over periods ranging from days to months; and (3) the fact that the surveys include plastics transported near the surface of the water as well as at depth (although we suspect that the deposited plastics within the riparian zone are biased toward floating debris). Moreover, the surveys are relatively easy and inexpensive to conduct, allowing them to be implemented by individuals with limited technical expertise. Its ease of application is important because it allows for the collection of comparable data over a large number of sites. In this study, the collection surveys were undertaken primarily by students from Tuscola High School and volunteers from the Haywood Waterways Association (a non-profit organization), both of which worked in conjunction with faculty and staff from Western Carolina University (including the paper’s authors). More specifically, sampling was conducted along seven 50 m reaches, five of which were located along the axial channel of Richland Creek (sites 1, 3, and 5–7) and two along two of its tributaries (sites 2 and 4) (Figure 1). In total, 350 m of riparian zone were analyzed. At each site, only one side of the channel was sampled because of property accessibility issues at some sites. During the site selection, we attempted to choose reaches that were similar with regards to their geomorphic and vegetational characteristics and which were located along a longitudinal gradient of increasing basin development. However, while most sites were dominated by abundant brushy vegetation on relatively high (>2 m), steep banks, sites 1 and 5 both possessed more gradual banks that were characterized by some grass-covered areas, devoid of significant brushy vegetation.
During the first sampling event, all plastic pieces within the entire riparian zone were collected. During the following collections, items were obtained only from the area that had been inundated since the previous collection date. Debris was collected at two or three different times (depending on the site) to determine the rate at which plastic items re-accumulated at the sites. Blettler et al. [25] calculated the concentration of plastic debris at a site as the number of items collected per square meter. During this study, however, the steepness and height of the channel banks varied both at a site and between sites, making the accurate determination of the area from which plastics were collected difficult. Thus, the abundance or concentration of plastic debris is presented in terms of items per linear meter of riparian zone (on one side of the channel). This method of quantification is also appropriate in the current study as we wish to understand the transport of plastic debris longitudinally along the creek and its deposition in the riparian zone as a whole within these reaches. The rate of re-accumulation was calculated on a number of items per day basis, using the number of plastics found on subsequent collections. During the collections, not only were plastic items picked up, but all anthropogenic waste that was present was removed from the reach. The non-plastic items were recycled or landfilled, as their composition allowed.
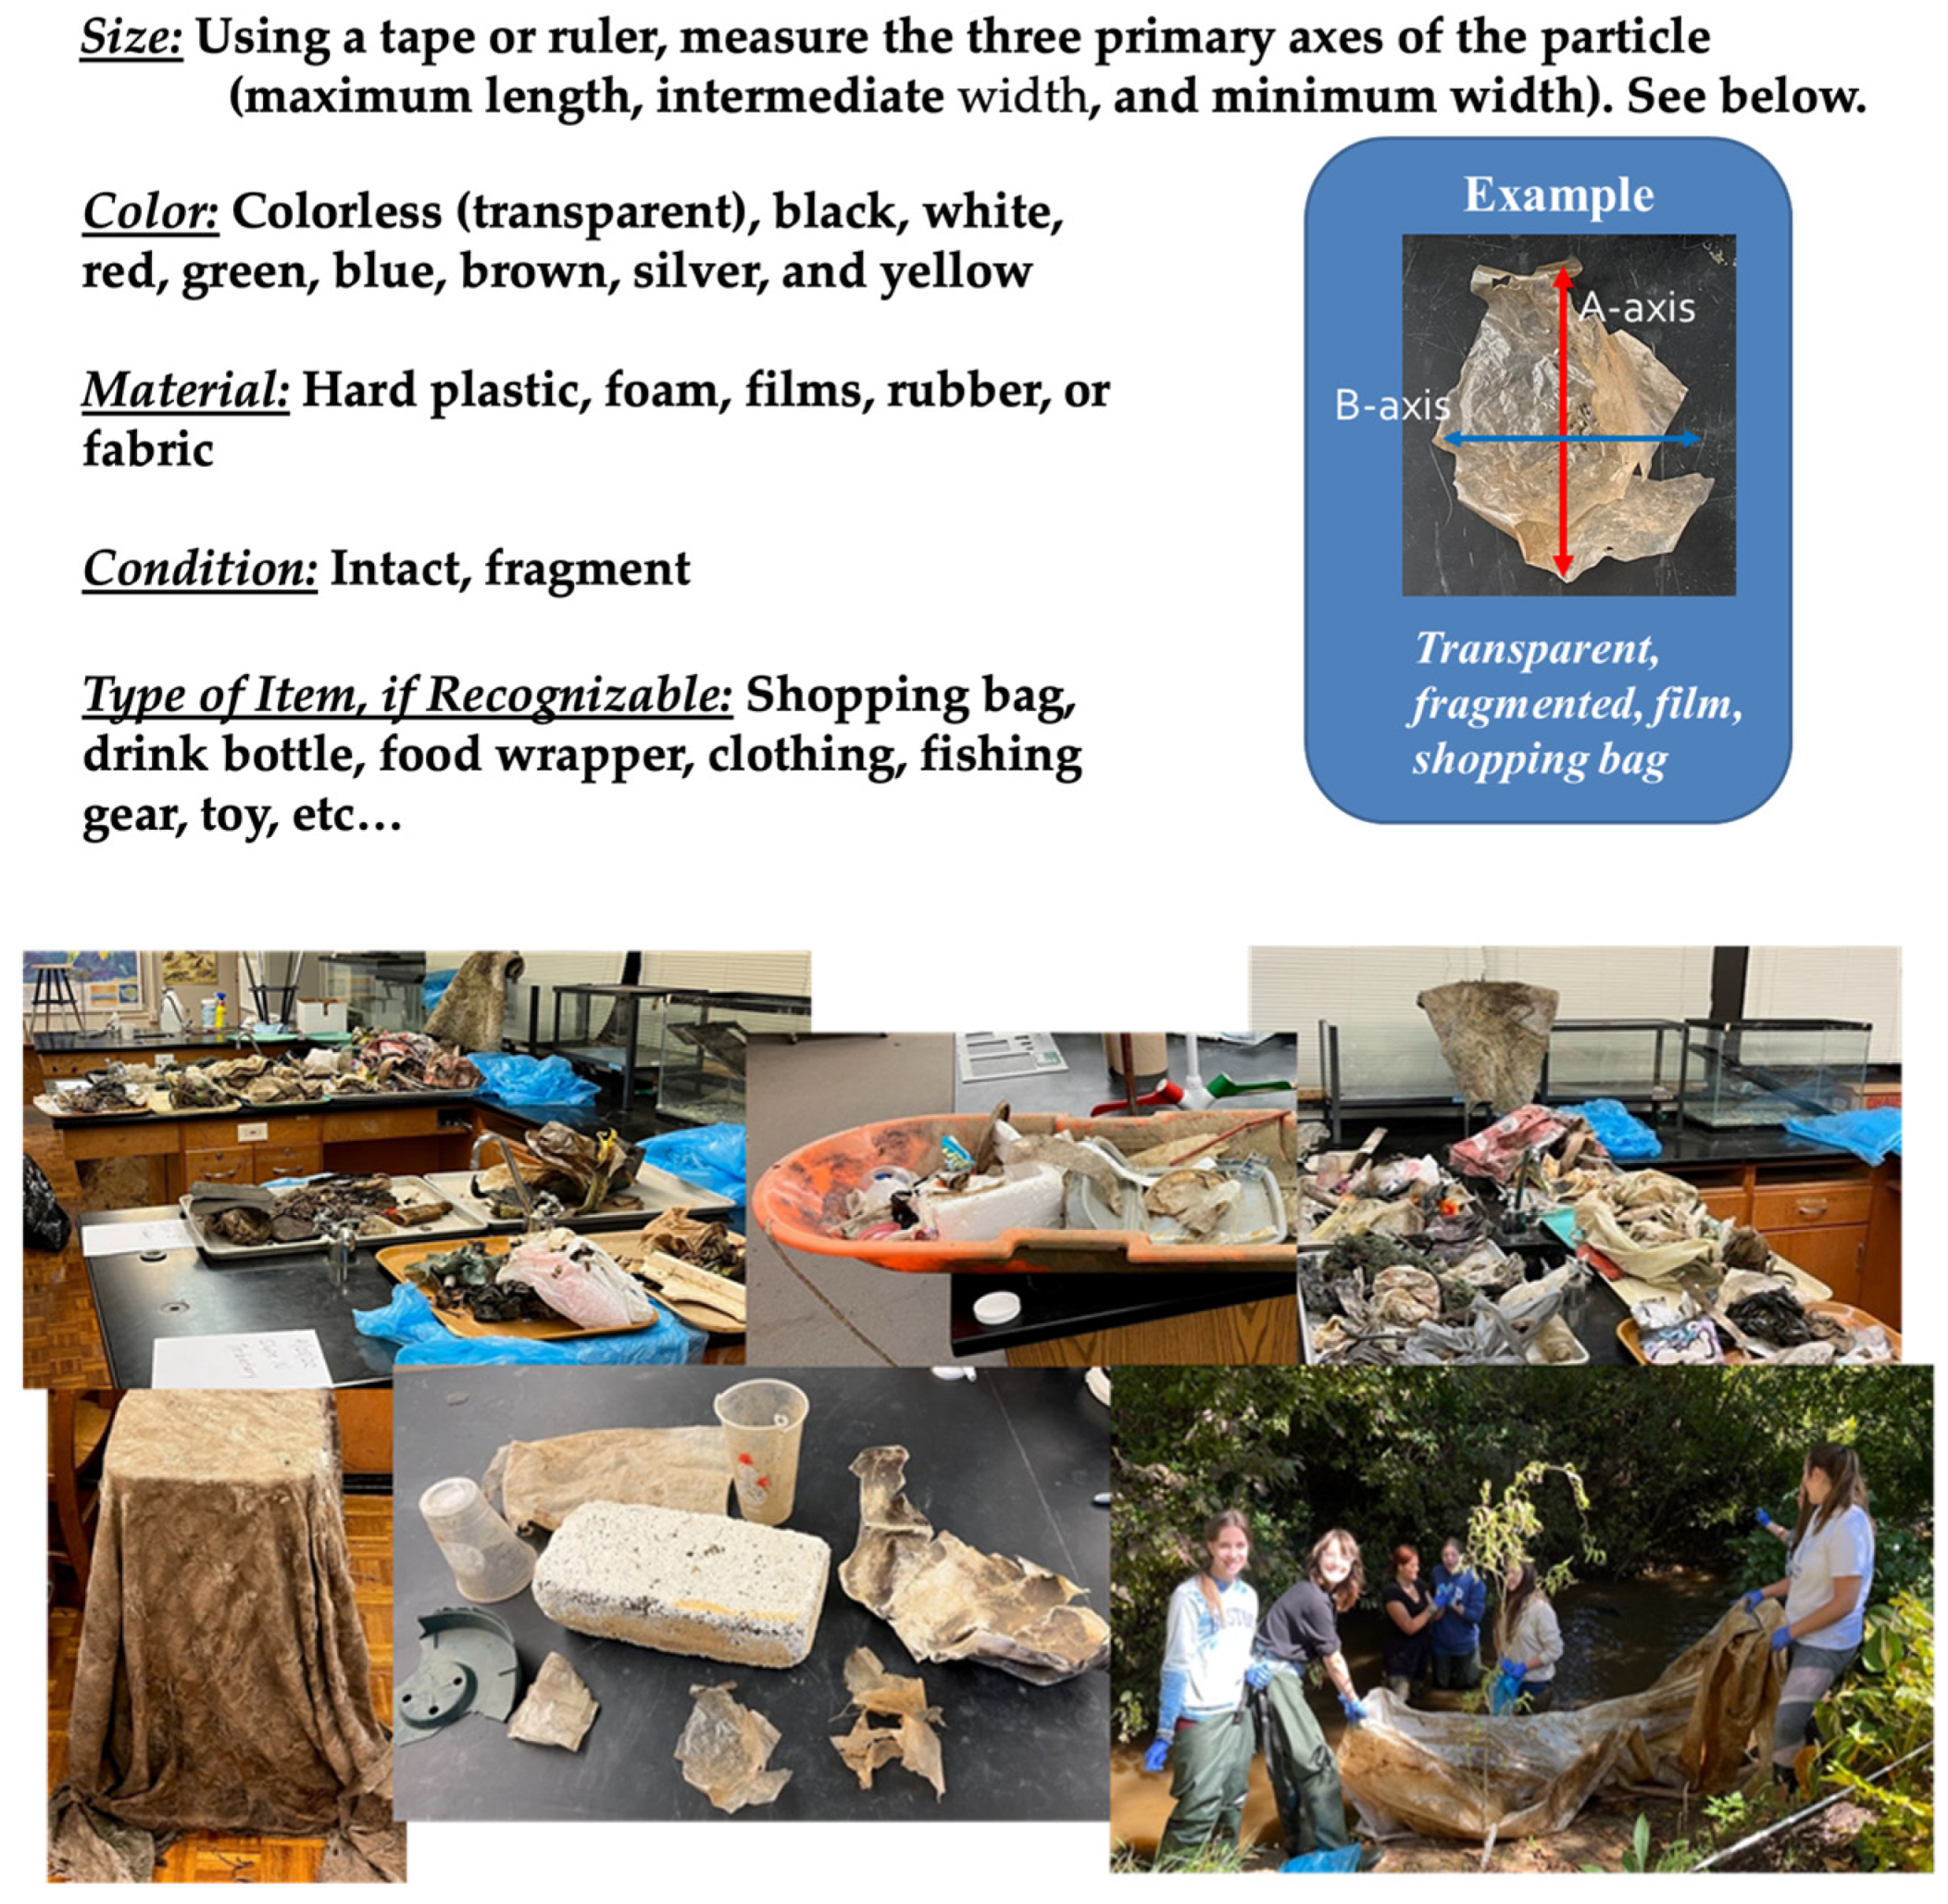
The collected plastic items were returned to the lab where they were allowed to dry before they were characterized in terms of their size, color, material composition (film, foam, fabric, hard plastic, rubber), and condition (fragmented; non-fragmented) after the methods described in Lippiatt et. al. [24] and Blettler et al. [25] (Figure 2). The original functional use of the items (bag, bottle, food wrapper, etc.) was also recorded if it could be determined. With respect to size, measurements were made along the item’s length (A-axis), width (B-axis), and if the item was >0.2 mm, thickness (C-axis). The surface area of the items was then calculated for each item using its A- and B-axis dimensions. In terms of size, B-axis measurements will be used in the discussion below as they are intermediate to the A- and C-axis measurements, and as has been shown for sediments, provide a general description of the particle’s “mean” size. For example, the B-axis dimensions control the size of particle that can fit through a sieve of a given mesh. The color of the plastic particles was described because it may influence the attraction of biota to the plastic debris and its subsequent ingestion (or entanglement). Ríos and colleagues [27] found, for example, that one omnivorous species of freshwater fish was attracted to plastics colored yellow or blue, while they avoided those colored white. Other studies have suggested that color may control the feeding and breeding behavior of aquatic invertebrates [28,29,30].
After the items were characterized, some of the plastic particles were retained for a microplastic production study (described below). The remaining items were recycled or landfilled as their material allowed, as with the non-plastic items.
It was generally not possible to determine an item’s composition based on the American Society for Testing and Materials (ASTM) International Resin Identification Coding System. Thus, an item’s resin composition was based on the item’s original functionality category and the most commonly used resin for those items (Table 1). For example, plastic bags are typically composed of high- or low-density polyethylene (HDPE, LDPE), and both were cited as possible resin types below.

2.3. Laboratory Microplastic Production Analysis

To determine the ability of certain materials to break down into microplastics, a small-scale study was performed using items collected from the study sites. During this study, seven different items were selected for analysis, including three different types of fabric (including carpet and two other textiles, which appeared to originate from furniture), a new and an old grocery bag, and a new and an old foam cup (Figure 3). From each of these samples, 2 × 2 cm sections were subsampled from the materials (including four sections of the grocery bags and two sections for the other items). These subsamples were then placed into a clean Erlenmeyer flask, along with 20 mL of clean gravel and 100 mL of filtered deionized water. The gravel was intended to provide a degree of roughness to the flask, similar to that found within the stream bed. A sample blank (gravel and water only) was also analyzed. Four replicate flasks of each sample and the blank were created. Flasks were covered with aluminum foil then placed onto orbital shakers (New Brunswick Scientific Co., Inc., Edison, NJ, USA; Model: Classic C1), after which they were agitated at 20 rpm for one week. The contents of the flasks were subsequently poured through a 500 µm sieve (Dual Mfg. Co., Franklin Park, IL, USA) that had been placed on top of a glass microfiber (Whatman plc, Maidstone, Kent, UK; Cat No. 1820-047) vacuum filtration system. The sample material and the gravel collected in the sieve were rinsed with filtered deionized water. The material caught on the glass microfiber filter was considered the sample. Microplastics were identified visually under a dissection microscope. The filtration method described above allows for sufficient debris to be removed, leaving only a small amount of sand, organic material, and microplastic particles on the glass microfiber filter. Microplastic particles will stand out against the sediment and organic material due to their distinct shape and color, allowing them to be easily identified and counted. More information pertaining to the visual analysis of the microplastics can be found in Miller et al. [33].

2.4. Spatial Land Use and Terrain Analysis

A geographic information system (ArcGIS Pro version 10.4.1) was developed to manage and manipulate spatial data within the Richland Creek basin. The data layers, in general, include the drainage network (drainage divides and streams), land use and land cover, topography, soil types, and sampling locations, among others. Land use and land cover data are of particular importance to this study. These data were obtained from the 2021 National Land Cover Database [34], in which land use and land cover are subdivided into 16 categories, including low-intensity, medium-intensity, and high-intensity development, and mapped at a 30 m spatial resolution. Areas of high- to medium-intensity development were combined to characterize the amount of urban development within the basin upstream of each sampling site. The area characterized by low-intensity development was also determined, along with the area and percentage of the basin covered by open water, wetlands, barren ground, forests, and other types of vegetation.

3. Results

3.1. Land Use Characteristics

Spatial variations in the area of development upstream of the sampling sites are shown in Figure 4; the percentage and total of the upstream basin area encompassed by all of the mapped land use and land cover categories are shown in Figures S1 and S2, respectively, within the Supplemental Materials. The land use at Site 7 is representative of the entire Richland Creek watershed, as it is located just upstream of Lake Junaluska (Figure 1). In general, more than 70% of the basin area upstream of the sampling sites are dominated by forest cover. Other important land use and land cover types include, in order of decreasing abundance, low-intensity development (21.1%), other vegetation, which consists mostly of hay and pasture lands (3.4%), and medium- to high-intensity development (2.5%). The remaining land use consists of barren land, open water, and wetlands, which when combined make up less than 1% of the total area. As Richland Creek moves downstream from Site 1, the proportion of forested area decreases and low- and medium- to high-intensity development increases (Figure 4). The proportion of forested area upstream of Site 2 (Allen Creek, a tributary) is greater than at all other sites, including Site 1. A conservation area, which serves as the drinking water supply for the town of Waynesville, occurs in the headwaters of Allen Creek and contributes to the abundance of forest cover in the watershed.
The tributary basin upstream of Site 4 (Shelton Creek) is relatively small and originates within the town of Waynesville. Much of the basin is utilized as recreational areas (e.g., soccer fields, tennis courts, ball fields, etc.). Thus, the basin upstream of Site 4 contains a much higher proportion of low- (67.3%) and medium- to high (7.7%)-intensity development. However, the overall area of both land use categories is smaller than the other sites (Figure 4 and Figure S2).

3.2. Plastic Debris

3.2.1. Spatial and Temporal Trends in the Quantity of Plastic Debris

Table 2 summarizes the number of collected items of each material type, the number of items per linear meter of riparian zone, and the accumulation rates of plastic items between sampling events (which took place between 28 September 2022 and 20 September 2023). In total, 1737 plastic items were collected during the monitoring period for an average of nearly five plastic items per linear meter of riparian zone. The plastic debris was not, however, uniformly distributed along the channel or over time. Rather, abundances ranged from 0.4 to 5.7 items per linear meter of riparian zone and accumulation rates ranged between 0.1 and 2.1 items per day per reach. In general, both the number of collected items and the accumulation rates increase downstream as Richland Creek traverses the town of Waynesville; both were about four to five times higher at Sites 6 and 7 than upstream at Site 1. Interestingly, with the exception of Site 1, the number of collected items was typically similar to or higher during the second or third collection times than during the initial period, producing the high accumulation rates.

3.2.2. Characteristics of the Plastic Debris

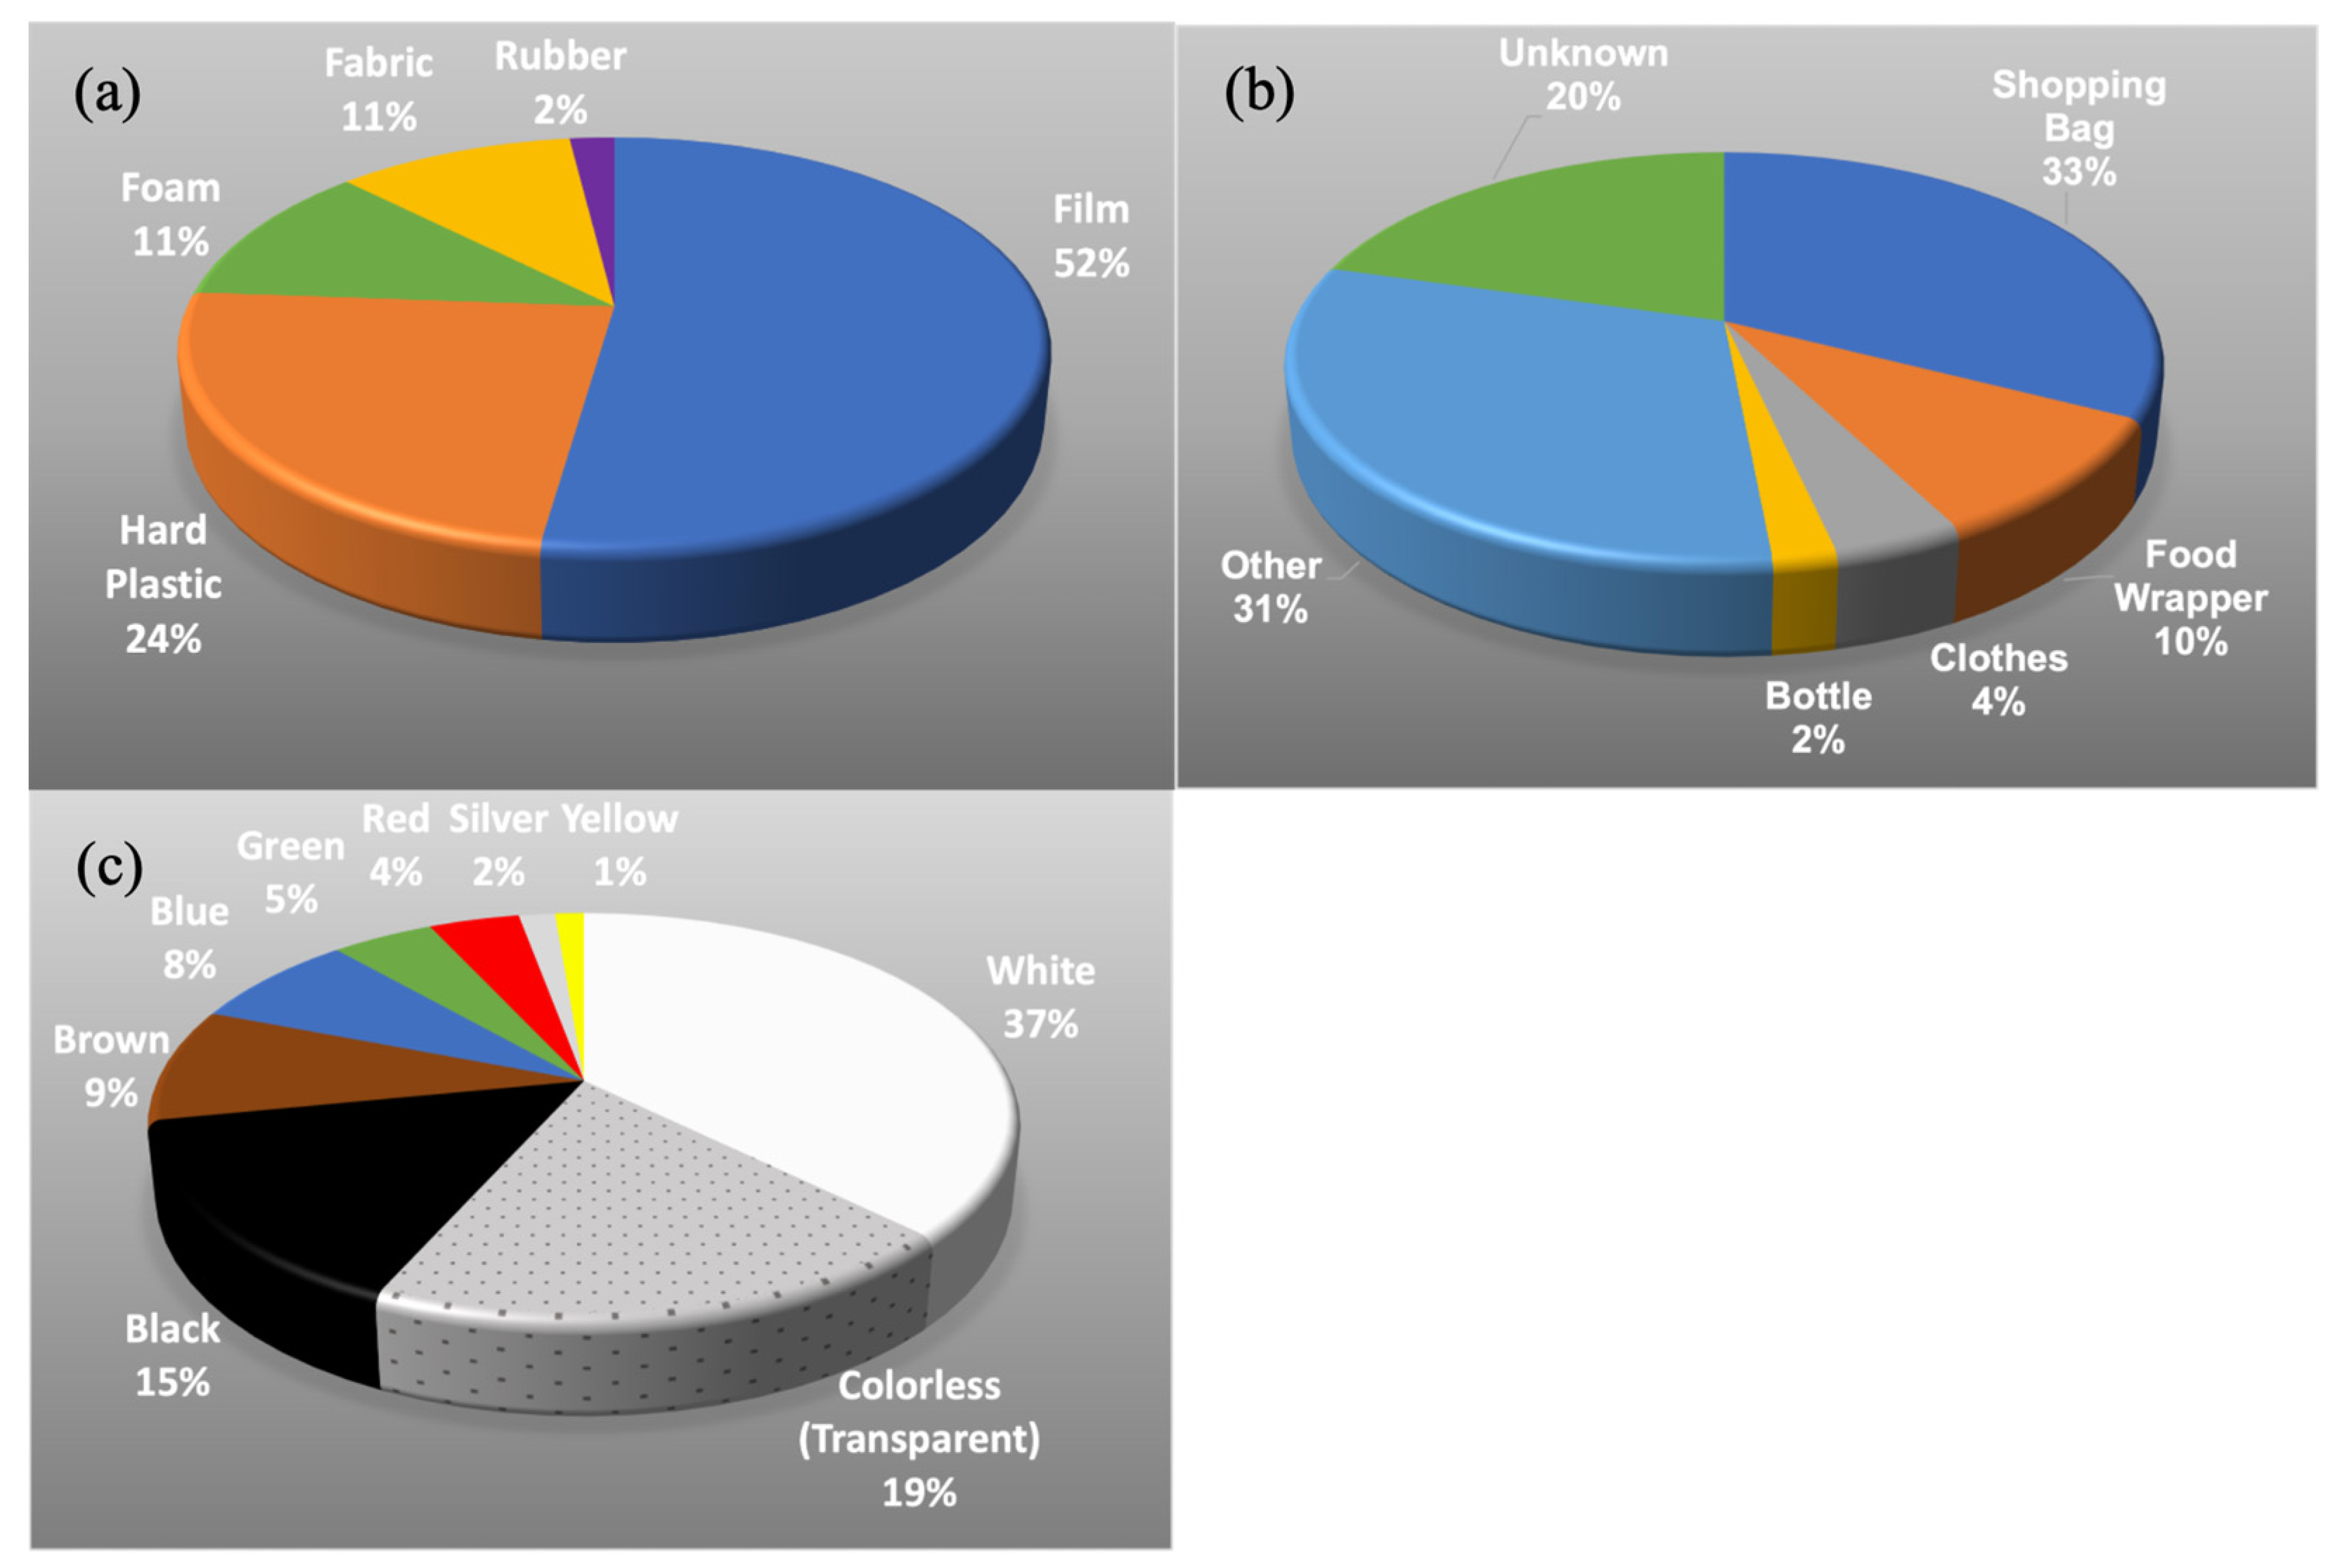
Overall, items made of plastic films were the most numerous, followed by hard plastic, foams, and then fabrics (Figure 5a). Rubber items were found the least often, making up only 2% of all items collected. In general, the frequency with which these items were found were similar between sites and collection dates, although there are some exceptions.
During the first collection event at Site 2 (tributary), films, hard plastic, and foams were much more evenly distributed (31%, 32%, and 27%, respectively) than the overall values. Fabrics were the second most numerous item during the second collection event at Site 3, and at both collections of Site 5. Nearly half of the rubber items (49%) were found during the second collection event at the three most downstream sites.
The most common item collected were shopping bags, followed by food packaging, clothes, and finally bottles (Table 3; Figure 5b). The only sites which deviated from this trend were located along tributaries. At Site 2 (Allen Creek), clothes were the second most common item, whereas at Site 4 (Shelton Creek), clothes were the fourth most numerous item. Roughly 20% of the items collected could not be identified due to the deterioration of the original item; 31% of the items fell into the “other” category, which included industrial hardware, rubber hoses, PVC pipes, electronic cigarettes, recreational equipment, fishing lures and lines, tires, carpet, and geotextiles, among others. Plastic straws were infrequently found, comprising less than 1% (15 straws) of the total. In fact, syringes were significantly more abundant than straws.
Most plastic items were white in color, followed by colorless translucent items (Table 4). Together, these two colors made up over 50% of the items collected (Figure 5c).
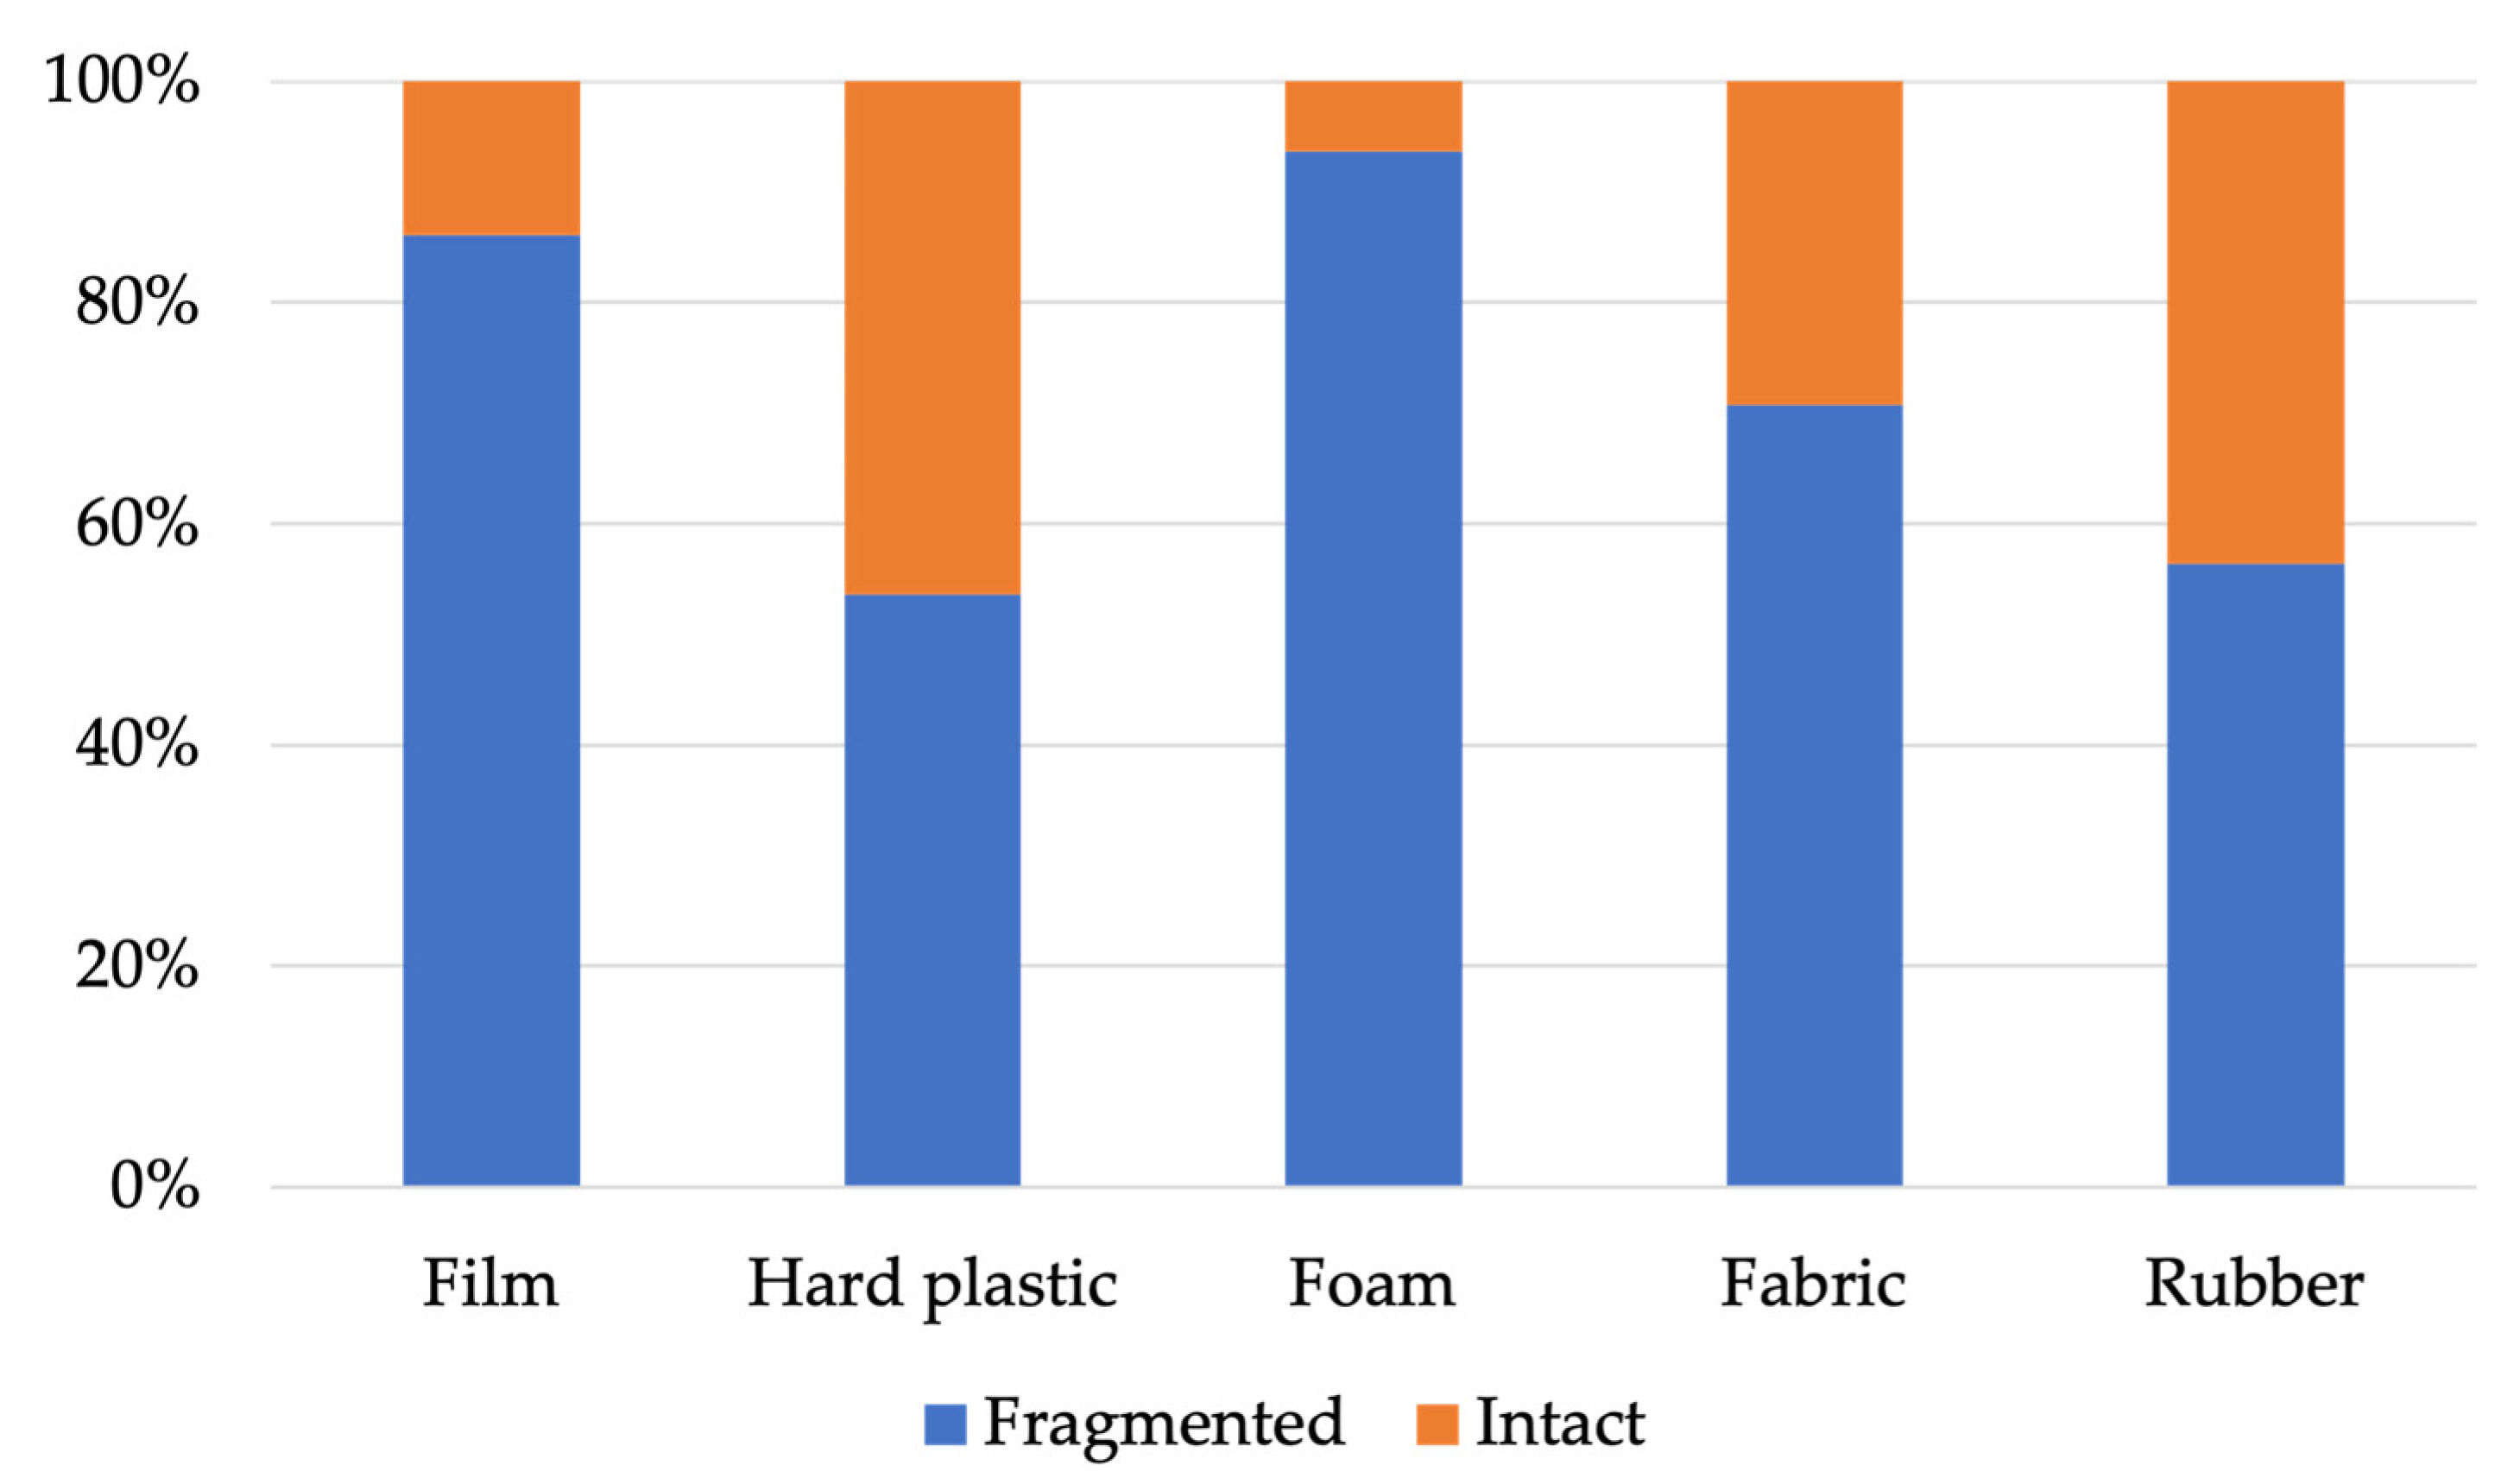
Figure 6 presents the proportion of fragmented versus intact items collected by material type. An item was considered intact if it was not visibly missing any piece of the original item. In contrast, fragmented items were missing at least a small amount of their original plastic. In some cases, the amount missing was so significant that its original use could not be determined. Just over half of the rubber and hard plastic items collected were fragmented. Fabrics were found fragmented over 70% of the time. Films and foams were the most susceptible to fragmentation, with 86% and 94%, respectively, of these items being found as a fragment. Shopping bags were the most fragmented, while food wrappers were the second-most fragmented.
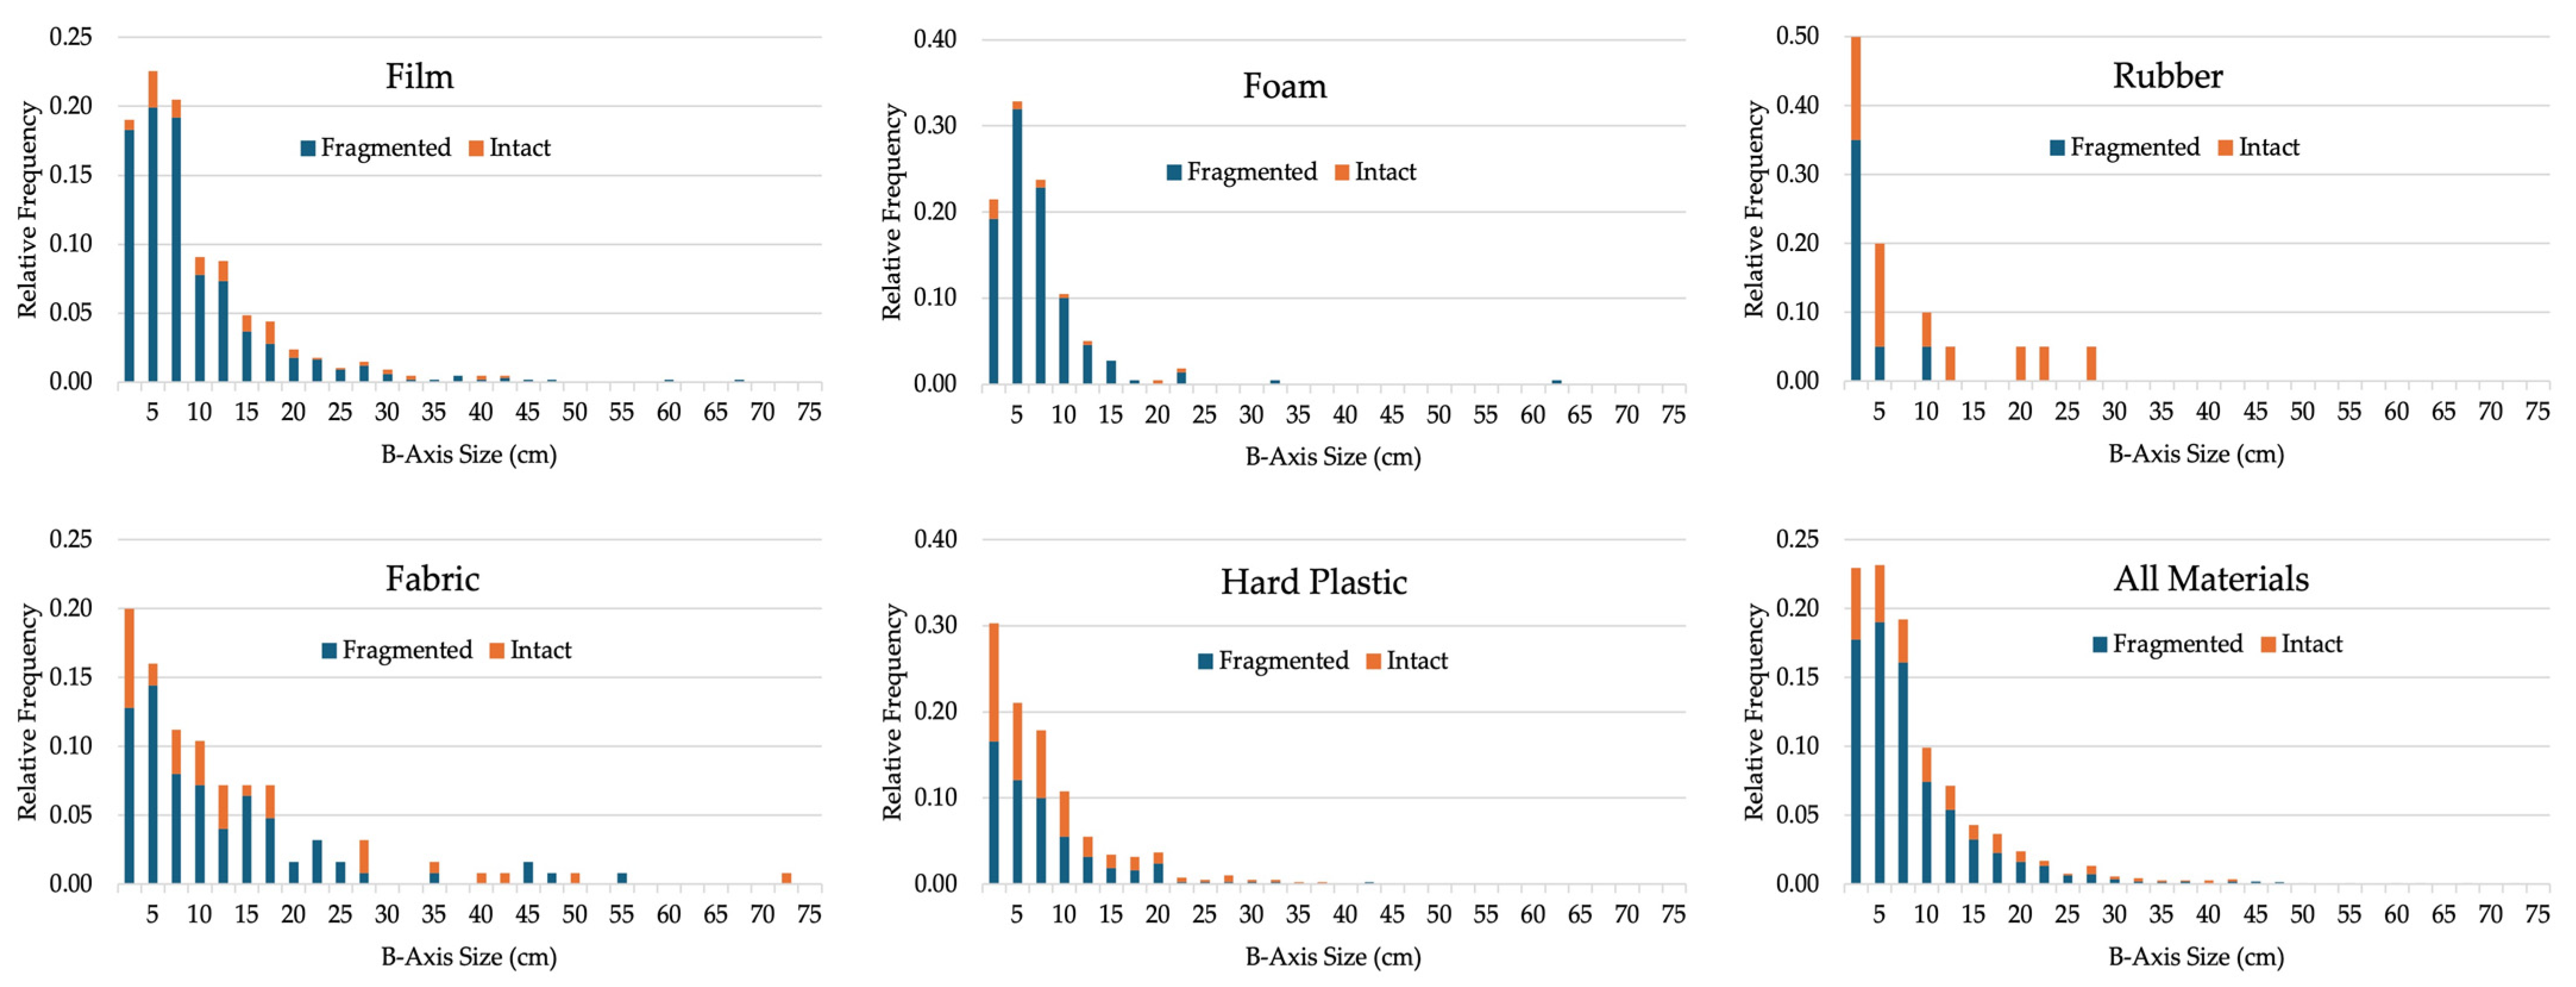
Figure 7 shows the relative frequency of items of a given B-axis size, categorized in 2.5 cm increments. The data are stratified by material type and fragmentation. Nearly half of the items collected measured less than 5 cm on their B-axis, and nearly three-quarters measured less than 10 cm. In general, the proportion of fragmented-to-intact particles was consistent across all particle sizes, regardless of material. Fabrics showed the greatest variation in the B-axis size.
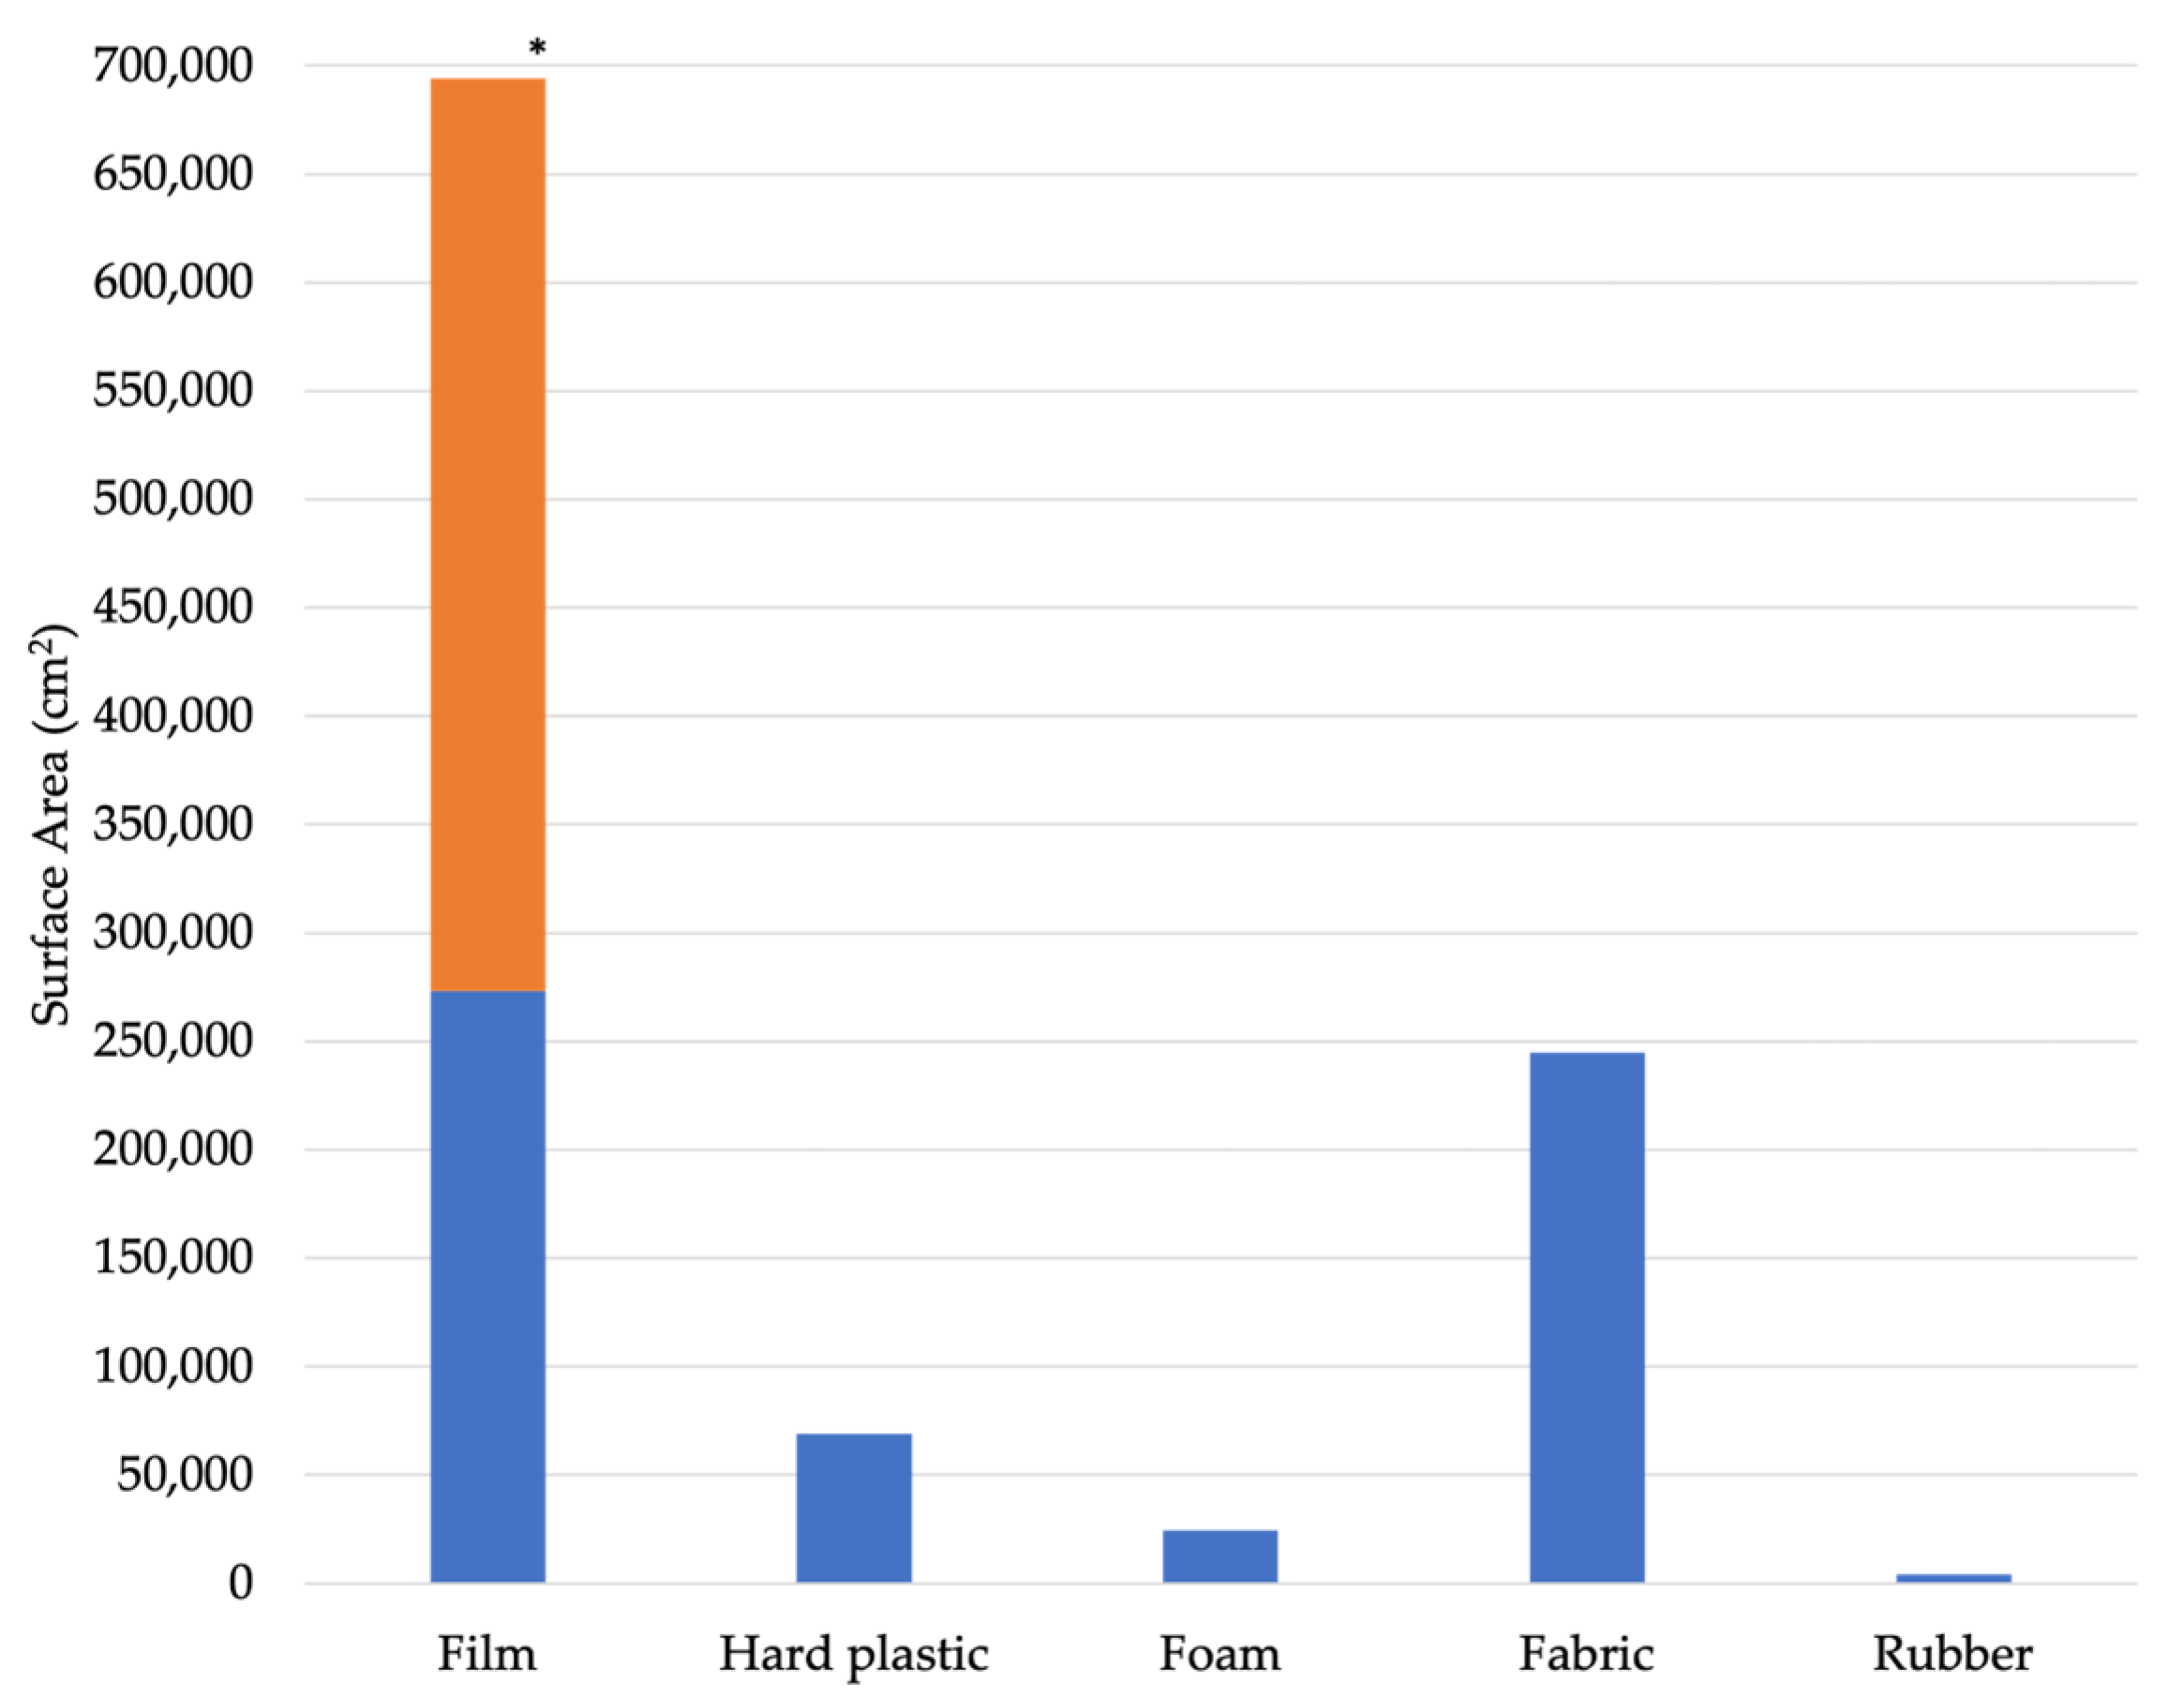
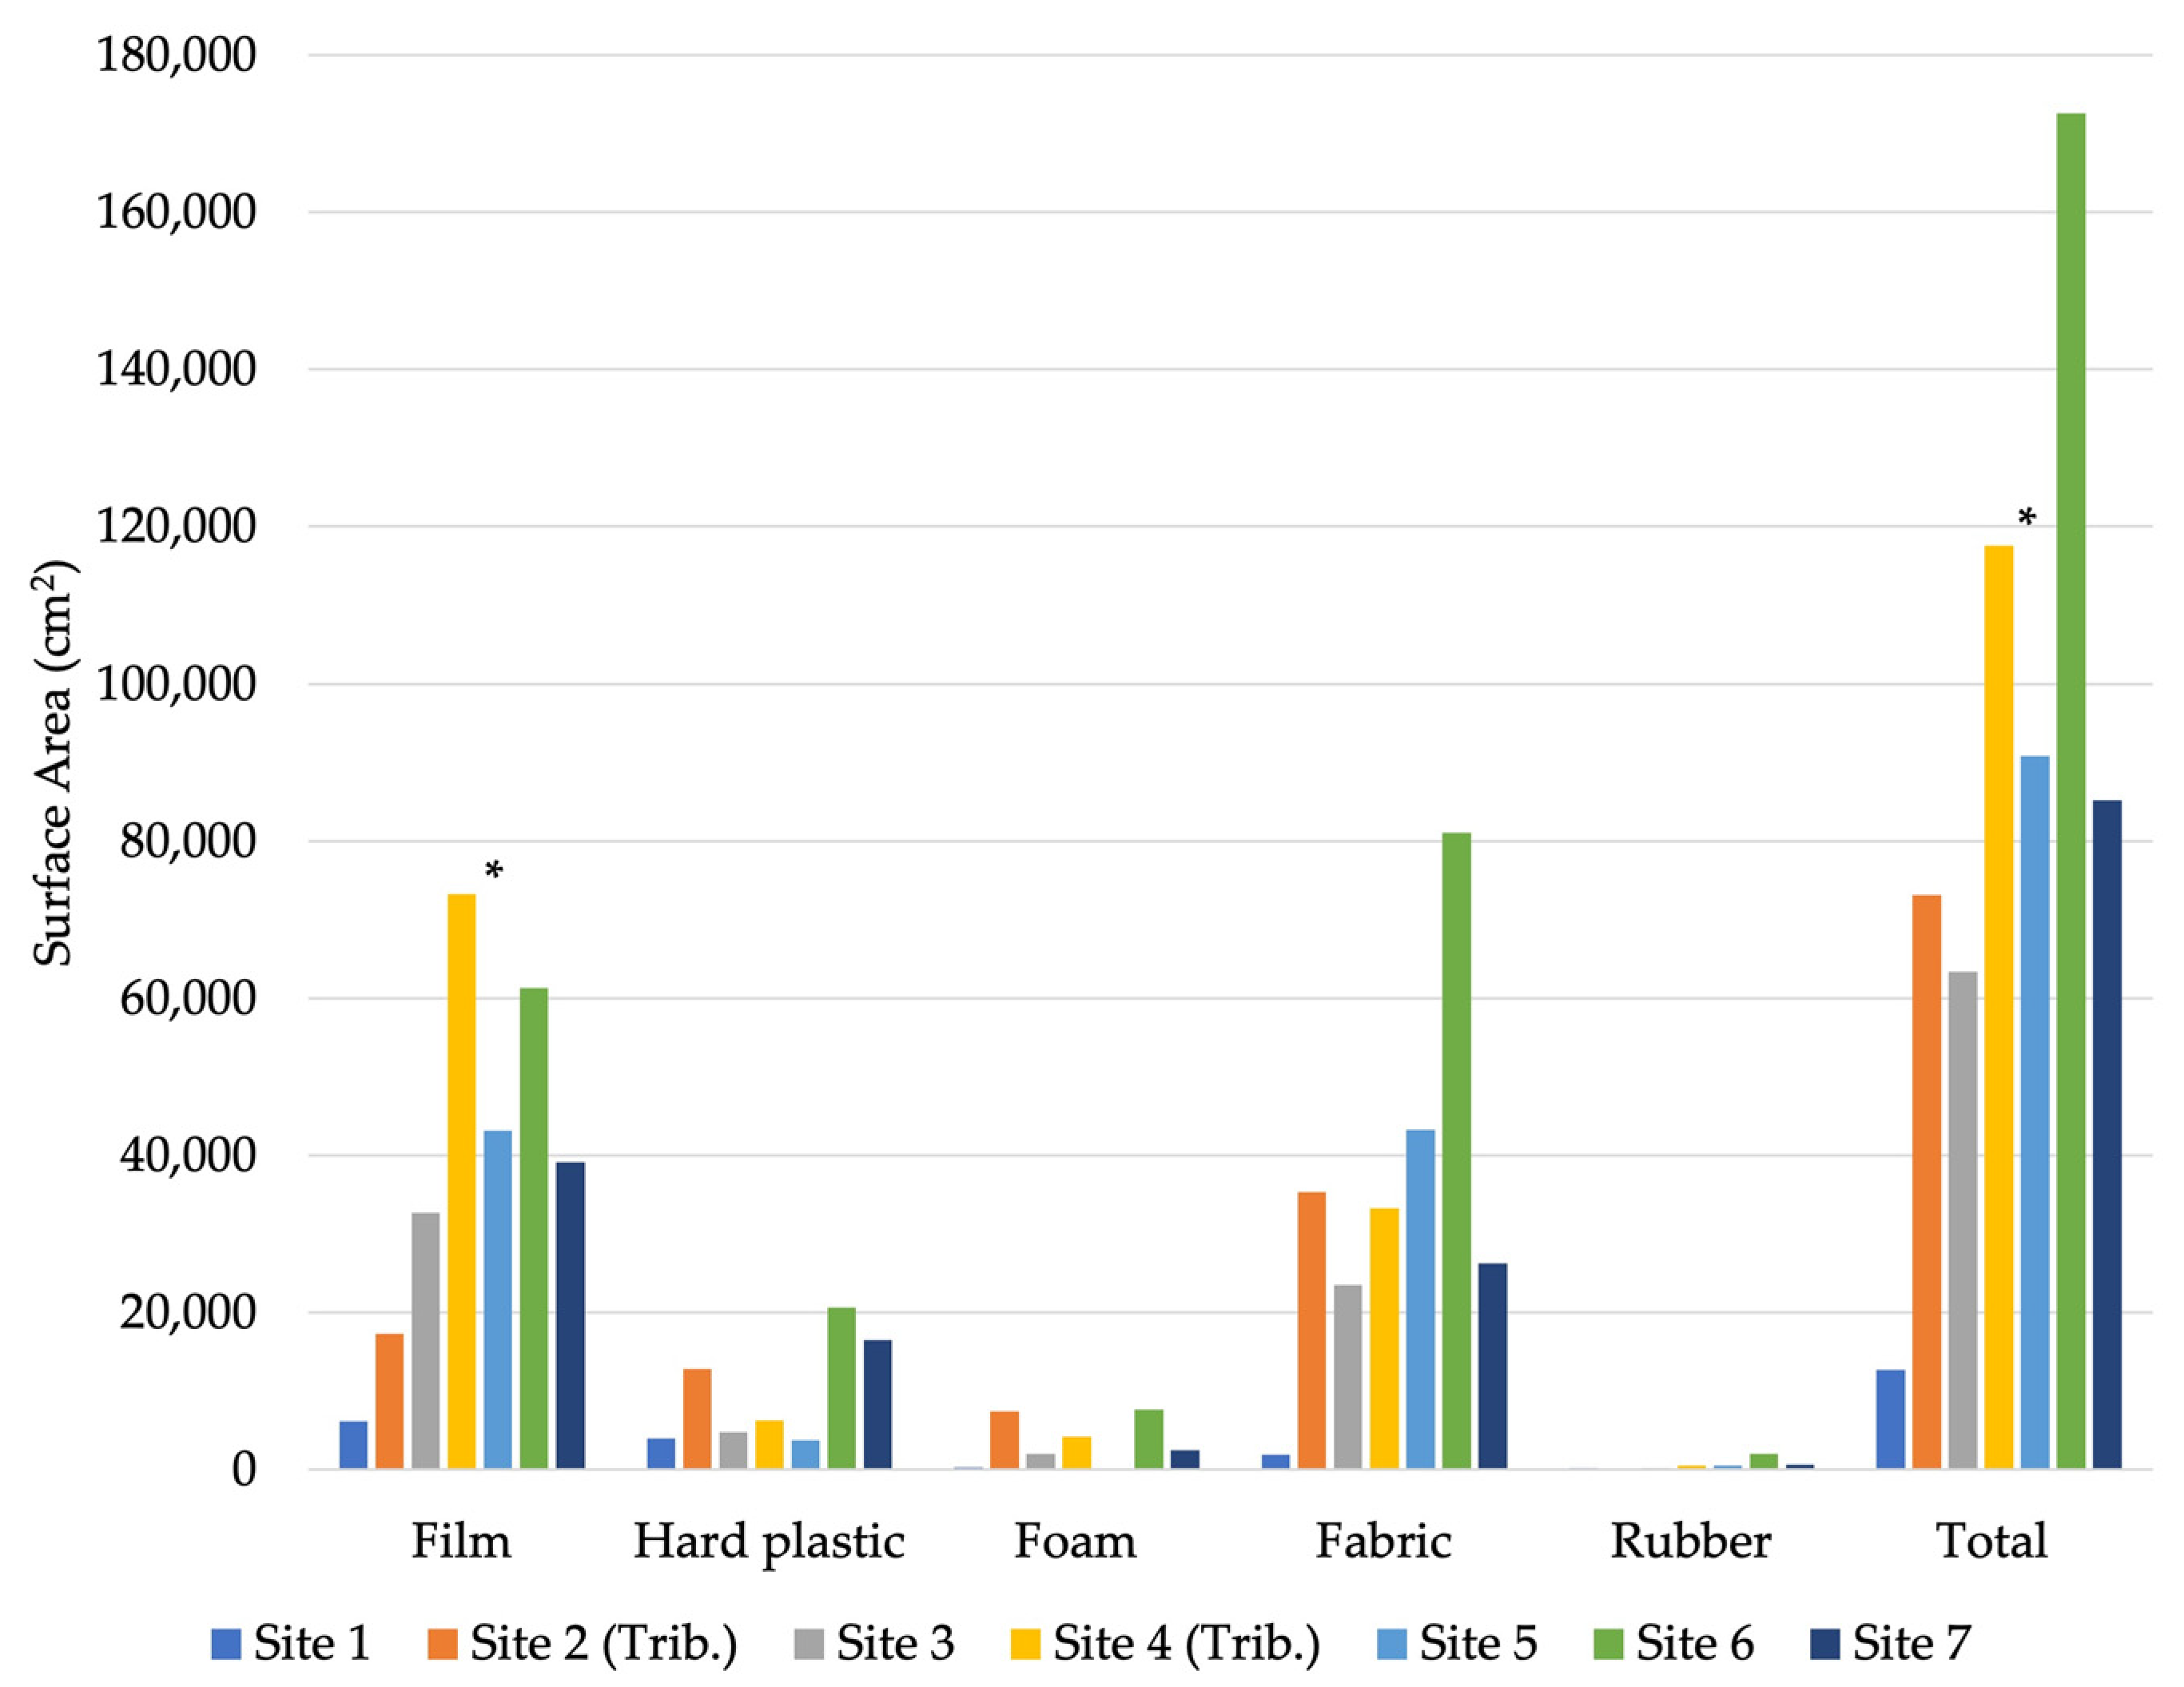
Due to the relatively small size of particles found, in terms of environmental availability and abundance, it is important to present these data on a surface area basis as well as depict their frequency of occurrence. This is because surface area serves as a descriptor of the amount of plastic of a given type that is present. While films outnumbered fabrics more than 4:1, the ratio of their surface areas is closer to 2.8:1 (Figure 8). However, this dataset includes a single, very large film, a tarp/sheet collected at Site 4, which makes up more than 60% of the total surface area of films collected. Removing this surface area outlier from the dataset brings the ratio of surface area to 1.1:1 for films to fabrics. The total surface area of films, hard plastics, and fabrics increases downstream to Site 7, where surface area decreases from Site 6 (Figure 9). The total surface area of foam and rubber items does not follow a clear downstream trend but vary to some degree. This is possibly due to their small overall surface area compared to the other materials.

3.3. Microplastic Production

During the microplastic production experiment, four replicate analyses were performed per sample. The data generated from the replicate flasks are similar. Thus, the data presented in Table 5 represent the results observed for all four replicate analyses. If more than 100 microplastics were present on a slide, a “too numerous to count” designation was given to the sample and a value of >100 was listed on the data sheet. If all four replicates produced a value of >100 (too numerous to count), a sum was reported in Table 5 as >400.
A total of six microplastics (counted on all replicates combined; consisting of blue and black fibers) were counted for sample blanks and was considered as the experimental level of detection. The items composed of fabrics broke down into numerous fibrous microplastics, the majority of which appeared to be transparent and colorless with much less abundant colored fibers mixed in. The grocery bags broke into numerous fragmented films. A color difference was observed between the films produced by the new and old shopping bags. The new grocery bag decomposed into blue films, while the old grocery bag broke into white and red films. The old foam cup broke into numerous white foam fragments. The new foam cup did not readily break into fragments; the number of generated microplastics was below the limit of detection.

4. Discussion

The influence of plastic debris on aquatic, riparian, and terrestrial biota can be subdivided into physical and chemical effects, although both types of effects may work synergistically to negatively impact ecosystems. Physically, biota may become entangled in meso- and macroplastic debris (particularly netting, rope, and fishing lines) [31,35,36,37,38]. Alternatively, biota may ingest plastic particles, which may clog airways and digestive tracts, and/or cause ulcers, abrasions, and internal bleeding [39,40]. Chemically, plastics often contain potentially toxic chemicals (e.g., plasticizers, stabilizers, and colorants) that are added to achieve their desired uses. They also possess chemically reactive surfaces that allow for the sorption of other types of organic and inorganic contaminants to the particles, thereby allowing them to serve as carriers (vectors) of toxic substances [41,42,43]. Thus, once ingested, biota may suffer a wide range of molecular and systemic physiological impacts to immune, metabolic, feeding, growth, and reproductive functions, as well as changes to gene expression [7,40,44,45]. Microplastics are thought to have particularly important impacts on biota, in part because their relatively small size allows them to be easily ingested by a wide range of aquatic, benthic, and terrestrial biota, and because their high surface area allows for the significant sorption of contaminants. Moreover, microplastics have been found to bioaccumulate with increasing trophic levels [46,47]. In the following sections, we explore some of the controls on both the potential physical and chemical factors of meso- and macroplastics that may affect ecosystem health, including their abundance, size, fragmentation, and resin composition.

4.1. Temporal and Spatial Variations in Plastic Abundance

Plastic debris was surprisingly abundant along Richland Creek given that the stream is in a predominantly forested basin and flows through a relatively small town (population in 2021 of 10,171 [17]). In total, 1737 pieces of plastic were collected from the 350 m of riparian zone analyzed. The average abundance equated to about five plastic items per linear meter of riparian zone (on one side of the channel). To put the measured abundance in perspective, if the mean number of items calculated for an initial survey from all seven sites (93.4 items per 50 m, on one side of the channel) is extrapolated to an entire 1 km reach, there would be 3736 items. Plastic re-accumulation rates were also high, up to more than two particles per 50 m reach per day at our most downstream sites, indicating that there is both a significant source of plastic in the channel and the items are consistently transferred downstream prior to their deposition.
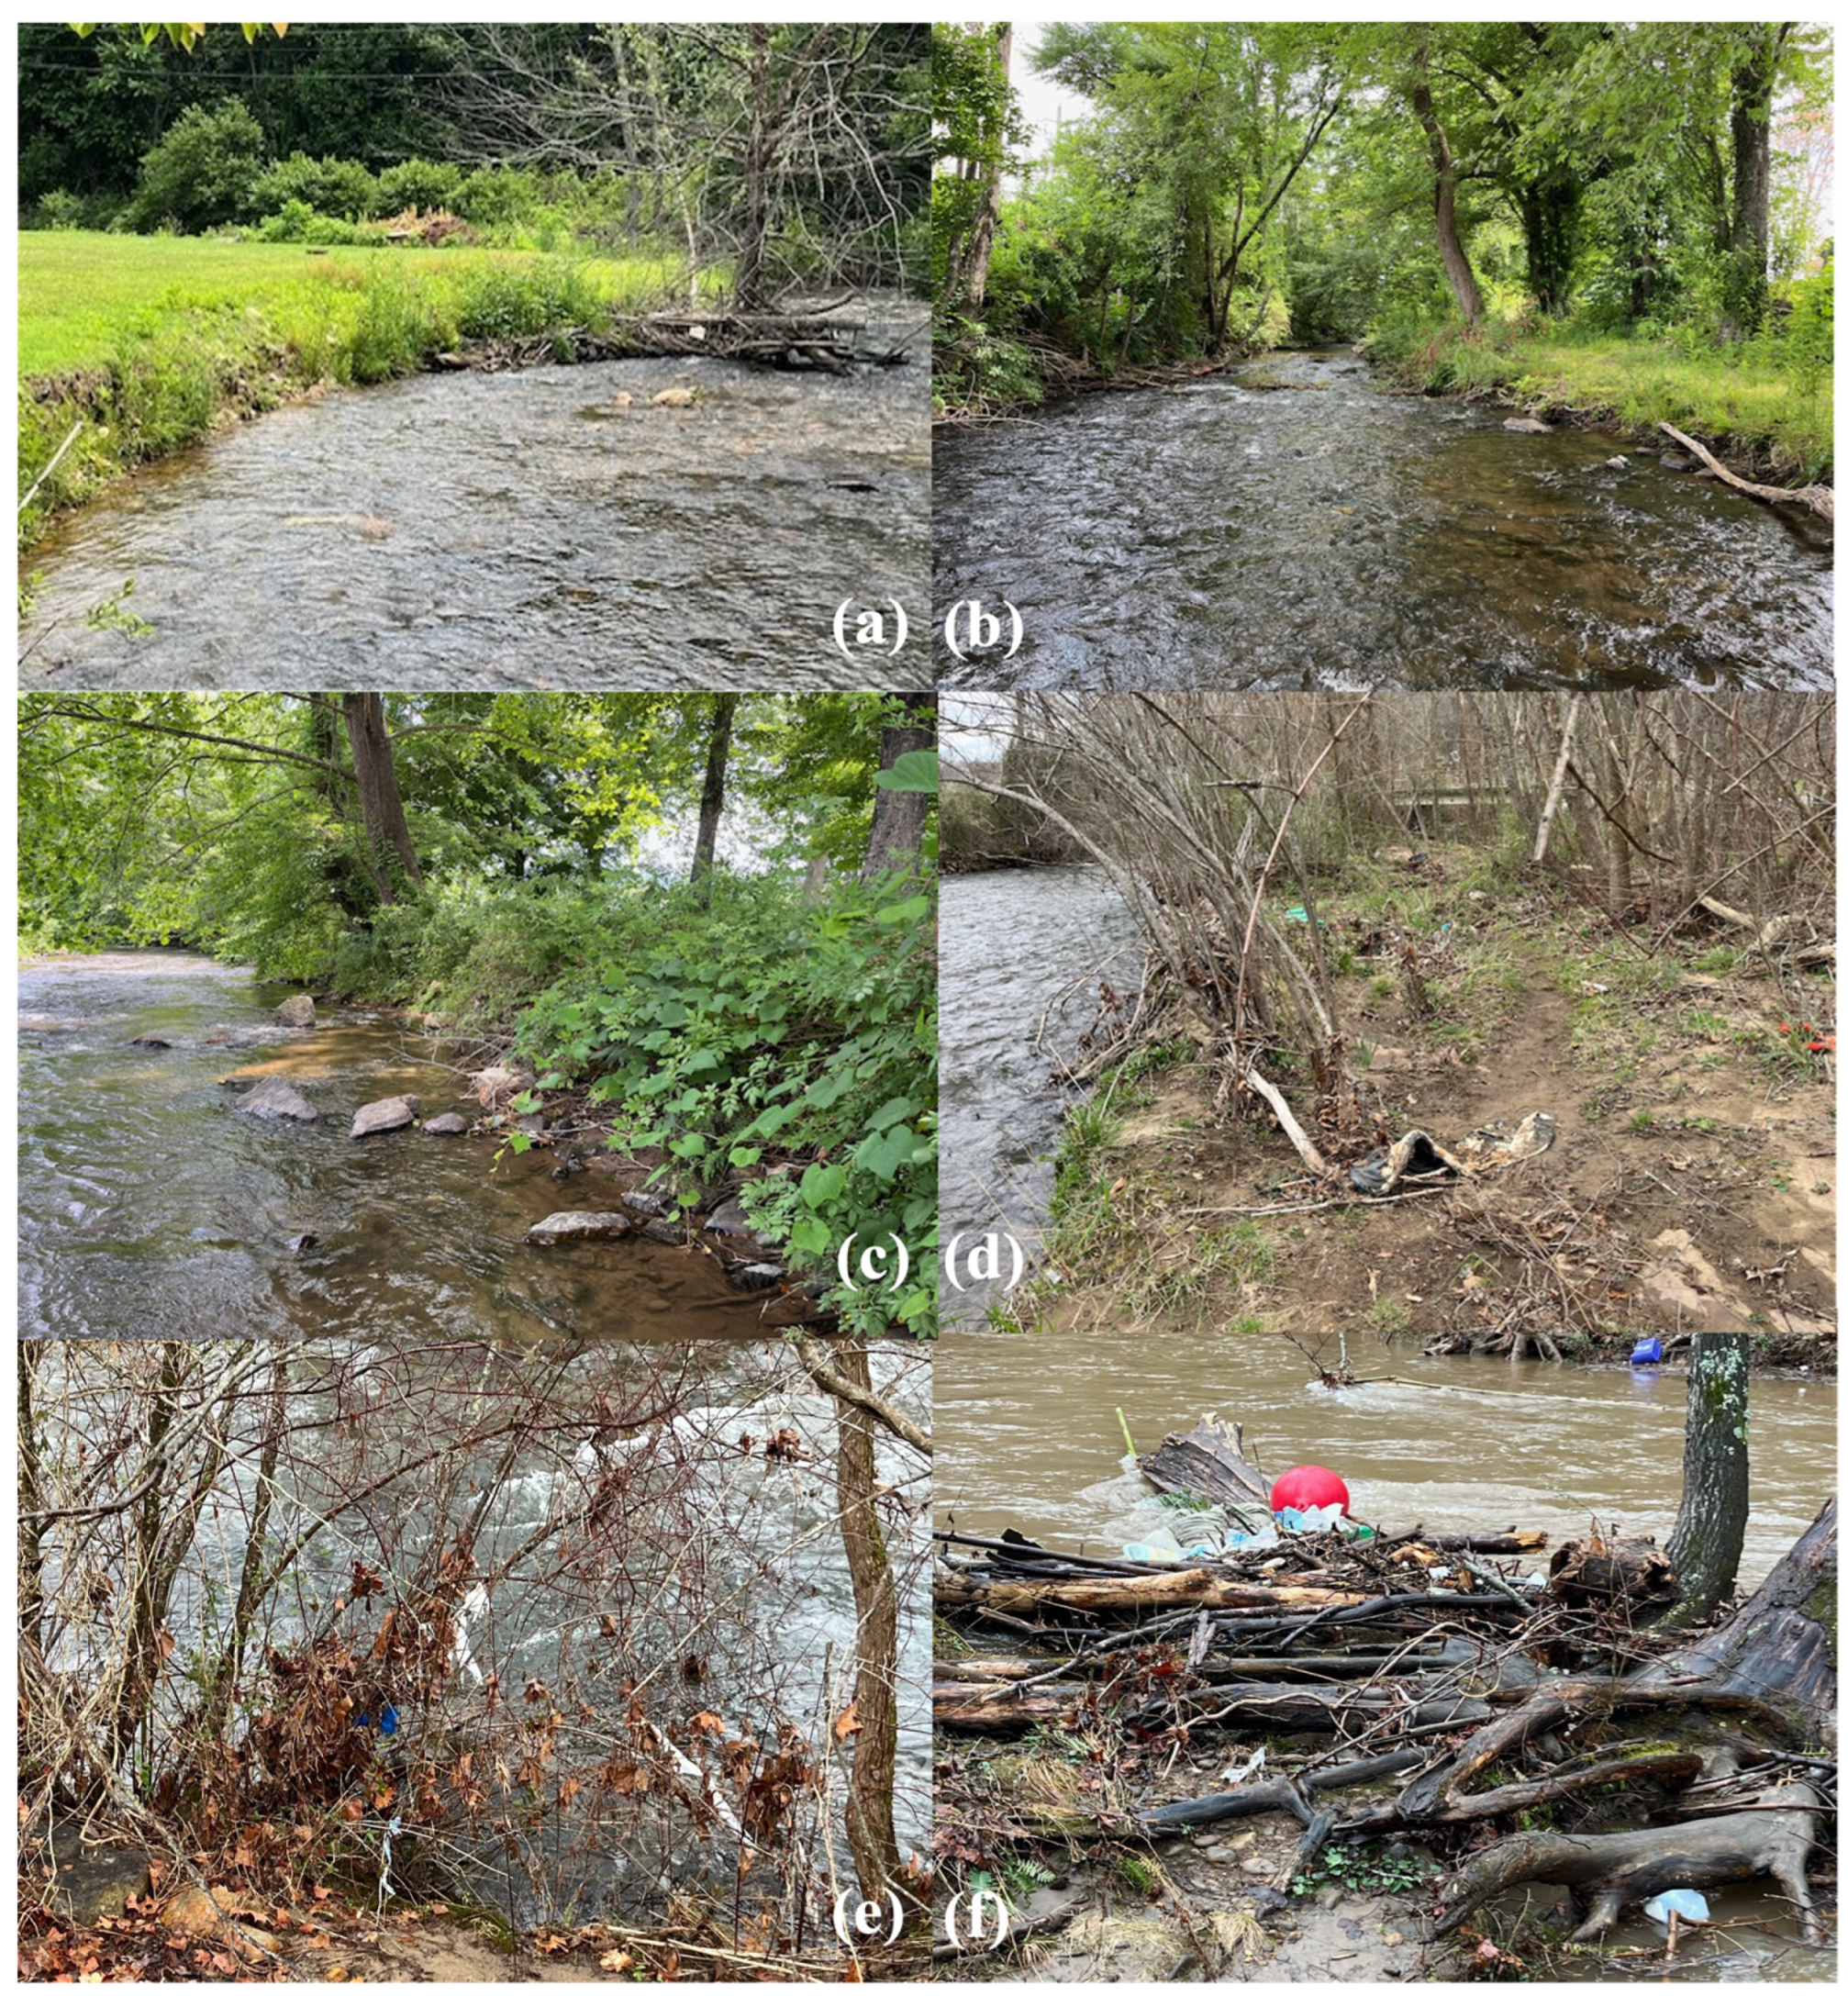
While average values provide general insights into the magnitude of the plastic pollution problem, neither plastic abundance nor re-accumulation rates were spatially uniform, but rather increased somewhat sporadically downstream. Abundances, for example, were about four to five times higher at the two most downstream sites (Sites 6 and 7) in comparison to Site 1 (draining a less developed area) (Table 2). Although the number of sampling sites along the axial drainage is limited, the observed downstream increase is likely due to the enhanced opportunity for discarded plastic items to accumulate along the channel banks and riparian zone as the stream traverses more developed areas of the watershed. This is supported by the fact that while the spatial variability may be high, (1) the observed spatial trends with development are generally systematic, (2) the observed trend is generally consistent between sampling dates (i.e., over time), and (3) the functional use of the plastic debris (as discussed elsewhere) is consistent with a domestic source, which increases in area with increasing upstream development. Field observations made during the collection process indicate, however, that accumulation was also influenced by the nature of the riparian vegetation and the morphologic characteristics of the channel and its associated floodplain. For example, the accumulation of plastic debris was enhanced by dense, brushy vegetation, particularly where it was growing on steep channel banks and/or projected into the flow of the channel (Figure 10). Large quantities of plastics were also found behind log jams (e.g., Site 6) and on topographically low, frequently inundated benches developed along the channel (e.g., Site 5). In contrast, grass-lined banks and floodplains, while containing plastic items, were less effective in collecting plastic debris (e.g., along some parts of Sites 1 and 5). Interestingly, in these less vegetated (hydraulically smoother) areas, much of the plastic debris was associated with highwater strandlines (Figure 11), suggesting that much of the debris was being transported near the surface and along the edges of the water. This is of no surprise given that the presumed compositions of the items (e.g., shopping bags, food wrappers, plastic bottles, and foam food packing materials, as discussed below) have a density less than that of water (Table 1).
A predominantly domestic source of the plastic debris is supported by (1) the functional use of the collected items (i.e., the dominance of grocery bags and food wrappers) and (2) the general downstream increase in the quantity of plastic items as Richland Creek traverses the town of Waynesville. This increase occurs in spite of the fact that general land use patterns in the basin upstream of the collection sites is relatively consistent (Figure S2), suggesting that only small increases in development are needed to increase the quantity of domestically derived debris in the channel (Figure 4). An exception to this overall trend is the transition from Site 6 to Site 7, where a decrease in both frequency and surface area of plastic litter occurs. We believe Site 6 to be the outlier, as a large log jam within the channel served as an effective trap for plastic debris, thereby reducing the quantity of plastic debris that was available for further downstream transport. Site 4, located along a small (~5.5 km2) tributary basin to Richland, also exhibited a relatively high amount of litter. This basin is dominated by low-intensity development and is used extensively for recreational activities and accounts for roughly 10% of the items collected.

4.2. Functional Origin and Material Type of the Plastic Debris

The majority of data on the predominant functional types of plastic items in the environment has come from the characterization of floating oceanic debris and coastal shorelines (Table 6). At these sites, most items consisted of single-use plastics (e.g., shopping bags, beverage bottles) [48], fishing gear [49], food packaging [50], and foam products [50,51]. Only a limited number of studies have documented the types and functional origins of the plastic debris that is transported through rivers. A comparison of the predominant types of plastics between these sites is problematic because different collection and analysis protocols were used, and the approaches differ in whether the items were collected from the water surface, at depth, or had been deposited along shorelines. In general, however, food wrappers were a common constituent of the investigated sites, including Richland Creek. Interestingly, while plastic bags were the most common item along Richland Creek, they only formed an important component of the plastic debris along the shorelines of Setúbal Lake, Argentina, a floodplain lake located along the Parana River [25]. It is no surprise that grocery and shopping bags were common along Richland Creek. In 2014, over 103 billion shopping bags were used in the United States [52], and they generally lack recyclability, thus ending up in landfills or otherwise being released into the environment at a high rate.
Food wrappers, what you typically see covering a candy bar and other types of snacks, were also abundant along Richland Creek and most of the other investigated freshwater sites (Table 3 and Table 6; Figure 5b), presumably because they are often bought and eaten “on the go”, where trash receptacles are limited. Foam food packing containers are notably absent from the list of most prominent functional items along Richland Creek. Their absence may be due to the fact that they are easily fragmented during transport through the river, thereby making it difficult, in many cases, for them to be distinguished as a specific functional item (e.g., a food container). That is, they may have decomposed into particles that were too small to be effectively collected in the heavily vegetated study areas. Blettler et al. [25], for example, found that in the Parana floodplain lakes, Styrofoam was most commonly found as a mesoplastic, a finding that is consistent with data published by Zbyszewski et al. [53] and Driedger et al. [31] for surface waters and shorelines in the Great Lakes. It is worth noting, however, that foam particles were rarely observed as microplastics in water samples from Richland Creek [33,54].
Table 6 shows that there are notable differences in the functional origins of the plastic debris reported for riverine ecosystems. Gasperi et al. [19] suggest that these differences in debris composition may be related to (1) differences in the methods and devices used to collect the plastic litter; (2) differences in the behavior of the litter in aquatic environments as result of varying hydrologic conditions (rivers, lakes, estuaries); and (3) differences in the type of plastics used for life activities in different places and the means through which the plastic waste is managed. Items composed of fabrics have not been frequently included in the characterization of plastic debris in other areas. They were included herein because they appeared to form a significant component of the debris along Richland Creek, and the majority of textiles (fabrics) were at least partially composed of polyester (PET). As noted below, the debris composed of textiles may serve as an important source of fibrous microplastics in the water column and should be included in future studies.
The primary functional origins and type of plastic debris observed along Richland Creek align with domestic activities (e.g., bags, food wrappers, beverage bottles, clothing and other items composed of textiles), suggesting that the majority of the debris is derived from domestic sources rather than industrial or agricultural activities. This finding is consistent with the results of Blettler et al.’s study [25] on the Parana River floodplain lakes and Gasperi et al. [19], who studied the Seine River. While rubber hoses, plastic straps, large sheets of plastic, and various types of straps were possibly associated with agricultural and industrial activities, they were relatively rare. Items composed of PVC (mainly pipes used in building and construction), for example, comprised < 0.5% of all collected plastic items. Gasperi et al. [19] also found that PVC-based items were noticeably absent from the floating booms used to collect plastic litter along the Seine River. They suggested that the lack of items composed of PVC could be attributed to (1) their higher density, which allowed them to avoid their collection booms, or (2) its use primarily occurring in upland areas (e.g., in construction sites) that lacked a direct transfer route to rivers (i.e., the PVC was contained to construction sites and not inadvertently released into the environment).
While a discussion of the policies governing plastic pollution is beyond the scope of our discussion here, it is interesting to note that within the study area, plastic debris is primarily derived from domestic sources and is dominated by grocery bags and food wrappers. Restrictions and/or incentives to deter their use are currently absent within the study area. Nonetheless, discussions pertaining to the enactment of legislation to restrict or ban single-use plastic bags are ongoing both locally and at a national level. In fact, 12 U.S. states currently have enacted policies banning single-use plastic bags [55,56,57], and several states are beginning to regulate plastic in food packaging materials [58]. The data collected herein suggest that such policies may help reduce the abundance of plastic films within headwater streams.

4.3. Item Size, Abundance, and Fragmentation

The size of a plastic item is likely to influence both the magnitude and the nature of their potential impact(s) on biota. Biota, for example, are more likely to become entangled in larger items, which along Richland Creek included plastic sheets (e.g., painting drop cloths), sleeping bags, blankets, carpet, and long (>5 m) pieces of fishing line, as well as pieces of geotextile (used to control bank erosion). In contrast, smaller items are more likely to be ingested by biota, potentially causing the physical and physiological effects described earlier in the discussion. Overall, the plastic items collected along Richland Creek tend to be relatively small; more than 70% of the items exhibited a width (B-axis) of less than 10 cm, and nearly half possessed a width of less than 5 cm (Figure 7), suggesting that they may be ingested by larger biota that utilize the riparian zone (e.g., small mammals and birds).
The size and number of the items varied as a function of their functional use, material composition, and the degree to which the items were fragmented. For example, collected grocery bags were predominantly fragmented, resulting in abundant small pieces of plastic films. Food wrappers were also predominantly fragmented but less so than grocery bags and other types of bags. The fragmentation of the bags and food wrappers was presumably fostered along Richland Creek by high velocity flows (typically ranging between about 0.18 and 0.9 m/s during base flows) that traverse the channel’s coarse gravel bed, locally producing highly turbulent flows. Abundant brushy vegetation along the channel banks also adds roughness elements that were likely to enhance the fragmentation of plastic debris, particularly bags. In fact, bags were disproportionately found hanging from the limbs of trees and other brushy vegetation along the channel banks (Figure 11). In contrast, many items composed of hard plastic (e.g., beverage bottles) were generally found intact, as were many items composed of fabric (e.g., clothing).
The influence of the material type on item size and abundance is apparent by comparing the abundance and surface area of the items of different materials. Surface area is being used here as a descriptor of the original amount of plastic of a given material type that was present within the sampling sites. The data show that many more films were collected than fabrics in spite of the fact that their overall surface areas or original amounts were similar. If the items made of film had been intact, a much lower number would have been collected. In general, then, at all of the collection sites along Richland Creek, the trend was for abundant, relatively small, highly fragmented films that were widely distributed across the site and which were much more readily available to both invertebrate and vertebrate species of biota. Fewer, larger, and more intact items composed of hard plastics and fabrics existed at the sampling sites. At some sites and collection times, only a few items composed of fabric were found, but they generally possessed a relatively large surface area. Where these large items existed, they potentially posed a higher risk to biota for entanglement.

4.4. Meso- and Macroplastic Decomposition and Microplastic Production

It is generally assumed that a significant portion of the microplastics found in freshwaters is derived from the abrasion and weathering of larger pieces of plastic debris [19,59]. While general rates of plastic decomposition are lacking for freshwater environments, it has been argued that processes such as photodegradation will more aggressively affect plastic items floating near the water surface [19,59]. Debris that is temporarily deposited and stored along the channel banks and within the riparian zone of a river will also be subjected to significant photodegradation. Ongoing studies of microplastics within both base and stormwaters of Richland Creek have shown that approximately 90% of particles in the 100 μm–5 mm range are fibers; the majority of the remaining 10% are fragments of hard plastics [60]. Given the potentially significant impact of microplastics on aquatic biota, the question arises as to whether the types of meso- and macroplastics collected along Richland Creek can produce significant microplastics, particularly fibers. Put differently, is it possible for the plastic debris that primarily occurred as films and hard plastics to produce fibrous microplastics? We explored this question using a series of relatively simple shaker table experiments, where different types of plastic debris collected from the sites were placed into Erlenmeyer flasks and shaken for more than a week (see methods). While weathered grocery bags from the Richland Creek sampling sites produced significant quantities of microplastics, they were characterized as films. In contrast, the analyzed textiles produced significant fibers and therefore represent a potentially significant source of fibrous particles observed within the water column. There is, then, a significant discrepancy between the shape of the microplastics that can be produced by the most abundant types of plastic debris and the shape of the anthropogenic particles that are < 5 mm within the water. We are currently unsure of the mechanism behind this discrepancy, but several possibilities exist as follows: (1) There are other more significant source(s) of microplastics in Richland Creek, such as atmospheric deposition, that primarily contribute fibers to the stream. Current studies, for instance, show that the atmospheric deposition of microplastics range from 7 to 450 particles per m2 per day within western North Carolina and average on the order of about 100 particles per m2 per day (depending on the site) [54]. The influx of atmospherically deposited fibrous particles may be orders of magnitude higher than the amount of microplastics that can be produced by plastic films, particularly when considering the deposition of the fibers over the entire watershed (after which they may be delivered to the channel during runoff events) and the fact that the films are largely deposited and stored within the riparian zone; (2) fibers are generated by plastic debris other than films (bags, food wrappers), including synthetic clothing and other textiles, which by total surface area are as abundant as films; (3) films (many of which are white or transparent) are more difficult to identify during the visual counting of filtered samples; and/or (4) a combination of these factors. It is also possible that microplastic films were preferentially deposited within the channel bed and floodplain sediments, disproportionately removing them from the water column. While particles composed of films are typically composed of PP or PE and therefore have a density that is less than that of water, some authors have argued that such low-density microplastics may become incorporated into sediments [61,62,63,64,65] due to heteroaggregation and biofouling, among other processes [61,64,66]. Regardless of the cause, the meso- and macroplastic data collected herein indicated that the abundance of meso- and macroplastic debris cannot be used as a surrogate for microplastic concentrations within the water column. As noted by Blettler et al. [25], this is unfortunate given the ease and cost-effectiveness of such surveys relative to the analysis of aquatic microplastics.

4.5. Resin Composition

A primary question pertaining to plastic pollution is whether plastics in the environment pose a significant chemical (toxic) risk to ecosystem and human health. It is a question that is drawing exponentially increasing attention and has proven to be extremely difficult to address, in part because (1) the toxicity of the plastic polymers differs between one another as a function of the monomers with which the polymer is composed [67]. While seven types of polymers comprise the majority of plastic items produced, thousands of subclasses exist; (2) one or more of several thousand different chemicals may be added to the plastics to give it the qualities needed for a given product (e.g., color, melting point, and mechanic, thermal, and electrical resistance) [68,69]. These include fillers (that are typically inert), plasticizers, antioxidants, UV stabilizers, lubricants, colorants, and flame retardants [68,69]; (3) various toxic substances (e.g., solvents) that are used in the production of the polymers are difficult to completely remove and therefore may occur as impurities in the plastics [67] that are released during degradation or following ingestion; and (4) other types of organic and inorganic contaminants may be sorbed or desorbed onto or off of the plastic’s surface. These contaminants may pose a synergistic effect on ecosystem and human health, and their sorption and desorption differ by polymer type as well as the degree of plastic weathering (age) and the physiochemical conditions of the environment in which the plastic items exist. The latter may change over both time and space.
In spite of the difficulties in quantifying the toxic risks associated with plastics, Lithner [67] developed a hazard ranking model, based primarily on the plastic’s monomer composition. The ranking system was applied to 55 plastic polymers. Of particular concern, for example, were monomers that have been classified as carcinogenic, mutagenic, or toxic with respect to reproduction. Interestingly, the most commonly found plastics in aquatic environments contain the least hazardous monomers. These include, in order of their hazard ranking, PC (polycarbonate) > EPS > PS > HDPE ≈ LDPE ≈ PET > PP > nylon.
Table 1 shows the most abundant types of plastic polymers found within the plastic debris collected along Richland Creek on the basis of the item’s most common composition. It also shows the predominant types of polymers found in plastic litter from other sites. Items composed of HDPE, including bags of various types, were most abundant in terms of their frequency of occurrence and the total area of material collected. PET, found in beverage bottles and polyester in fabrics, was also common. In fact, fabrics (PET) comprised a similar area of plastic debris to bags (HDPE, LDPE) despite the lower number of items collected. PP associated with food wrappers, straws, and bottle caps, among other types of items also appears to be abundant along Richland Creek. Resins that were present but less abundant included PS, EPS, and PVC.
The most abundant polymers found along Richland Creek exhibited low hazard rankings by Lithner [67]. The exceptions included items composed of ABS and PVC, of which PVC pipes were most abundant. PVC was given a relatively high hazard ranking because of vinyl chloride, which has been labeled as a carcinogen and because PVC may contain a large amount of benzyl butyl phthalate, a plasticizer that is toxic with respect to reproduction and aquatic life and which is likely to be leached from plastic [67]. It is important to note that the classification system provided by Lithner [67] did not directly consider endocrine disrupters. Their inclusion, however, would likely increase the hazard ranking of EPS, PS, ABS, and PC.
The polymer composition also exerts a control on ecological impacts through its influence on plastic degradation and the generated degradation products [70]. The addition of antioxidants and stabilizers to plastics generally slows their degradation in the environment, thereby prolonging their existence. Unfortunately, previously reported plastic degradation rates vary widely [71] and are particularly lacking for freshwater environments. A detailed assessment of the differences in the degradation rates of the plastic debris collected along Richland Creek is beyond the scope of this paper. General information can be obtained, however, from Chamas et al. [71].

5. Conclusions

This study demonstrated that plastic debris larger than ~0.5 cm is abundant along Richland Creek and is continuously re-supplied, transported downstream, and deposited along the channel and riparian zone. The original functional use of the items, combined with an increase in abundance with increasing development, indicate that most plastics were derived from domestic sources. Plastic bags, primarily composed of HDPE, and food wrappers (PP) were most abundant. Abundance, particularly of films associated with grocery bags, was strongly influenced by fragmentation that was presumably enhanced by high velocity, turbulent flows over a coarse-grained channel bed and thick, woody vegetation along the channel banks. In terms of monomer composition, the most common items, including films, are thought to pose a relatively low hazard. However, plastic hazards are not limited to a monomer composition, and they may serve as effective vectors for the movement of other contaminants. Moreover, fragmentation decreased particle size such that 46% were <5 cm in intermediate diameter, increasing the aesthetic degradation of the environment and the potential for the items to be ingested by biota. Laboratory experiments showed that while all of the collected plastic debris produced abundant microplastics, only textiles generated the fibrous microplastics that comprise about 90% of the particles in the water column of Richland Creek (as determined by studies separate from those discussed here). Textiles have not been included in many previous investigations of the abundance and type of meso- and macroplastic debris [19,22,23,25] but should be included in future studies. The importance of geotextiles, widely used for erosion control along drainage networks, should receive particular attention. In combination, the results of the study indicate that policies aimed at reducing the use and release of plastic bags could significantly decrease the abundance of plastic pollution and its potential ecological impacts along stream channels. Currently, 12 U.S. states have enacted policies banning single-use plastic bags [55,56,57]. Plastic food wrappers were found frequently in the current study. Several states are beginning to regulate plastic in food packaging materials [58]. Globally, regulations on plastic bags and plastic food packaging are already in place and have been in place for several years [72,73]. In addition, the data illustrate the importance of community outreach and the need to raise community awareness in consumers as to the impact they can have in reducing plastic waste.

Supplementary Materials

The following supporting information can be downloaded at: https://www.mdpi.com/article/10.3390/environments11090195/s1, Figure S1. Land use map of the study area; Figure S2. Land use by site as a proportion and as the total area upstream of each sampling location.

Author Contributions

Conceptualization: J.M.; methodology: J.M. validation: N.B.; formal analysis: N.B. and J.M.; investigation: N.B., J.M. and S.O.-M.; data curation: J.M.; writing—original draft preparation: N.B. and J.M.; writing—review and editing: N.B., J.M. and S.O.-M.; visualization: N.B. and J.M.; supervision: J.M., N.B. and S.O.-M.; project administration: J.M.; funding acquisition: J.M. and S.O.-M. All authors have read and agreed to the published version of the manuscript.

Funding

This research was funded by the North Carolina Sea Grant and Water Resources Research Institute, the Collaborative Community Research Grant (grant number 22-CCRG04), and the Whitmire Endowment at Western Carolina University. Their support is greatly appreciated.

Data Availability Statement

The data presented in this study are available upon request from the corresponding author.

Acknowledgments

The authors would like thank volunteers from the Haywood Waterways Association for their help in the collection of plastic debris samples. Particular thanks go to Christine O’Brien for organizing the volunteers. Thanks also go to the students from Haywood Community College and the Earth and Environmental Science classes at Tuscola High School (Waynesville, North Carolina, USA) for their help with sample collection and characterization.

Conflicts of Interest

The authors declare no conflicts of interest.

References

  1. OECD. Global Plastics Outlook: Economic Drivers, Environmental Impacts and Policy Options; OECD Publications: Paris, Frances, 2022. [Google Scholar]
  2. Andrady, A.L.; Neal, M.A. Applications and Societal Benefits of Plastics. Philos. Trans. R. Soc. B Biol. Sci. 2009, 364, 1977–1984. [Google Scholar] [CrossRef] [PubMed]
  3. Diggle, A.; Walker, T.R. Environmental and Economic Impacts of Mismanaged Plastics and Measures for Mitigation. Environments 2022, 9, 15. [Google Scholar] [CrossRef]
  4. Galgani, L.; Loiselle, S.A. Plastic Accumulation in the Sea Surface Microlayer: An Experiment-Based Perspective for Future Studies. Geosciences 2019, 9, 66. [Google Scholar] [CrossRef]
  5. Schmidt, C.; Krauth, T.; Wagner, S. Export of Plastic Debris by Rivers into the Sea. Environ. Sci. Technol. 2017, 51, 12246–12253. [Google Scholar] [CrossRef]
  6. Schwarz, A.E.; Ligthart, T.N.; Boukris, E.; Van Harmelen, T. Sources, Transport, and Accumulation of Different Types of Plastic Litter in Aquatic Environments: A Review Study. Mar. Pollut. Bull. 2019, 143, 92–100. [Google Scholar] [CrossRef] [PubMed]
  7. Imhof, H.K.; Ivleva, N.P.; Schmid, J.; Niessner, R.; Laforsch, C. Contamination of Beach Sediments of a Subalpine Lake with Microplastic Particles. Curr. Biol. 2013, 23, R867–R868. [Google Scholar] [CrossRef]
  8. Free, C.M.; Jensen, O.P.; Mason, S.A.; Eriksen, M.; Williamson, N.J.; Boldgiv, B. High-Levels of Microplastic Pollution in a Large, Remote, Mountain Lake. Mar. Pollut. Bull. 2014, 85, 156–163. [Google Scholar] [CrossRef]
  9. Carpenter, E.J.; Smith Jr, K.L. Plastics on the Sargasso Sea Surface. Science 1972, 175, 1240–1241. [Google Scholar] [CrossRef]
  10. Carpenter, E.J.; Anderson, S.J.; Harvey, G.R.; Miklas, H.P.; Peck, B.B. Polystyrene Spherules in Coastal Waters. Science 1972, 178, 749–750. [Google Scholar] [CrossRef]
  11. Ostle, C.; Thompson, R.C.; Broughton, D.; Gregory, L.; Wootton, M.; Johns, D.G. The Rise in Ocean Plastics Evidenced from a 60-Year Time Series. Nat. Commun. 2019, 10, 1622. [Google Scholar] [CrossRef]
  12. Beaumont, N.J.; Aanesen, M.; Austen, M.C.; Börger, T.; Clark, J.R.; Cole, M.; Hooper, T.; Lindeque, P.K.; Pascoe, C.; Wyles, K.J. Global Ecological, Social and Economic Impacts of Marine Plastic. Mar. Pollut. Bull. 2019, 142, 189–195. [Google Scholar] [CrossRef] [PubMed]
  13. Wagner, M.; Scherer, C.; Alvarez-Muñoz, D.; Brennholt, N.; Bourrain, X.; Buchinger, S.; Fries, E.; Grosbois, C.; Klasmeier, J.; Marti, T.; et al. Microplastics in Freshwater Ecosystems: What We Know and What We Need to Know. Environ. Sci. Eur. 2014, 26, 12. [Google Scholar] [CrossRef]
  14. Eerkes-Medrano, D.; Thompson, R.C.; Aldridge, D.C. Microplastics in Freshwater Systems: A Review of the Emerging Threats, Identification of Knowledge Gaps and Prioritisation of Research Needs. Water Res. 2015, 75, 63–82. [Google Scholar] [CrossRef]
  15. Honorato-Zimmer, D.; Kiessling, T.; Gatta-Rosemary, M.; Campodónico, C.K.; Núñez-Farías, P.; Rech, S.; Thiel, M. Mountain Streams Flushing Litter to the Sea–Andean Rivers as Conduits for Plastic Pollution. Environ. Pollut. 2021, 291, 118166. [Google Scholar] [CrossRef] [PubMed]
  16. Leopold, L.B.; Wolman, M.G.; Miller, J.P.; Wohl, E.E. Fluvial Processes in Geomorphology; Courier Dover Publications: Mineola, NY, USA, 2020; ISBN 0-486-84552-4. [Google Scholar]
  17. U.S. Census Bureau Decennial Census. 2020. Available online: https://data.census.gov/all?q=Waynesville%20town,%20North%20Carolina (accessed on 7 September 2024).
  18. U.S. Geological Survey USGS The National Map. Available online: https://www.usgs.gov/programs/national-geospatial-program/national-map (accessed on 18 August 2024).
  19. Gasperi, J.; Dris, R.; Bonin, T.; Rocher, V.; Tassin, B. Assessment of Floating Plastic Debris in Surface Water along the Seine River. Environ. Pollut. 2014, 195, 163–166. [Google Scholar] [CrossRef] [PubMed]
  20. Moore, C.J.; Lattin, G.L.; Zellers, A.F. Quantity and Type of Plastic Debris Flowing from Two Urban Rivers to Coastal Waters and Beaches of Southern California. Rev. Gest. Costeira Integr. J. Integr. Coast. Zone Manag. 2011, 11, 65–73. [Google Scholar] [CrossRef]
  21. Lechner, A.; Keckeis, H.; Lumesberger-Loisl, F.; Zens, B.; Krusch, R.; Tritthart, M.; Glas, M.; Schludermann, E. The Danube so Colourful: A Potpourri of Plastic Litter Outnumbers Fish Larvae in Europe’s Second Largest River. Environ. Pollut. 2014, 188, 177–181. [Google Scholar] [CrossRef] [PubMed]
  22. Sadri, S.S.; Thompson, R.C. On the Quantity and Composition of Floating Plastic Debris Entering and Leaving the Tamar Estuary, Southwest England. Mar. Pollut. Bull. 2014, 81, 55–60. [Google Scholar] [CrossRef] [PubMed]
  23. Morritt, D.; Stefanoudis, P.V.; Pearce, D.; Crimmen, O.A.; Clark, P.F. Plastic in the Thames: A River Runs through It. Mar. Pollut. Bull. 2014, 78, 196–200. [Google Scholar] [CrossRef]
  24. Lippiatt, S.; Opfer, S.; Arthur, C. Marine Debris Monitoring and Assessment: Recommendations for Monitoring Debris Trends in the Marine Environment. In NOAA Technical Memorandum NOS-OR&R; National Oceanic and Atmospheric Administration: Silver Spring, MD, USA, 2013. [Google Scholar]
  25. Blettler, M.C.; Ulla, M.A.; Rabuffetti, A.P.; Garello, N. Plastic Pollution in Freshwater Ecosystems: Macro-, Meso-, and Microplastic Debris in a Floodplain Lake. Environ. Monit. Assess. 2017, 189, 581. [Google Scholar] [CrossRef]
  26. Naiman, R.J.; Decamps, H. The Ecology of Interfaces: Riparian Zones. Annu. Rev. Ecol. Syst. 1997, 28, 621–658. [Google Scholar] [CrossRef]
  27. Ríos, J.M.; Tesitore, G.; de Mello, F.T. Does Color Play a Predominant Role in the Intake of Microplastics Fragments by Freshwater Fish: An Experimental Approach with Psalidodon Eigenmanniorum. Environ. Sci. Pollut. Res. 2022, 29, 49457–49464. [Google Scholar] [CrossRef] [PubMed]
  28. Yanoviak, S.P. Container Color and Location Affect Macroinvertebrate Community Structure in Artificial Treeholes in Panama. Fla. Entomol. 2001, 84, 265–271. [Google Scholar] [CrossRef]
  29. Negishi, J.N.; Nakagawa, T.; Nakamura, F. Exceptional Color Preferences for Flying Adult Aquatic Insects. Aquat. Ecol. 2022, 56, 1–6. [Google Scholar] [CrossRef]
  30. McArtor, J.D.; Detmer, T.M.; Porreca, A.P.; Parkos III, J.J.; Wahl, D.H. Do Freshwater Macroinvertebrates Select for Different Substrates Used in Fisheries Habitat Enhancement? Trans. Ill. State Acad. Sci. 2021, 114, 325–330. [Google Scholar]
  31. Driedger, A.G.; Dürr, H.H.; Mitchell, K.; Van Cappellen, P. Plastic Debris in the Laurentian Great Lakes: A Review. J. Gt. Lakes Res. 2015, 41, 9–19. [Google Scholar] [CrossRef]
  32. Teegarden, D.M. Polymer Chemistry: Introduction to an Indispensable Science; NSTA Press: Richmond, VA, USA, 2004; ISBN 0-87355-221-0. [Google Scholar]
  33. Miller, J.; Love, J.; O’Brien, C.; Gray, A.; Youker, R.; Cahoon, S. Source, Transport Rates, and Transport Dynamics of Plastic Particles in Small Headwater Basins of the Southern Appalachians, Community Collaborative Research Grant; NC Sea Grant and WRRI Program: Raleigh, NC, USA, 2023; Final Report, Contract No. 22-CCRG-04; p. 54. [Google Scholar]
  34. Dewitz, J. National Land Cover Database (NLCD) 2019 Products. US Geol. Surv. 2021, 10, P9KZCM54. [Google Scholar]
  35. Boerger, C.M.; Lattin, G.L.; Moore, S.L.; Moore, C.J. Plastic Ingestion by Planktivorous Fishes in the North Pacific Central Gyre. Mar. Pollut. Bull. 2010, 60, 2275–2278. [Google Scholar] [CrossRef]
  36. Codina-García, M.; Militão, T.; Moreno, J.; González-Solís, J. Plastic Debris in Mediterranean Seabirds. Mar. Pollut. Bull. 2013, 77, 220–226. [Google Scholar] [CrossRef]
  37. Gregory, M.R. Environmental Implications of Plastic Debris in Marine Settings—Entanglement, Ingestion, Smothering, Hangers-on, Hitch-Hiking and Alien Invasions. Philos. Trans. R. Soc. B Biol. Sci. 2009, 364, 2013–2025. [Google Scholar] [CrossRef]
  38. Sheavly, S.B.; Register, K.M. Marine Debris & Plastics: Environmental Concerns, Sources, Impacts and Solutions. J. Polym. Environ. 2007, 15, 301–305. [Google Scholar]
  39. Wright, S.L.; Rowe, D.; Thompson, R.C.; Galloway, T.S. Microplastic Ingestion Decreases Energy Reserves in Marine Worms. Curr. Biol. 2013, 23, R1031–R1033. [Google Scholar] [CrossRef] [PubMed]
  40. Rosenkranz, P. The Ecotoxicology of Nanoparticles in Daphnia Magna. Ph.D. Thesis, Edinburgh Napier University, Edinburgh, UK, 2010. [Google Scholar]
  41. Teuten, E.L.; Rowland, S.J.; Galloway, T.S.; Thompson, R.C. Potential for Plastics to Transport Hydrophobic Contaminants. Environ. Sci. Technol. 2007, 41, 7759–7764. [Google Scholar] [CrossRef]
  42. Lusher, A.; Hollman, P.; Mendoza-Hill, J. Microplastics in Fisheries and Aquaculture: Status of Knowledge on Their Occurrence and Implications for Aquatic Organisms and Food Safety; FAO: Rome, Italy, 2017; ISBN 92-5-109882-4. [Google Scholar]
  43. Verla, A.W.; Enyoh, C.E.; Verla, E.N.; Nwarnorh, K.O. Microplastic–Toxic Chemical Interaction: A Review Study on Quantified Levels, Mechanism and Implication. SN Appl. Sci. 2019, 1, 1400. [Google Scholar] [CrossRef]
  44. Sánchez, C.; Hortal, M.; Aliaga, C.; Devis, A.; Cloquell-Ballester, V.A. Recyclability Assessment of Nano-Reinforced Plastic Packaging. Waste Manag. 2014, 34, 2647–2655. [Google Scholar] [CrossRef]
  45. Biginagwa, F.J.; Mayoma, B.S.; Shashoua, Y.; Syberg, K.; Khan, F.R. First Evidence of Microplastics in the African Great Lakes: Recovery from Lake Victoria Nile Perch and Nile Tilapia. J. Gt. Lakes Res. 2016, 42, 146–149. [Google Scholar] [CrossRef]
  46. Hurley, R.R.; Nizzetto, L. Fate and Occurrence of Micro (Nano) Plastics in Soils: Knowledge Gaps and Possible Risks. Curr. Opin. Environ. Sci. Health 2018, 1, 6–11. [Google Scholar] [CrossRef]
  47. Dawson, A.L.; Kawaguchi, S.; King, C.K.; Townsend, K.A.; King, R.; Huston, W.M.; Bengtson Nash, S.M. Turning Microplastics into Nanoplastics through Digestive Fragmentation by Antarctic Krill. Nat. Commun. 2018, 9, 1001. [Google Scholar] [CrossRef] [PubMed]
  48. Ocean Conservancy the International Coastal Cleanup 2020 Report. International Coastal Cleanup Report 2020. 2020. Available online: https://oceanconservancy.org/wp-content/uploads/2020/09/2020-Report_-FINAL.pdf (accessed on 7 September 2024).
  49. Rochman, C.M.; Tahir, A.; Williams, S.L.; Baxa, D.V.; Lam, R.; Miller, J.T.; Teh, F.-C.; Werorilangi, S.; Teh, S.J. Anthropogenic Debris in Seafood: Plastic Debris and Fibers from Textiles in Fish and Bivalves Sold for Human Consumption. Sci. Rep. 2015, 5, 14340. [Google Scholar] [CrossRef]
  50. Lavers, J.L.; Bond, A.L. Exceptional and Rapid Accumulation of Anthropogenic Debris on One of the World’s Most Remote and Pristine Islands. Proc. Natl. Acad. Sci. USA 2017, 114, 6052–6055. [Google Scholar] [CrossRef]
  51. Law, K.L.; Morét-Ferguson, S.; Maximenko, N.A.; Proskurowski, G.; Peacock, E.E.; Hafner, J.; Reddy, C.M. Plastic Accumulation in the North Atlantic Subtropical Gyre. Science 2010, 329, 1185–1188. [Google Scholar] [CrossRef] [PubMed]
  52. Wagner, T.P. Reducing Single-Use Plastic Shopping Bags in the USA. Waste Manag. 2017, 70, 3–12. [Google Scholar] [CrossRef] [PubMed]
  53. Zbyszewski, M.; Corcoran, P.L.; Hockin, A. Comparison of the Distribution and Degradation of Plastic Debris along Shorelines of the Great Lakes, North America. J. Gt. Lakes Res. 2014, 40, 288–299. [Google Scholar] [CrossRef]
  54. Miller, J.; Barrett, N.; Gray, A.; Love, J.; Youker, R.; Randall, G.; McGraw, E.; Milner, S. Spatial and Temporal Variations in Microplastic Concentrations in Small Headwater Basins, Southern Blue Ridge Mountains, North Carolina. In Proceedings of the Water Resources Research Institute Annual Conference, Raleigh, NC, USA, 21–22 March 2024. [Google Scholar]
  55. Providence City Hall Rhode Island’s Retail Plastic Bag Ban. Available online: https://www.providenceri.gov/sustainability/rhodeisland-retail-plastic-bag-ban/ (accessed on 20 August 2024).
  56. Colorado General Assembly HB21-1162 Management of Plastic Products. Available online: https://leg.colorado.gov/bills/hb21-1162 (accessed on 20 August 2024).
  57. NCSL State Plastic Bag Legislation. Available online: https://www.ncsl.org/environment-and-natural-resources/state-plastic-bag-legislation (accessed on 20 August 2024).
  58. Parkinson, L. US State Actions Concerning Food Packaging and Chemicals in 2023. Available online: https://www.foodpackagingforum.org/news/us-state-actions-concerning-food-packaging-and-chemicals-in-2023 (accessed on 20 August 2024).
  59. Barnes, D.K.; Galgani, F.; Thompson, R.C.; Barlaz, M. Accumulation and Fragmentation of Plastic Debris in Global Environments. Philos. Trans. R. Soc. B Biol. Sci. 2009, 364, 1985–1998. [Google Scholar] [CrossRef]
  60. Miller, J.; Love, J.; Orbock Miller, S.M.; Cahoon, S.; Youker, R.; Gray, A. Source, Transport Rates, and Transport Dynamics of Plastic Particles in Small Headwater Basins of the Southern Appalachians. In Proceedings of the 4th World Congress of Geology and Earth Sciences, Rome, Italy, 4–6 September 2023. [Google Scholar]
  61. Corcoran, P.L. Benthic Plastic Debris in Marine and Fresh Water Environments. Environ. Sci. Process. Impacts 2015, 17, 1363–1369. [Google Scholar] [CrossRef]
  62. Klein, S.; Worch, E.; Knepper, T.P. Occurrence and Spatial Distribution of Microplastics in River Shore Sediments of the Rhine-Main Area in Germany. Environ. Sci. Technol. 2015, 49, 6070–6076. [Google Scholar] [CrossRef] [PubMed]
  63. Zhang, H. Transport of Microplastics in Coastal Seas. Estuar. Coast. Shelf Sci. 2017, 199, 74–86. [Google Scholar] [CrossRef]
  64. Rodrigues, M.O.; Abrantes, N.; Gonçalves, F.J.M.; Nogueira, H.; Marques, J.C.; Gonçalves, A.M.M. Spatial and Temporal Distribution of Microplastics in Water and Sediments of a Freshwater System (Antuã River, Portugal). Sci. Total Environ. 2018, 633, 1549–1559. [Google Scholar] [CrossRef]
  65. Peleg, E.; Teitelbaum, Y.; Arnon, S. Exploring the Influence of Sediment Motion on Microplastic Deposition in Streambeds. Water Res. 2024, 249, 120952. [Google Scholar] [CrossRef]
  66. Frias, J.P.; Gago, J.; Otero, V.; Sobral, P. Microplastics in Coastal Sediments from Southern Portuguese Shelf Waters. Mar. Environ. Res. 2016, 114, 24–30. [Google Scholar] [CrossRef]
  67. Lithner, D.; Larsson, A.; Dave, G. Environmental and Health Hazards of Chemicals in Plastic Polymers and Products. Sci. Total Environ. 2011, 409, 3309–3324. [Google Scholar] [CrossRef] [PubMed]
  68. Campanale, C.; Massarelli, C.; Savino, I.; Locaputo, V.; Uricchio, V.F. A Detailed Review Study on Potential Effects of Microplastics and Additives of Concern on Human Health. Int. J. Environ. Res. Public Health 2020, 17, 1212. [Google Scholar] [CrossRef] [PubMed]
  69. Hahladakis, J.N.; Velis, C.A.; Weber, R.; Iacovidou, E.; Purnell, P. An Overview of Chemical Additives Present in Plastics: Migration, Release, Fate and Environmental Impact during Their Use, Disposal and Recycling. J. Hazard. Mater. 2018, 344, 179–199. [Google Scholar] [CrossRef] [PubMed]
  70. Nicholson, S.R.; Rorrer, J.E.; Singh, A.; Konev, M.O.; Rorrer, N.A.; Carpenter, A.C.; Jacobsen, A.J.; Román-Leshkov, Y.; Beckham, G.T. The Critical Role of Process Analysis in Chemical Recycling and Upcycling of Waste Plastics. Annu. Rev. Chem. Biomol. Eng. 2022, 13, 301–324. [Google Scholar] [CrossRef]
  71. Chamas, A.; Moon, H.; Zheng, J.; Qiu, Y.; Tabassum, T.; Jang, J.H.; Abu-Omar, M.; Scott, S.L.; Suh, S. Degradation Rates of Plastics in the Environment. ACS Sustain. Chem. Eng. 2020, 8, 3494–3511. [Google Scholar] [CrossRef]
  72. Ncube, L.K.; Ude, A.U.; Ogunmuyiwa, E.N.; Zulkifli, R.; Beas, I.N. An Overview of Plastic Waste Generation and Management in Food Packaging Industries. Recycling 2021, 6, 12. [Google Scholar] [CrossRef]
  73. Thapliyal, D.; Karale, M.; Diwan, V.; Kumra, S.; Arya, R.K.; Verros, G.D. Current Status of Sustainable Food Packaging Regulations: Global Perspective. Sustainability 2024, 16, 5554. [Google Scholar] [CrossRef]
Figure 1. (a) Location map showing the general distribution of sampling sites (indicated as red circles) within the Richland Creek basin. (b) Google Earth image of the Richland Creek study area, outlined in blue. (c) Location of the study area (indicated as red circle) within the southeastern United States [18].
Environments 11 00195 g001
Figure 2. Parameters used to characterize meso- and macroplastics collected along the stream channels. Classification modified from Lippiatt et. al. [24] and Blettler et al. [25]. Photographs show the debris that was collected from Sites 3, 4, and 5 during one sample collection period by students from Tuscola High School.
Environments 11 00195 g002
Figure 3. Items used in the shaker table experiments, including fabrics (ac), films (d,e), and foams (f,g). The samples and shaker table are shown in (h) and (i), respectively.
Environments 11 00195 g003
Figure 4. Low- and high-intensity development by site and by area upstream of each sampling location. Land use at Site 7 is representative of the basin, as it is the most downstream location sampled, roughly 500 m before Richland Creek enters Lake Junaluska.
Environments 11 00195 g004
Figure 5. General characteristics of the collected plastic debris (n = 1737). (a) Proportion of sampled items by material type; (b) proportion of sampled items by original use; (c) proportion of sampled items by color.
Environments 11 00195 g005
Figure 6. Proportion of items of each material type that were found intact versus fragmented. An item was considered intact if the entire item was present and considered fragmented if any visible portion of the item was missing.
Environments 11 00195 g006
Figure 7. Relative frequency of particles by B-axis size (width), categorized in 2.5 cm increments, displaying items with a B-axis of less than 75 cm. Data are stratified by material type and frequency of fragmentation. A total of six items were greater than 75 cm in their B-axis (two intact fabrics, two fragmented fabrics, one intact film, and three fragmented films; <1% of all items) and were not included on these graphs to allow a consistent x-axis scale between graphs.
Environments 11 00195 g007
Figure 8. Total surface area of each plastic material collected at all sites. * One item, a large plastic sheet collected at Site 4, makes up 421,200 cm2 of the total 694,235 cm2 of film material collected. This item is indicated in orange here.
Environments 11 00195 g008
Figure 9. Total surface area of each plastic material collected by site and overall. * One item was removed from these data as it skewed the scale of the remaining values. This was a large plastic sheet found at Site 4 with a surface area of 421,200 cm2. The removal of this item from this figure allows for better visualization of the remaining data.
Environments 11 00195 g009
Figure 10. Photographs showing (a) channel banks composed partly of grass at Site 1. This site’s collection included a reach composed of brushy bank as seen in the background; (b) frequently flooded inset bench and brushy vegetation sampled at Site 2 (Allen Creek); and (c) near-vertical bank covered in brushy vegetation at Site 3. Most of the sampled reaches exhibited this type of bank geometry and vegetation. (d) Large frequently flooded inset bench at Site 5. Note abundance of plastic debris; (e) plastic bags (films) trapped by brushy vegetation near Site 5; and (f) plastic debris trapped by log jam at Site 6.
Environments 11 00195 g010
Figure 11. Photographs showing (a) an example of a high-water strandline at Site 5 and (b,c) examples of plastic located within the strandline, which suggests that plastics were transported and deposited near the water surface during the flood event.
Environments 11 00195 g011
Table 1. Uses and density of common plastic resins found in rivers 1.
ResinAbbreviationDensity (g/cm3) 2Common TypeCommon Functional Uses
Low-density polyethyleneLDPE0.89–0.93FilmSqueeze bottles, container lids, six-pack beverage holders, diapers, bags
High-density polyethyleneHDPE0.94–0.98Film, HardGrocery bags, milk jugs, recycling bins, detergent and cleaner bottles, buoys
PolypropylenePP0.85–0.92HardFood wrappers and containers, dishware, bottle caps, straws, auto parts
Expanded polystyreneEPS0.01–0.04FoamFoam cups, plates, trays, clamshell food containers
PolystyrenePS1.04–1.08HardPlates, cutlery, toys
Polyvinyl chloridePVC1.38–1.41HardPipe, fencing, flooring, tampon applicators
Polyethylene terephthalate (including polyester)PET1.38–1.41Hard, FabricTextiles, beverage bottles, strapping
1 Table modified from [31]. 2 Density at room temperature from [32].
Table 2. Material makeup, concentration, and replenishment rate of items found at each site over consecutive collections.
Sample Location and DateFilmHard PlasticFoamFabricRubberTotal NumberConcentration 1
(Items/m)
Accumulation Rate 2
(Items/Day)
Site 1
28 Sep. 20222599111551.10
24 Mar. 202367213190.380.11
Site 2 (Tributary)
13 Dec. 20224042351301302.60
24 Mar. 20232614470511.020.50
Site 3
28 Sep. 2022206011280.56
24 Mar. 202349139151871.740.49
20 Sep. 202364324951142.280.63
Site 4 (Tributary)
28 Sep. 20225113113691.38
24 Mar. 20233618681691.380.39
20 Sep. 2023287350430.860.24
Site 5
28 Sep. 202250111161791.58
24 Mar. 20231043703991893.781.06
Site 6
13 Dec. 202212262762422865.72
Site 7
28 Sep. 20224522780821.64
24 Mar. 20231146141822264.521.27
Total Period8634322201873517374.96
1 Concentration is presented as items collected per linear meter of riparian zone sampled. 2 Accumulation rate represents the number of items deposited within the entire 50 m sampling area since the previous collection date. For some sites, three collections occurred, thus two accumulation rates have been calculated.
Table 3. Summary of items by original purpose.
Sample LocationShopping BagFood WrapperClothingBottleOther 1Unknown 2
Site 122211202415
Site 2 (Tributary)39101722315
Site 38329918660
Site 4 (Tributary)7015356127
Site 54743936463
Site 6141166310933
Site 7113471918170129
Total5151817532537342
Summary of items collected sorted by original purpose at each site, and as a total, combined for all collection dates and presented as a total number. 1 Items in the “other” category individually made up less than 1% of the total and included industrial hardware, rubber hoses, PVC pipes, electronic cigarettes, recreational equipment, fishing lures and lines, tires, carpet, and geotextiles, among others. 2 Items in the “unknown” category were too deteriorated to be able to determine their original purpose.
Table 4. Summary of items by color.
Sample LocationWhiteTransparentBlackBrownBlueGreenRedYellow
Site 124716116440
Site 2 (Tributary)331520149720
Site 36270302691288
Site 4 (Tributary)4948321881194
Site 579684718199204
Site 6110515630331163
Site 72477740413922202
Total604336241158123766921
Summary of items collected by color at each site, and as a total, combined for all collection dates and presented as a total number.
Table 5. Ability of materials to degrade into microplastics.
MaterialItem Desc.Area (cm2) 1Counts 2Type 3Color 4
Fabric 1Carpet32>400FiberTransparent, black
Fabric 2Brown fabric32>400FiberTransparent, brown
Fabric 3Colorful fabric32>400FiberTransparent, red, black, blue
Film 1New grocery bag64>400FilmBlue
Film 2Old grocery bag64>400FilmWhite, red
Foam 1Old foam to-go container32>400FoamWhite
Foam 2New foam cup326 (Below LOD 5)N/AN/A
BlankN/AN/A6FibersBlue, black
Results of small-scale microplastic production study, presented as a total of all replicates combined. 1 Total surface area of material used in microplastic production study. 2 Total number of microplastic particles counted. A value of >400 indicates that the number of particles was too numerous to accurately count, thus counting was stopped when 100 particles were counted on a slide. The value in the table represents a sum of four replicates per material. 3 Predominate type (shape) of particles present in the sample. 4 Predominate color(s) of particles present in the sample. 5 Limit of detection (LOD) was set by blank replicates.
Table 6. Summary of the dominant plastic resin types associated with plastic debris found in this study and previous studies.
River (Reference)Sampling MethodDominant Types of ItemsDominant Resin Compositions 1,2
Richland Creek
(this study)
Surveys of deposited ItemsBags, food wrappers, bottles, fabricsHDPE, LDPE, PET, PP; less abundant—PS, EPS, PVC
Parana Floodplain Lakes
(Blettler et al.) [25]
Surveys of deposited ItemsFood wrappers, bags, bottles, Styrofoam food containersPP, PS, HDPE, LPE, PET
Seine River
(Gasperi et al.) [19]
Floating detention boomFood wrappers and containers, plastic cutleryPP, PE, & less amounts of PET
Thames River
(Morritt et al.) [23]
Eel fyke netsFood wrappers, tobacco packaging, sanitary towel components, cups, cutlery---
Tamar Estuary
(Sadri and Thompson) [22]
Towed net (surface)Not specifiedPE, PS, PP; minor amounts of PVC, PET (polyester), Nylon
1 Listed in order of abundance in study; 2 plastic composition: PP—polypropylene; PS—polystyrene; EPS—expanded polystyrene; HDPE—high-density polyethylene; LDPE—low-density polyethylene; PET—polyethylene terephthalate; polyester—(including PET, polybutylene terephthalate, polyethylene naphthalate, polytrimethylene terephthalate); PA—nylon (polyamide).
Disclaimer/Publisher’s Note: The statements, opinions and data contained in all publications are solely those of the individual author(s) and contributor(s) and not of MDPI and/or the editor(s). MDPI and/or the editor(s) disclaim responsibility for any injury to people or property resulting from any ideas, methods, instructions or products referred to in the content.