Article

Assessing the Resilience of Enteric Bacteria in Manure in Response to Changes in Relative Humidity and UV-B Light

1
Department of Veterinary Integrative Biosciences, Texas A&M University, College Station, TX 77843, USA
2
Texas A&M AgriLife Research, Texas A&M University System, Amarillo, TX 79106, USA
3
Texas A&M AgriLife Research, Texas A&M University and Extension Center, Vernon, TX 76384, USA
4
Department of Veterinary Pathobiology, Texas A&M University, College Station, TX 77843, USA
5
Department of Animal Science, Texas A&M AgriLife Extension Service, Texas A&M University, Amarillo, TX 79106, USA
*
Authors to whom correspondence should be addressed.
These authors contributed equally to this article.
Environments 2024, 11(9), 197; https://doi.org/10.3390/environments11090197
Submission received: 19 June 2024 / Revised: 15 August 2024 / Accepted: 4 September 2024 / Published: 10 September 2024
(This article belongs to the Special Issue Antimicrobial Resistance and Its Environmental Risk)

Abstract

:
Dehydrated manure from agricultural animal feedlots can become aerosolized and may potentially harbor viable antimicrobial-resistant bacteria. Little is known about the dynamics and risk of bacteria in bioaerosols originating from the feedyard environment. Nutrient deficiency, desiccation, UV exposure, temperature, and pH changes can affect bacterial viability. In this study, we investigated the impact of changes in relative humidity (RH) and UV-B exposure on enteric bacterial survival in vitro to simulate environmental conditions in cattle feedyards. Cattle manure samples were placed in two separate chambers with 73% RH and 31% RH, respectively. For the UV-B experiment, samples were placed in a chamber exposed to UV-B (treated) or in a chamber exposed to LED light (control). Samples from both experiments were spiral plated in triplicate onto selective agar media to quantify total aerobic bacteria, E. coli (total and antimicrobial-resistant (AMR)), and Enterococcus spp. (total and AMR). Results showed that enteric bacteria from cattle manure can withstand at least two stress conditions, including low RH levels and UV-B exposure. Moreover, the data revealed that antimicrobial-resistant bacteria can persist in manure under the harsh conditions that may be encountered in a feedyard environment. These findings underscore the need for mitigation strategies in feedlots to minimize the overall risk of bioaerosol formation.

1. Introduction

Antimicrobial-resistant (AMR) bacteria pose a multifaceted threat to human and animal health and the global economy [1] causing approximately 1.27 million human deaths worldwide. Annually in the United States, more than 2.8 million people suffer from antimicrobial-resistant infections, resulting in over 35,000 deaths, according to the United States Centers for Disease Control and Prevention (CDC) [2]. Antimicrobial-resistant bacteria have the potential to be transmitted among and to humans through various pathways, including healthcare facilities [3], consumption of contaminated food, direct contact with animals and their environment [4], international travel and global trade [5], and environmental contamination (disposal, waste, industrial processes) [3].
There have been many studies on AMR bacterial clinical infections in human health [6]; however, more recently attention has shifted to environmental studies [7], given the importance of the environment as a reservoir of resistant bacteria [3]. Robust surveillance programs such as the U.S. National Antimicrobial Resistance Monitoring System (NARMS) have been developed to monitor trends in antimicrobial resistance in the United States [8]. E. coli and Enterococcus spp. are utilized by NARMS as Gram-negative and Gram-positive indicator bacteria, respectively. Indicator organisms are readily present and easy to culture and therefore are ideal for monitoring antimicrobial resistance trends and detecting new mechanisms of antimicrobial resistance [9]. E. coli and Enterococcus spp. are found in the normal gut flora of both humans and animals [10,11], and they are also commonly found in their respective environments, allowing their use in the investigation of antimicrobial resistance via a One Health approach.
Antimicrobials are used in animal production for disease prevention, treatment, and control [12,13], potentially leading to the development of antimicrobial-resistant bacteria. These bacteria have the potential to subsequently be released into the environment and the watershed and may be dispersed by surface runoff, air transport, redeposition, and groundwater flow [14]. Although various studies have investigated antimicrobial resistance in bacteria in the environment from intensive animal production facilities [15], few studies have studied airborne transmission of antimicrobial-resistant bacteria, which is of increasing concern [16,17,18]. Dehydrated animal manure in feedlots generates dust-like particles with attached bacteria that can be small enough to become aerosolized [19]. In cattle feedyards, the maximum horizontal dispersion of airborne bacteria is generally expected to occur during the evening dust peak (EDP) period. The conditions responsible for an EDP are drier pen surfaces, increased animal activity and associated hoof action, increased atmospheric stability, decreased boundary-layer mixing height, diminished winds, and reduced vertical atmospheric dispersion [20].
The persistence of bacteria in the environment varies among bacterial species; for instance, Salmonella spp. and E. coli are closely related and belong to the Enterobacteriaceae family. However, Salmonella spp. survival is significantly longer in terrestrial habitats than E. coli [21]. Gram-positive bacteria have a thick layer of peptidoglycan, offering structural integrity and protection against environmental pressures and turgor, providing increased resistance to certain environmental conditions when compared to Gram-negative bacteria like E. coli [22]. Additionally, Gram-positive bacteria such as Enterococcus spp. can adopt a viable but non-culturable state (VNC) as a survival strategy [23] in response to adverse conditions (e.g., solar radiation) [24]. Bacteria respond to stressful situations by deploying adaptive and protective responses that include altering gene expression and cell physiology, which may ultimately impact their susceptibility to antimicrobials [25].
Environmental factors that greatly influence bacterial survival, particularly in the Texas panhandle, are relative humidity, temperature, and solar radiation [19]. Relative humidity and temperature impact the moisture content of the environment and atmosphere, where high temperatures and low relative humidity can lead to the desiccation of bacterial cells. Bacterial desiccation leads to molecular condensation, membrane disruption, and denaturation of proteins due to loss of enzymatic activity caused by a reduction in protein hydration shells [26]. Desiccation can also cause DNA double-strand breaks and oxidative lesions, as well as damage to RNA, proteins, lipids, and cellular metabolites [27,28]. Mechanisms of resistance to desiccation vary among bacterial species. Salmonella spp. have a higher chance of surviving desiccation than related organisms, such as E. coli and many other Enterobacteriaceae [29]. This is due to complex pathways involving physiological actions and coordinated genetic responses like the upregulation of particular genes like atpH and atpG (energy production), corA (regulates magnesium, which is vital for bacterial health and capacity to withstand the stress of drying), and rfbAU, essential for the O-antigen (O polysaccharide) biosynthetic process (polysaccharides may act as a water reservoir in dry terrestrial environments) [30,31,32].
Solar radiation is harmful to bacteria [33] due to ultraviolet (UV) light exposure that damages proteins, membranes, and DNA [34]. The three types of UV radiation are classified according to wavelength: UV-C radiation (100–280 nm) is absorbed by the ozone layer and is the most dangerous form of radiation [35]; UV-B radiation (280–315 nm) can penetrate the Earth’s surface and cause damage to host DNA; and UV-A radiation (315–400 nm) accounts for 95% of UV radiation exposure [35,36]. Although UV-A carries less energy than UV-B photons and does not directly affect DNA, UV-A can cause oxidative stress in the cell [37]. Bacteria have various pathways to repair damage caused by UV radiation [38]. Studies have demonstrated that several bacterial species, including E. coli [34,39], Salmonella enterica subspecies enterica serovar Typhimurium [40], Pseudomonas cichorii [41], and Bacillus subtilis can develop resistance to UV light [42]. Environmental stressors can affect the antimicrobial susceptibility of bacteria, and it has been reported that repeated exposure of Salmonella spp., E. coli, and Listeria spp. to UV-C increased antimicrobial resistance to clinically relevant antimicrobials that target bacterial protein synthesis (aminoglycosides, tetracyclines, and glycylcyclines) or DNA replication (fluoroquinolones or polymyxins) [43].
Understanding bacterial survival in airborne particulate matter originating from cattle feedyards is of high importance to stakeholders in the cattle industry. To understand bacterial dynamics in particulate matter, we need to evaluate the effect of individual environmental conditions on the viability and survival of bacteria in the feedyard manure. This study was designed to determine the effect of UV-B light and changes in relative humidity on the survival of aerobic bacteria and specific enteric indicator organisms (E. coli and Enterococcus spp.) in manure to better understand the potential risk factors for transmission of antimicrobial-resistant bacteria from cattle feedyards to the surrounding environment.

2. Materials and Methods

2.1. Experimental Design

Laboratory experiments were conducted at the Texas A&M AgriLife Research facility in Bushland, Texas, and samples were processed, and bacterial isolation and characterization were performed at the College of Veterinary Medicine and Biomedical Sciences at Texas A&M University in College Station, Texas.

2.1.1. UV-B

Manure was collected at a commercial feedyard from pens containing beef cattle fed a standard corn and roughage-based diet. Two types of pen surface samples were evaluated: fresh manure pack and dry manure pack. Fresh and dry manure were each divided into 8 aliquots of 5 g (i.e., 2 pre-exposure, 3 untreated, and 3 treated). Samples were placed at an average thickness of 4 mm into 40 mm by 4 mm vessels (small plastic octagonal disks with a cylindrical reservoir on top) that were 3D-printed using a special polymer, Flourinar-C (Nile Polymers, Centerville, UT, USA). Vessels were placed into chambers and either exposed to UV-B light (treatment) or LED light (control).
UV-B chambers (63.5 cm × 63.5 cm × 25.4 cm) were built using 1/8-inch aluminum diamond-plate sheeting. Aluminum was chosen to foster heat dissipation from the chamber’s light sources. The lid of each chamber was constructed using 24-inch recessed ceiling light fixtures. The control chamber was fitted with light emitting diode (LED) light bulbs in the visible range of 400–700 nm, while the UV-B chamber was fitted with two Philips TL20W/01 narrowband UV-B light bulbs that emitted 300–320 nm light with a peak output of 311 nm (Philips, Eindhoven, The Netherlands). The chamber temperature was controlled with an Inkbird proportional integral derivative controller (Model M08Y8GX1WT) with a K-type thermocouple (Inkbird, Luohu District, Shenzhen, China). During the experiment, the enclosure was held at 22 °C (+/−1 °C). A heat exchanger was constructed using 8 feet of 0.635 cm copper tubing connected to the underside of the chamber and connected to a 240 mm 2-fan CPU radiator with 0.9525 cm Tygon tubing. A 12 V submersible mini water pump (63 gph) (Cytec, Woodland Park, NJ, USA) was used to circulate water in the system.
The UV-B dosage was based on 1 h at the maximum output of the UV-B bulbs. UV-B exposure was variable by location within the chamber; however, the variability was accounted for using 50.8 mm × 50.8 mm grids that were marked out in the base of the chamber. The UV-B exposure in each cell of the grid was measured using a digital UV AB light meter (Model UV513AB; General Tools and Instruments, Secaucus, NJ, USA) placed in the center of each cell. Exposures were measured and recorded with the lid closed. A UV exposure map was created with the data and used to calculate the exposure times required to achieve specified UV dose rates (Supplemental Figure S1). The first set of samples was placed into chamber grid cells with a UV-B exposure of 4.6 W/m2 per 1 h, which resulted in a dose of 16,560 J/m2. The second set of samples received 2× the dose (33,120 J/m2) of the first set and was placed into cells on the chamber grid that received 4.4 W/m2 for 2 h and 5 min. The third set of samples received 3× the dose (49,680 J/m2) and was placed into the cells of the chamber grid that received 4 W/m2 for 3 h and 27 min (Table 1). Samples were removed from the chambers as the UV-B dose was achieved. Samples were transferred to sterile conical tubes and shipped on ice overnight to the laboratory at Texas A&M University in College Station, TX, for microbiological processing.

2.1.2. Relative Humidity

Fresh manure was collected from a pen floor at the Texas A&M AgriLife Research experimental feedyard in Bushland, TX, containing beef cattle fed a standard steam-flaked corn-based finishing ration. Manure was divided into 10 aliquots of 10 g each (i.e., 2 pre-exposure, 4 untreated, and 4 treated) and placed into Rosin Press Bags (NugSmasher, Lake Havasu, AZ, USA) housed in relative humidity (RH) chambers (Weathertight® 30 qt. box-IRIS USA, Surprise, AZ, USA). Additionally, a portion of the sample was weighed and dried in an oven at 60 °C for 24 h to produce the dry manure to determine the ratio of wet and dry material in each sample to later standardize bacterial counts based on grams (g) of dry matter. On average, fresh manure samples contained 1.14 g of wet matter and 0.040 g of dry matter, whereas dry samples had 0.34 g of wet matter and 0.31 g of dry matter. The treatment chamber contained a saturated solution of Magnesium Chloride (MgCl), and the control chamber contained Sodium Chloride (NaCl) to maintain the different levels of relative humidity in each chamber. The headspace in the control chamber was maintained at 73% RH, hereby referred to as high humidity (HH), while the treatment chamber was maintained at 31% RH, hereby referred to as low humidity (LH) [44]. The selection of the percentage of 31% RH (desiccation) was based on the average RH (33%) in the Texas Panhandle environment, and this RH has been used in previous research (RH 10–40%) [45,46,47]. Previous experiments by the research group (unpublished) found that 91% RH in the control group led to mold and fungus growth, which could impact bacterial growth, so a lower RH of 73% was selected for the control chamber. The temperature inside the chambers was held constant at 25.5 °C. A sample aliquot was removed from each chamber at 1-day intervals for 4 d and shipped on ice overnight to the laboratory at Texas A&M University in College Station, TX, for microbiological processing.

2.2. Bacterial Analysis

Two subsets of 5 g each were taken from the initial sample before exposure in the UV-B experiment, and 2 subsets of 10 g each were taken from the initial sample before exposure in the RH experiment and processed to determine initial bacterial counts (total aerobic bacteria, E. coli, and Enterococcus spp.). Samples from the UV-B and RH experiments were processed in triplicate. Samples were weighed and transferred to 1× PBS in a 1:10 dilution. Fifty microliters from the diluted sample were spiral plated onto different agar types using an Eddy Jet® 2 spiral plater (Neutec Group Inc., Farmingdale, NY, USA). Samples were spiral plated onto Tryptic Soy Agar (TSA; Difco, Becton Dickinson, Franklin Lakes, NJ, USA) for total aerobic bacterial counts. Samples were spiral plated onto three types of m-Enterococcus agar (m-Ea; Difco, Becton Dickinson, Franklin Lakes, NJ, USA): plain, supplemented with tetracycline at 16 mg/L (TET), and supplemented with erythromycin at 8 mg/L (ERY) for total and antibiotic-resistant Enterococcus spp. counts. Samples were spiral plated onto three types of MacConkey agar (Difco, Becton Dickinson, Franklin Lakes, NJ, USA): plain, supplemented with tetracycline at 16 mg/L (TET), and supplemented with ceftriaxone at 4 mg/L (AXO) for total and antibiotic-resistant E. coli counts. Antimicrobial concentrations for antibiotic-supplemented plates were chosen according to the Clinical and Laboratory Standards Institute (CLSI) human clinical breakpoints [48] based on the Minimum Inhibitory Concentration (MIC). Tetracycline, ceftriaxone, and erythromycin were chosen to track antimicrobial resistance in enteric bacteria due to their importance in human and animal health.
The TSA and MacConkey plates were incubated at 37 °C for 18 h, while m-Ea plates were incubated at 42 °C for 48 h. After incubation, all aerobic bacteria, presumptive E. coli (pink, lactose fermenting) colonies, and Enterococcus spp. (dark red to maroon with a cream halo) colonies based on phenotypic characteristics were counted using the automated Flash & Go colony counter (Neutec Group Inc., Farmingdale, NY, USA). One presumptive E. coli and Enterococcus spp. colony per plate was plated onto tryptic soy agar (TSA) with 5% sheep blood agar (RemelTM, Lenexa, KS, USA) and incubated at 37 °C for 24 h and 48 h, respectively, for genus and species confirmation using matrix-assisted laser desorption/ionization time of flight mass spectrometry (MALDI-TOF) (Bruker Daltonik GmbH, Billerica, MA, USA). A detailed description of the MALDI-TOF methods was previously published [49].

2.3. Statistical Analysis

Statistical analyses were conducted with Stata/BE version 17 (StataCorp LLC., College Station, TX, USA). Standardization of the bacterial counts per gram of dry material was carried out in the relative humidity experiment only. To standardize the bacterial counts to CFU per gram of dry matter sample, the ratio of dry and wet mass was determined using the following equation:
R a t i o   d r y w e t = m a s s   d r y   ( d r y   m a t t e r   g ) / m a s s   w e t   ( s a m p l e   ( g )
CFU counts were divided over the R a t i o   d r y w e t to obtain an adjusted count of CFU per g of dry matter. For both the UV and RH experiments, the quantities of aerobic bacteria, E. coli, and Enterococcus spp. in the samples were expressed in log10 CFU (colony-forming units) per gram of sample. Data were initially analyzed using full-factorial multilevel mixed-effects linear regression models to determine the effect of treatment, time, and their interaction on the bacterial count outcomes. For the UV experiment, the log10-transformed CFU per g of sample was assigned as the dependent variable, and treatment (UV-B exposure or LED exposure), time, and the treatment interaction with time as independent variables. Replicate was included as a random effect to account for the potential clustering of samples due to processing in triplicate. The pre-exposure samples, taken at time 0, were considered the baseline. For the RH experiment, the log10-transformed CFU per g of dry matter was assigned as the dependent variable, and RH exposure (HH or LH), day, and the interaction of treatment with day were the independent variables under consideration. Replicate also was included as a random effect to account for the potential clustering of samples due to processing in triplicate. The pre-exposure samples collected on day 0 were the baseline. Marginal mean estimates were generated from the final models, and graphical representations of the temporal dynamics were plotted. Multiple comparisons to evaluate the differences between the bacteria by media type by treatment or by time or day were conducted using pairwise comparisons with Bonferroni corrections to adjust for multiple comparisons [50].

Imputation of Missing Counts

To address the high number of zeros in the CFU data (>5%) due to the limit of quantification (LOQ) in spiral-plating for ceftriaxone-resistant E. coli counts in the RH experiment and E. coli total counts, tetracycline-resistant E. coli counts, Enterococcus spp. total counts, tetracycline-resistant Enterococcus spp. counts, and erythromycin-resistant Enterococcus spp. counts from dry manure samples in the UV-B experiment, additional model forms (truncated and interval-censored regression), and multiple imputations by chained equation (MICE) models were employed using Stata/BE version 17.0 (StataCorp LLC, College Station, TX, USA) [51]. In multiple imputation, to create full datasets, each missing value (value below the LOQ) is replaced by m suitable values. Then, using typical methods without missing data, each filled dataset is separately examined, producing m sets of estimates and their variances. A final estimate that considers both the observed data and the fact that certain values were missing is created by combining these estimations [52]. A three-step process was followed to impute missing values. First, the data were explored using histograms and summary statistics (number of observations, missing, mean, minimum, and maximum counts) to better understand the distribution of the data. Next, the appropriate auxiliary variables were selected to help improve the predictive missingness and correlation with the observed data, as recommended by others [53]. Later, most of these auxiliary variables were not used in the estimation analysis. Finally, an independent imputation model was employed that best matched the distribution and requirements of the data; later, the imputed values were identified to fit with the observed data [54]. Multiple imputations were performed, followed by estimation of the data using a multilevel mixed-effects linear regression model. The variables in the model included log10-transformed CFU per g of dry sample as the dependent variable and with treatment and time or day and their interaction as independent variables; further, replicate was included as a random effect to account for potential clustering due to processing the samples in triplicate. The pre-exposure sample outcomes for each experiment were considered the baseline in the model. The multilevel mixed-effects linear regression model followed the same parameters as the model without imputation.

3. Results

3.1. Descriptive Statistics

3.1.1. UV-B

A total of 24 fresh and 24 dry manure samples were processed for bacterial analysis. These included three initial pre-exposure samples, and three samples per additional exposure time (Time 1, Time 2, and Time 3) for both the UV-B treatment and control group. All 24 fresh manure samples exhibited growth for all the bacteria cultured (i.e., all aerobic bacteria, E. coli, and Enterococcus spp.), including the AMR bacteria (Table 2). For the dry manure samples, the prevalence of cultured bacteria was lower, except for aerobic bacteria, where 100% (24/24) of the samples were positive. Raw bacterial CFU (log10) is described in Table 3. Detailed descriptive statistics and imputation model parameters by experiment are described in Figure S1.

3.1.2. Relative Humidity

A total of 30 fresh manure samples were processed for bacterial analysis, including three initial pre-exposure samples and a further three samples per day (Day 1, Day 2, Day 3, and Day 4) for both the treatment and control groups. Most of the samples were positive for the cultured bacteria, except for AXO-resistant E. coli, where 70% (21/30) of the samples were positive.

3.2. Quantitative Bacterial Dynamics

A two-way full factorial multilevel mixed-effects linear regression model was used to explore the effect of treatment and time on the bacterial counts, including aerobic bacteria, E. coli, tetracycline-resistant E. coli, ceftriaxone-resistant E. coli, Enterococcus, tetracycline-resistant Enterococcus, and erythromycin-resistant Enterococcus.

3.2.1. UV-B

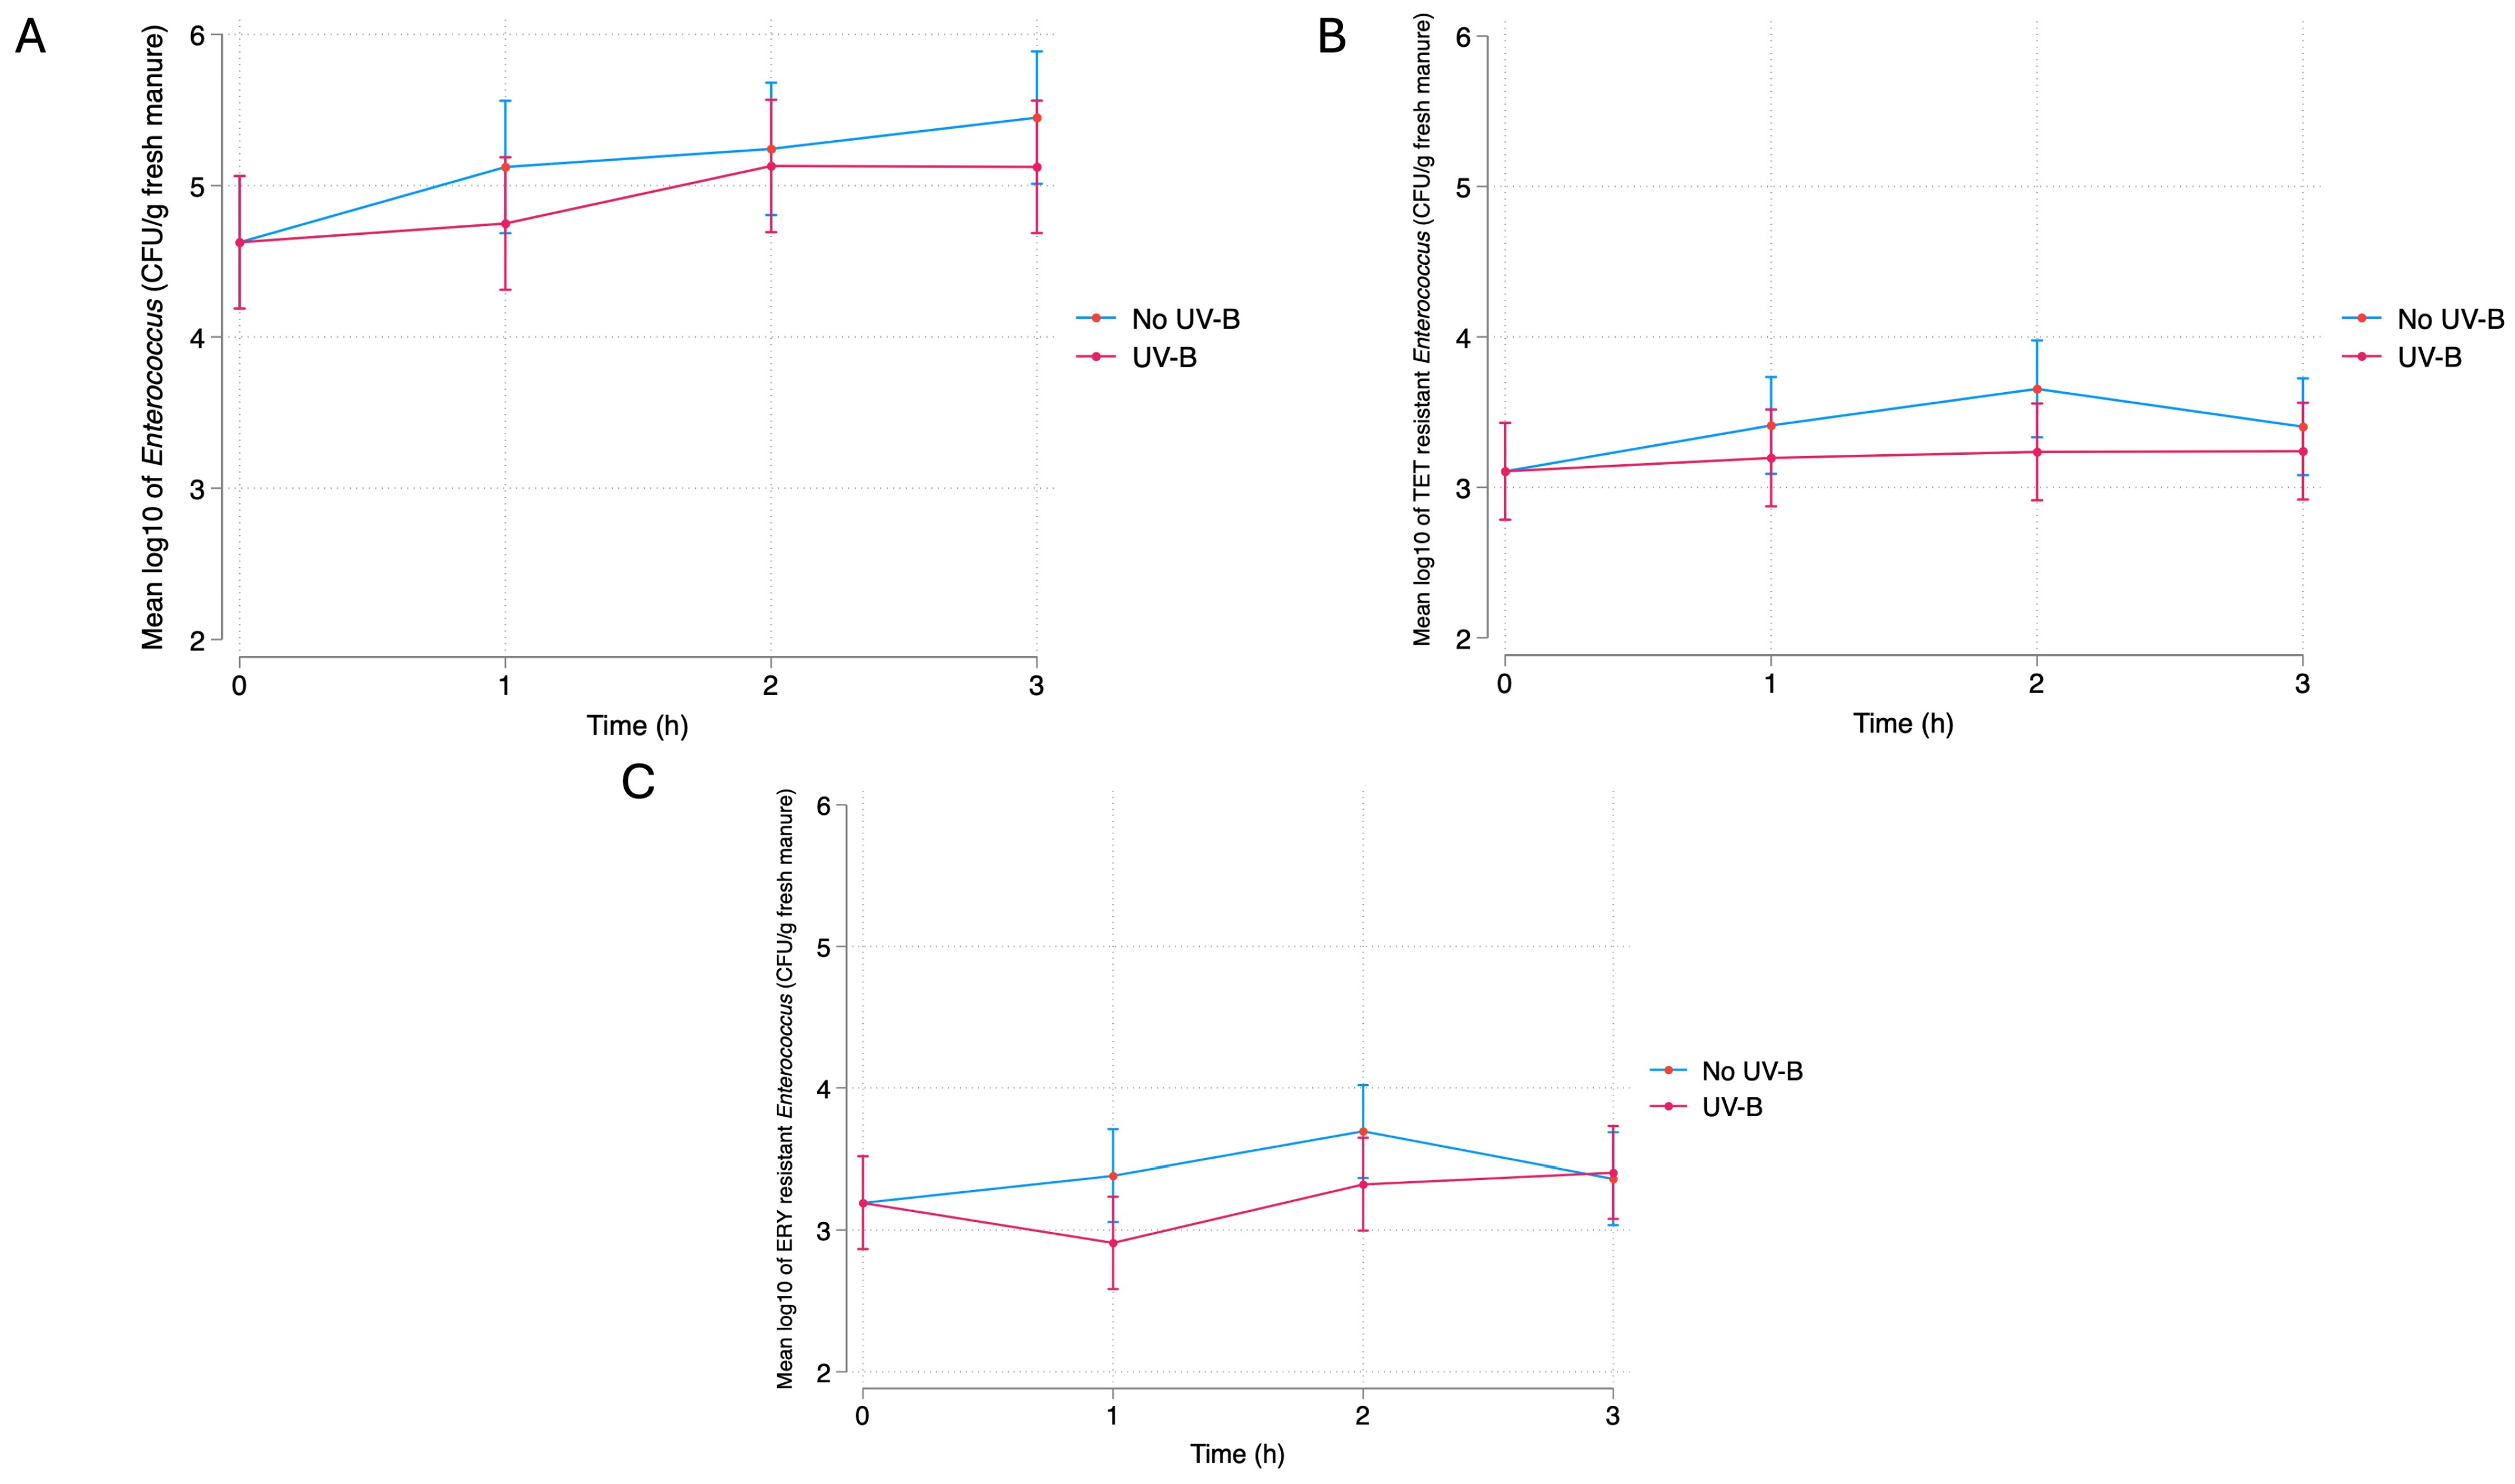
Fresh Manure Bacterial Quantification
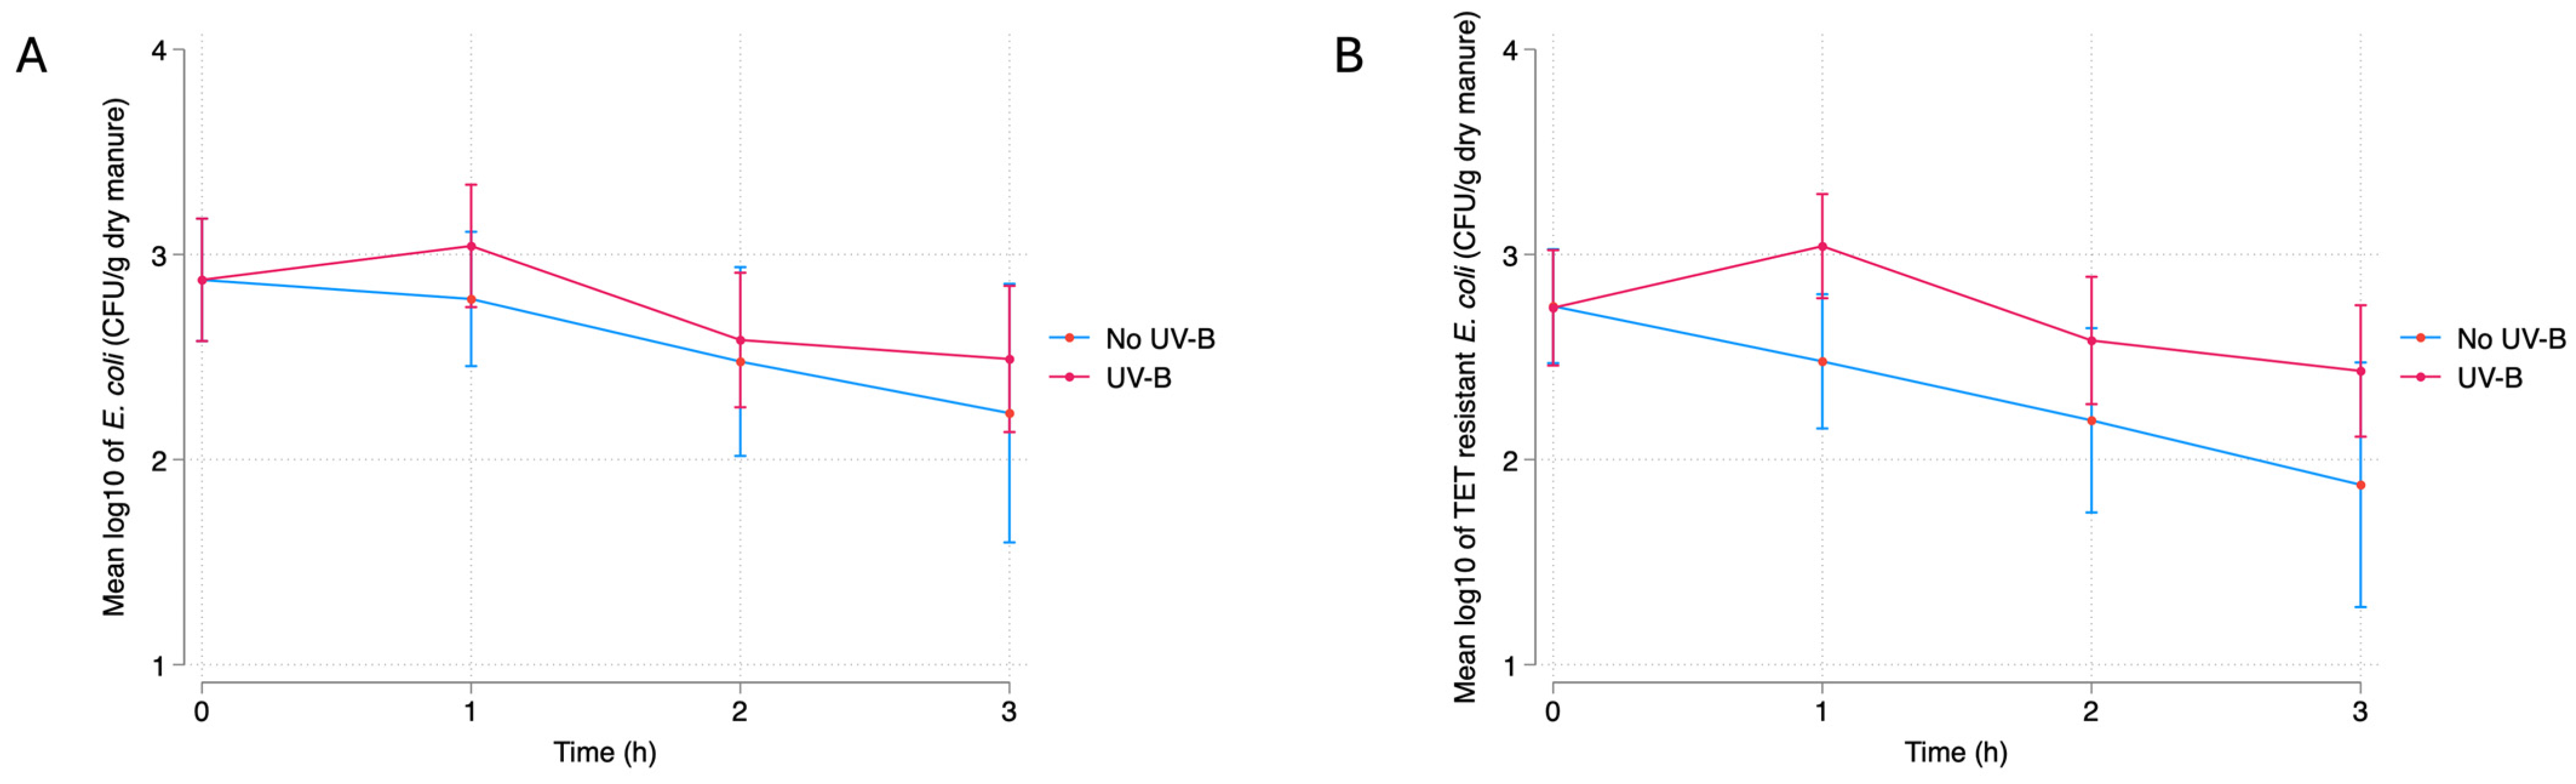
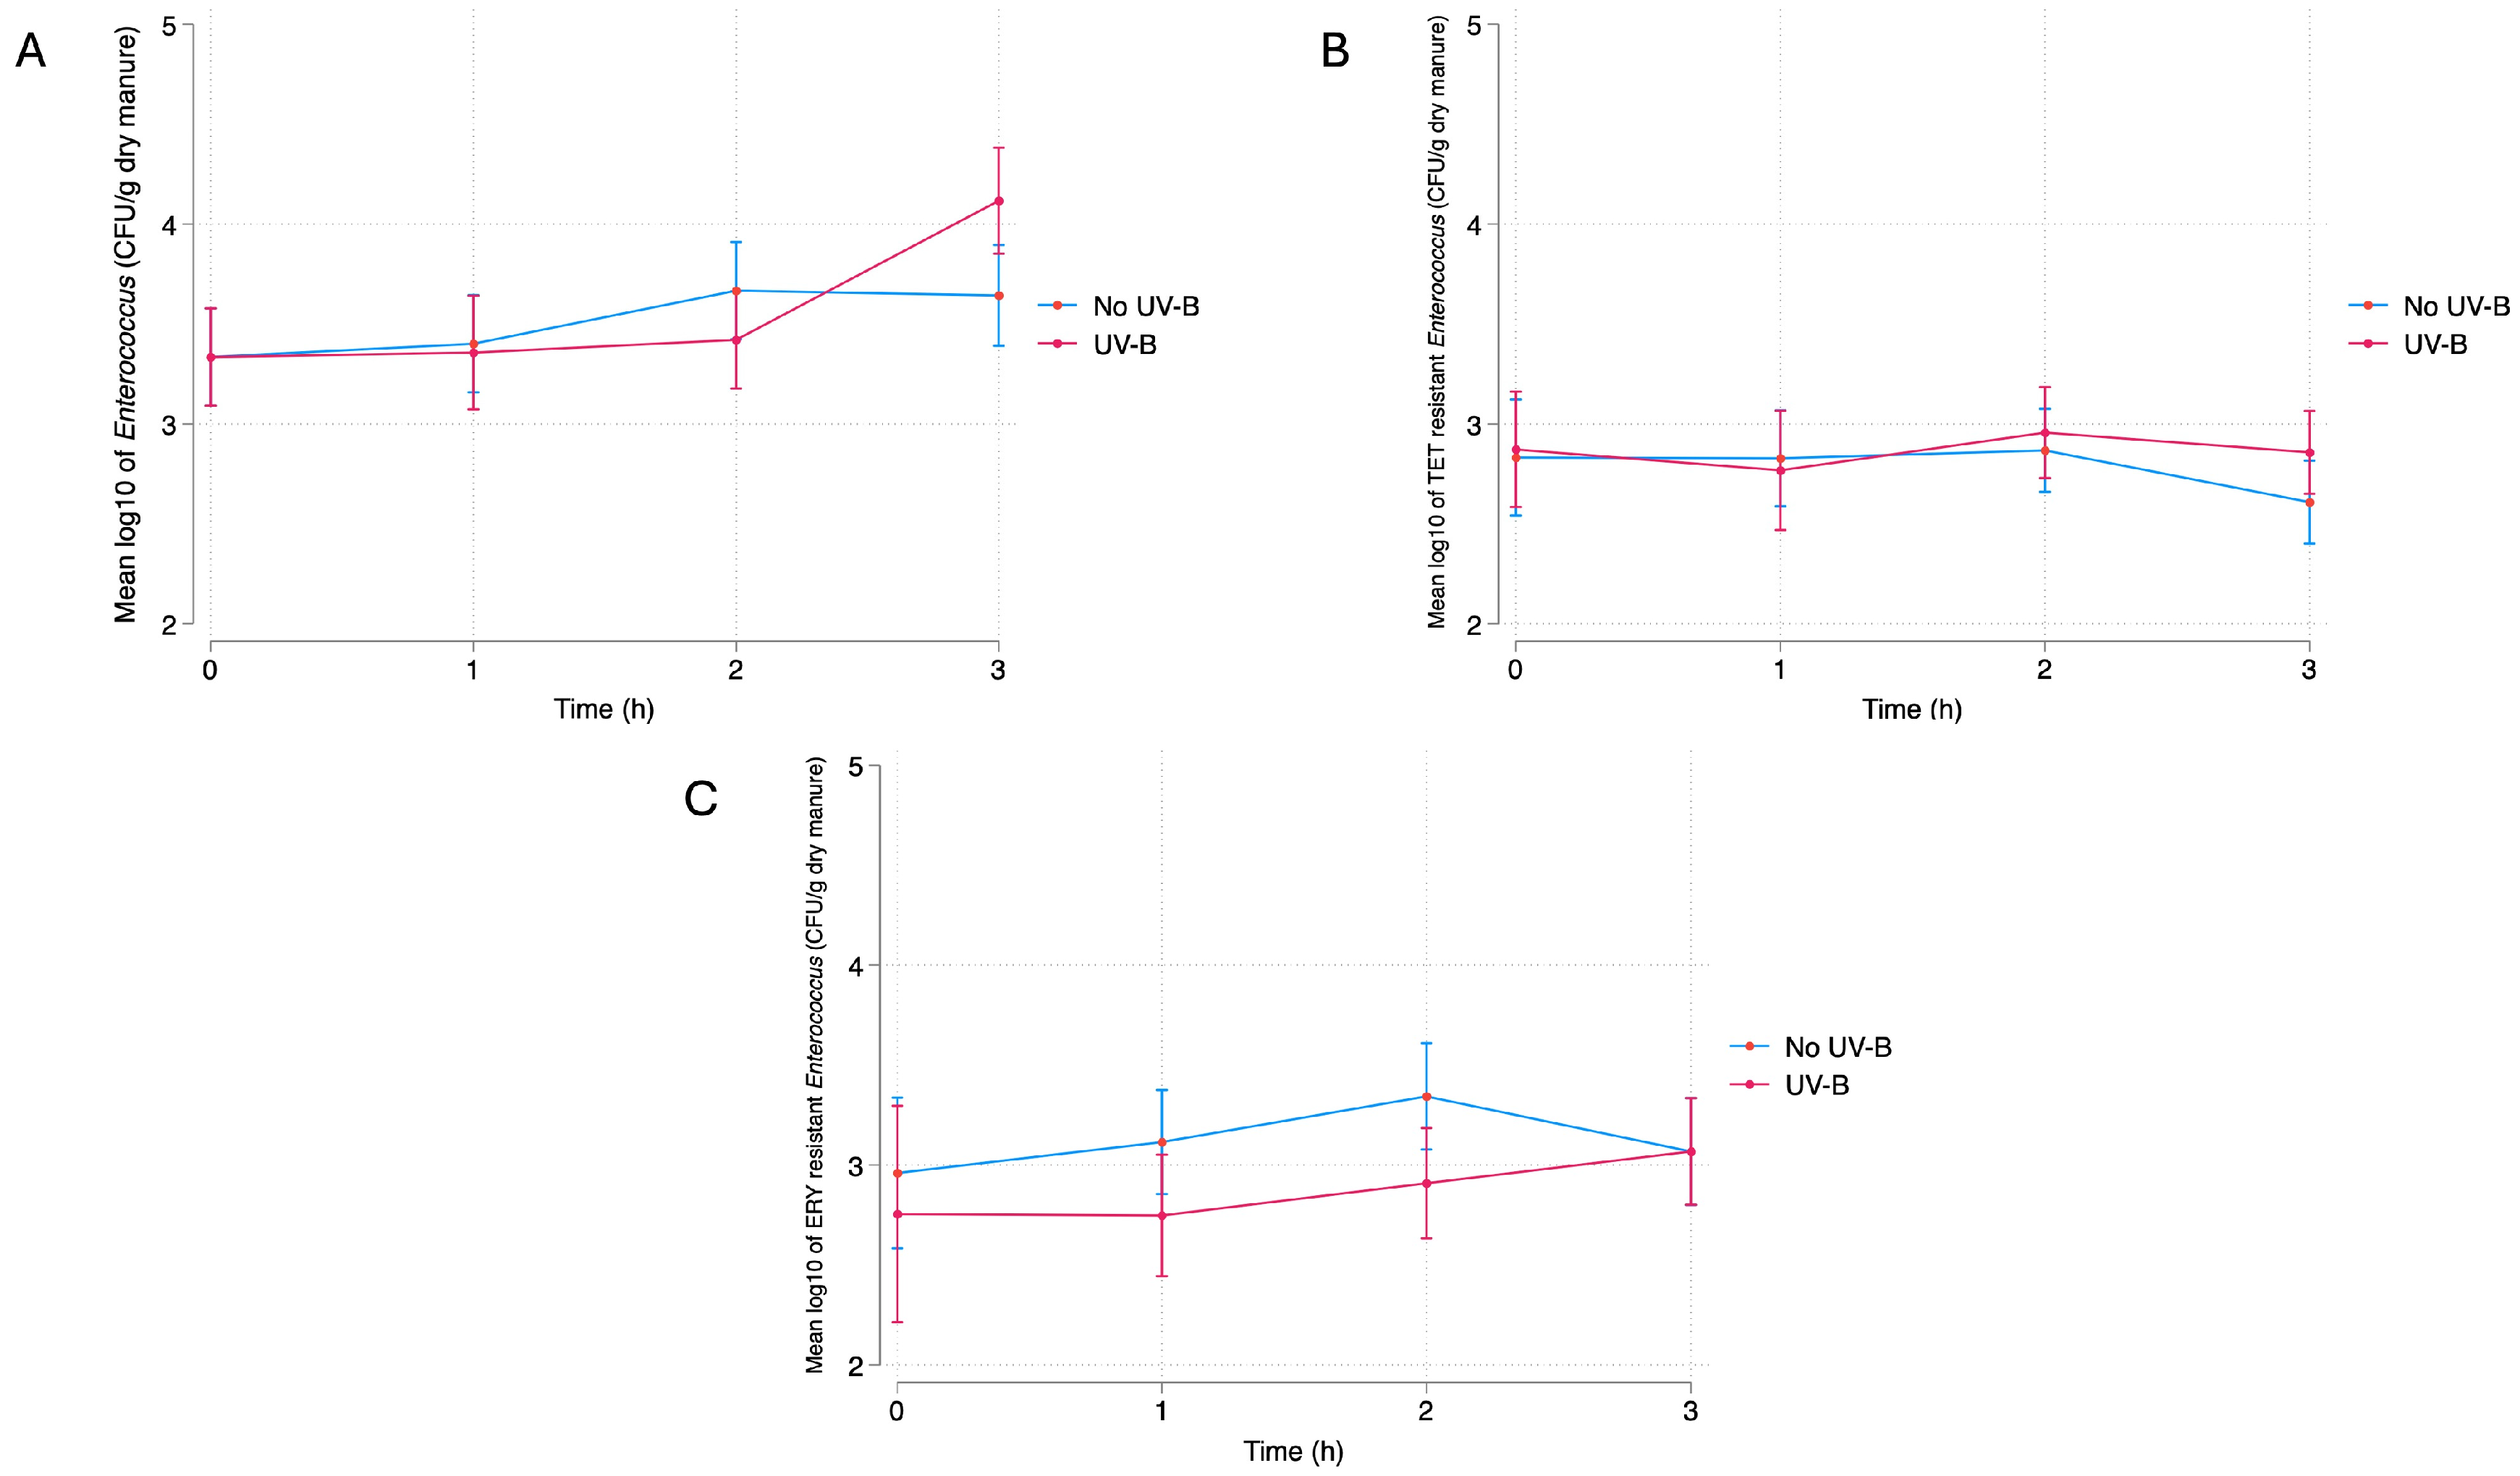
Modeled marginal means of bacterial log10 CFU/g with 95% confidence intervals by treatment group and across study times are presented (Figure 1, Figure 2 and Figure 3). There were no significant differences (p > 0.05) in aerobic bacteria (Figure 1), E. coli (Figure 2A), Enterococcus spp. (Figure 3A), tetracycline-resistant Enterococcus spp. (Figure 3B), or erythromycin-resistant Enterococcus spp. (Figure 3C) between treatment groups across the time points. There was a significant difference (p < 0.05) in the quantity of tetracycline-resistant E. coli at Time 3 (Figure 2B) and ceftriaxone-resistant E. coli between treatment groups at Time 2 (Figure 2C).

Dry Manure

Due to a limit of quantification in the spiral-plating process, there was a high number of zero or missing observations for total E. coli (36%), tetracycline-resistant E. coli (56%), total Enterococcus spp. (8%), tetracycline-resistant Enterococcus spp. (29%), and erythromycin-resistant Enterococcus spp. (35%) for the dry manure samples. No ceftriaxone-resistant E. coli were cultured from the dry manure samples. E. coli counts were imputed using the MICE model with truncated regression, while Enterococcus spp. were imputed using MICE with interval-censored regression. A two-way full factorial multilevel mixed-effects linear regression model was used to determine the effect of treatment and time on the bacterial counts.
No significant (p > 0.05) differences in aerobic bacteria (Figure 4), E. coli (Figure 5A), tetracycline-resistant E. coli (Figure 5B), Enterococcus spp. (Figure 6A), tetracycline-resistant Enterococcus spp. (Figure 6B), or erythromycin-resistant Enterococcus spp. (Figure 6C) were observed between treatment groups across the time points.

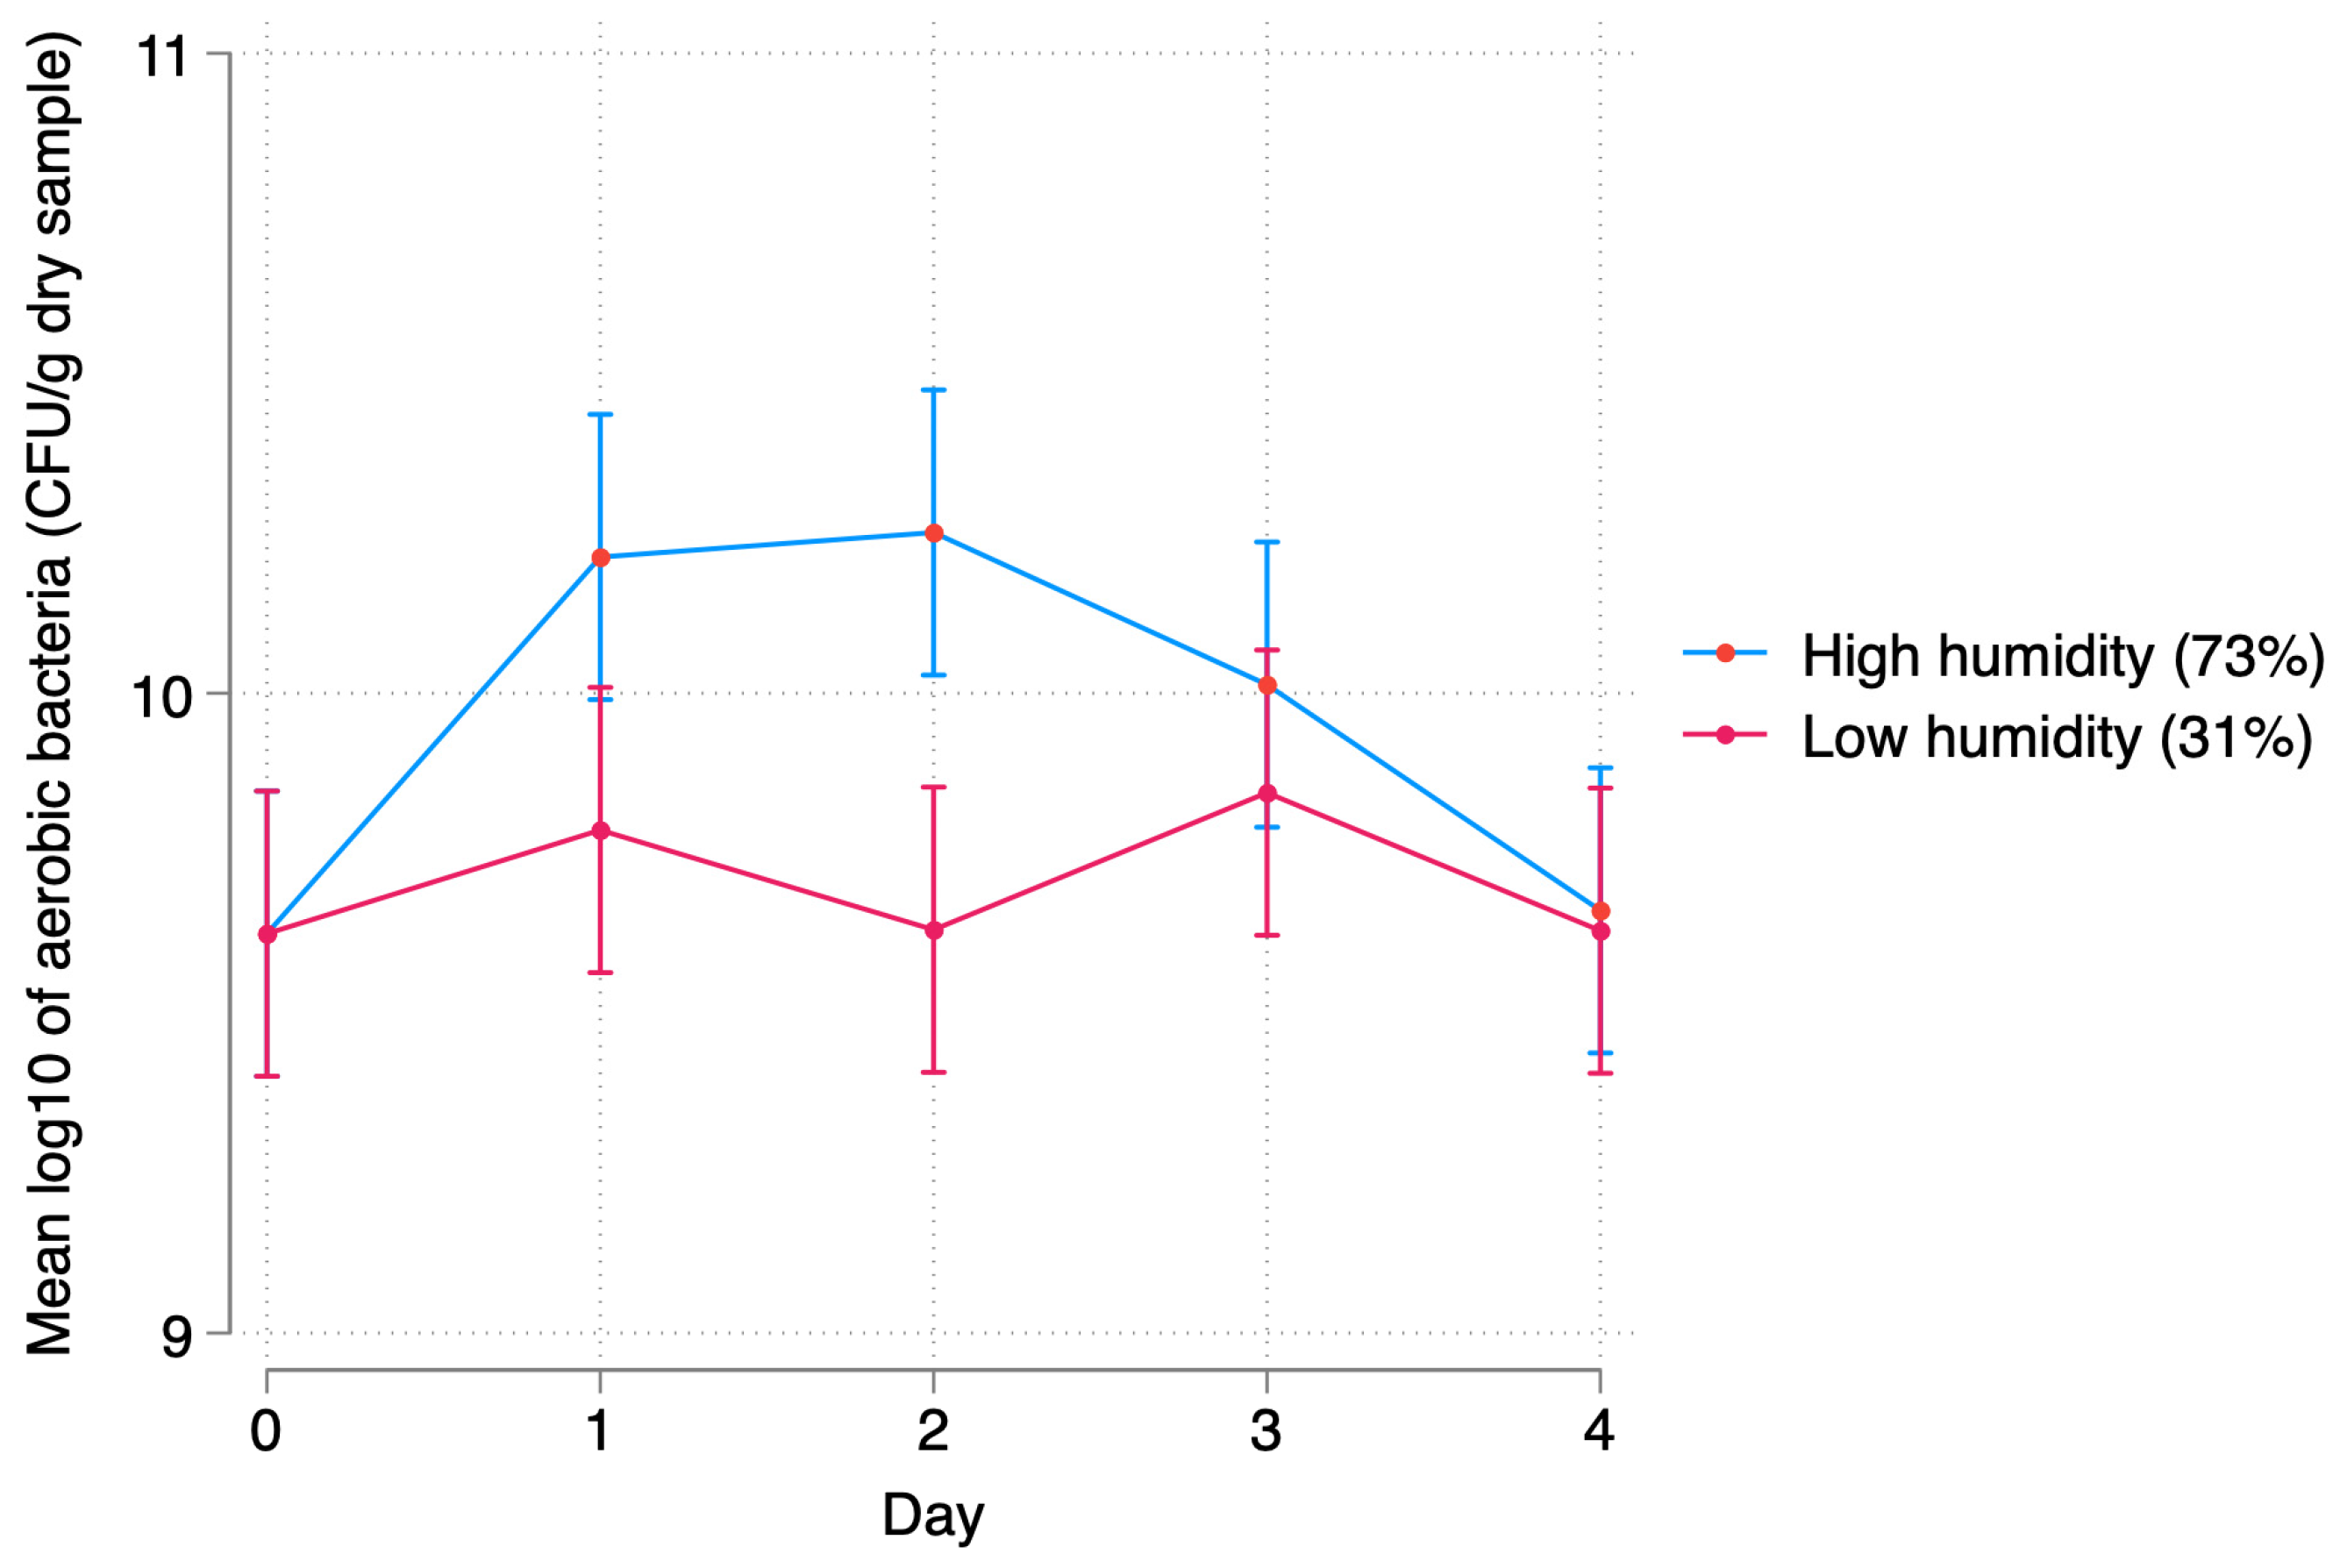
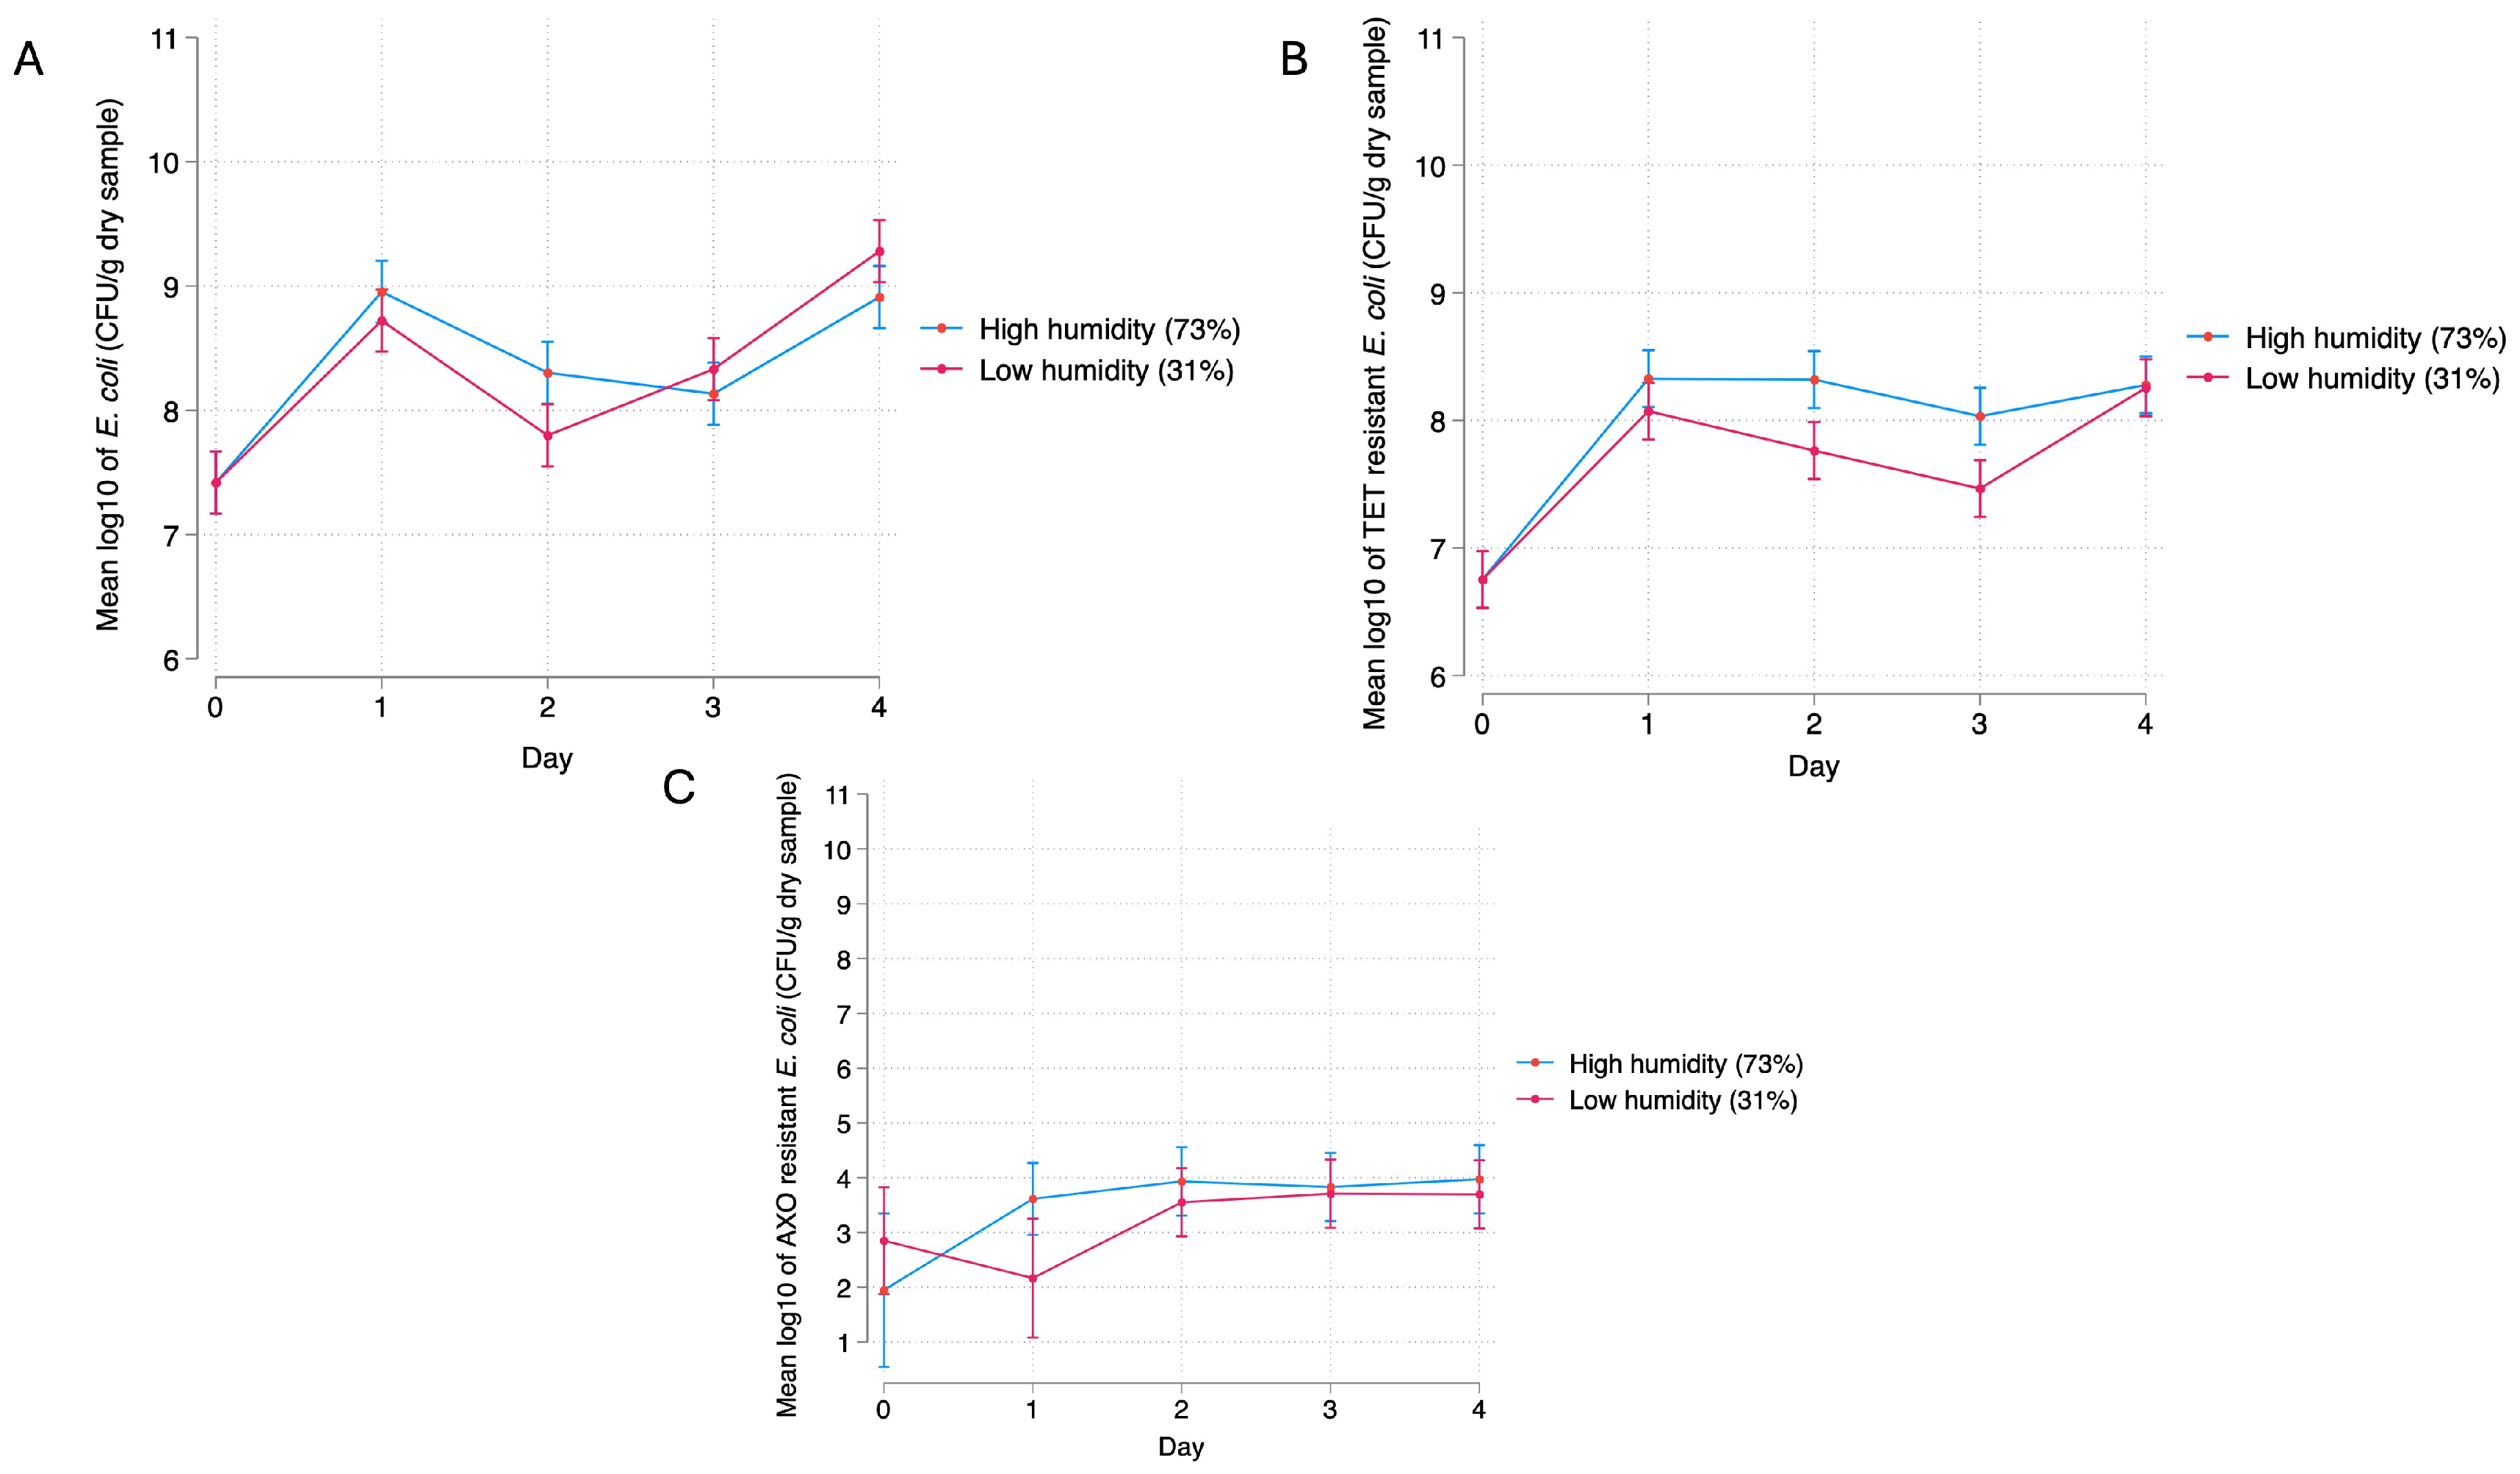
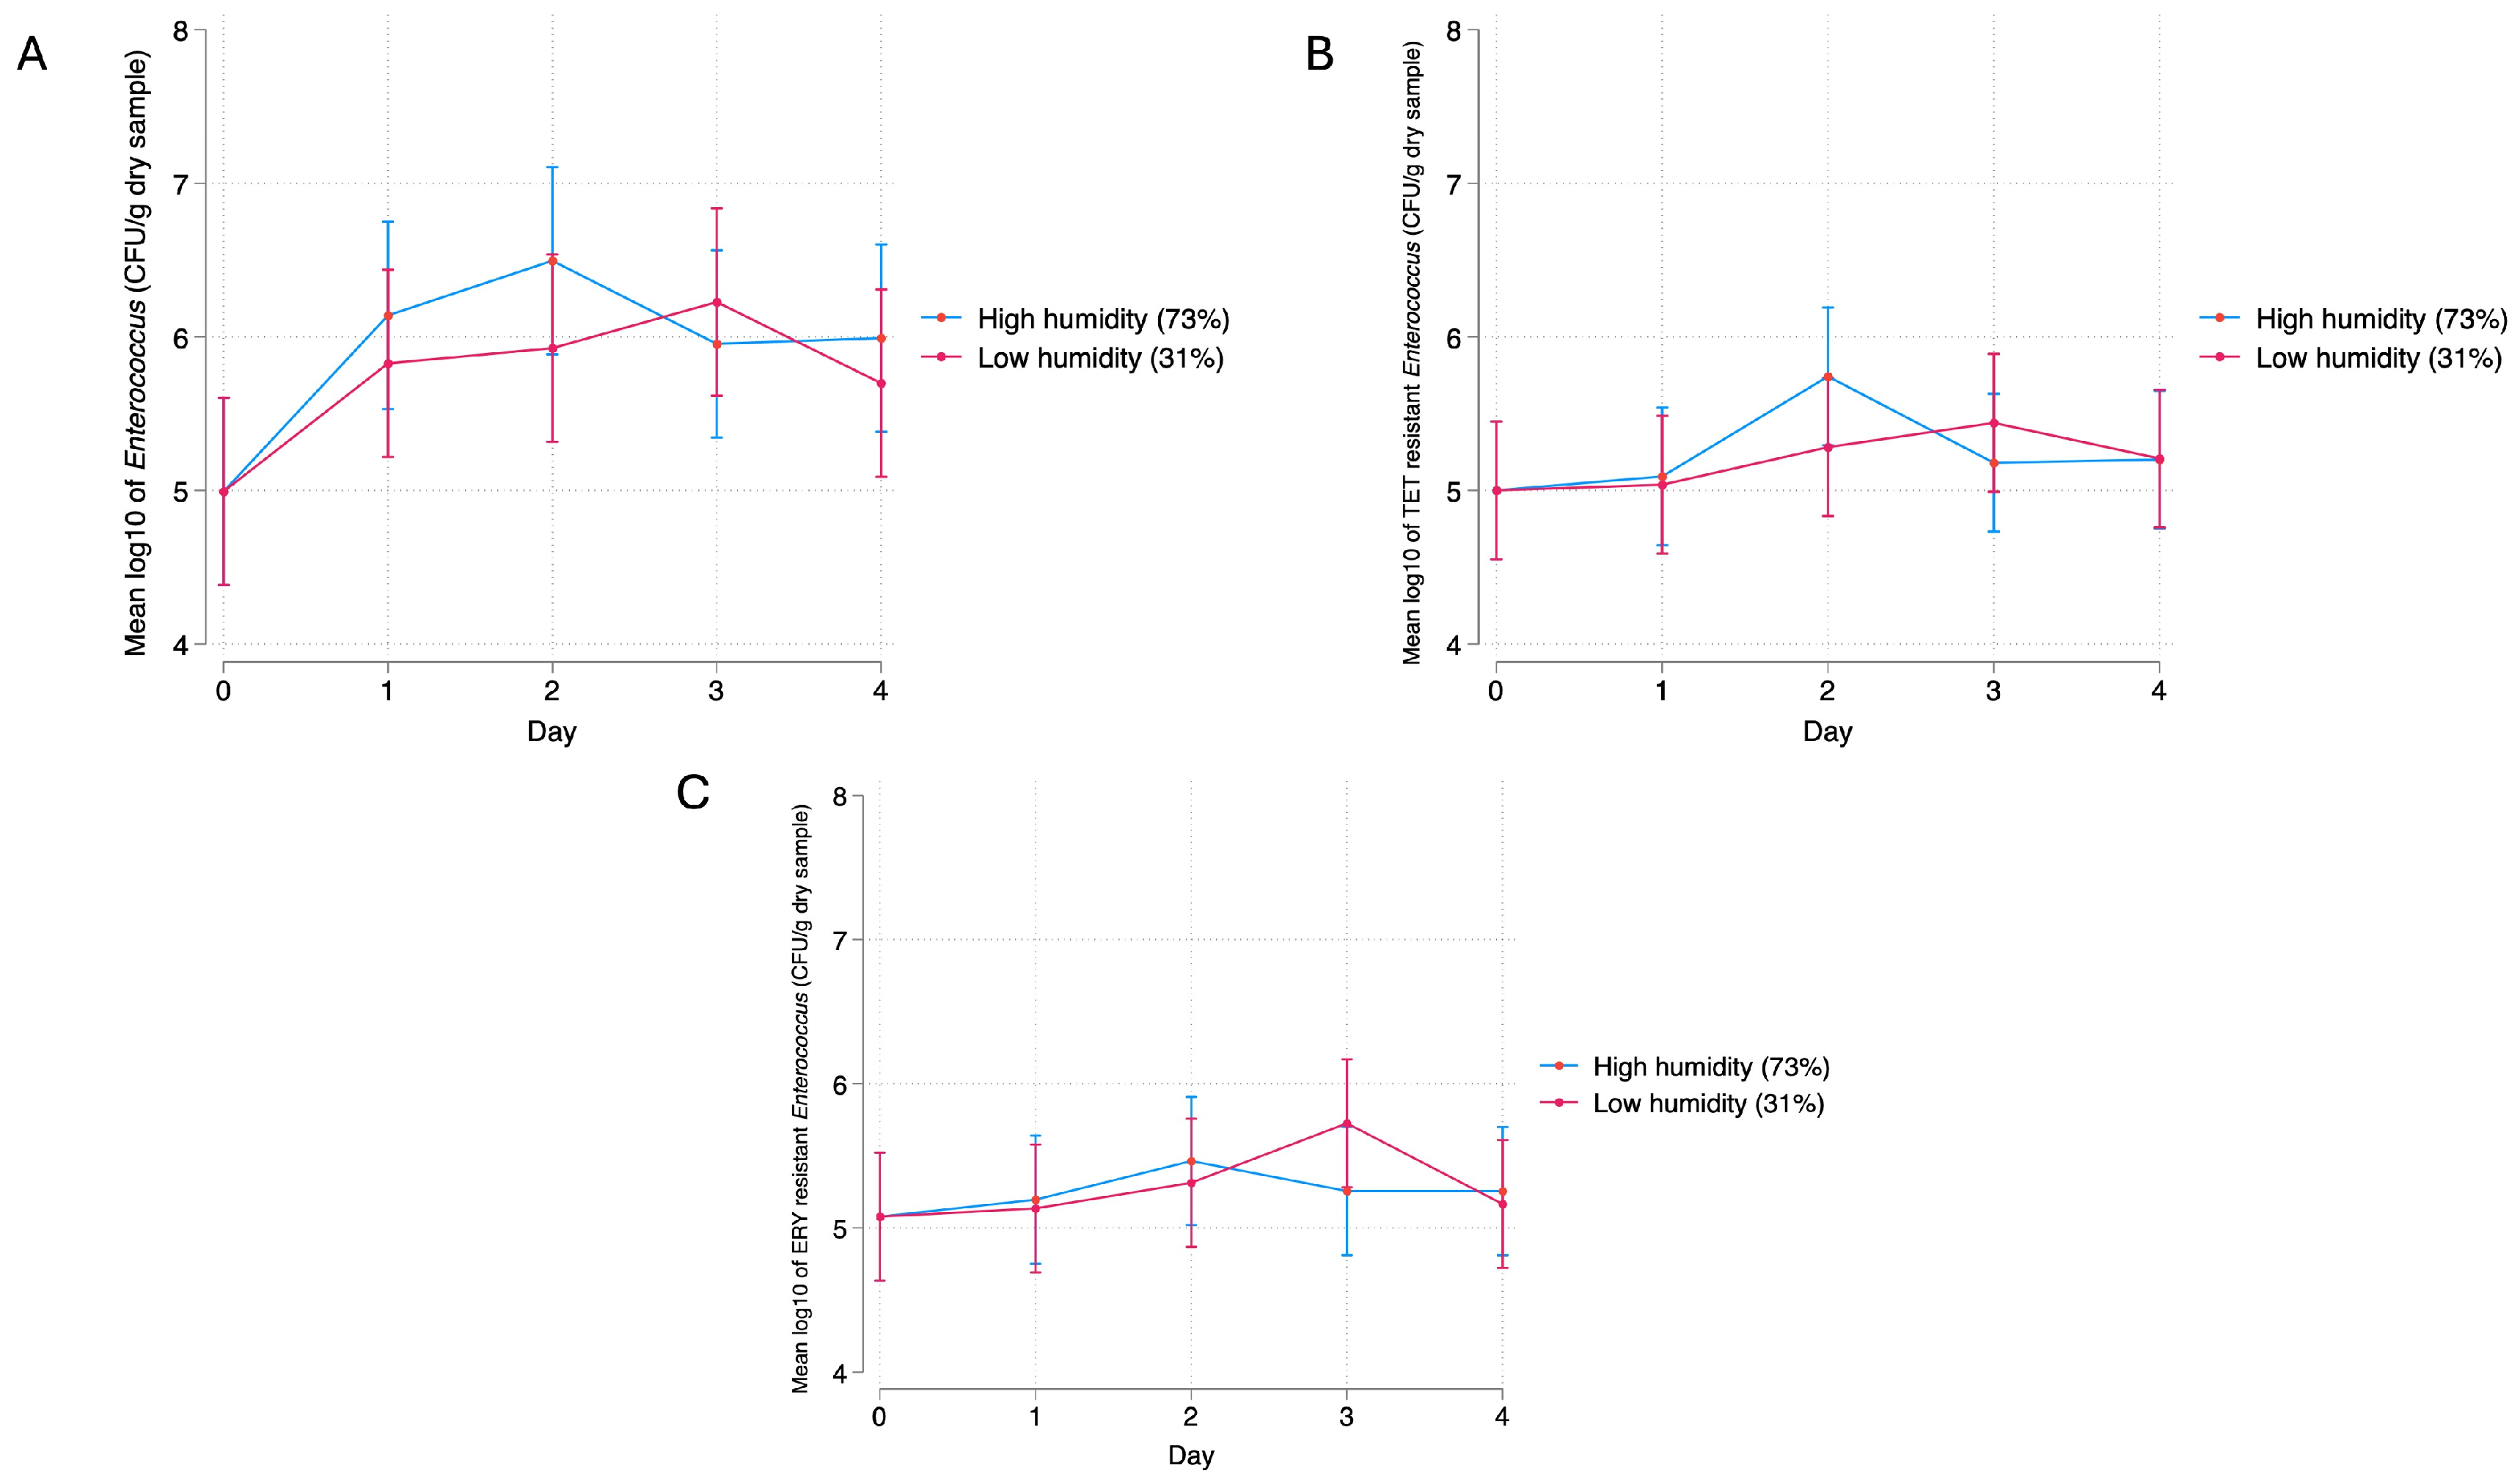
3.2.2. Relative Humidity

There was a significant difference in aerobic bacterial quantities (p < 0.05) between treatment groups on Day 2 (Figure 7).
No significant differences (p > 0.05) were found in E. coli quantities between treatment groups across the time points (Figure 8A). There was a significant difference (p < 0.05) in the quantity of tetracycline-resistant E. coli between treatment groups on Days 2 and 3 (Figure 8B).
Due to the limit of quantification in the spiral-plating process, there was a high number of zero counts or missing observations (40%) for ceftriaxone-resistant E. coli. Therefore, those counts were imputed using interval censored regression followed by estimation with a two-way full factorial multilevel mixed effects linear regression model. No significant differences were found in the quantity of ceftriaxone-resistant E. coli between treatment groups across the time points (Figure 8C).
No significant differences (p > 0.05) were found in the quantity of Enterococcus spp. (Figure 9A), tetracycline-resistant Enterococcus spp. (Figure 9B), or erythromycin-resistant Enterococcus spp. (Figure 9C) between treatment groups across the time points.

4. Discussion

Bacteria face a multitude of challenges in the ambient environment, such as fluctuations in temperature, changes in water availability, exposure to harmful UV radiation from the sun, and competition with other microorganisms, all of which may facilitate survival or else lead to demise [55]. Understanding the survival of bacteria in the pen manure pack under various stressors, such as UV exposure and relative humidity variations, is essential for understanding the dynamics of bacteria in bioaerosols emitted from cattle feedyards [56]. Certain bacterial species may have the ability to better survive environmental stressors and become aerosolized, posing potential risks to human and animal health [57]. Bacterial airborne transmission from aerosolized manure could have significant public health implications, especially for individuals working in agricultural settings or residing near livestock facilities [58]. Researchers and agricultural professionals can develop targeted mitigation strategies, such as improved manure management practices and biosecurity measures, to minimize the risk of bacterial airborne transmission [59].
The current study was designed to determine the impact of UV-B light (to mimic natural sunlight exposure) and relative humidity on the survival of total aerobic and commensal enteric indicator bacteria (E. coli and Enterococcus spp.) in beef cattle manure. This is one of the first published studies that sheds light on bacterial survival in the challenging pen environments, leading to a better understanding of bacterial population dynamics in the cattle feedyard environment and potential transmission risks of antimicrobial-resistant bacteria in bioaerosols arising from feedlots as dust.

4.1. Bacterial Response to UV-B Exposure

4.1.1. Fresh Manure

In the present study, the quantity of aerobic bacteria in fresh manure exposed to UV-B was stable throughout the sampling times. Although the quantity of aerobic bacteria remained stable, we did not study the bacterial community to understand the dynamics of the different bacterial species. Bacterial survival to UV-B exposure depends on available resistance (or tolerance) mechanisms [60]; however, studies have shown that UV-induced mutagenesis occurs randomly and does not preferentially choose resistant mechanisms [39]. In bacteria, individual defense and repair mechanisms have been discovered to tackle damage caused by stressful conditions [38], including transient responses to alleviate the effects of physical and chemical DNA-damaging agents (adaptative and SOS responses). Previous studies have shown that induced resistance to radiation can be developed through cyclic irradiation [39]. Cyclic irradiation involves repeatedly exposing bacteria to radiation while subculturing the surviving population, leading to an increase in their UV resistance. This adaptation is driven by mutations that enhance the DNA repair systems [61]. Therefore, although aerobic bacterial quantities remained stable and were not significantly different between UV-B exposure and LED exposure, most likely the dynamics of the bacterial species changed throughout the study. Some bacterial species may have continued to grow during the UV-B exposure, and other bacterial species may have been inhibited. Future studies could use 16s rRNA sequencing or other metagenomic methods to determine changes in the bacterial community population that are not reflected in overall aerobic plate counts. This would provide further insight into which bacterial species can resist and survive or thrive in the presence of UV-B light.
Similar to the results observed for aerobic bacteria, total E. coli quantities from fresh manure did not differ significantly between treatment groups throughout the study. Interestingly, there was a significant difference in quantities between treatment groups for tetracycline-resistant E. coli at timepoint 3 and ceftriaxone-resistant E. coli at timepoint 2; however, the counts in the UV-B treatment group were higher for the tetracycline-resistant E. coli and the counts in the LED treatment were higher for the ceftriaxone-resistant E. coli. E. coli survival could be due to protection provided by particles in the manure. An early investigation found that UV exposure reduced coliforms in diluted swine manure more effectively than in non-diluted manure. They found the bacteria were mainly associated with and protected by small particles (less than 2 μm) [62]. Previous studies have indicated that the presence of particles can impact the efficiency of UV light disinfection, with smaller particles causing less interference than larger ones [63]. A study by Macauley et al. (2006) found that UV-C irradiation between 2200 and 7700 J/m2 was effective in inactivating bacteria in swine lagoon samples and found that suspended solids inhibit the penetration of UV to the bacteria [64]. Manure particles can provide bacteria with protection by scattering or absorbing light, shading organisms, and shielding embedded organisms [65]. In our experiment, the differences in exposure levels may have led to varying impacts on bacteria’s survival. Specifically, bacteria near the surface of the samples may have experienced more significant effects compared to those located deeper within the sample. The Enterobacteriaceae family has also been reported to have a UV tolerance-specific extracellular sensing component that, upon UV exposure, transforms into a signaling molecule, which can diffuse to warn other bacteria and induce UV tolerance before direct UV exposure [66]. Additionally, E. coli and Enterococcus faecalis have been shown to photo repair, which is the ability to repair DNA damage caused by UV light when subsequently exposed to visible light [67]. The higher quantity of tetracycline-resistant E. coli may be due to one or several of these UV-resistance and protection mechanisms.
In most studies that have examined the impact of UV exposure on bacteria, the focus has been on UV-C, which has a stronger effect on the bacteria. In the current research, UV-B exposure was studied because UV-B more accurately replicates solar exposure. A study by Zafar et al. (2012) found that E. coli and coliforms from sludge decreased significantly after 6 months of exposure to sunlight; however, quantities remained above the National Environmental Quality Standards (NEQs) [68]. A study by Zhang et al. (2023) found that E. coli exposed to UV-C for 5 min displayed the highest reactivation rates after 24 h when subjected to an illuminated environment [69]. Additionally, in E. coli, a UV-C dose of 40 J/m2 showed inhibition of replication and transcription, inducing the SOS response [70], consisting of changes in gene expression in response to DNA damage produced by UV but also to other environmental agents [71]. The bacterial mechanism to withstand the irradiation may differ from the previous study, and even though the UV-B dose in our experiment was higher, it is known that UV-B is less DNA-disruptive than UV-C. The molecular-resistant mechanism should be explored in future research. Studies have also found that some types of E. coli were more resistant to UV light and did not inactivate as readily when exposed to UV light used to disinfect water [72] and that some E. coli needs different doses of UV to be inactivated [67]. In the present study, only three time points were evaluated, which may not be enough time to observe decreases in the E. coli population because the effects of UV on bacterial survival are dependent on dose and time.
In the current study, we used experimental doses of UV-B to simulate natural solar radiation that may be experienced in the feedyard environment. UV-B irradiation is complex, and the exposure may be influenced by several factors such as the solar zenith angle (sza), tropospheric aerosols, stratospheric ozone, time of day, season, geographical latitude, altitude, air pollution, cloud cover, and surface albedo [73]. The maximum solar radiation measured using a Licor LI200x Pyranometer at the location in Amarillo where the manure samples were collected was 900 W/m2. Ultraviolet radiation (UVR) corresponds to 5% of the solar radiation, and UV-B represents 5% of the UVR; therefore, for this maximum solar radiation measurement, the UV-B exposure was 2.25 W/m2 [74]. In our study, we used a UV-B exposure of 4.6 W/m2, which is approximately double the UV-B measured on a sunny afternoon on a summer day at the sampling site in Amarillo. It is important to note that although the UV-B exposure in the current experimental study may be higher than what is typically encountered in the feedyard environment, the bacterial counts did not significantly differ for the UV-B exposure group.
The findings of no effect on survival of antimicrobial-resistant E. coli exposed to UV-B also could be due to the expression of a cross-protection mechanism [75]. Several cross-protection mechanisms exist, including a general bacterial stress response with sigma factors, two-component systems (TCSs) [76], the SOS response, efflux pumps, and ribosomal mutations [77]. For example, in a study on disinfection of wastewater, the percentage of the total surviving coliform population resistant to tetracycline or chloramphenicol was significantly higher after UV irradiation, suggesting increased resistance to UV in these strains [78]. In another study of inactivation by light exposure, it was found that repetitive long pulses of dual (far-UV-C and blue LED) and individual far-UVC light exposure resulted in light tolerance in two Extended Spectrum Beta-Lactamase (ESBL) E. coli strains, but not in antibiotic-sensitive E. coli strains [79].
No effects were observed on total, tetracycline-resistant, or erythromycin-resistant Enterococcus spp. quantities in fresh manure exposed to UV-B. Gram-positive bacteria have natural protection against UV-B radiation due to the presence of a cell wall [80]. In the current study, the general population of Enterococcus spp. was evaluated, but potential changes in species-level populations may have occurred. It has been reported there are differences in response among Enterococcus species to UV-B [81]. For example, E. hirae has shown intermediate susceptibility compared with E. faecium, which in turn showed greater resistance to UV-B than others [81]. Additionally, previous studies have reported that the uvrA gene encoded on the conjugative plasmid pAD1 is a crucial UV resistance mechanism in Enterococcus faecalis [82]. Individual resistance has also been reported among Enterococcus spp. of the same species; for example, in a study of different strains of vancomycin-resistant Enterococcus spp. (VRE) exposed to different levels of UV-C light, it was found that some strains were ten times more resistant than others [81].

4.1.2. Dry Manure

Similar to the results from the fresh manure samples, no significant differences were observed for aerobic bacterial quantities between UV-B treatment groups. Bacteria that were present in dry manure, even in small amounts, may harbor resistance mechanisms to UV light because these bacteria have already been exposed to UV light in the environment, selected for their resistance traits, and thus could potentially have activated mechanisms to survive. These resistance mechanisms may also be responsible for the lack of significant differences observed for total E. coli, tetracycline-resistant E. coli, total Enterococcus spp., tetracycline-resistant Enterococcus spp., and erythromycin-resistant Enterococcus spp. quantities in dry manure between UV-B treatment groups. We were unable to study the effects of UV-B treatment on ceftriaxone-resistant E. coli in dry manure because no ceftriaxone-resistant E. coli was detected in the initial baseline samples. This is most likely due to an overall decrease in all bacteria (aerobic, E. coli, and Enterococcus spp.) in the initial dry samples when compared to fresh samples. In a study by Oni et al. (2015), Salmonella was able to survive when associated with turkey-dried manure particles [83].
A limitation of the UV-B radiation exposure study was that the control group (No UV-B) used blue light (LED), which also could affect bacterial survival [84]. Blue light between 405 and 470 nm achieves greater bacterial inactivation than other visible light regions [85]. Blue light is called Antimicrobial Blue Light (ABL) because it stimulates endogenous microbial porphyrin molecules to produce reactive oxygen species (ROS) that may attack cellular DNA, lipids, and proteins in the bacteria, leading to bacterial death [86]. Future studies could explore alternative light sources or no light to further study differences in bacterial quantities in response to UV-B light exposure. However, no light creates problematic comparisons for hypothesis testing and inference unless multiple other light sources are included as treatment groups.

4.2. Bacterial Response to Relative Humidity

Previous studies have found that high RH increases bacterial survival. However, some bacteria have specific mechanisms that allow them to survive in low relative humidities, indicating that desiccation alone may not be sufficient to completely inactivate all bacteria [4]. Sometimes the relationship is monotonic, meaning bacteria increase if there is more humidity, but sometimes bacteria can decrease if there are other biological factors affecting growth.
Not surprisingly, in our study, aerobic bacterial counts were higher for samples exposed to a high relative humidity (HH), with counts significantly (p < 0.05) higher for the HH treatment group on day 2. Low relative humidity (LH) [85] may have led to partial desiccation of the manure samples, and a lack of moisture could affect bacterial replication [87]. However, by day 4 of the study, the aerobic bacterial counts were the same for both treatment groups. The decrease in aerobic bacteria in the control group could be due to several reasons: nutrient depletion, nutrients in manure can be rapidly consumed by the bacterial population, leading to a decrease in available resources. Bacterial growth slows down, and the population can decline [88]. Another reason is the accumulation of toxic metabolites due to bacterial metabolism, producing waste that can be toxic to themselves. These substances inhibit bacterial growth or can kill the bacteria, decreasing the population [89]. Manure also contains diverse microbial communities, including bacteria, fungi, protozoa, and viruses. The bacterial population can decrease by competition from resources and predation by protozoa and bacteriophages (viruses that infect bacteria) [90]. One more reason for the bacterial decreasing is their natural decay through programmed cell death mechanisms [91]. One additional important factor to consider is the availability of oxygen, which could potentially decrease as a result of microbial respiration [92]. In this experiment, bacteria were exposed to a very slow drying procedure, which could allow bacteria to detect and respond to the changes and tolerate desiccation, and this may not accurately reflect natural conditions [93]. Similar to the aerobic bacterial quantities, a significantly higher amount of tetracycline-resistant E. coli was observed on days 2 and 3 of the study. Although antimicrobial resistance can be a fitness cost for bacteria, as it requires energy and resources to maintain the resistance mechanism, E. coli harbor chromosomally encoded efflux pumps such as AcrAB-TolC, which mediate resistance to tetracycline but also help respond to bacterial stress in E. coli [94]. Mechanisms used by E. coli to resist desiccation could counter the fitness cost associated with antimicrobial resistance.
Total E. coli and ceftriaxone-resistant E. coli quantities were not significantly different between the HH and LH treatment groups. Previous studies have found that coliforms in cattle feces can survive for up to eighteen weeks under hot, dry, summer conditions, and E. coli can live around 100 days [95]. E. coli has several desiccation survival mechanisms that have been studied extensively. E. coli accumulates or synthesizes compatible solutes (e.g., glutamate, trehalose, proline, and glycine betaine) in response to high osmolarity conditions, such as during desiccation, to allow for survival [66]. Additionally, E. coli can activate the expression of otsBA genes linked to RpoS, which are part of the stress-response regulator and help in the biosynthesis of trehalose [96]. Trehalose accumulation in E. coli is a reported strategy to adapt to osmotic stress and has been correlated with desiccation survival [97]; specifically, trehalose protects biomolecules from damage due to desiccation [93]. We found in our study that E. coli and ceftriaxone-resistant E. coli survive under dry conditions. Although E. coli has various mechanisms associated with resistance to desiccation, one of the primary mechanisms involves trehalose accumulation. This compound assists the bacteria in adapting to osmotic stress and protects biomolecules from damage. Desiccation stress can induce cross-protection in bacteria, which makes them more resistant to other stresses such as heat. Desiccated-adapted Salmonella in chicken litter exhibited more resistance than non-adapted Salmonella. High moisture content leads to shorter survival times under heat treatment, indicating that lower moisture content enhances desiccation survival [98].
No significant differences were observed for total, tetracycline-resistant, or erythromycin-resistant Enterococcus spp. counts between RH treatment groups across the study. Enterococcus spp. are Gram-positive bacteria with a tough cell wall, providing natural resistance to drying and an additional level of protection to cope with environmental stress [99,100,101]. Previous studies have shown that Enterococcus spp. can resist desiccation but also other environmental stresses such as nutrient deprivation and UV radiation, as we reported previously in our study [99]. Some species of the Enterococcus spp. genus are more resistant to desiccation than others, and resistance appears to be related to the specific environment in which they have adapted [99]. The quantities of Enterococcus spp. were not significantly different between groups exposed to different humidity levels, indicating that Enterococcus spp. can withstand drying.
Studying the resilience of enteric bacteria culturable from manure is crucial for predicting their behavior and transmission in feedyard environments. Our current study evaluated aerobic and enteric bacterial responses in manure to two environmental stressors: UV-B radiation and low relative humidity. It was confirmed that both Gram-negative and Gram-positive bacteria survive UV-B radiation and low humidity exposure. Bacteria have specific survival mechanisms, which can vary among genera, species, and even from one strain to another. For instance, we observed that ceftriaxone-resistant E. coli were able to survive under UV-B exposure, while Enterococcus spp. were able to survive in low relative humidity conditions. Bacteria face a variety of stressors in the environment, and it is essential to study and understand their potential effects on bacterial populations, especially those that pose a risk to animal and human health. The survival of bacteria in manure after exposure to different environmental stressors highlights the need to further study bacterial population dynamics in dust from feedyards, particularly during the evening dust peak (EDP). Although the approaches employed in the current study provide some understanding of possible stressors that bacteria could face in the feedyard environment, future studies should explore a broader range of time-periods and investigate additional environmental selection pressures and survival experiences that bacteria might encounter in the feedyard, especially when airborne as aerosols.

Supplementary Materials

The following supporting information can be downloaded at: https://www.mdpi.com/article/10.3390/environments11090197/s1, Figure S1: A UV-B exposure map within the chamber created with the UV-B radiation per mW/cm2 to calculate the exposure times required to achieve specified UV dose rates; Figure S2: Histogram of log10 CFU E. coli observed and imputed data. Figure S3: Histogram of log10 CFU tetracycline-resistant E. coli observed and imputed data; Figure S4: Histogram of log10 CFU Enterococcus spp. observed and imputed data; Figure S5: Histogram of log10 CFU tetracycline-resistant Enterococcus spp. observed and imputed data; Figure S6: Histogram of log10 CFU erythromycin-resistant Enterococcus spp. observed and imputed data; Figure S7: Histogram of log10 CFU ceftriaxone-resistant E. coli observed and imputed data. Table S1: Descriptive statistics and imputation model parameters by experiment.

Author Contributions

Conceptualization, K.N.N., H.M.S., B.W.A., K.J.B., K.C. and W.E.P.; Methodology, K.N.N., H.M.S., B.W.A., K.J.B., K.C. and W.E.P.; Software, I.M.L., K.N.N. and H.M.S.; Formal analysis, I.M.L., H.M.S. and K.N.N.; Investigation, I.M.L., K.N.N., H.M.S., B.W.A., K.J.B., K.C., W.E.P., J.K.S. and S.D.L.; Resources, K.N.N., H.M.S., B.W.A., K.J.B., K.C., W.E.P. and J.K.S.; data curation, I.M.L.; Writing-original draft preparation, I.M.L. and K.N.N.; Writing-review and editing, I.M.L., K.N.N., H.M.S., B.W.A., K.J.B., K.C., W.E.P., J.K.S., S.D.L. and J.V.; Visualization, I.M.L.; Supervision, K.N.N., H.M.S., B.W.A., K.J.B., K.C., W.E.P. and J.V.; Project administration, K.N.N.; funding acquisition, K.N.N. All authors have read and agreed to the published version of the manuscript.

Funding

This work is supported by The Agriculture and Food Research Initiative, project awardno. 2018-68003-27465, from the U.S. Department of Agriculture’s National Institute of Food and Agriculture.

Data Availability Statement

The original contributions presented in the study are included in the article/Supplementary Material, further inquiries can be directed to the corresponding author/s.

Acknowledgments

We thank Cameron Adams for his help with the project at Texas A&M AgriLife Research in Amarillo. We thank Roberta Pugh and all the graduate and undergraduate students from K.N. Norman’s and H.M. Scott’s Microbial Ecology and Molecular Epidemiology (ME2) laboratory for assisting with the sample processing. We would also like to thank Jing Wu from the TAMU-CVMBS Clinical Microbiology Laboratory for assistance with the use of the MALDI-TOF mass spectrometer.

Conflicts of Interest

The authors declare no conflicts of interest. The funders had no role in the design of the study, in the collection, analyses, or interpretation of data, in the writing of the manuscript, or in the decision to publish the results.

References

  1. Liu, D.; Chai, T.; Xia, X.; Gao, Y.; Cai, Y.; Li, X.; Miao, Z.; Sun, L.; Hao, H.; Roesler, U.; et al. Formation and transmission of Staphylococcus aureus (including MRSA) aerosols carrying antibiotic-resistant genes in a poultry farming environment. Sci. Total Environ. 2012, 426, 139–145. [Google Scholar] [CrossRef] [PubMed]
  2. Centers for Disease Control and Prevention. Antibiotic Resistance Threats in the United States; CDC: Atlanta, GA, USA, 2019; p. 150. [Google Scholar]
  3. Stanton, I.C.; Bethel, A.; Leonard, A.F.C.; Gaze, W.H.; Garside, R. What is the research evidence for antibiotic resistance exposure and transmission to humans from the environment? A systematic map protocol. Environ. Evid. 2020, 9, 12. [Google Scholar] [CrossRef] [PubMed]
  4. Centers for Disease Control and Prevention. Antibiotic Resistance and NARMS Surveillance. Available online: https://www.cdc.gov/narms/faq.html#:~:text=NARMS%20scientists%20track%20and%20study,person%20contact%2C%20and%20environmental%20contamination. (accessed on 19 June 2024).
  5. Bokhary, H.; Pangesti, K.N.A.; Rashid, H.; Abd El Ghany, M.; Hill-Cawthorne, G.A. Travel-Related Antimicrobial Resistance: A Systematic Review. Trop. Med. Infect. Dis. 2021, 6, 11. [Google Scholar] [CrossRef] [PubMed]
  6. Allcock, S.; Young, E.H.; Holmes, M.; Gurdasani, D.; Dougan, G.; Sandhu, M.S.; Solomon, L.; Török, M.E. Antimicrobial resistance in human populations: Challenges and opportunities. Glob. Health Epidemiol. Genom. 2017, 2, e4. [Google Scholar] [CrossRef]
  7. UN Environment Programme. Frontiers 2017: Emerging Issues of Environmental Concern; UN: Nairobi, Kenya, 2017; p. 11. [Google Scholar]
  8. U.S. Food and Drug Administration (FDA). About NARMS. Available online: https://www.fda.gov/animal-veterinary/national-antimicrobial-resistance-monitoring-system/about-narms#bacteria (accessed on 12 March 2024).
  9. National Antimicrobial Resistance Monitoring System. 2018 NARMS Update: Integrated Report Summary Interactive Version; FDA: Silver Spring, MD, USA, 2018. Available online: https://www.fda.gov/animal-veterinary/national-antimicrobial-resistance-monitoring-system/2018-narms-update-integrated-report-summary (accessed on 11 December 2020).
  10. Aarestrup, F.M.; Wegener, H.C.; Collignon, P. Resistance in bacteria of the food chain: Epidemiology and control strategies. Expert. Rev. Anti Infect. Ther. 2008, 6, 733–750. [Google Scholar] [CrossRef]
  11. Byappanahalli, M.N.; Nevers, M.B.; Korajkic, A.; Staley, Z.R.; Harwood, V.J. Enterococci in the environment. Microbiol. Mol. Biol. Rev. MMBR 2012, 76, 685–706. [Google Scholar] [CrossRef]
  12. U.S. Food and Drug Administration (FDA). 2020 Summary Report On Antimicrobials Sold or Distributed for Use in Food-Producing Animals; FDA: Silver Spring, MD, USA, 2021; p. 49. [Google Scholar]
  13. United States Department of Agriculture, Veterinary Services, Centers for Epidemiology and Animal Health. Types and Costs of Respiratory Disease Treatments in U.S. Feedlots; United States Department of Agriculture: Washington, DC, USA, 2013; Volume 2. [Google Scholar]
  14. Environmental Protection Agency. Risk Assessment Evaluation for Concentrated Animal Feeding Operations; United States Environmental Protection Agency: Washington, DC, USA, 2004; p. 138. [Google Scholar]
  15. He, L.-Y.; He, L.-K.; Liu, Y.-S.; Zhang, M.; Zhao, J.-L.; Zhang, Q.-Q.; Ying, G.-G. Microbial diversity and antibiotic resistome in swine farm environments. Sci. Total Environ. 2019, 685, 197–207. [Google Scholar] [CrossRef]
  16. Létourneau, V.; Nehmé, B.; Mériaux, A.; Massé, D.; Cormier, Y.; Duchaine, C. Human pathogens and tetracycline-resistant bacteria in bioaerosols of swine confinement buildings and in nasal flora of hog producers. Int. J. Hyg. Environ. Health 2010, 213, 444–449. [Google Scholar] [CrossRef]
  17. Dohmen, W.; Schmitt, H.; Bonten, M.; Heederik, D. Air exposure as a possible route for ESBL in pig farmers. Environ. Res. 2017, 155, 359–364. [Google Scholar] [CrossRef]
  18. Kormos, D.; Lin, K.; Pruden, A.; Marr, L.C. Critical review of antibiotic resistance genes in the atmosphere. Environ. Sci. Process. Impacts 2022, 24, 870–883. [Google Scholar] [CrossRef]
  19. Dungan, R.S. Board-invited review: Fate and transport of bioaerosols associated with livestock operations and manures. J. Anim. Sci. 2010, 88, 3693–3706. [Google Scholar] [CrossRef] [PubMed]
  20. Auvermann, B.; Bottcher, R.; Heber, A.; Meyer, D.; B. Parnell, C., Jr.; Shaw, B.; Worley, J. Particulate Matter Emissions from Animal Feeding Operations; American Society of Agricultural and Biological Engineers (ASABE): St. Joseph, MI, USA, 2006. [Google Scholar]
  21. Himathongkham, S.; Bahari, S.; Riemann, H.; Cliver, D. Survival of Escherichia coli O157:H7 and Salmonella Typhimurium in cow manure and cow manure slurry. FEMS Microbiol. Lett. 1999, 178, 251–257. [Google Scholar] [CrossRef] [PubMed]
  22. Silhavy, T.J.; Kahne, D.; Walker, S. The bacterial cell envelope. Cold Spring Harb. Perspect. Biol. 2010, 2, a000414. [Google Scholar] [CrossRef] [PubMed]
  23. Lleo, M.M.; Tafi, M.C.; Canepari, P. Nonculturable Enterococcus faecalis cells are metabolically active and capable of resuming active growth. Syst. Appl. Microbiol. 1998, 21, 333–339. [Google Scholar] [CrossRef]
  24. Vernocchi, V.; Abd El, E.; Brunoldi, M.; Danelli, S.G.; Gatta, E.; Isolabella, T.; Mazzei, F.; Parodi, F.; Prati, P.; Massabò, D. Airborne bacteria viability and air quality: A protocol to quantitatively investigate the possible correlation by an atmospheric simulation chamber. Atmos. Meas. Tech. 2023, 16, 5479–5493. [Google Scholar] [CrossRef]
  25. Poole, K. Bacterial stress responses as determinants of antimicrobial resistance. J. Antimicrob. Chemother. 2012, 67, 2069–2089. [Google Scholar] [CrossRef] [PubMed]
  26. Laskowska, E.; Kuczyńska-Wiśnik, D. New insight into the mechanisms protecting bacteria during desiccation. Curr. Genet. 2020, 66, 313–318. [Google Scholar] [CrossRef]
  27. Mattimore, V.; Battista, J.R. Radioresistance of Deinococcus radiodurans: Functions necessary to survive ionizing radiation are also necessary to survive prolonged desiccation. J. Bacteriol. 1996, 178, 633–637. [Google Scholar] [CrossRef]
  28. Goyal, K.; Walton, L.J.; Browne, J.A.; Burnell, A.M.; Tunnacliffe, A. Molecular Anhydrobiology: Identifying Molecules Implicated in Invertebrate Anhydrobiosis1. Integr. Comp. Biol. 2005, 45, 702–709. [Google Scholar] [CrossRef]
  29. Barron, J.C.; Forsythe, S.J. Dry stress and survival time of Enterobacter sakazakii and other Enterobacteriaceae in dehydrated powdered infant formula. J. Food Prot. 2007, 70, 2111–2117. [Google Scholar] [CrossRef]
  30. Wang, Z.; Zhu, T.; Chen, Z.; Meng, J.; Simpson, D.J.; Gänzle, M.G. Genetic determinants of stress resistance in desiccated Salmonella enterica. Appl. Environ. Microbiol. 2021, 87, e0168321. [Google Scholar] [CrossRef] [PubMed]
  31. Garmiri, P.; Coles, K.E.; Humphrey, T.J.; Cogan, T.A. Role of outer membrane lipopolysaccharides in the protection of Salmonella enterica serovar Typhimurium from desiccation damage. FEMS Microbiol. Lett. 2008, 281, 155–159. [Google Scholar] [CrossRef] [PubMed]
  32. Mandal, R.K.; Kwon, Y.M. Global screening of Salmonella enterica serovar Typhimurium genes for desiccation survival. Front. Microbiol. 2017, 8, 1723. [Google Scholar] [CrossRef] [PubMed]
  33. Nasim, A.; James, A. Life under Conditions of High Irradiation; Academic Press: New York, NY, USA, 1978. [Google Scholar]
  34. Goldman, R.P.; Travisano, M. Experimental evolution of ultraviolet radiation resistance in Escherichia coli. Evolution 2011, 65, 3486–3498. [Google Scholar] [CrossRef] [PubMed]
  35. World Health Organization (WHO). Radiation: Ultraviolet (UV) Radiation; WHO: Geneva, Switzerland, 2016. [Google Scholar]
  36. Brozyna, A.; Zbytek, B.; Granese, J.; Carlson, J.A.; Ross, J.; Slominski, A. Mechanism of UV-related carcinogenesis and its contribution to nevi/melanoma. Expert Rev. Dermatol. 2007, 2, 451–469. [Google Scholar] [CrossRef]
  37. Chautrand, T.; Souak, D.; Kondakova, T.; Depayras, S.; Machour, N.; Heipieper, H.; Feuilloley, M.; Orange, N.; Poc, C. Air Pollution and Other Environmental Stresses: Gaseous No 2 Exposure Leads to Specific Alterations of Pseudomonas Fluorescens; Casares, J., Longhurst, J., Barnes, J., Eds.; WIT Press: Southampton, UK, 2020; Volume 244. [Google Scholar]
  38. Goosen, N.; Moolenaar, G.F. Repair of UV damage in bacteria. DNA Repair. 2008, 7, 353–379. [Google Scholar] [CrossRef]
  39. Alcántara-Díaz, D.; Breña-Valle, M.; Serment-Guerrero, J. Divergent adaptation of Escherichia coli to cyclic ultraviolet light exposures. Mutagenesis 2004, 19, 349–354. [Google Scholar] [CrossRef]
  40. Davies, R.; Sinskey, A.J. Radiation-resistant mutants of Salmonella Typhimurium LT2: Development and characterization. J. Bacteriol. 1973, 113, 133–144. [Google Scholar] [CrossRef]
  41. Weigand, M.R.; Sundin, G.W. Long-term effects of inducible mutagenic DNA repair on relative fitness and phenotypic diversification in Pseudomonas cichorii 302959. Genetics 2009, 181, 199–208. [Google Scholar] [CrossRef]
  42. Wassmann, M.; Moeller, R.; Reitz, G.; Rettberg, P. Adaptation of Bacillus subtilis cells to Archean-like UV climate: Relevant hints of microbial evolution to remarkably increased radiation resistance. Astrobiology 2010, 10, 605–615. [Google Scholar] [CrossRef]
  43. Álvarez-Molina, A.; de Toro, M.; Ruiz, L.; López, M.; Prieto, M.; Alvarez-Ordóñez, A. Selection for antimicrobial resistance in foodborne pathogens through exposure to UV Light and nonthermal atmospheric plasma decontamination techniques. Appl. Environ. Microbiol. 2020, 86, e00102-20. [Google Scholar] [CrossRef] [PubMed]
  44. Wexler, A.; Hasegawa, S. Relative humidity-temperature relationships of some saturated salt solutions in the temperature. J. Res. Natl. Bur. Stand. 1954, 53, 19–26. [Google Scholar] [CrossRef]
  45. Koyama, K.; Hokunan, H.; Hasegawa, M.; Kawamura, S.; Koseki, S. Modeling Stochastic Variability in the Numbers of surviving Salmonella enterica, Enterohemorrhagic Escherichia coli, and Listeria monocytogenes cells at the single-cell level in a desiccated environment. Appl. Environ. Microbiol. 2017, 83, e02974-16. [Google Scholar] [CrossRef]
  46. Boll, J.M.; Tucker, A.T.; Klein, D.R.; Beltran, A.M.; Brodbelt, J.S.; Davies, B.W.; Trent, M.S. Reinforcing lipid A acylation on the cell surface of Acinetobacter baumannii promotes cationic zntimicrobial peptide resistance and desiccation survival. mBio 2015, 6, e00478-15. [Google Scholar] [CrossRef] [PubMed]
  47. Zeidler, S.; Müller, V. The role of compatible solutes in desiccation resistance of Acinetobacter baumannii. Microbiologyopen 2019, 8, e00740. [Google Scholar] [CrossRef] [PubMed]
  48. Clinical and Laboratory Standards Institute (CLSI). Performance Standards for Antimicrobial Susceptibility Testing. CLSI Document M100, 33rd ed.; Clinical and Laboratory Standards Institute: Wayne, PA, USA, 2023. [Google Scholar]
  49. Murray, S.A.; Holbert, A.C.; Norman, K.N.; Lawhon, S.D.; Sawyer, J.E.; Scott, H.M. Effects of tylosin, a direct-fed microbial and feedlot pen environment on phenotypic resistance among Enterococci isolated from beef cattle feces. Antibiotics 2022, 11, 106. [Google Scholar] [CrossRef]
  50. Stata. Pwcompare—Pairwise Comparisons; StataCorp LLC.: College Station, TX, USA, 2023; p. 34. [Google Scholar]
  51. Stata. Mi Impute Chained—Impute Missing Values Using Chained Equations; StataCorp LLC.: College Station, TX, USA, 2023; p. 30. [Google Scholar]
  52. Harel, O.; Zhou, X.H. Multiple imputation: Review of theory, implementation and software. Stat. Med. 2007, 26, 3057–3077. [Google Scholar] [CrossRef]
  53. Schafer, J.L. Multiple imputation in multivariate problems when the imputation and analysis models differ. Stat. Neerl. 2003, 57, 19–35. [Google Scholar] [CrossRef]
  54. Eddings, W.; Marchenko, Y. Diagnostics for multiple imputation in Stata. Stata J. 2012, 12, 353–367. [Google Scholar] [CrossRef]
  55. Tran, D.T.Q.; Bradbury, M.I.; Ogtrop, F.F.V.; Bozkurt, H.; Jones, B.J.; McConchie, R. Environmental drivers for persistence of Escherichia coli and Salmonella in manure-amended soils: A meta-analysis. J. Food Prot. 2020, 83, 1268–1277. [Google Scholar] [CrossRef]
  56. Zhao, Y.; Aarnink, A.J.A.; De Jong, M.C.M.; Groot Koerkamp, P.W.G. Airborne microorganisms from livestock production systems and their relation to dust. Crit. Rev. Environ. Sci. Technol. 2014, 44, 1071–1128. [Google Scholar] [CrossRef] [PubMed]
  57. Gonzalez-Martin, C. Airborne Infectious Microorganisms. In Encyclopedia of Microbiology, 4th ed.; Schmidt, T.M., Ed.; Academic Press: Cambridge, MA, USA; Oxford, UK, 2019; pp. 52–60. [Google Scholar]
  58. Baghdadi, M.; Brassard, P.; Godbout, S.; Létourneau, V.; Turgeon, N.; Rossi, F.; Lachance, É.; Veillette, M.; Gaucher, M.L.; Duchaine, C. Contribution of manure-spreading operations to bioaerosols and antibiotic resistance genes’ emission. Microorganisms 2023, 11, 1797. [Google Scholar] [CrossRef]
  59. Sweeten, J.M. Manure and Wastewater Management for Cattle Feedlots. In Reviews of Environmental Contamination and Toxicology: Continuation of Residue Reviews; Ware, G.W., Ed.; Springer: New York, NY, USA, 2000; pp. 121–153. [Google Scholar]
  60. Santos, A.L.; Oliveira, V.; Baptista, I.; Henriques, I.; Gomes, N.C.M.; Almeida, A.; Correia, A.; Cunha, Â. Wavelength dependence of biological damage induced by UV radiation on bacteria. Arch. Microbiol. 2013, 195, 63–74. [Google Scholar] [CrossRef] [PubMed]
  61. Rames, J.; Chaloupecký, V.; Sojková, N.; Bencko, V. An attempt to demonstrate the increased resistance of selected bacterial strains during repeated exposure to UV radiation at 254 nm. Cent. Eur. J. Public Health 1997, 5, 30–31. [Google Scholar] [PubMed]
  62. Singh, P.; El-Din, M.G.; Ikehata, K.; Craik, S.A.; Bromley, D. UV inactivation of bacteria in raw and pre-treated liquid swine manure. Environ. Technol. 2006, 27, 1261–1270. [Google Scholar] [CrossRef]
  63. Madge, B.A.; Jensen, J.N. Ultraviolet disinfection of fecal coliform in municipal wastewater: Effects of particle size. Water Environ. Res. 2006, 78, 294–304. [Google Scholar] [CrossRef]
  64. Macauley, J.J.; Qiang, Z.; Adams, C.D.; Surampalli, R.; Mormile, M.R. Disinfection of swine wastewater using chlorine, ultraviolet light and ozone. Water Res. 2006, 40, 2017–2026. [Google Scholar] [CrossRef]
  65. Berman, D.; Rice, E.W.; Hoff, J.C. Inactivation of particle-associated coliforms by chlorine and monochloramine. Appl. Environ. Microbiol. 1988, 54, 507–512. [Google Scholar] [CrossRef]
  66. Kempf, B.; Bremer, E. Uptake and synthesis of compatible solutes as microbial stress responses to high-osmolality environments. Arch. Microbiol. 1998, 170, 319–330. [Google Scholar] [CrossRef]
  67. Romero-Martínez, L.; Duque-Sarango, P.; González-Martín, C.; Moreno-Andrés, J.; Acevedo-Merino, A.; Nebot, E. Inactivation efficacy and reactivation of fecal bacteria with a flow-through LED ultraviolet reactor: Intraspecific response prevails over interspecific differences. J. Water Process Eng. 2023, 52, 103497. [Google Scholar] [CrossRef]
  68. Zafar, L.; Javed, A.; Ali, S.S.; Anwar, Z. Potential of waste water sludge as environmental-friendly manure after UV-treatment. Res. J. Environ. Earth Sci. 2012, 4, 917–922. [Google Scholar]
  69. Zhang, W.; Huang, R.; Zhang, T.; Wang, B.; Li, N.; Sun, Y.; Ma, H.; Zhang, Q.; Zhang, J.; Liu, Y. Study on the inactivation and reactivation mechanism of pathogenic bacteria in aquaculture by UVC-LED. Front. Mar. Sci. 2023, 10, 1139713. [Google Scholar] [CrossRef]
  70. Crowley, D.J.; Hanawalt, P.C. Induction of the SOS response increases the efficiency of global nucleotide excision repair of cyclobutane pyrimidine dimers, but not 6–4 photoproducts, in UV-irradiated Escherichia coli. J. Bacteriol. 1998, 180, 3345–3352. [Google Scholar] [CrossRef] [PubMed]
  71. Koch, W.; Woodgate, R. DNA Damage and Repair: DNA Repair in Prokaryotes and Lower Eukaryotes; Humana: Totowa, NJ, USA, 1998. [Google Scholar]
  72. Huang, J.-J.; Xi, J.; Hu, H.-Y.; Li, Y.; Lu, S.-Q.; Tang, F.; Pang, Y.-C. UV light tolerance and reactivation potential of tetracycline-resistant bacteria from secondary effluents of a wastewater treatment plant. J. Environ. Sci. 2016, 41, 146–153. [Google Scholar] [CrossRef]
  73. McKenzie, R.; Connor, B.; Bodeker, G. Increased Summertime UV Radiation in New Zealand in Response to Ozone Loss. Science 1999, 285, 1709–1711. [Google Scholar] [CrossRef]
  74. International Agency for Research on Cancer (IARC). Solar and Ultraviolet Radiation. Available online: https://www.ncbi.nlm.nih.gov/books/NBK304366/#:~:text=The%20UV%20component%20of%20terrestrial,for%20additional%20exposure%20has%20increased. (accessed on 13 August 2024).
  75. Davies, J.; Webb, V. Antibiotic resistance in bacteria. In Biomedical Research Reports; Krause, R.M., Ed.; Academic Press: Cambridge, MD, USA, 1998; Volume 1, pp. 239–273. [Google Scholar]
  76. Tierney, A.R.; Rather, P.N. Roles of two-component regulatory systems in antibiotic resistance. Future Microbiol. 2019, 14, 533–552. [Google Scholar] [CrossRef]
  77. Liao, X.; Ma, Y.; Daliri, E.B.-M.; Koseki, S.; Wei, S.; Liu, D.; Ye, X.; Chen, S.; Ding, T. Interplay of antibiotic resistance and food-associated stress tolerance in foodborne pathogens. Trends Food Sci. Technol. 2020, 95, 97–106. [Google Scholar] [CrossRef]
  78. Meckes, M.C. Effect of UV light disinfection on antibiotic-resistant coliforms in wastewater effluents. Appl. Environ. Microbiol. 1982, 43, 371–377. [Google Scholar] [CrossRef]
  79. Gardner, A.; Soni, A.; Cookson, A.; Brightwell, G. Light tolerance of extended spectrum β-lactamase producing Escherichia coli strains after repetitive exposure to far-UVC and blue LED light. J. Appl. Microbiol. 2023, 134, lxad124. [Google Scholar] [CrossRef]
  80. Jagger, J. Solar-UV Actions on Living Cells; Praeger: Westport, CT, USA, 1985. [Google Scholar]
  81. Knobling, B.; Franke, G.; Belmar Campos, C.; Büttner, H.; Christner, M.; Klupp, E.M.; Maurer, P.M.; Knobloch, J.K. Tolerance of clinical vancomycin-resistant Enterococcus faecium isolates against UV-C light from a mobile source. Antimicrob. Resist. Infect. Control 2023, 12, 63. [Google Scholar] [CrossRef]
  82. Ozawa, Y.; Tanimoto, K.; Fujimoto, S.; Tomita, H.; Ike, Y. Cloning and genetic analysis of the UV resistance determinant (uvr) encoded on the Enterococcus faecalis pheromone-responsive conjugative plasmid pAD1. J. Bacteriol. 1997, 179, 7468–7475. [Google Scholar] [CrossRef] [PubMed]
  83. Oni, R.A.; Sharma, M.; Buchanan, R.L. Survival of Salmonella enterica in dried turkey manure and persistence on spinach leaves. J. Food Prot. 2015, 78, 1791–1799. [Google Scholar] [CrossRef] [PubMed]
  84. Chen, H.; Cheng, Y.; Moraru, C.I. Blue 405 nm LED light effectively inactivates bacterial pathogens on substrates and packaging materials used in food processing. Sci. Rep. 2023, 13, 15472. [Google Scholar] [CrossRef] [PubMed]
  85. Guffey, J.S.; Wilborn, J. In vitro bactericidal effects of 405-nm and 470-nm blue light. Photomed. Laser Surg. 2006, 24, 684–688. [Google Scholar] [CrossRef] [PubMed]
  86. Hadi, J.; Wu, S.; Brightwell, G. Antimicrobial blue light versus pathogenic bacteria: Mechanism, application in the food industry, hurdle technologies and potential resistance. Foods 2020, 9, 1895. [Google Scholar] [CrossRef]
  87. García, A.H. Anhydrobiosis in bacteria: From physiology to applications. J. Biosci. 2011, 36, 939–950. [Google Scholar] [CrossRef]
  88. Gonzalez, J.M.; Aranda, B. Microbial growth under limiting conditions-future perspectives. Microorganisms 2023, 11, 1641. [Google Scholar] [CrossRef]
  89. Demain, A.L.; Fang, A. The natural functions of secondary metabolites. Adv. Biochem. Eng. Biotechnol. 2000, 69, 1–39. [Google Scholar] [CrossRef]
  90. Weiland-Bräuer, N. Friends or foes-microbial interactions in nature. Biology 2021, 10, 496. [Google Scholar] [CrossRef]
  91. Heejeong, L.; Dong Gun, L. Programmed cell death in bacterial community: Mechanisms of action, causes and consequences. J. Microbiol. Biotechnol. 2019, 29, 1014–1021. [Google Scholar] [CrossRef]
  92. Marteyn, B.; Scorza, F.B.; Sansonetti, P.J.; Tang, C. Breathing life into pathogens: The influence of oxygen on bacterial virulence and host responses in the gastrointestinal tract. Cell. Microbiol. 2011, 13, 171–176. [Google Scholar] [CrossRef] [PubMed]
  93. Greffe, V.R.G.; Michiels, J. Desiccation-induced cell damage in bacteria and the relevance for inoculant production. Appl. Microbiol. Biotechnol. 2020, 104, 3757–3770. [Google Scholar] [CrossRef] [PubMed]
  94. Xian-Zhi, L.; Plésiat, P.; Nikaido, H. The challenge of efflux-mediated antibiotic resistance in gram-negative bacteria. Clin. Microbiol. Rev. 2015, 28, 337–418. [Google Scholar] [CrossRef]
  95. Buckhouse, J.C.; Gifford, G.F. Water quality implications of cattle grazing on a semiarid watershed in southeastern Utah. J. Range Manag. 1976, 29, 109–113. [Google Scholar] [CrossRef]
  96. Strøm, A.R.; Kaasen, I. Trehalose metabolism in Escherichia coli: Stress protection and stress regulation of gene expression. Mol. Microbiol. 1993, 8, 205–210. [Google Scholar] [CrossRef]
  97. Welsh, D.T.; Herbert, R.A. Osmotically induced intracellular trehalose, but not glycine betaine accumulation promotes desiccation tolerance in Escherichia coli. FEMS Microbiol. Lett. 1999, 174, 57–63. [Google Scholar] [CrossRef]
  98. Chen, Z.; Wang, H.; Ionita, C.; Luo, F.; Jiang, X. Effects of chicken litter storage time and ammonia content on thermal resistance of desiccation-adapted Salmonella spp. Appl. Environ. Microbiol. 2015, 81, 6883–6889. [Google Scholar] [CrossRef]
  99. Lebreton, F.; Manson, A.L.; Saavedra, J.T.; Straub, T.J.; Earl, A.M.; Gilmore, M.S. Tracing the Enterococci from paleozoic origins to the hospital. Cell 2017, 169, 849–861.e813. [Google Scholar] [CrossRef]
  100. Bale, M.J.; Bennett, P.M.; Beringer, J.E.; Hinton, M. The survival of bacteria exposed to desiccation on surfaces associated with farm buildings. J. Appl. Bacteriol. 1993, 75, 519–528. [Google Scholar] [CrossRef]
  101. Whitman, W.B.; Rainey, F.; Kämpfer, P.; Trujillo, M.; Chun, J.; DeVos, P.; Hedlund, B.; Dedysh, S. Bergey’s Manual of Systematics of Archaea and Bacteria; Wiley Online Library: Hoboken, NJ, USA, 2015; Volume 410. [Google Scholar]
Figure 1. Marginal means and 95% confidence intervals of log10 aerobic bacteria (CFU per g of fresh manure) exposed to UV-B and no UV-B exposure (exposed to LED). Manure exposed to UV-B (pink) and No-UVB (blue) for 4 time points. (Table 1 with the description of times and dose).
Environments 11 00197 g001
Figure 2. Marginal means and 95% confidence intervals of E. coli log10 CFU per g of fresh manure exposed to UV-B and no UV-B exposure (LED exposure). Manure exposed to UV-B (pink) and No-UVB (blue) for 4-time points. (A) total E. coli, (B) tetracycline-resistant E. coli, and (C) ceftriaxone-resistant E. coli. (Table 1 with the description of times and dose).
Environments 11 00197 g002
Figure 3. Marginal means of Enterococcus spp. log10 CFU per g of fresh manure exposed to UV-B and no UV-B exposure (LED exposure). Manure exposed to UV-B (pink) and No-UVB (blue) for 4 time points. (A) Total Enterococcus spp., (B) tetracycline-resistant Enterococcus spp., and (C) erythromycin-resistant Enterococcus spp. (Table 1 with the description of times and dose).
Environments 11 00197 g003
Figure 4. Marginal means and 95% confidence intervals of total aerobic bacteria log10 CFU per g of dry manure exposed to UV-B and no UV-B exposure (LED exposure). Manure exposed to UV-B (pink) and no UV-B exposure (blue) for 4 time points (Table 1 with the description of times and dose).
Environments 11 00197 g004
Figure 5. Marginal means and 95% confidence intervals of E. coli log10 CFU per gram of dry manure exposed to UV-B and no UV-B exposure (LED exposure). Manure exposed to UV-B (pink) and No-UVB (blue) for 4 time points. (A) total E. coli, and (B) tetracycline-resistant E. coli. (Table 1 with the description of times and dose).
Environments 11 00197 g005
Figure 6. Marginal means and 95% confidence intervals of Enterococcus spp. log10 CFU per g of dry manure exposed to UV-B and no UV-B exposure (LED exposure). Manure exposed to UV-B (pink) and No-UV-B (blue) for 4 time points. (A) total Enterococcus spp., (B) tetracycline-resistant Enterococcus spp., and (C) erythromycin-resistant Enterococcus spp. (Table 1 with the description of times and dose).
Environments 11 00197 g006
Figure 7. Marginal means and 95% confidence intervals of total aerobic bacteria log10 CFU per g of dry matter exposed to low humidity (31%) and high humidity (73%). Manure exposed to low humidity (pink) and high humidity (blue) across 4 days.
Environments 11 00197 g007
Figure 8. Marginal means and 95% confidence intervals of E. coli log10 CFU per g of dry matter exposed to low humidity (31%) and high humidity (73%). Manure was exposed to low humidity (pink) and exposed to high humidity (blue) for 4 time points. (A) total E. coli, (B) tetracycline-resistant E. coli, and (C) ceftriaxone-resistant E. coli.
Environments 11 00197 g008
Figure 9. Marginal means and 95% confidence intervals of Enterococcus spp. log10 CFU per g of dry matter exposed to low humidity (31%) and high humidity (71%). Manure was exposed to low humidity (pink) and high humidity (blue) for 4 time points. (A) total Enterococcus spp., (B) tetracycline-resistant Enterococcus spp., and (C) erythromycin-resistant Enterococcus spp.
Environments 11 00197 g009
Table 1. Description of exposure times and UV-B dose.
Exposure Time *Time (Min)Time (h)UV-B Dose (J/m2)
0000
160116,560
21252.0833,120
32073.4549,680
* Time was used as a categorical variable in the mixed models.
Table 2. Bacterial prevalence from dry and fresh manure samples in the UV-B experiment and fresh manure samples in the Relative Humidity experiment.
Type of SampleE. coli (%)TET 1
Resistant
E. coli (%)
AXO 2
Resistant
E. coli (%)
Enterococcus spp. (%)TET 1 Resistant Enterococcus spp. (%)ERY 3 Resistant
Enterococcus spp. (%)
UV-B
Dry manure
(control)
33.3 (3/9)11.1 (1/9)0 (0/9)100 (9/9)66.6 (6/9)88.9 (8/9)
Dry manure
(treatment)
77.8 (7/9)55.5 (5/9)0 (0/9)77.8 (7/9)66.7 (6/9)77.8 (7/9)
Fresh manure
(control)
100 (9/9)100 (9/9)100 (9/9)100 (9/9)100 (9/9)100 (9/9)
Fresh manure
(treatment)
100 (9/9)100 (9/9)100 (9/9)100 (9/9)100 (9/9)100 (9/9)
Relative Humidity
Control100 (12/12)100 (12/12)91.7(11/12)100 (12/12)100 (12/12)100 (12/12)
Treatment100 (12/12)100 (12/12)83.3 (10/12)100 (12/12)100 (12/12)100 (12/12)
1 TET = tetracycline, 2 AXO = ceftriaxone, and 3 ERY = erythromycin. Pre-exposure samples are not included.
Table 3. Raw bacterial CFU expressed in log10 from dry and fresh manure samples in the UV-B experiment and fresh manure samples in the Relative Humidity experiment.
Type of SampleE. coli
(Mean Log10)
TET 1 Resistant
E. coli
(Mean Log10)
AXO 2
Resistant
E. coli
(Mean Log10)
Enterococcus spp.
(Mean Log10)
TET 1 Resistant Enterococcus spp.
(Mean Log10)
ERY 3 Resistant
Enterococcus spp.
(Mean Log10)
UV-B
Dry manure (control) 0.80.403.42.52.9
Dry manure (treatment)2.11.602.91.92.1
Fresh manure (control)5.74.94.35.33.53.5
Fresh manure (treatment)5.95.44.253.23.2
Relative Humidity
Control8.68.23.65.55.35.3
Treatment8.57.93.15.95.25.3
1 TET = tetracycline, 2 AXO = ceftriaxone, and 3 ERY = erythromycin.
Disclaimer/Publisher’s Note: The statements, opinions and data contained in all publications are solely those of the individual author(s) and contributor(s) and not of MDPI and/or the editor(s). MDPI and/or the editor(s) disclaim responsibility for any injury to people or property resulting from any ideas, methods, instructions or products referred to in the content.

