Article

The Ultimate Fate of Reactive Dyes Absorbed onto Polymer Beads: Feasibility and Optimization of Sorbent Bio-Regeneration under Alternated Anaerobic–Aerobic Phases

by
Domenica Mosca Angelucci
*,
Valentina Stazi
and
Maria Concetta Tomei
Water Research Institute, National Research Council (CNR-IRSA), Via Salaria km 29.300, CP 10, Monterotondo Stazione, 00015 Rome, Italy
*
Author to whom correspondence should be addressed.
Environments 2024, 11(9), 207; https://doi.org/10.3390/environments11090207
Submission received: 28 June 2024 / Revised: 13 September 2024 / Accepted: 16 September 2024 / Published: 18 September 2024
(This article belongs to the Special Issue Advanced Technologies of Water and Wastewater Treatment (2nd Edition))

Abstract

:
Dyes employed in many production cycles are characterized by high toxicity and persistence in the environment, and conventional wastewater treatments often fail to reach high removal efficiencies. Consequently, there is an increasing research demand aimed at the development of more efficient and sustainable technologies. A two-step strategy consisting of dye sorption followed by sorbent bio-regeneration is proposed here, with a special focus on the regeneration step. The objective of this study was to establish the best operating conditions to achieve regeneration of dye-loaded polymers and concurrently the ultimate removal of the dyes. To this aim, the bio-regeneration of the Hytrel 8206 polymer, used as a sorbent material to remove Remazol Red dye from textile wastewater, was investigated in a two-phase partitioning bioreactor (TPPB) under alternated anaerobic–aerobic conditions. Comprehensive analysis of operational parameters, including sorbent load and initial contamination levels, was conducted to optimize bio-regeneration efficiency. Experimental data demonstrated high regeneration efficiencies (91–98%) with biodegradation efficiencies up to 89%. This study also examines the biodegradation process to investigate the fate of biodegradation intermediates; results confirmed the successful degradation of the dye without significant by-product accumulation. This research underscores the potential of TPPB-based bio-regeneration of polymeric sorbent material for sustainable wastewater treatment, offering a promising solution to the global challenge of dye pollution in water resources.

Graphical Abstract

1. Introduction

The discharge of dye-containing wastewater into water bodies poses significant environmental concerns due to their toxicity and resistance to biodegradation. Conventional wastewater treatments often fail at effectively removing these pollutants; thus, requiring the development of more efficient and sustainable technologies. Textile wastewater can be treated physically, chemically, biologically, or by utilizing a combination of these methods [1]. Among physical techniques, sorption processes are the most studied and applied. However, the disposal and/or the regeneration of spent sorbents lead to further environmental and economic challenges. One of the most important characteristics of a sorbent material is its regeneration potential, which, if applicable, may save costs, reduce environmental impact, and enhance the disposal efficiency [2,3]. Indeed, the possibility of reusing sorbent materials is a hot topic for both reducing waste production and process costs [4]. The way towards a zero-waste process inevitably goes through the selection of the best regeneration approach. The bio-regeneration of sorbent materials, where microorganisms are employed to degrade and remove sorbed dyes, offers a very promising solution. This process not only reduces the need for frequent replacement of sorbent materials but also minimizes secondary pollution associated with chemical regenerating agents and/or degradation by-products. Moreover, the sustainability of this approach is a feature to be added to the recognized advantages of biological treatments, e.g., good efficiency, economic viability, and industrial scale suitability.
In recent years, various studies explored the feasibility of bioprocesses for regeneration with different strategies or from different contaminated matrices [5,6,7]. Specifically, the use of cheap commercial polymers followed by their bio-regeneration in an anaerobic two-phase partitioning bioreactor (TPPB) was recently proposed as a strategy combining fast kinetics of the removal process and the intrinsic sustainability of the biological treatment [8]. In addition, the possibility of carrying out on-site treatment, without moving the wastewater to be treated and/or sorbent material to be regenerated simultaneously to the wastewater treatment, is an additional benefit of this technology.
This study investigates the bio-regeneration of the Hytrel 8206 polymer used to remove a reactive azo dye (Remazol Red) from segregated dye baths. This dye has been selected as target compound because reactive dyes are utilized worldwide and characterized by very low biodegradability since their complex structure requires a variety of bacteria (both aerobic and anaerobic) that are able to achieve complete biodegradation of the parent dye and produced intermediates [9]. The selection of Hytrel 8206 for this study is based on the good results obtained in previous experiments on the biological removal of reactive dyes [8,10].
The main objectives of this study are to advance the understanding of the bio-regeneration process under alternated anaerobic–aerobic conditions and to demonstrate its feasibility for reactive dyes. The effects on the regeneration efficiency of operating parameters, such as the polymer-to-water ratio and the initial contamination level of the polymer, have been deeply investigated. Sequential anaerobic–aerobic conditions were tested because they have been recognized as effective in achieving the complete mineralization of azo dyes, since in the first anaerobic phase the decolorization occurs through reductive cleavage of the dye’s azo linkages, producing colorless but potentially hazardous aromatic amines. Subsequently, the aerobic phase provides favorable conditions for the degradation of these by-products [11]. This operating strategy is proposed here for TPPB operation to obtain a simultaneously regenerated polymer and the mineralization of produced degradation intermediates.
Finally, a comparative analysis of previous studies dealing with the biological regeneration of sorbent materials employed in dye removal from textile effluents has also been provided to evaluate the feasibility of the TPPB system as an efficient technology for solid sorbent recovery and re-use.

2. Materials and Methods

2.1. Chemicals

Hytrel 8206 is a thermoplastic polyether-ester copolymer shaped in beads (5 mm length 1.5 mm diameter, 1.17 g/cm3 density) kindly supplied by DuPont (Ontario, Canada). Before using the polymer beads, a multi-step washing process was applied to clean them from potential impurities with a previously described procedure [10].
As a target compound representative of reactive dyes, Remazol® Brilliant Red BB 150% (RR), kindly provided by DyStar Italia S.r.l. (Milan, Italy) as a commercial product, has been utilized. Sodium acetate (SA, purity 99%), NaOH (purity > 99%) and methanol (HPLC grade) were supplied by Sigma Aldrich (St. Louis, MO, USA). All other chemicals (mineral medium components) were of commercial grade and were obtained from Carlo Erba (Milan, Italy).

2.2. RR-Degrading Biomass

2.2.1. Acclimatization and Maintenance

A microbial culture already adapted to reactive dyes was grown in a lab-scale sequencing batch reactor (SBR) for a period of 4 months. The original inoculum consisted of biomass grown in a bioreactor operating the anaerobic–aerobic treatment of a real dyeing bath stream composed of a mixture of mono and di-azo reactive dyes. Further details on the development of this microbial culture are reported elsewhere [12]. The SBR (working volume, 1.6 L; temperature, 28 ± 1 °C) was operated with a work cycle of 24 h including feeding (5 min), anaerobic (690 min) and aerobic (690 min) phases, sedimentation (40 min), and effluent discharge (15 min) at an exchange ratio (fed volume/total volume) of 0.3. Two peristaltic pumps (Perinox SF3, Cellai, Milan, Italy) and a magnetic stirrer (Cimarec I, ThermoFisher Scientific, Milan, Italy) were employed for feed and effluent discharge and for mixing (320 rpm), respectively. Only during the aerobic phase, dissolved oxygen (DO) was measured with a probe (CellOx 325, WTW, Weilheim, Germany) and controlled within the range of 3–4 mg/L via an on/off strategy through an air compressor connected to the bioreactor. More details on the SBR system are reported elsewhere [12].
The feed consisted of an aqueous solution of RR, SA, and mineral salt medium, whose composition is given by Williams and Unz [13], added to get the C:N:P ratio of 100:5:1 with reference to the total carbon content of both RR and SA. RR concentration was increased stepwise from 5 to 12 mg/L according to the experimental plan reported in Table 1, while SA was gradually decreased to reach a final SA/RR ratio of 20:1, as suggested by Mata et al. [14]. RR concentrations are representative of the range of values reported for reactive red azo dyes in simulated textile and real dye bath wastewater in previous studies, i.e., 10–50 mg/L [14,15,16].
Daily UV-visible absorbance scans in the 200–900 nm spectral band to measure the color and analysis of RR concentration in the influent and the effluent provided the data to evaluate the process performance; moreover, periodic measurements of pH and biomass concentration were also accomplished to complete the process characterization.
After 2 months, once stable process performance was reached, the developed RR-degrading culture was used to inoculate a TPPB employed for the bio-regeneration experiments. Each inoculum was ~15% (v/v) of the total biomass volume in the SBR. Before adding the inoculum to the TPPB unit, the biomass was washed with distilled water to eliminate any RR residual from previous SBR operation. At the end of each bio-regeneration test, the biomass was washed and moved again to the SBR.

2.2.2. Biodegradation Kinetic Tests

Biodegradation kinetic tests have been performed to characterize the microbial culture at the end of stages I and III, i.e., before the bio-regeneration experiments and at the end of the experimental campaign. In both cases, the experiments were carried out with an influent RR concentration of 12 mg/L and a different SA/RR ratio (see Table 1) by measuring RR concentration in liquid samples collected from the SBR at intervals of ~1 h during the reaction phase. In addition, COD was also measured during the test at time intervals of 3–6 h.

2.3. Preliminary Abiotic Tests

2.3.1. Sorption and Desorption Experiments

For the sorption study, ~1.45 g of Hytrel 8206 was added to conical flasks containing 25 mL of RR solution (50 mg/L) and mixed for 24 h at 320 rpm and 20 °C. Three different pH values (i.e., 4, 5.5, and 7) were tested in duplicate. Regular monitoring and adjustment of pH by acid/base addition was applied to maintain the desired pH values. Periodic samples were collected from each flask and analyzed for RR concentration. At the end of the tests, polymer beads were manually separated by a sieve and used for the desorption experiments performed with tap water for a contact time of 24 h. The methodology for sampling and analysis in the desorption tests was the same as described for the sorption ones, with the only difference being in pH value, which was fixed at 7.5 to test neutral conditions, which are required for efficient performance of biological processes.

2.3.2. Polymer Loading

The polymer used for bio-regeneration tests was artificially loaded with a target dye with dedicated loading experiments. These tests were carried out by contacting and mixing a known mass of fresh polymer with a stock solution of RR (75–100 mg/L) at pH 4–5.5 for 5–6.5 h, i.e., once the required RR uptake for the subsequent bio-regeneration tests was reached (see Table 2). The uptake was verified by mass-balance measurements of RR liquid concentration during the loading experiments and applying the procedure described in the Supplementary Material section.

2.4. Bio-Regeneration Study

Bio-regeneration experiments have been performed in a TPPB unit by adding RR-loaded polymer beads to a batch reactor (working volume, 0.2 L; temperature, 28 °C; mixing, 320 rpm) inoculated with the mixed culture collected from the SBR. An aliquot of the biomass (less than 15% w/w) was transferred to the TPPB reactor and then moved again to the SBR at the end of the test for maintenance. Different initial RR polymer loadings and polymer-to-water ratios (PWRs) have been tested according to the operating conditions listed in Table 2.
All the tests were performed under alternation of anaerobic and aerobic conditions lasting 12 h each for the entire duration of the test (3.5–6.5 days). The additional carbon source (SA) and the mineral medium were supplied to the liquid phase of the bioreactor before starting each test; both were dosed based on RR amount sorbed into the Hytrel polymer, with the same ratios of SBR operation.
Before each anaerobic phase, the liquid phase of the bio-regeneration unit was thoroughly flushed with N2 gas to reduce DO at values ≤ 0.15 mg/L. In the aerobic phase, only for the T1 test, an intermittent aeration (15 min on/15 min off) was supplied without DO monitoring. For the other tests, DO concentration was monitored and controlled (in the range of 3–4 mg/L) through an on–off aeration strategy (with the same equipment of SBR), and recorded DO data were employed to estimate the Specific Oxygen Uptake Rate (SOUR) of the biomass with the procedure reported in Tomei et al. [17]. Moreover, the pH was also monitored and controlled (set point value 7.0) by dosing NaOH or HCl solutions (1 M) to the liquid phase of the bioreactor when required.
Parallel abiotic control tests were performed with the same operating conditions of bio-regeneration tests by adding the same loaded polymer to tap water.
The regeneration efficiency (RE) of polymer beads and biodegradation efficiency (BE) of the desorbed RR dye from the polymer beads were monitored by analyzing periodical samples of both liquid (time intervals of 4–24 h) and polymeric (daily) phases. Additional monitoring included UV-visible absorbance scans, pH, and biomass concentration once a day and COD before adding the polymer and at the end of each test.

2.5. Analysis

The RR concentration in aqueous samples was measured after centrifugation (10 min at 13,000 rpm) by using a spectrophotometer (Lambda 25, Perkin Elmer Inc., Waltham, MA, USA) with absorbance readings at 509 nm of wavelength. A calibration curve obtained with standard solutions of RR within the range of 1–10 mg/L has been employed. The samples were diluted with distilled water when necessary.
The RR concentration in polymer beads was determined by a multi-step extraction procedure, repeated until negligible residual RR was detected; each extraction step was performed by contacting ~0.1 g of polymer with 30 mL of 0.l M NaOH solution in a sealed glass flask mixed (320 rpm) with a magnetic stirrer for 1 h. Then the extracting solution was separated from the polymer, centrifuged (5 min at 13,000 rpm), and analyzed for RR content as for aqueous samples with a spectrophotometer at 482 nm of wavelength (by using a calibration curve realized as described earlier but at a different wavelength according to the NaOH solution spectrum). A parallel blank test with a fresh polymer was performed for each extraction step.
VSS concentration, to quantify the biomass concentration in the SBR and in the bioregeneration unit, was measured according to standard methods [18].
COD concentration was measured in centrifuged samples with Merck® Spectroquant kits based on potassium dichromate oxidation and followed by spectrophotometric determination (Spectroquant Nova30).
pH was measured with a pH meter (inoLab pH Level 2, WTW, Germany).

3. Results and Discussion

3.1. Preliminary Tests with Polymer

Preliminary sorption/desorption tests confirmed the good performance of Hytrel 8206 as effective sorbent for decolorization and its potential RR release when regenerated in a TPPB bioreactor where it is employed as a partitioning phase.
Dye uptake has been monitored vs. time, and equilibrium concentrations were determined under different experimental conditions of pH, as reported in Figure S1 (Supplementary Material). Equilibrium data have been used to estimate partition coefficients (defined as P = Cpol*/Cw*) for the tested conditions, equal to 1609 ± 218, 24 ± 2, and 8 ± 1 at pH 4, 5.5, and 7, respectively. It is observed that acidic conditions favor RR sorption according to previous results for other azo dyes [8,10]. Moreover, kinetic data (Figure S1) demonstrated that, especially for acidic conditions, most of the mass transfer occurs in the first part of the test. At pH 4, 90% of the final removal (>98%) is achieved after 4 h of treatment, while only 55 and 28% are reached at the end of the test at pH values of 5.5 and 7, respectively.
Desorption tests, conducted with the RR-loaded polymer from sorption tests, confirmed that RR uptake is a reversible process, with desorption efficiencies in the range of 13–18% referring to the initial dye amount absorbed into the polymer. Higher efficiencies are observed for more loaded polymers, presumably due to the higher solid–liquid concentration gradient, which results in a more efficient mass transfer process.

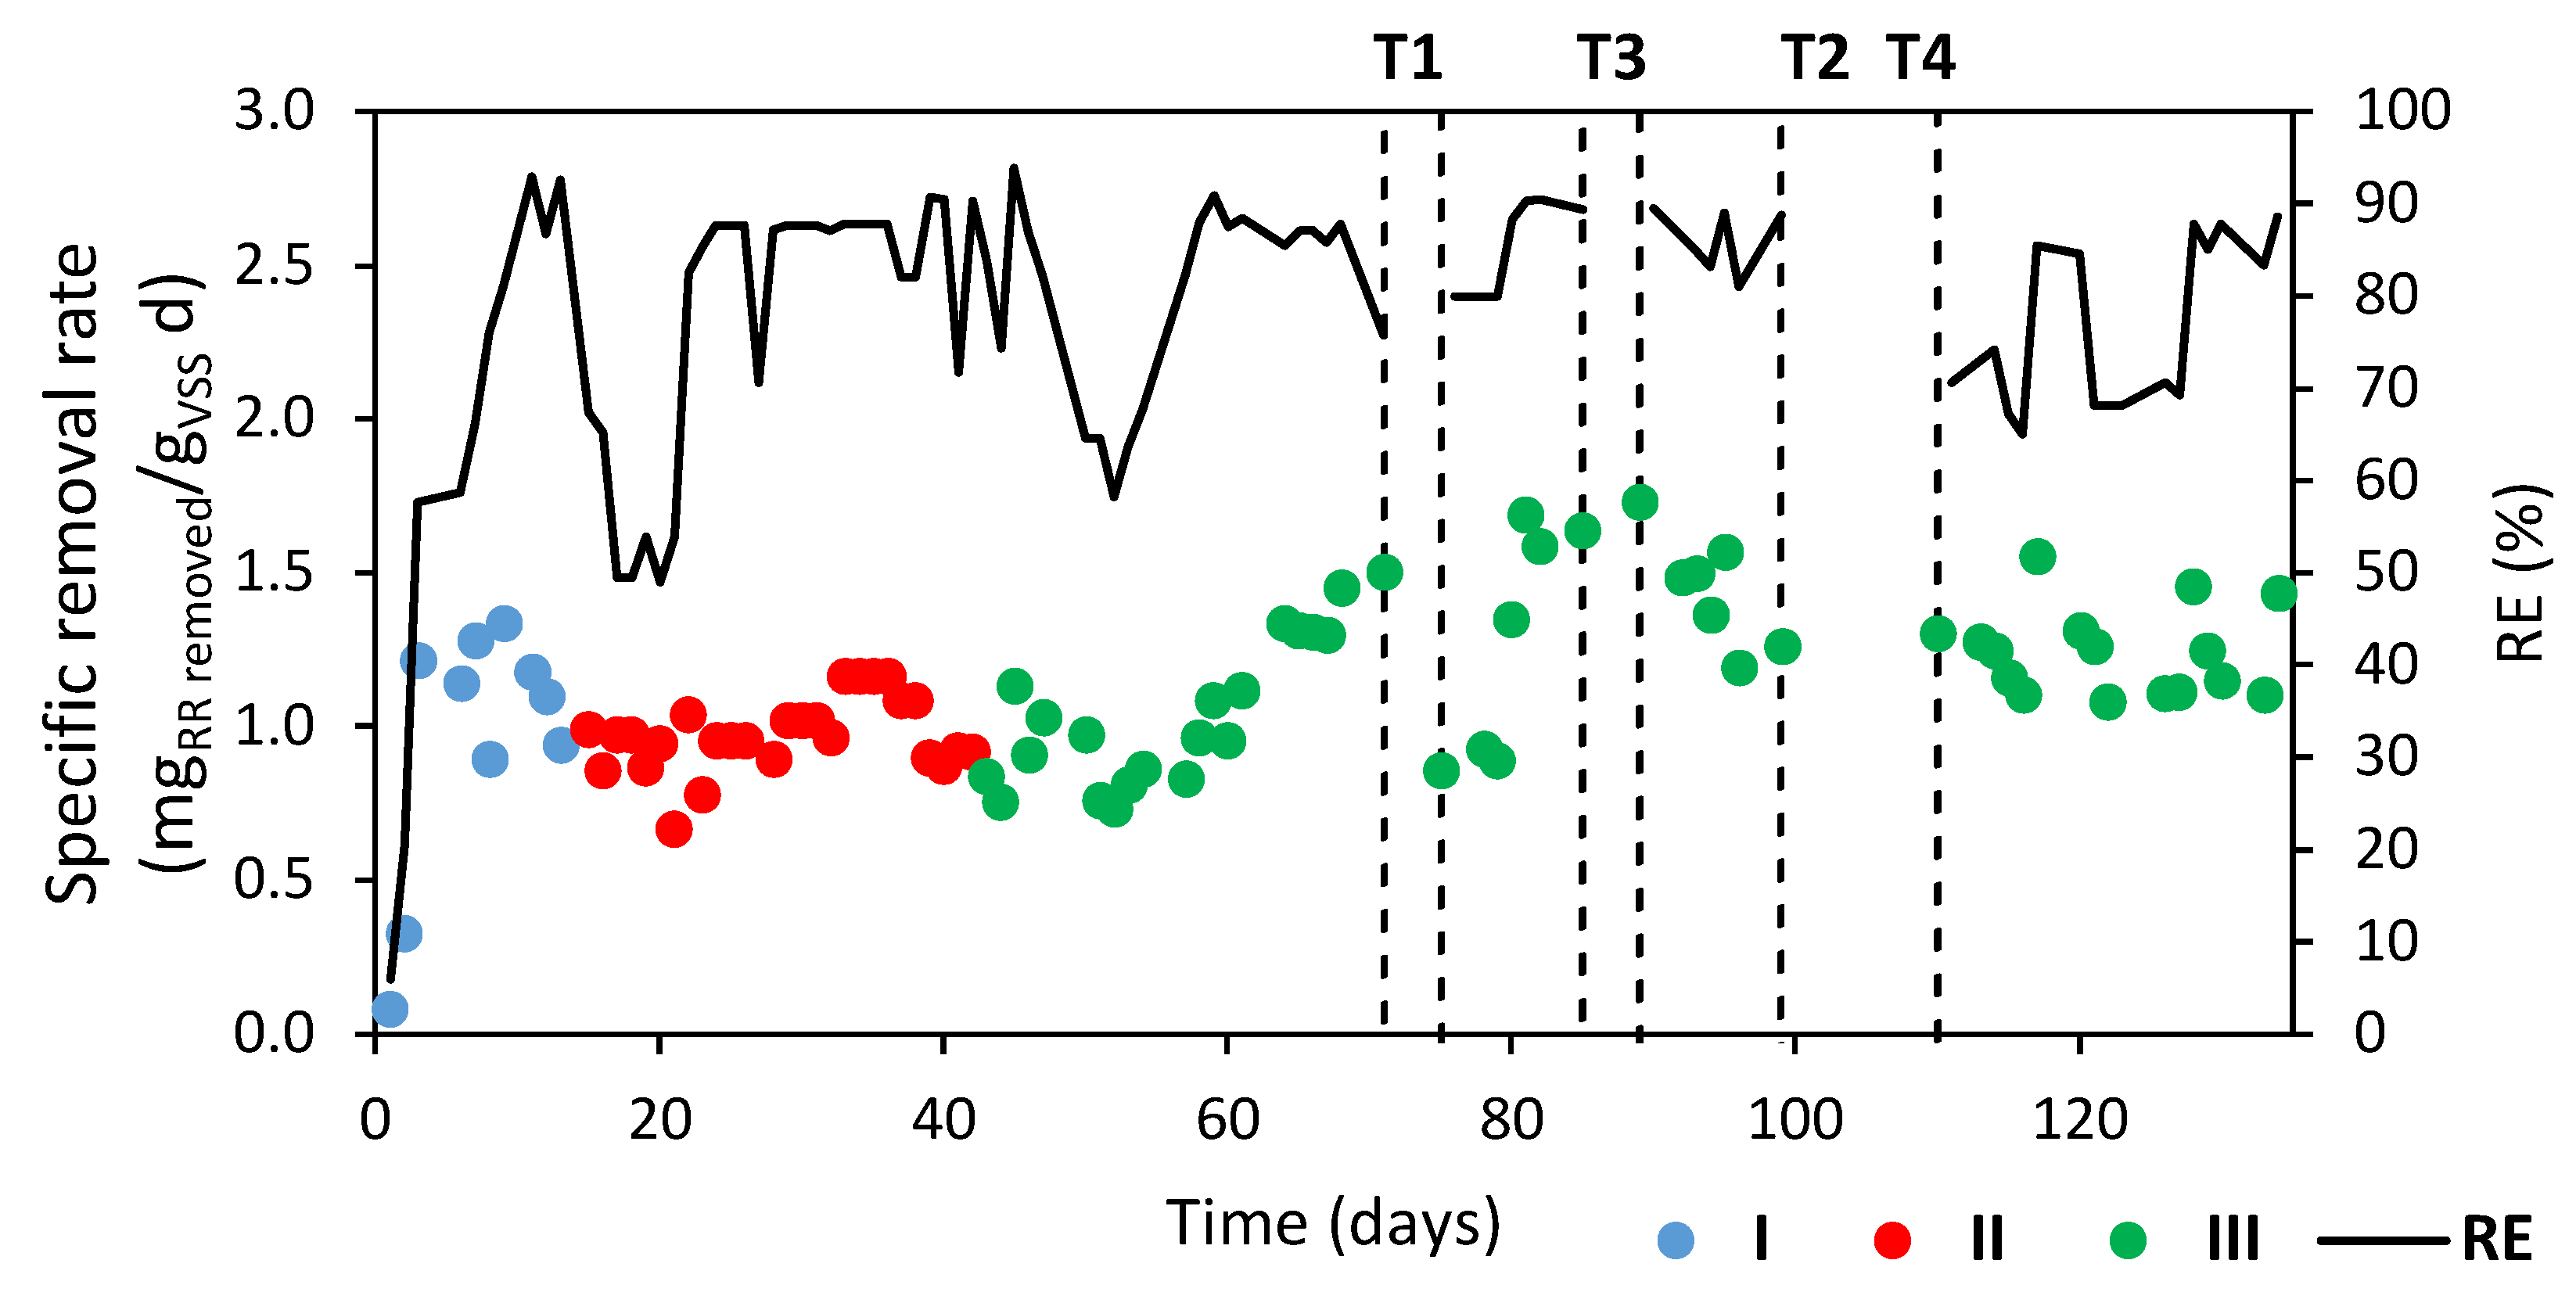
3.2. RR-Degrading Biomass Acclimatization and Characterization

Acclimatization of biomass was conducted in a sequential anaerobic–aerobic SBR for a 2-month period (see Table 1). Figure 1 gives an overview of the overall decolorization performance of this experimental period evaluated in terms of removal efficiency (RE) and biomass activity (expressed as specific removal rate mgRRremoved/gVSS d). The inoculum showed a fast and efficient adaptation to RR; dye removal efficiencies of 60% were observed after the first week of operation. Afterwards, average values of 70%, 78%, and 81% were detected during stages I, II, and III, respectively. This fast acclimatization may be justified by the biomass capacity of degrading azo dyes achieved in previous experiments conducted with real textile wastewater containing different reactive dyes [10,12].
A rapid response is also observed for the biomass activity, with high values of specific RR removal rates (>1 mgRRremoved/gVSS d) reached after just a few days and maintained for the whole experimentation, characterized by stable performance. No remarkable difference was found between the first two stages, while the third stage exhibited higher values, often above 1.5 mgRRremoved/gVSS d; this finding can be explained with a progressive enhancement of biodegradation ability of the microbial culture exposed to increasing dye loads and with the effect of the progressive reduction of the external carbon source. In fact, at the initial acclimatization phase, the added carbon provides electrons required for the cleavage of the azo bond and at the same time contribute to the biomass growth; thus, favoring the acclimatization of the biomass to the dye [19]. With progressive acclimatization, the microorganisms express the additional capability of using the dye itself as carbon source, and it is indeed advisable to reduce additional carbon sources to avoid accumulation of excess substrate [20]. According to this hypothesis, Kapdan and Alparslan [21] explained the better decolorization efficiency at low carbon sources with the possible attack of organisms to the dye to provide the extra carbon source to survive in the presence of insufficient readily available carbonaceous substrates.
In Figure 1, vertical dotted lines designate time windows when bio-regeneration TPPB tests were conducted. Data of biomass activity are expressed in terms of specific removal rate of Absorbance Unit (AU): values of 0.024 ± 0.007, 0.025 ± 0.003, and 0.032 ± 0.006 AU/gVSS d have been estimated for stages I, II, and III, respectively. These values are well above the ones reported in specialized literature for biological systems. For example, Tomei et al. [12] reported values comprised within the range of 0.0023–0.0173 AU/gVSS d achieved in an anaerobic–aerobic SBR used to treat real textile wastewater. Moreover, reported data of single aerobic or anaerobic processes applied to treat real textile wastewater are even lower, i.e., 0.6–1.3·10−4 AU/gVSS d [22] and 0.0019 AU/gVSS d [23], respectively.
Enriched biomass employed in bio-regeneration, before starting the experiments, was characterized with a kinetic test to quantify the effective biodegradation of RR and to analyze spectra evolution; experimental results are reported in Figure 2. A similar RR trend has also been observed in the kinetic test performed at the end of experimental campaign The RR concentration time profile highlighted the evolution of its biodegradation during the test, and the removal efficiency of COD confirmed the practically complete removal of by-products originated by RR degradation. The UV-visible spectra recorded during the test (Figure S2) and removal efficiencies evaluated with the spectra after the anaerobic and aerobic phases, supported this result. From analysis of spectra evolution (Figure S2), it can be observed that, after the anaerobic phase, the peak at λ 509 nm attributable to the dye completely disappeared, corresponding to the degradation of RR; moreover, the peak at λ value ~300 nm disappeared and the one at 270 nm increased. This shift, already reported by Jonstrup et al. [24], can be explained with the effective decolorization of RR and the subsequent formation of aromatic amines, usually detected at λ values lower than 350 nm [25]. It is important to note that the peak at 270 nm clearly decreased at the end of the kinetic test), giving an additional proof of the occurring amine degradation during the aerobic phase.

3.3. Bio-Regeneration

3.3.1. Abiotic Control Tests

An overview of the abiotic regeneration tests of RR-loaded beads obtained from polymer loading experiments (summarized in Table S1 of Supplementary Material) is displayed in Figure 3, with tests named according to Table 2. Data of abiotic regeneration are reported as RR concentration time profiles both in the liquid and polymeric phase; moreover, the regeneration efficiency (RE) of RR and mass transfer rate (MTR) have been plotted versus time for each tested condition. MTRs have been estimated as follows:
MTR = ( C pol , 0 C pol , t )   · M pol V w · t    
where Cpol,0 and Cpol,t are the polymeric concentration of RR at time 0 and t, Mpol is the amount of polymer, and Vw is the volume of liquid phase.
The first finding is that the regeneration efficiencies observed for all series of tests are quite similar, with final values of 21.8, 20.9, 20.1, and 23.6% for T1, T2, T3, and T4, respectively. This result implies a progressive increase in MTR values (from T1 to T4) with final values equal to 0.090, 0.335, and 0623 mgRR/L h for T2, T3, and T4, respectively.

3.3.2. Bio-Regeneration Tests

Bio-regeneration tests were performed with the loaded polymers by adding them to the TPPB regeneration unit. An overview of data from bio-regeneration tests is shown in Table 3, reporting final data of each test, i.e., at 3.5 d for T1 and 6.5 d for other experiments. As mentioned above, two operational scenarios were explored: firstly, different PWRs (i.e., 2 and 9% v/v, for the T1 and T2 tests) at similar levels of RR polymer contamination, and secondly, the highest PWR applied at increasing RR polymeric concentrations (from T2, to T3 and T4 experiments). Figure 4 and Figure 5 show experimental data collected during all bio-regeneration tests clustered by combining above-mentioned scenarios; data have been reported as RR concentration in both liquid (Figure 4a and Figure 5a) and polymeric phases (Figure 4b and Figure 5b), mass transfer and biodegradation rates (Figure 4c and Figure 5c), and regeneration and biodegradation efficiencies (Figure 4d and Figure 5d).
For the tests performed with the lowest RR concentration level, T1 and T2, similar regeneration efficiencies were observed at the end of the tests (see Table 3) with a minor effect on biodegradation efficiencies due to the different PWR, with values ranging from 83% of T1 to 78% of T2. Indeed, it is worth underlining that the biomass of T2 has been exposed to a significantly higher load than T1 (41.85 vs. 10.39 mgRR/gVSS). Nevertheless, the biomass responded very well, ensuring BR and BR/MTR values of satisfactory regeneration performance.
The patterns of polymeric concentration of RR are quite similar among those tests (Figure 4a), with final values of around 0.03 and 0.05 mgRR/gpol, for T1 and T2, respectively. These values are extremely lower (about one order of magnitude) than the ones detected in parallel abiotic tests, around 0.5 mgRR/gpol, without any effect of PWR (see Figure S3 in Supplementary Material). On the contrary, high liquid concentrations of RR in the test with the highest amount of polymer (T2) are observed with values around 10 mg/L, i.e., 5 times greater than the ones observed during T1 (Figure 4b). A direct graphic comparison among abiotic and biotic data of RR concentrations in polymeric and liquid phase is provided in Supplementary Material in Figure S3a and Figure S3b, respectively.
Regarding mass transfer and biodegradation rates, the patterns are comparable for T1 and T2 (Figure 4c) with almost an overlap between MTR and BR trends observed for both conditions, since no discrepancy was observed between the amount of transferred dye and the degraded amount. This behaviour is also highlighted by BR/MTR ratios of 89.8 and 84.4% estimated at the end of the T1 and T2 tests, respectively (Table 3). These findings suggested a positive correlation between PWR and bio-regeneration performance, since the highest value of polymer amount added to TPPB unit did not cause loss in efficiency.
Giving the good-achieved results at the highest polymer amounts, PWR of 9% was employed for the following T3 and T4 tests, whose results are reported in Figure 5; the data obtained demonstrated that TPPB technology can guarantee a regeneration up to 90% for the most highly loaded polymer (T4), with satisfactory biodegradation efficiencies (Table 3). Time profiles of polymer and liquid concentrations reported in Figure 5a and Figure 5b, respectively, highlighted the loading effect especially for the increasing residual concentration in the liquid phase. With reference to mass transfer and biodegradation rates, the profiles of T3 and T4 are quite different with respect to the one observed for the lowest polymer concentration level, i.e., the T2 test (Figure 4c and Figure 5c). In the T2 experiment, MTR and BR curves appear nearly overlapped. On the contrary, in T3 and T4, a significant difference between MTR and BR rates is detected, especially during the first phase of the experiments, as also confirmed by the temporary increasing of liquid concentration of RR displayed in Figure 5b. This behaviour can be explained with the effective desorption performance of Hytrel 8206, as well as the greater gradient effect for tests conducted at higher dye concentrations in the polymer. Figure 5d shows RE and BE vs. time; after just 1.5 days of regeneration time, polymers of T3 and T4 were already restored to more than 80% of the final RE (i.e., 97.62 and 90.77%, respectively). Concerning the BE, a slower trend is observed, but satisfactory final values of 89.21 and 75.08% are achieved for T3 and T4, respectively.

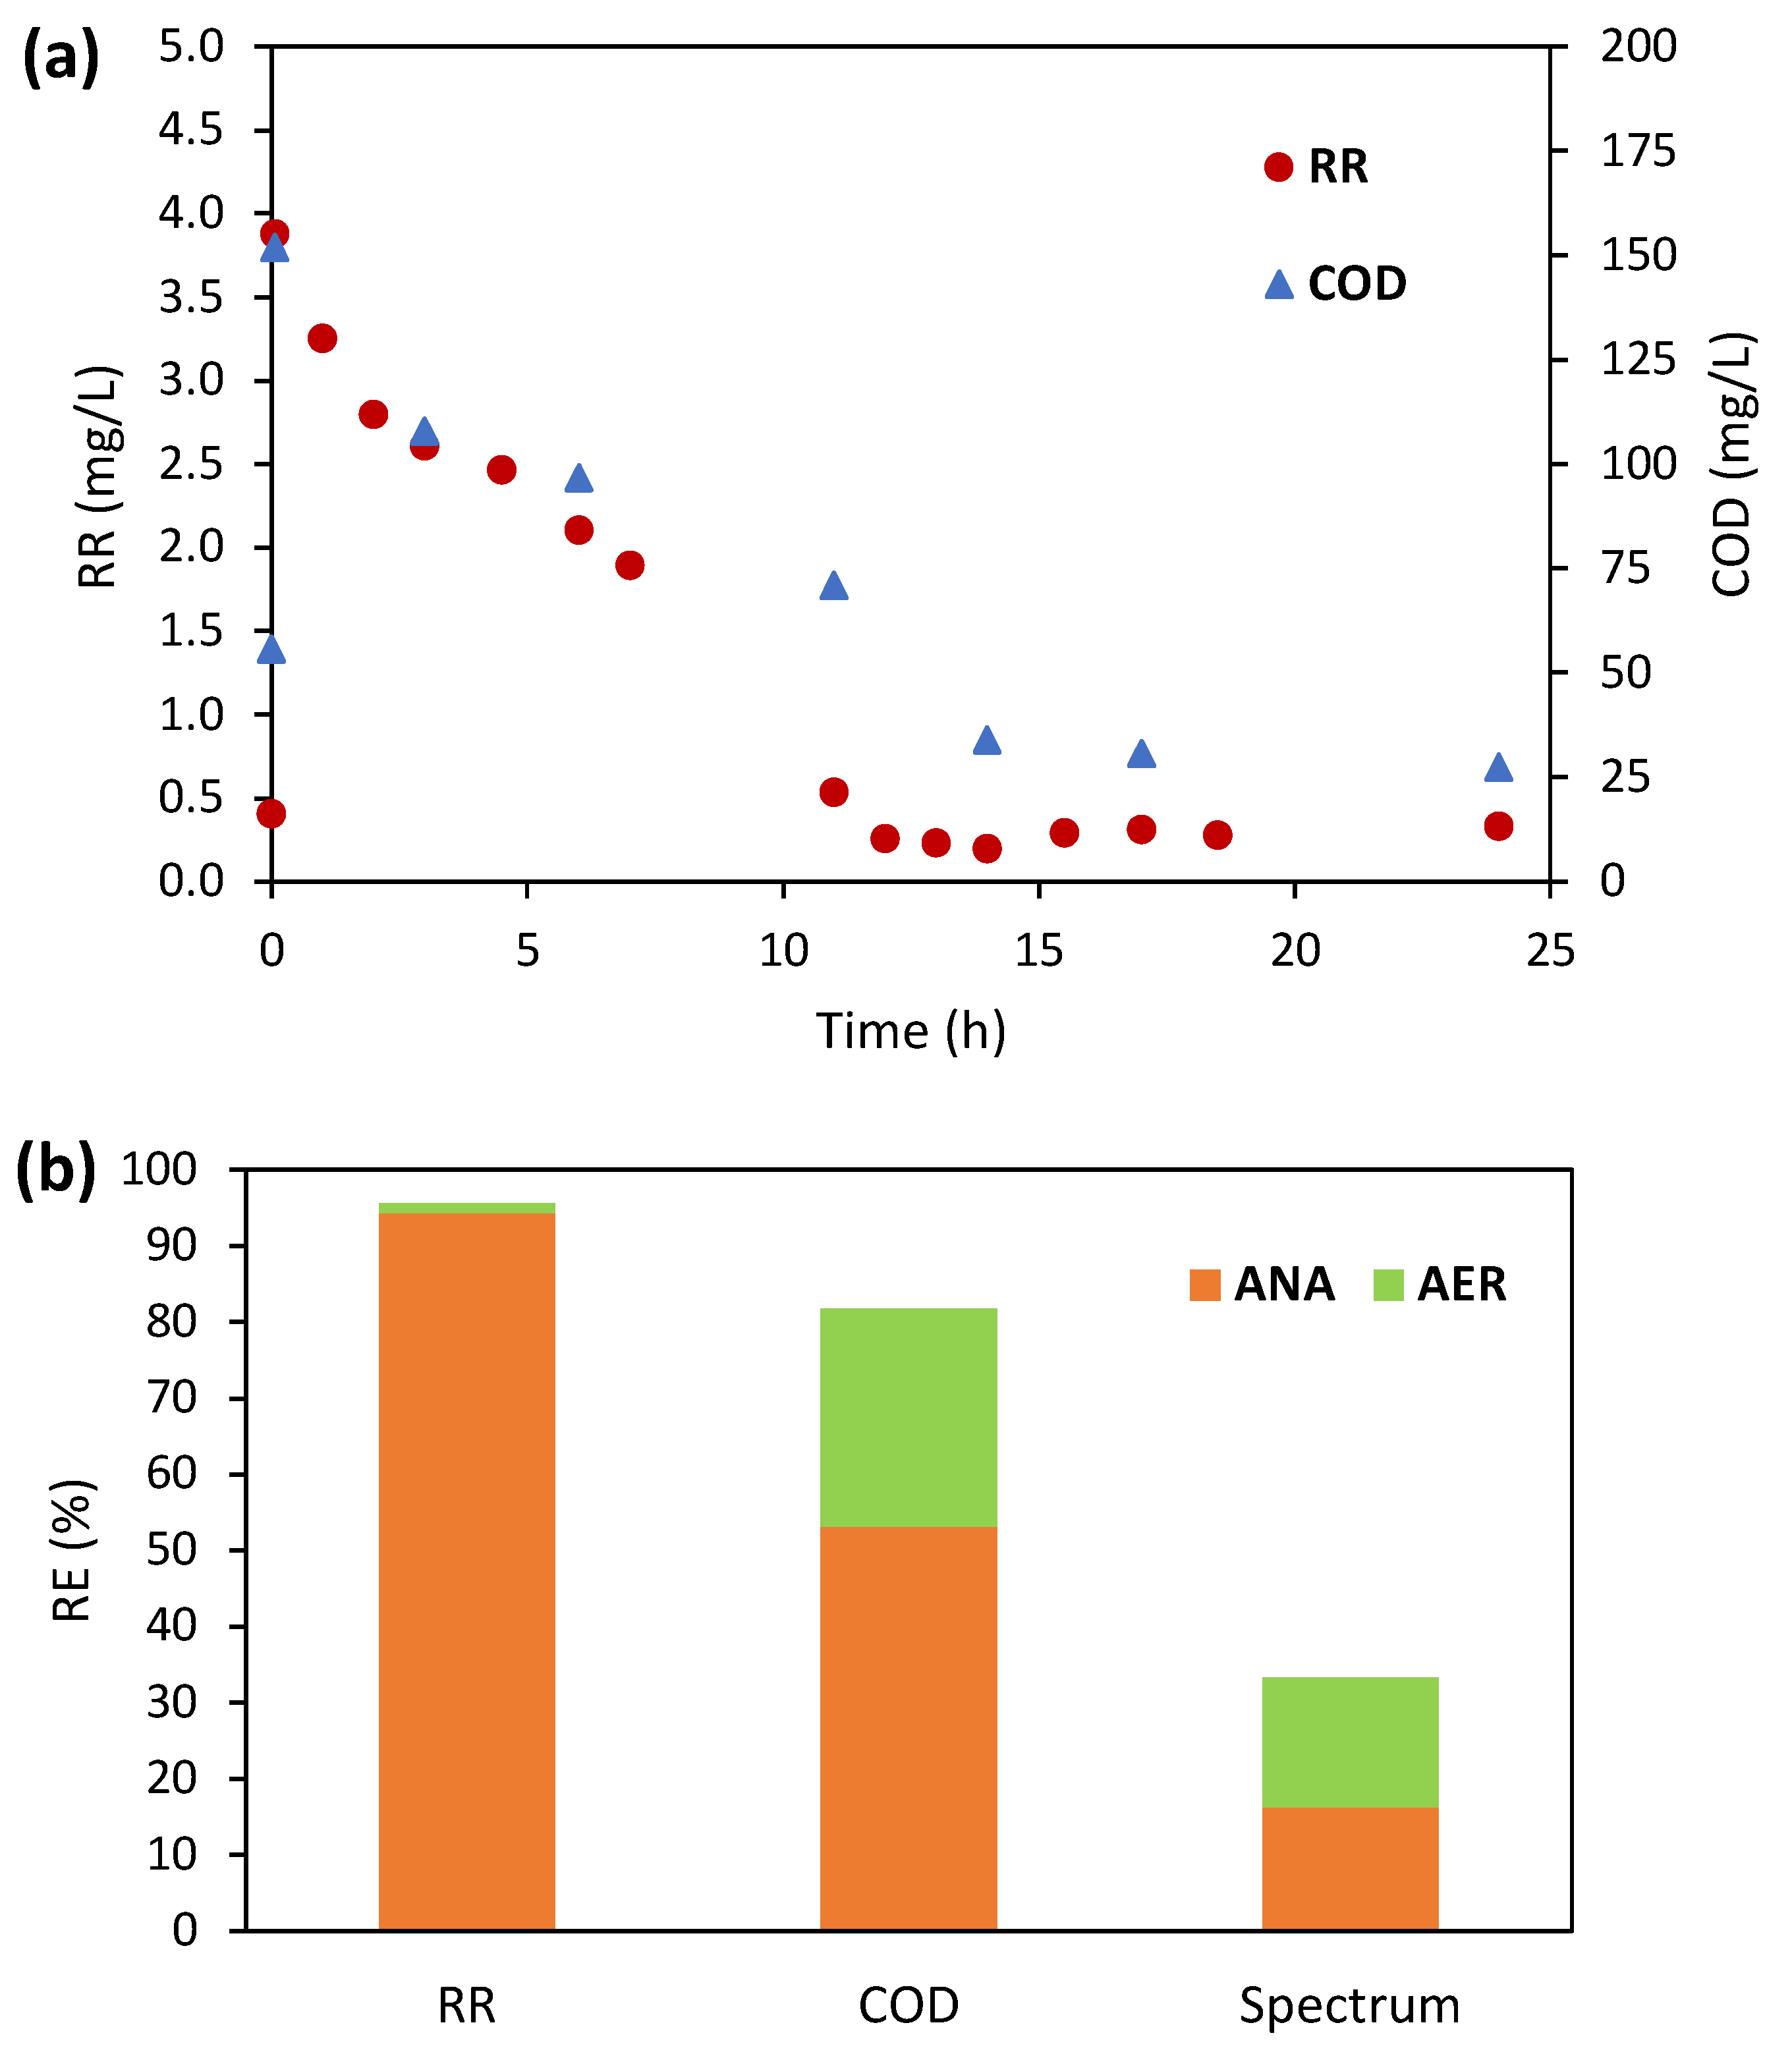
3.3.3. Fate of Biodegradation Products

Insight in direct UV-vis spectra analysis, in comparison to COD measurements and SOUR calculations, confirmed the effective biodegradation of the target reactive dye without significant accumulation of by-products coming from its degradation, except for T4, which operated in the most severe loading conditions. The direct observation of textile spectra, especially in the UV region, has been recognized as a satisfying method to detect aromatic amines [25]. In fact, Pinheiro et al., for the monitoring of aromatic amine emissions in wastewaters (particularly in the case of azo dye reduction in textile effluents), suggested a deep analysis of spectrum regions (range of 200–350 nm) in which aromatic amines can be easily identified without interferences from other chemicals and/or contaminants [25]. Indeed, the direct comparison of spectral curves in the above-mentioned range for the parent dyes and their derived amines are significantly different (see Figure S4). In our experiments, at least two new peaks, related to λ 196 and 241 nm, have been identified as possible signals of RR intermediates formed during the anaerobic phase. Cross-referencing the wavelength region identified by Pinheiro et al. [25] for aromatic amines and the possible intermediates reported by studies of RR biodegradation pattern [26,27]; these peaks can be related to the occurrences of aniline and 1-amino-2-naphtol-4-sulfonic acid (the latter probably associates to naphthol). In addition to this, only for the T4 test, another peak was also observed at 315 nm, probably due to the presence of the 2,4-diaminophenol anion [25]. Figure 6 gives an overview of the time profiles of the absorbances of supernatants related to the above-mentioned wavelengths for each bio-regeneration test. Moreover, SOUR data (related only to aerobic phases of experiments) have been also plotted in the same graphs, except for the T1 test, to correlate the biomass activity with the degradation of intermediates. As shown in Figure 6, the values of absorbance generally increased for each test and then returned to values similar the initial ones at the end of the test, as also highlighted by data listed in Table 4. Deviations from the trend just described have been observed for λ 196 only during the T3 test, while for λ 241 an increase was observed for both the T2 and T3 tests. However, significant accumulation of degradation by-products can be excluded by COD residual in liquid samples at the end of both tests, with values very close to the initial ones (see Table 4).
A particular behavior is observed during the T1 test (Figure 6a) with a clear peak for both wavelengths after the first anaerobic phase, followed by a sudden decrease under aerobic conditions, and then a gradual increase, only for λ 196 nm. It is worth underlining that this test is the one performed under the lowest dye loading, with low values of RR polymeric concentration level and PWR, thus maybe the time intervals between scans are not enough low to distinguish the accumulation and then the disappearance of aromatic amines, as instead observed for some aerobic phases during T2 and T4 tests. Another observation can be also performed for T4 data, especially in relation to COD values. In this test, the residual COD concentration in the supernatant did not come back close to initial values, as happens for other tests with lower dye loadings. It is worth noting that this value is partially due to the residual RR liquid concentration (25%) in the TPPB liquid phase and to the accumulation of metabolites.
Figure 6 also displays that respirometric activity, represented by SOUR data, was higher in the first 2 days of bio-regeneration tests, with maximum values directly correlated with the increasing RR loading level of the polymer (see Figure S5). So, high values in the first part of the experiments can be explained by the initial accumulation of aromatic amines (due to the higher gradient effect in tests operated with the highly loaded polymer causing a greater generation of intermediates). In the subsequent phases, SOUR data seem to stabilize around values increasing with the initial polymer contamination level (i.e., 4.06 ± 0.39 mgO2/gVSS h, 7.42 ± 2.05 mgO2/gVSS h, and 8.77 ± 2.16 mgO2/gVSS h for T2, T3, and T4, respectively). SOUR data, shown in Figure S5, are much higher than the endogenous respiration data of the same biomass detected during its maintenance into the SBR (i.e., 1.77 ± 0.36 mgO2/gVSS h). Continuous oxygen consumption at higher values with respect to the endogenous respiration can be justified with the occurrence of aromatic amine degradation during aerobic phases of TPPB bio-regeneration, matching the decreasing absorbance values at the selected wavelengths.

3.3.4. Comparison with Other Bio-Regeneration Studies

Various studies explored the use of microorganisms, such as bacteria, fungi, and algae, to regenerate sorbents saturated with dye pollutants. Table 5 shows the results of a comparative analysis of the performance of biological regeneration of sorbent materials employed for dye removal under different operating conditions.
Sequential anaerobic–aerobic conditions (with only one shift of reaction environment) have been applied to regenerate mono-amine modified silica (MAMS). Al-Amrani et al. compared the bio-regeneration of MAMS with granular activated carbon (GAC) loaded with acid orange 7 (AO7), observing a considerably higher efficiency of MAMS compared to GAC due to the better reversibility of sorption of MAMS for AO7 [28]. They further investigated operational factors affecting the bio-regeneration process, including redox condition, biomass type and concentration, and shaking speed. RE values within the range of 39–78% were detected with test duration up to 12 days; a shorter duration of bio-regeneration was achieved by using a lower shaking speed and a relatively higher initial biomass concentration [29], which was well above those tested in this study. Finally, the influence of sorbent particle size has been also investigated for MAMS loaded with different acid dyes [30]. As the MAMS particle size decreased, tests duration increased, up to 35 days. It is important to underline that in the above-mentioned studies RE was evaluated by analyzing the liquid phase in subsequent sorption tests. This procedure allowed the calculation of the dye uptake in the solid phase through a mass balance. Thus, the direct comparison among the data in Table 5 is not fully rigorous, but in any case, it can give useful information on the process performance in terms of efficiencies and time required to complete the bio-regeneration process.
Other studies dealing with bio-regeneration of dye-loaded sorbents are related to the use of pure species like Pseudomona putida [31] and Bacillus subtilis [32] or a consortia of Pseudomonas putida, Bacillus benzeovorans, Bacillus gordonae, and Flavobacterium sp. [6]. From data listed in Table 5 for the above-mentioned studies, it can be observed that the use of a pure culture does not always assure high levels of regeneration efficiencies.
This comparative analysis highlights that the TPPB platform employed to regenerate Hytrel 8206 is an excellent option in terms of overall efficiency and process time (91–98% in 6.5 days), high sorbent regeneration rate (with values at least one order of magnitude greater than the other alternative solutions), and low amount of acclimated biomass required per unit of regenerated sorbent. Moreover, the possibility of using and reusing the polymer beads in countless operational cycles [33], deriving by the combination of the characteristics of the sorbent materials with the absorption process exploited in the biological regeneration, is an important feature of this approach.
In addition to the above technical benefits, the advantages of the bio-regeneration in a two-step process have been also confirmed in terms of costs and environmental protection in comparison to solvent extraction regeneration methods of the same sorbent material [7]. A recent techno-environmental and economic assessment of the process employing absorptive polymers in treating textile wastewater, in comparison to conventional treatment methods, demonstrated that this approach reduces the toxic effects of effluents, and consequently, the environmental impact [34]. However, the investment cost of the polymer, even if moderately increased in comparison to cheaper adsorbents, is compensated by the possibility of simultaneous regeneration and reuse, which implies consistent savings in the regeneration step and avoids disposal costs when the sorbent media cannot be regenerated.

4. Conclusions

In this work, we demonstrated the effectiveness of the two-step strategy (i.e., polymer extraction followed by bio-regeneration) for the treatment of dye bath wastewater, by establishing the best operating conditions to achieve the regeneration of a loaded polymer contemporary to dye mineralization. The main outcomes of this study are as follows:
-
Alternated anaerobic–aerobic conditions of the bio-regeneration environment guaranteed excellent performance with regeneration efficiencies of 91–98% and biodegradation efficiencies of the target dye up to 89%.
-
The highest PWR, 9%, ensured outstanding results for all contamination levels, without a remarkable loss in performance, even for the highest ones, with satisfactory biodegradation efficiencies always ≥75%.
-
The fate of aromatic amines in polymer bio-regeneration was investigated by using an integrated approach combining direct UV-vis spectral analysis with COD measurements and SOUR calculations. Results confirmed the successful biodegradation of the reactive dye without significant accumulation of by-products.
-
Promising results of this study suggest that the status of the proposed technology is ready for upscaling at the pilot scale.

Supplementary Materials

The following supporting information can be downloaded at the link: https://www.mdpi.com/article/10.3390/environments11090207/s1: Figure S1, Data of RR concentration in liquid phase detected during kinetic sorption (a) and desorption (b) tests; Table S1, Polymer loading tests (PWR: polymer-to-water ratio; MTR: mass transfer rate); Figure S2, UV-visible spectra during the kinetic test for biomass characterization; Figure S3, RR polymeric (a) and liquid (b) concentrations detected during abiotic and biotic T1, T2, T3 and T4 tests; Figure S4, UV-visible spectra detected at different time intervals during T1 (a), T2 (b), T3 (c) and T4 (d) bio-regeneration tests; Figure S5, SOUR data vs. dye loading applied during bio-regeneration test.

Author Contributions

Conceptualization, D.M.A. and M.C.T.; methodology, D.M.A. and M.C.T.; formal analysis, D.M.A.; investigation, D.M.A. and V.S.; data curation, D.M.A. and V.S.; writing—original draft preparation, D.M.A.; writing—review and editing, M.C.T.; visualization, D.M.A.; supervision, M.C.T. All authors have read and agreed to the published version of the manuscript.

Funding

This research received no external funding.

Data Availability Statement

The original contributions presented in the study are included in the article and Supplementary Material, further inquiries can be directed to the corresponding author.

Conflicts of Interest

The authors declare no conflicts of interest.

References

  1. Al-Tohamy, R.; Ali, S.S.; Li, F.; Okasha, K.M.; Mahmoud, Y.A.-G.; Elsamahy, T.; Jiao, H.; Fu, Y.; Sun, J. A Critical Review on the Treatment of Dye-Containing Wastewater: Ecotoxicological and Health Concerns of Textile Dyes and Possible Remediation Approaches for Environmental Safety. Ecotoxicol. Environ. Saf. 2022, 231, 113160. [Google Scholar] [CrossRef] [PubMed]
  2. Chen, M.; Ding, W.; Wang, J.; Diao, G. Removal of Azo Dyes from Water by Combined Techniques of Adsorption, Desorption, and Electrolysis Based on a Supramolecular Sorbent. Ind. Eng. Chem. Res. 2013, 52, 2403–2411. [Google Scholar] [CrossRef]
  3. Vadivel, V.K.; Cikurel, H.; Mamane, H. Removal of Indigo Dye by CaCO3/Ca(OH)2 Composites and Resource Recovery. Ind. Eng. Chem. Res. 2021, 60, 10312–10318. [Google Scholar] [CrossRef]
  4. Galloni, M.G.; Bortolotto, V.; Falletta, E.; Bianchi, C.L. PH-Driven Selective Adsorption of Multi-Dyes Solutions by Loofah Sponge and Polyaniline-Modified Loofah Sponge. Polymers 2022, 14, 4897. [Google Scholar] [CrossRef]
  5. Salvador, F.; Martin-Sanchez, N.; Sanchez-Hernandez, R.; Sanchez-Montero, M.J.; Izquierdo, C. Regeneration of Carbonaceous Adsorbents. Part II: Chemical, Microbiological and Vacuum Regeneration. Microporous Mesoporous Mater. 2015, 202, 277–296. [Google Scholar] [CrossRef]
  6. Walker, G.M.; Weatherley, L.R. Bacterial Regeneration in Biological Activated Carbon Systems. Process Saf. Environ. Prot. 1998, 76, 177–182. [Google Scholar] [CrossRef]
  7. Mosca Angelucci, D.; Tomei, M.C. Regeneration Strategies of Polymers Employed in Ex-Situ Remediation of Contaminated Soil: Bioregeneration versus Solvent Extraction. J. Environ. Manag. 2015, 159, 169–177. [Google Scholar] [CrossRef]
  8. Mosca Angelucci, D.; Stazi, V.; Tomei, M.C. Sustainable Approach for Removal of Remazol Red Using Absorptive Polymers: Optimization of Process Performance and Sorbent Regeneration. Int. J. Environ. Sci. Technol. 2024, 21, 2383–2394. [Google Scholar] [CrossRef]
  9. Kusic, H.; Koprivanac, N.; Bozic, A.L. Environmental Aspects on the Photodegradation of Reactive Triazine Dyes in Aqueous Media. J. Photochem. Photobiol. A Chem. 2013, 252, 131–144. [Google Scholar] [CrossRef]
  10. Tomei, M.C.; Mosca Angelucci, D.; Daugulis, A.J. Sequential Anaerobic-Aerobic Decolourization of a Real Textile Wastewater in a Two-Phase Partitioning Bioreactor. Sci. Total Environ. 2016, 573, 585–593. [Google Scholar] [CrossRef]
  11. Popli, S.; Patel, U.D. Destruction of Azo Dyes by Anaerobic–Aerobic Sequential Biological Treatment: A Review. Int. J. Environ. Sci. Technol. 2015, 12, 405–420. [Google Scholar] [CrossRef]
  12. Tomei, M.C.; Soria Pascual, J.; Mosca Angelucci, D. Analysing Performance of Real Textile Wastewater Bio-Decolourization under Different Reaction Environments. J. Clean. Prod. 2016, 129, 468–477. [Google Scholar] [CrossRef]
  13. Williams, T.M.; Unz, R.F. The Nutrition of Thiothrix, Type 021n, Beggiatoa and Leucothrix Strains. Water Res. 1989, 23, 15–22. [Google Scholar] [CrossRef]
  14. Mata, A.M.T.; Pinheiro, H.M.; Lourenço, N.D. Effect of Sequencing Batch Cycle Strategy on the Treatment of a Simulated Textile Wastewater with Aerobic Granular Sludge. Biochem. Eng. J. 2015, 104, 106–114. [Google Scholar] [CrossRef]
  15. Aygun, A.; Nas, B.; Sevimli, M.F. Treatment of Reactive Dyebath Wastewater by Electrocoagulation Process: Optimization and Cost-Estimation. Korean J. Chem. Eng. 2019, 36, 1441–1449. [Google Scholar] [CrossRef]
  16. Saleh, M.; Alterkaoui, A.; Ozdemir, N.C.; Arslan, H.; Bilici, Z.; Dizge, N. Adsorption of Phosphate Ions and Reactive Red 180 from Aqueous Solution Using Thermally Activated Lemon Peels Waste. Int. J. Environ. Sci. Technol. 2024, 21, 1683–1696. [Google Scholar] [CrossRef]
  17. Tomei, M.C.; Mosca Angelucci, D.; Daugulis, A.J. Self-Regenerating Tubing Bioreactor for Removal of Toxic Substrates: Operational Strategies in Response to Severe Dynamic Loading Conditions. Sci. Total Environ. 2020, 723, 138019. [Google Scholar] [CrossRef]
  18. Rice, E.W.; Bridgewater, L.; American Public Health Association. Standard Methods for the Examination of Water and Wastewater, 22nd ed.; American Public Health Association: Washington, DC, USA, 2012. [Google Scholar]
  19. Somasiri, W.; Li, X.F.; Ruan, W.Q.; Jian, C. Evaluation of the Efficacy of Upflow Anaerobic Sludge Blanket Reactor in Removal of Colour and Reduction of COD in Real Textile Wastewater. Bioresour. Technol. 2008, 99, 3692–3699. [Google Scholar] [CrossRef]
  20. Işik, M.; Sponza, D.T. Effects of Alkalinity and Co-Substrate on the Performance of an Upflow Anaerobic Sludge Blanket (UASB) Reactor through Decolorization of Congo Red Azo Dye. Bioresour. Technol. 2005, 96, 633–643. [Google Scholar] [CrossRef]
  21. Kapdan, I.K.; Alparslan, S. Application of Anaerobic-Aerobic Sequential Treatment System to Real Textile Wastewater for Color and COD Removal. Enzym. Microb. Technol. 2005, 36, 273–279. [Google Scholar] [CrossRef]
  22. Lotito, A.M.; De Sanctis, M.; Di Iaconi, C.; Bergna, G. Textile Wastewater Treatment: Aerobic Granular Sludge vs Activated Sludge Systems. Water Res. 2014, 54, 337–346. [Google Scholar] [CrossRef] [PubMed]
  23. Firmino, P.I.M.; da Silva, M.E.R.; Cervantes, F.J.; dos Santos, A.B. Colour Removal of Dyes from Synthetic and Real Textile Wastewaters in One- and Two-Stage Anaerobic Systems. Bioresour. Technol. 2010, 101, 7773–7779. [Google Scholar] [CrossRef] [PubMed]
  24. Jonstrup, M.; Kumar, N.; Murto, M.; Mattiasson, B. Sequential Anaerobic-Aerobic Treatment of Azo Dyes: Decolourisation and Amine Degradability. Desalination 2011, 280, 339–346. [Google Scholar] [CrossRef]
  25. Pinheiro, H.M.; Touraud, E.; Thomas, O. Aromatic Amines from Azo Dye Reduction: Status Review with Emphasis on Direct UV Spectrophotometric Detection in Textile Industry Wastewaters. Dye. Pigment. 2004, 61, 121–139. [Google Scholar] [CrossRef]
  26. Jadhav, S.B.; Phugare, S.S.; Patil, P.S.; Jadhav, J.P. Biochemical Degradation Pathway of Textile Dye Remazol Red and Subsequent Toxicological Evaluation by Cytotoxicity, Genotoxicity and Oxidative Stress Studies. Int. Biodeterior. Biodegrad. 2011, 65, 733–743. [Google Scholar] [CrossRef]
  27. Kalyani, D.C.; Telke, A.A.; Dhanve, R.S.; Jadhav, J.P. Ecofriendly Biodegradation and Detoxification of Reactive Red 2 Textile Dye by Newly Isolated Pseudomonas sp. SUK1. J. Hazard. Mater. 2009, 163, 735–742. [Google Scholar] [CrossRef]
  28. Al-Amrani, W.A.; Lim, P.E.; Seng, C.E.; Wan Ngah, W.S. Bioregeneration of Mono-Amine Modified Silica and Granular Activated Carbon Loaded with Acid Orange 7 in Batch System. Bioresour. Technol. 2012, 118, 633–637. [Google Scholar] [CrossRef]
  29. Al-Amrani, W.A.; Lim, P.E.; Seng, C.E.; Wan Ngah, W.S. Operational Factors Affecting the Bioregeneration of Mono-Amine Modified Silica Loaded with Acid Orange 7. Water Res. 2012, 46, 6419–6429. [Google Scholar] [CrossRef]
  30. Al-Amrani, W.A.; Lim, P.E.; Seng, C.E.; Wan Ngah, W.S. Bioregeneration of Azo Dyes-Loaded Mono-Amine Modified Silica in Batch System: Effects of Particle Size and Biomass Acclimation Condition. Chem. Eng. J. 2014, 251, 175–182. [Google Scholar] [CrossRef]
  31. Aguayo-Villarreal, I.A.; Hernández-Montoya, V.; Ramírez-López, E.M.; Bonilla-Petriciolet, A.; Montes-Morán, M.A. Effect of Surface Chemistry of Carbons from Pine Sawdust for the Adsorption of Acid, Basic and Reactive Dyes and Their Bioregeneration Using Pseudomona Putida. Ecol. Eng. 2016, 95, 112–118. [Google Scholar] [CrossRef]
  32. Liu, J.; Li, X.; Luo, J.; Duan, C.; Hu, H.; Qian, G. Enhanced Decolourisation of Methylene Blue by LDH-Bacteria Aggregates with Bioregeneration. Chem. Eng. J. 2014, 242, 187–194. [Google Scholar] [CrossRef]
  33. Prpich, G.P.; Rehmann, L.; Daugulis, A.J. On the Use, and Reuse, of Polymers for the Treatment of Hydrocarbon Contaminated Water Via a Solid-Liquid Partitioning Bioreactor. Biotechnol. Prog. 2008, 24, 839–844. [Google Scholar] [CrossRef] [PubMed]
  34. Estévez, S.; Mosca Angelucci, D.; Moreira, M.T.; Tomei, M.C. Techno-Environmental and Economic Assessment of Color Removal Strategies from Textile Wastewater. Sci. Total Environ. 2024, 913, 169721. [Google Scholar] [CrossRef] [PubMed]
Figure 1. Evolution of biomass acclimation and maintenance in the SBR: removal efficiency of RR (solid line) and specific removal rate (symbols) during the different experimental stages. Dotted vertical lines indicate the times when the polymer regeneration tests have been performed in the TPPB.
Environments 11 00207 g001
Figure 2. Results of the kinetic test: (a) RR and COD concentration time profiles; (b) removal efficiencies in terms of measured RR and COD and evaluated through the spectra analysis after anaerobic and aerobic phases.
Environments 11 00207 g002
Figure 3. Results of the abiotic regeneration tests: (a) RR concentration time profiles in the polymer (Cpol) and (b) liquid phase (Cw); (c) regeneration efficiencies; and (d) MTR detected during tests performed with T1, T2, T3, and T4 polymers.
Environments 11 00207 g003
Figure 4. Results of T1 and T2 bio-regeneration tests: (a) RR concentration time profiles in the polymer (Cpol) and (b) liquid phase (Cw); (c) mass transfer and biodegradation rates; and (d) RE and BE.
Environments 11 00207 g004
Figure 5. Results of T3 and T4 bio-regeneration tests: (a) RR concentration time profiles in the polymer (Cpol) and (b) liquid phase (Cw); (c) mass transfer and biodegradation rates; and (d) RE and BE.
Environments 11 00207 g005
Figure 6. Time profiles of selected wavelengths and SOUR estimated from DO data recorded during (a) T1, (b) T2, (c) T3, and (d) T4 bio-regeneration tests.
Environments 11 00207 g006
Table 1. Operating conditions for the biomass cultivation (biomass concentration data are mean value of the period ± standard deviation, SD).
Experimental StagePeriod
(Days)
X Concentration (gVSS/L)RR Concentration (mg/L)COD Concentration (mg/L)SA/RR 1
I1–142.61 ± 0.105–12139–33550:1
II15–422.64 ± 0.3310–12207–29540:1
III43–1342.79 ± 0.6310–12141–18520:1
1 In terms of COD.
Table 2. Bio-regeneration experiments: operating conditions of different tests.
TestDayX Concentration (gVSS/L)Amount of Polymer
(g)
PWR (v/v %)RR Polymer
Concentration
(mg/gpol)
T171–751.404.77120.602
T299–1031.6520.61390.671
T385–891.6020.59192.347
T4106–1101.5520.06594.054
Table 3. Overall results of bio-regeneration tests (RE, regeneration efficiency; BE, biodegradation efficiency; MTR, mass transfer rate; BR, biodegradation rate).
TestVolumetric Initial Loading
(mgRR/Lreactor)
Biomass Initial Loading
(mgRR/gVSS)
RE
(%)
MTR (mgRR/L d)BE
(%)
BR
(mgRR/L d)
BR/MTR
(%)
T114.5510.39.95.220.16383.390.14689.8
T269.0541.8593.020.41278.380.34884.4
T3240.92150.5797.621.51289.211.38291.4
T4405.32261.5090.772.36775.081.95982.8
Table 4. Bio-regeneration experiments: initial (t = 0) and final (end) data of absorbance at 196 and 241 nm and COD data.
TestA(196)t=0A(196)endA(241)t=0A(241)endCODt=0CODend
T10.7490.7540.18180.229717.411.8
T21.25420.84820.08410.4877152.7103.0
T30.09610.47090.06820.2003164.1144.4
T40.1220.04620.03580.387816.8163.0
Table 5. Overview of studies about bio-regeneration of sorbent materials applied to dye removal (AO7, acid orange 7; AY9, acid yellow 9; AR14, acid red 14; AR361, acid red 361; AB74, acid blue 74; BG1, basic green 1; RB4, reactive blue 4; MB, methylene blue).
DyesSorbent MaterialC0
(mg/gpol)
Regeneration Rate
(gsorbent/L d)
Inoculum
Concentration
(mgVSS/gsorbent)
RE (Time)
% (d)
Reference
AO7GAC GAC: 53–192 0.065420GAC: 0–15 (11) [28]
MAMSMAMS: 51–96MAMS: 98–77 (11)
AO7MAMS93–1020.04–0.125140–70039–78 (4–12)[29]
AO7 MAMSAO7: 12–202 a A07: 0.025–0.07 a 420A07: 54–100 a (7–20 b) [30]
AY9 AY9: 12–118 a AY9: 0.014–0.025 a AY9: 100 (20–35 b)
AR14AR14: 9–127 aAR14: 0.03–0.05 aAR14: 100–82 a (11–17 b)
AB74 Carbons from pine sawdustAB74: 110.9 1.43-AB74: 6 (7) [31]
BG1 BG1: 155.1 BG1: 25 (7)
RB4RB4: 48.6RB4: 3 (7)
MBLayered double hydroxide–B. subtilis6–91.44-83% (0.5)[32]
AR361 GAC 505–535-0.175 ± 3.38 × 10⁹ (cells/mL)0 (GAC) [6]
Brimac52% (Brimac)
RRHytrel 82060.7–415.4–15.915.4–16.091–98 (6.5)This study
a values for different particle sizes. b no info on second aerated stage duration.
Disclaimer/Publisher’s Note: The statements, opinions and data contained in all publications are solely those of the individual author(s) and contributor(s) and not of MDPI and/or the editor(s). MDPI and/or the editor(s) disclaim responsibility for any injury to people or property resulting from any ideas, methods, instructions or products referred to in the content.

