
First Attempt to Study Sedimentological Characteristics and Contamination Levels of Bottom Sediments in the Faanu Mudugau Blue Hole (Ari Atoll, Maldives)


Abstract

1. Introduction
Blue Holes and Maldivian Blue Hole
2. Materials and Methods
2.1. Sampling
2.2. Sample Grain Size and Chemical Analysis
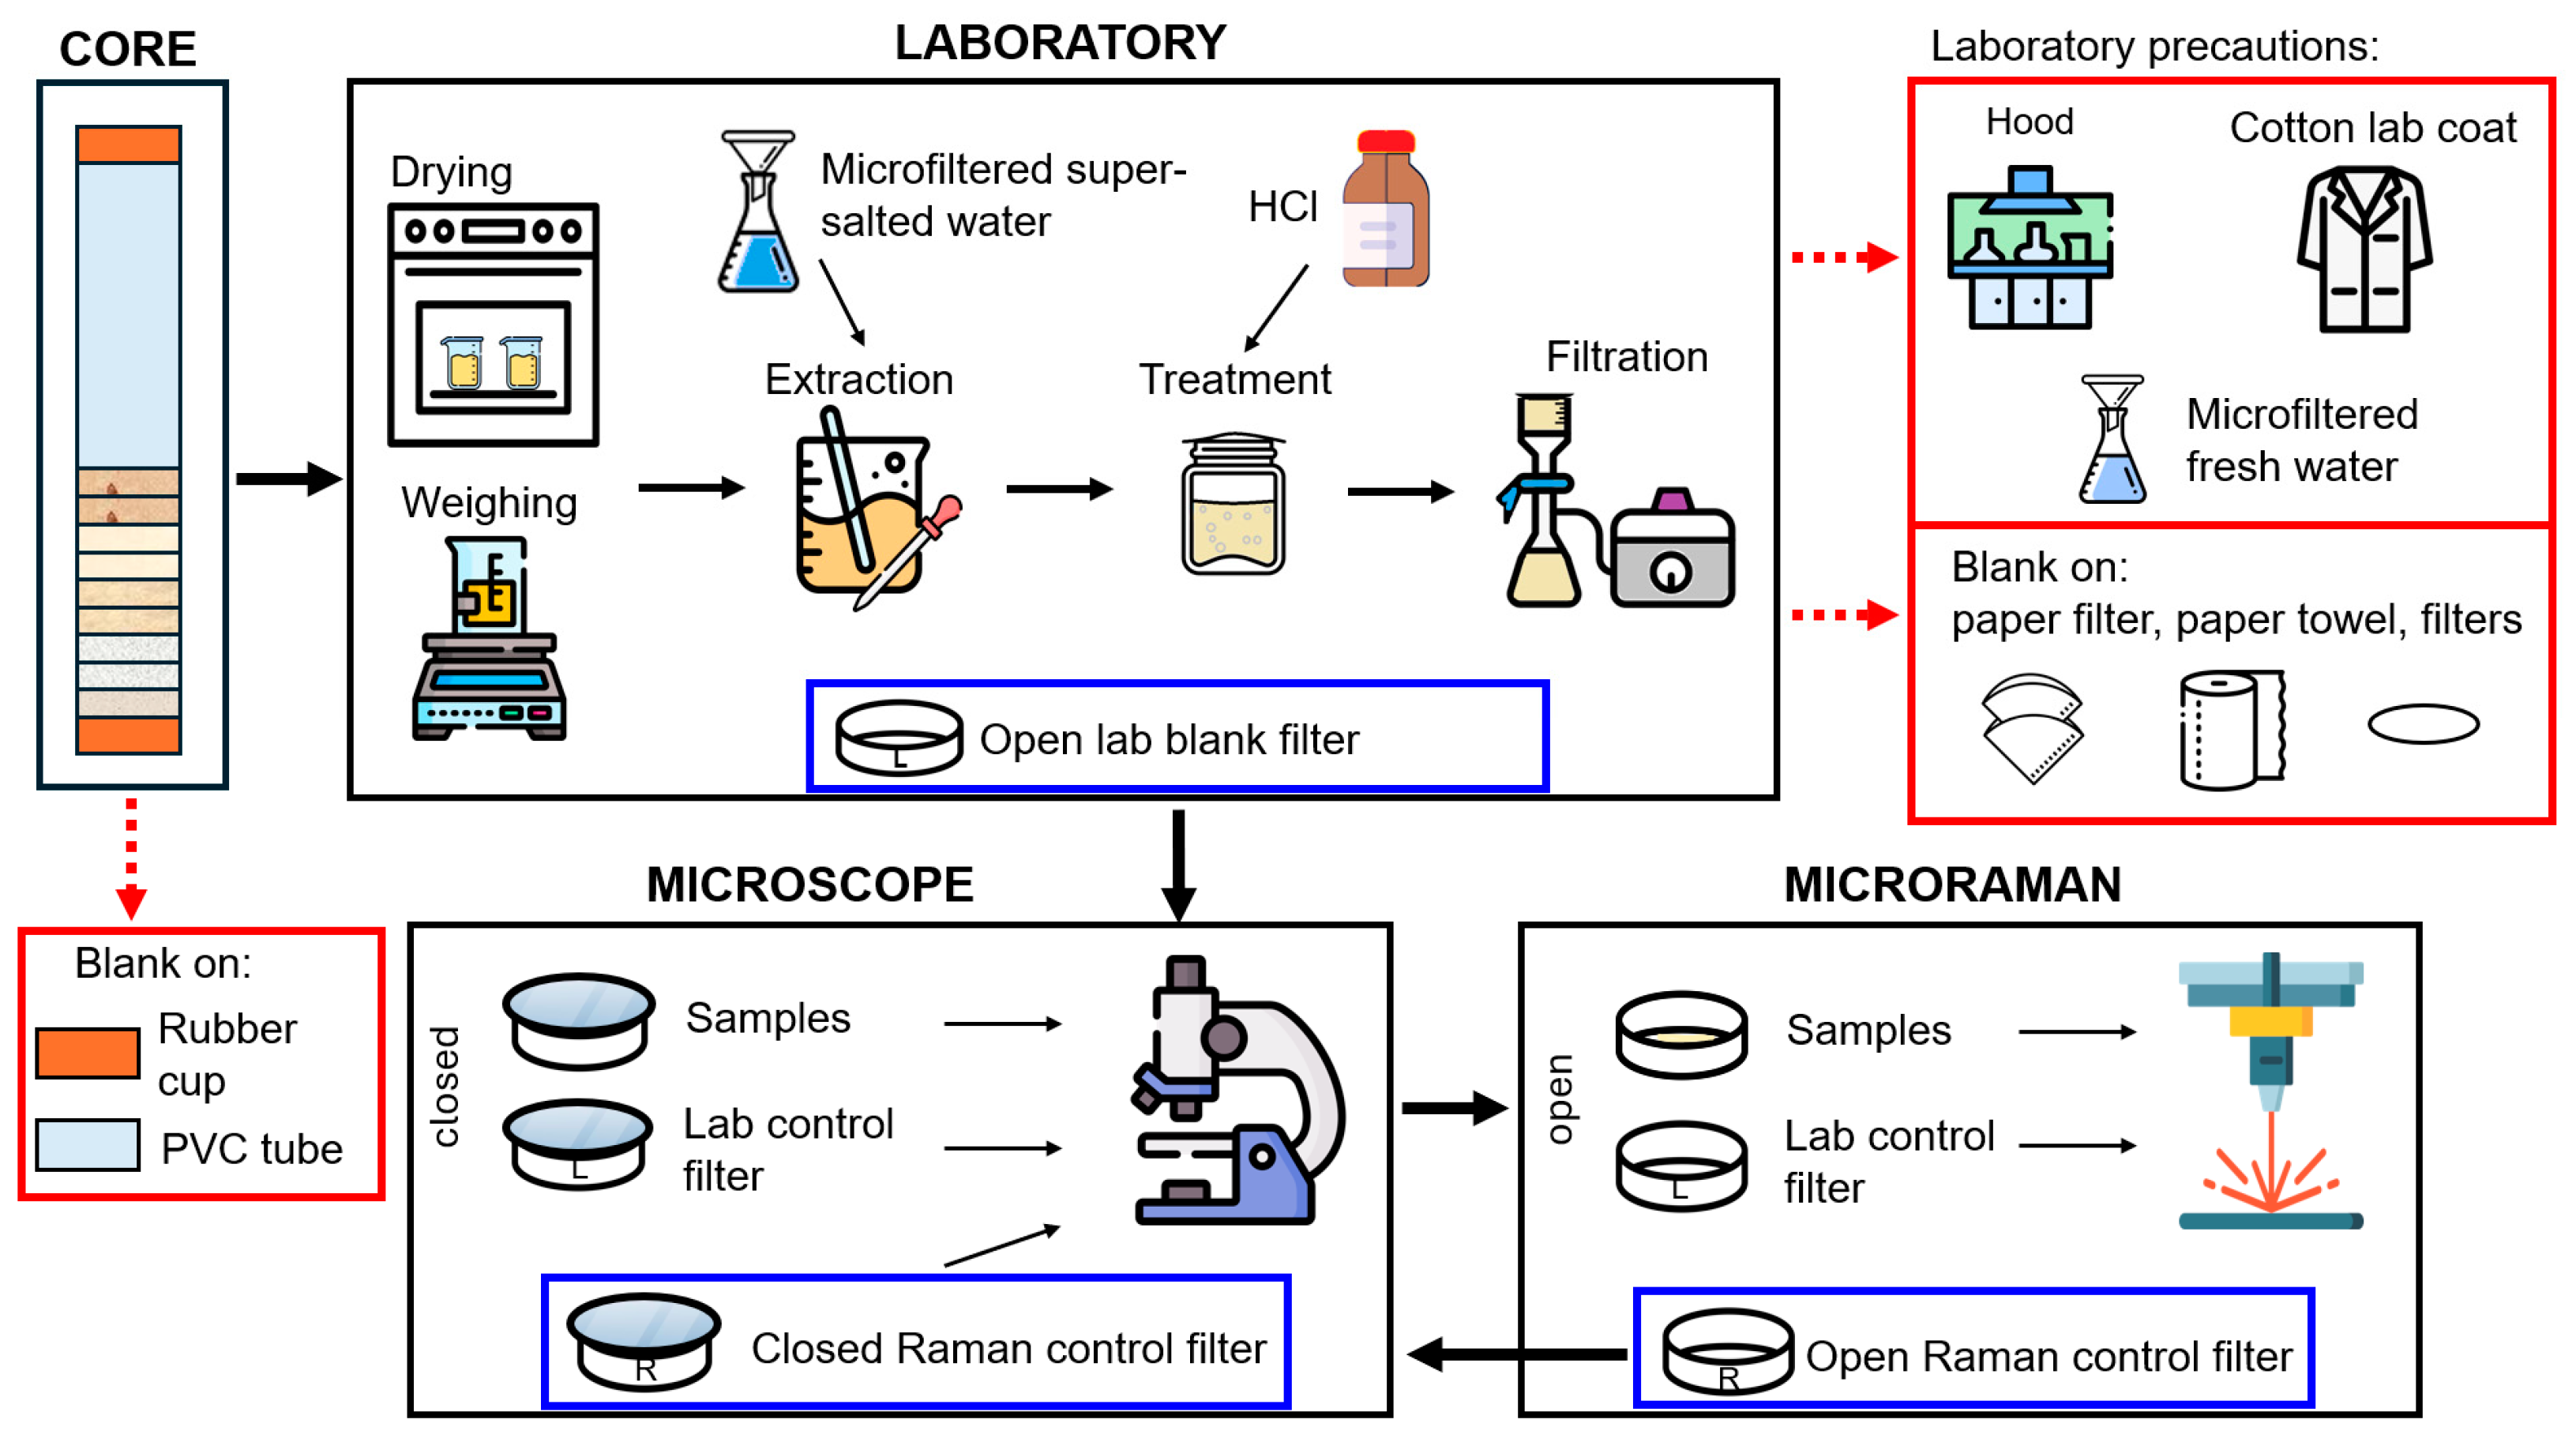
2.3. Sample Treatment, Analysis, and Precautions for Microplastic Research
2.4. Assessment of Ecological Risks
2.4.1. Pollution Load Index (PLI)
2.4.2. Potential Ecological Risk Index (PERI)
2.5. Statistical Analysis
3. Results and Discussion
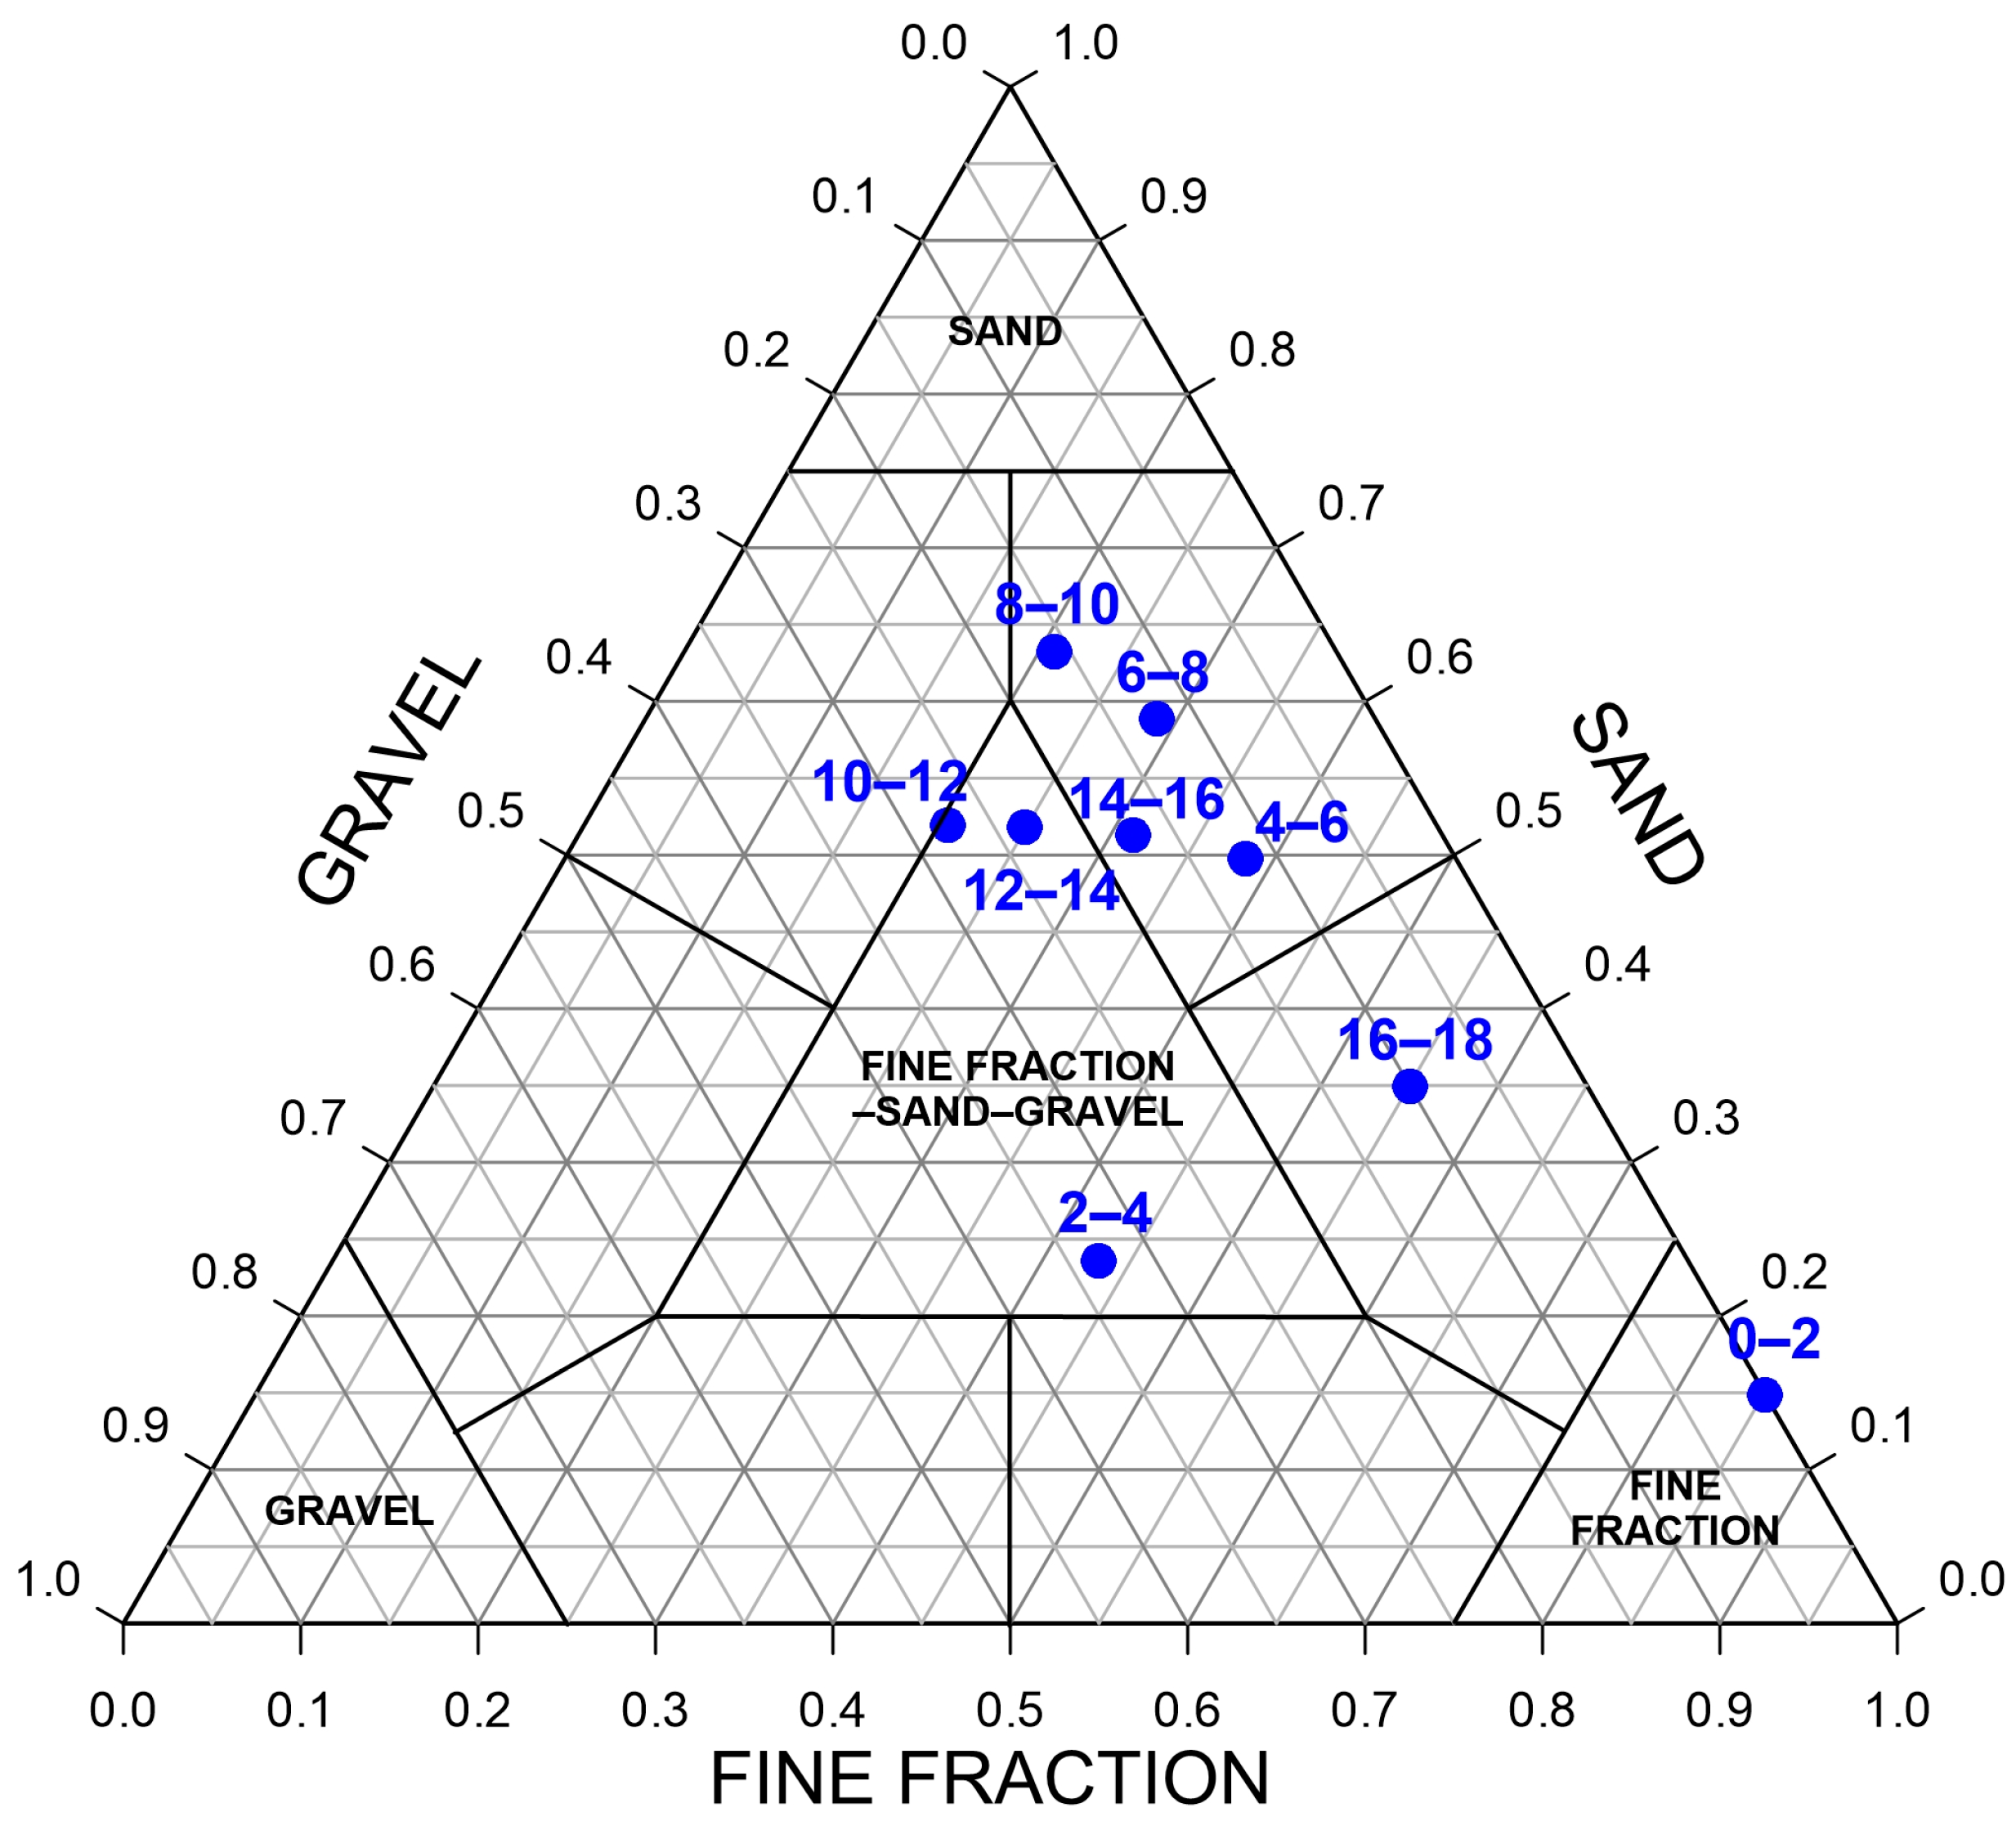
3.1. Grain Size and Organic–Inorganic Content
3.2. Major and Trace Elements
3.3. Pollution and Ecological Risk Assessment
3.4. PCA Results
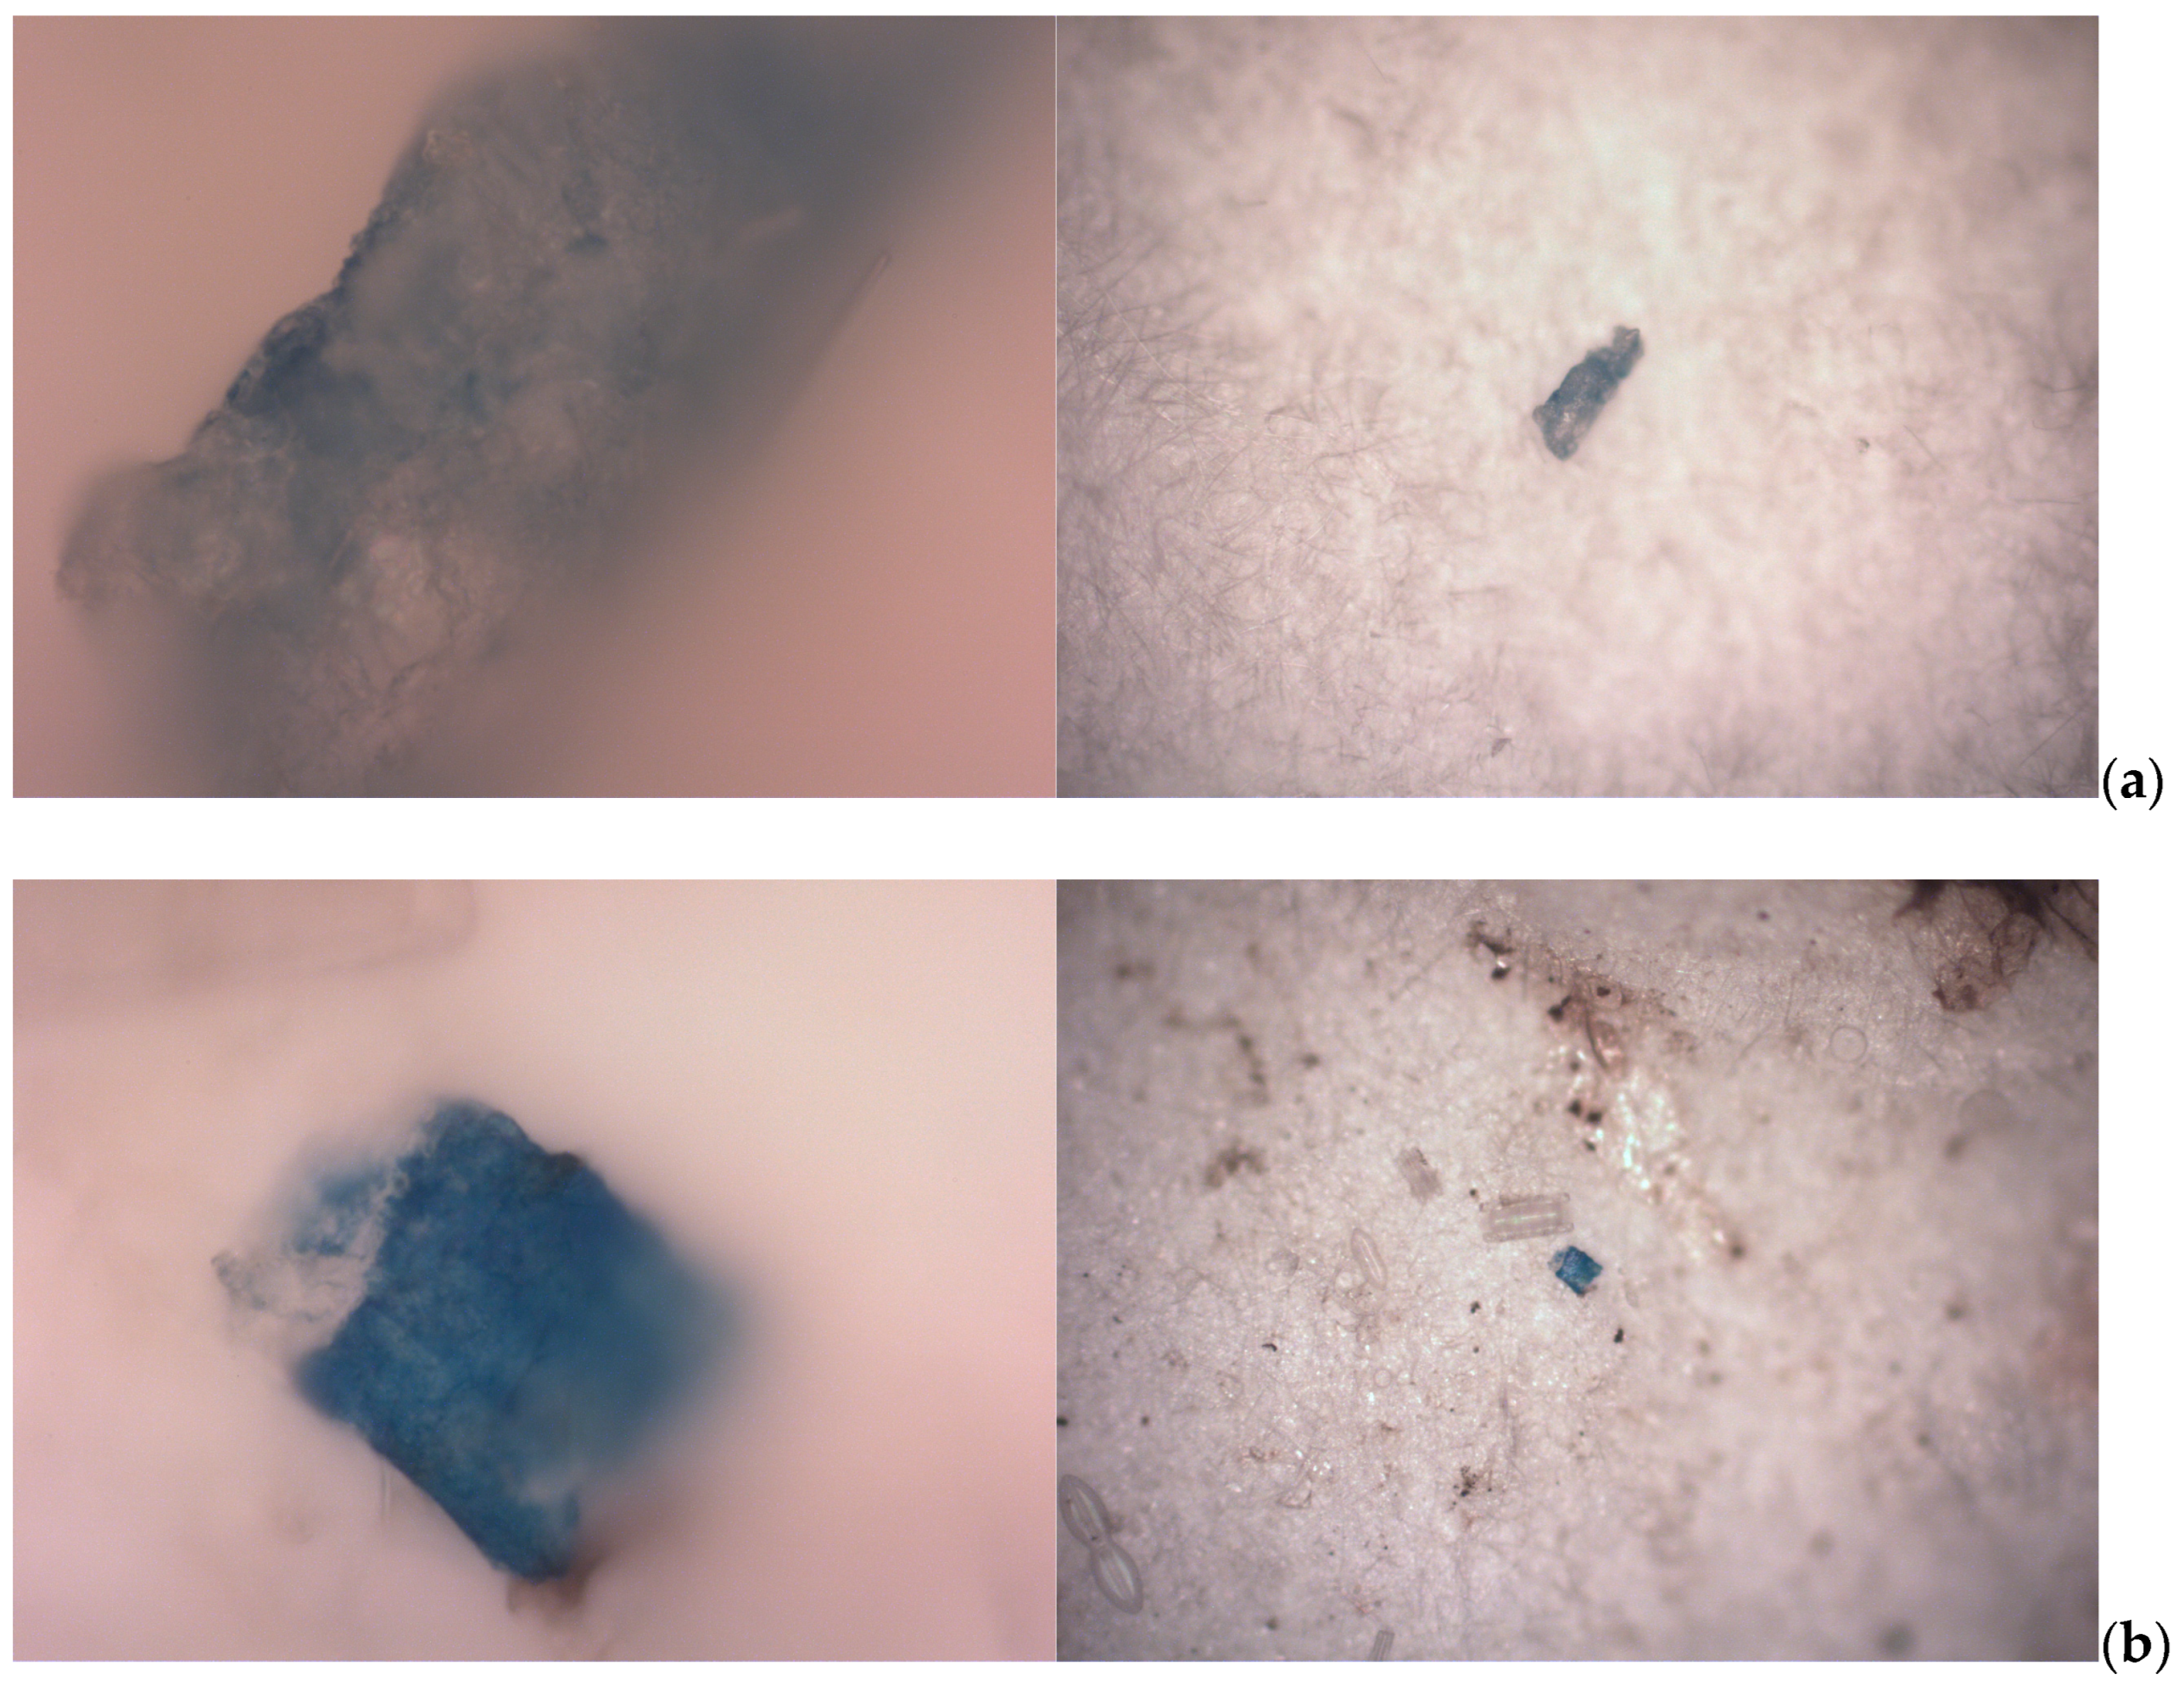
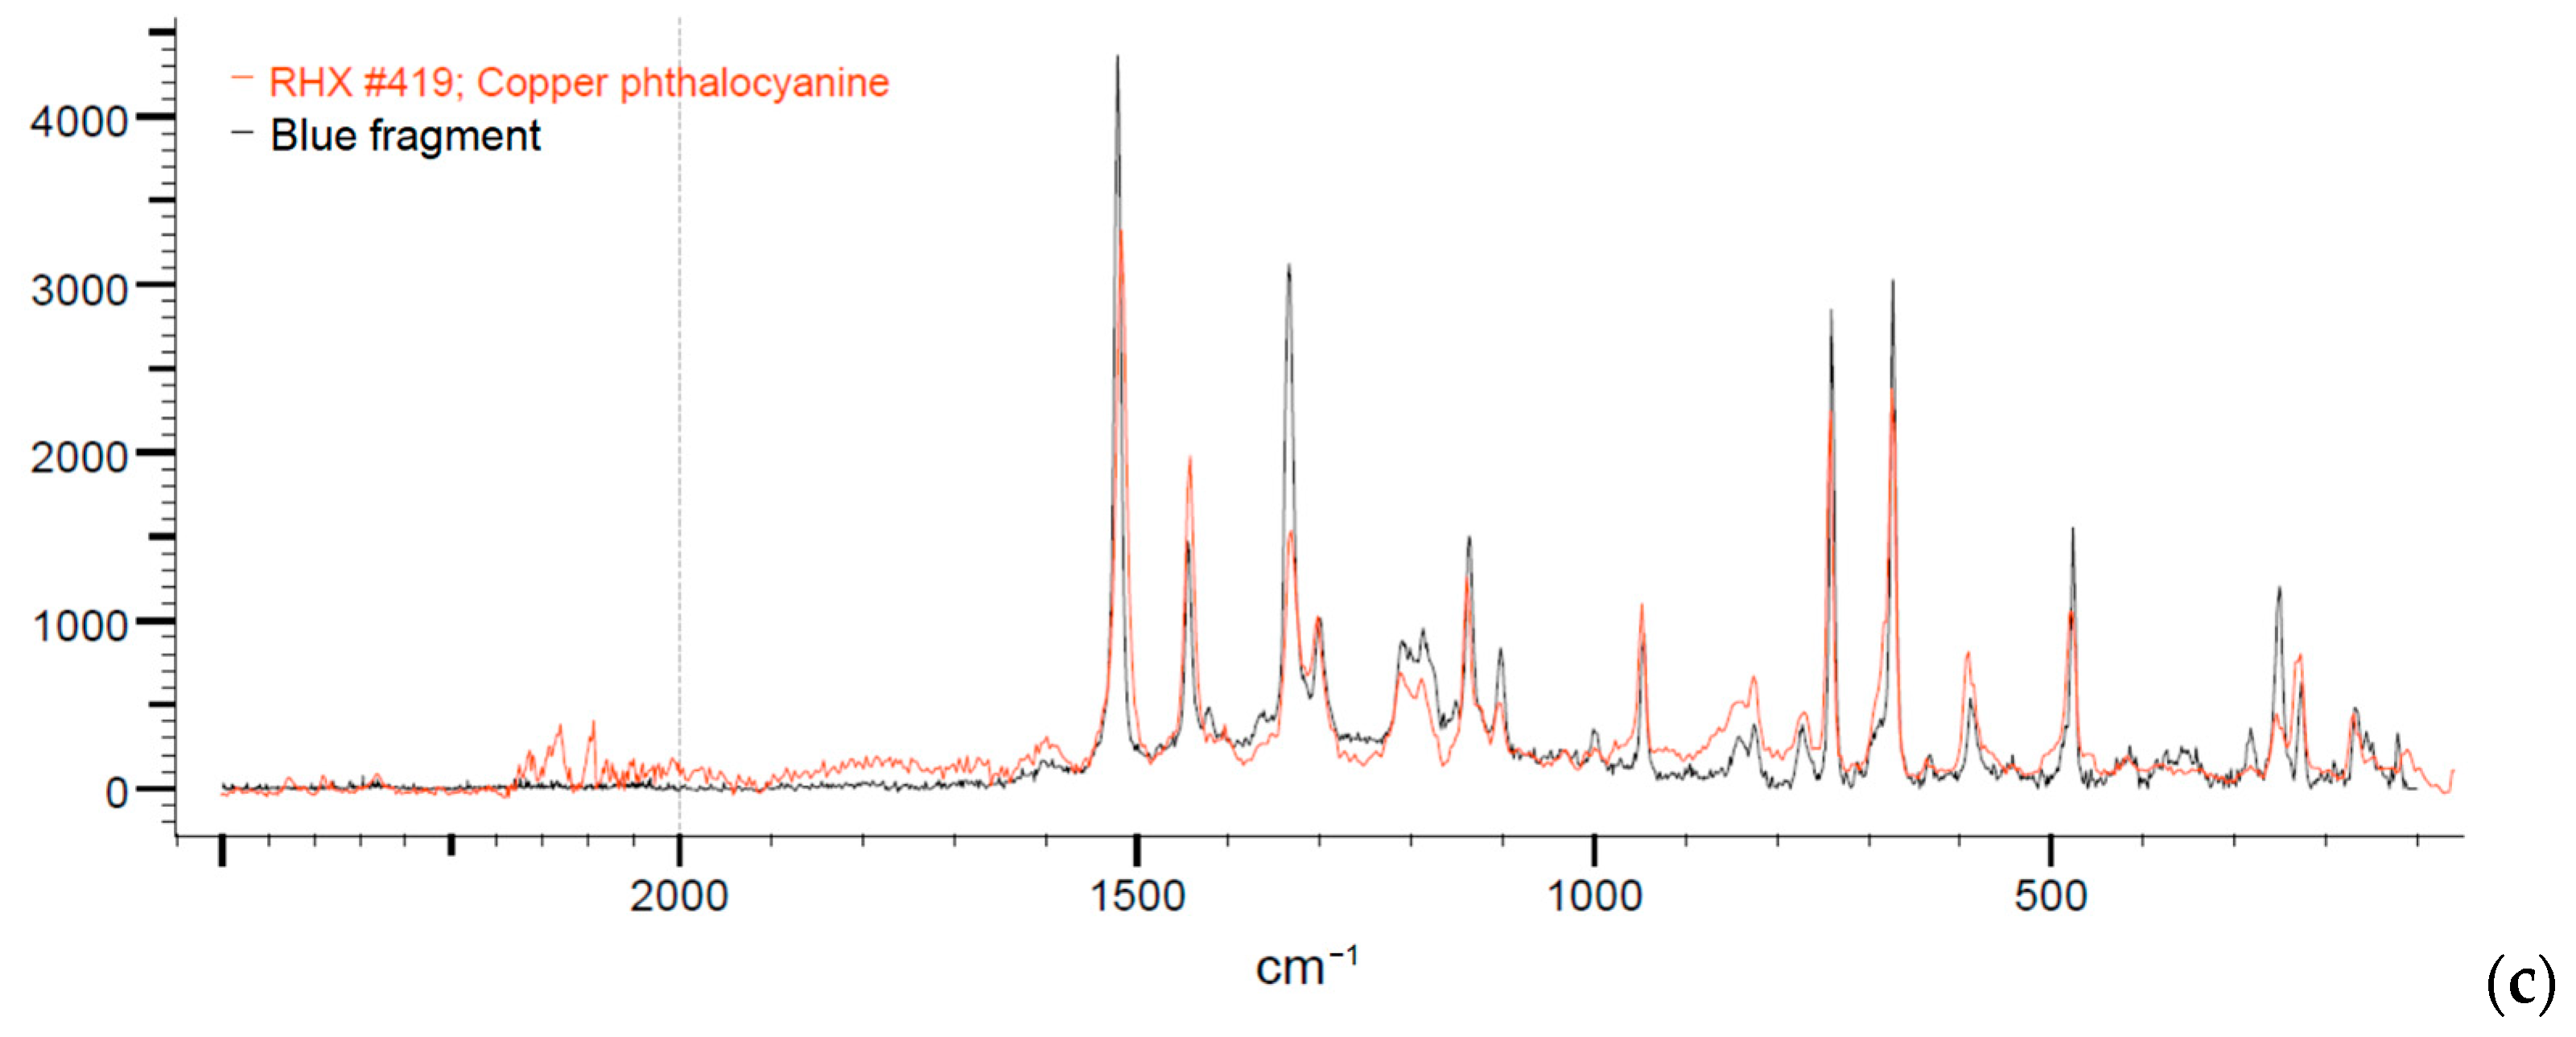
3.5. Items Results
4. Conclusions
Author Contributions
Funding
Data Availability Statement
Acknowledgments
Conflicts of Interest
References
- Ahmed, F.; Fakhruddin, A.N.M. A Review on Environmental Contamination of Petroleum Hydrocarbons and its Biodegradation. Int. J. Environ. Sci. Nat. Res. 2018, 11, 63–69. [Google Scholar]
- Hama Aziz, K.H.; Mustafa, F.S.; Omer, K.M.; Hama, S.; Hamarawf, R.F.; Rahman, K.O. Heavy metal pollution in the aquatic environment: Efficient and low-cost removal approaches to eliminate their toxicity: A review. RSC Adv. 2023, 13, 17595–17610. [Google Scholar] [CrossRef] [PubMed]
- Brühl, C.A.; Engelhard, N.; Bakanov, N.; Wolfram, J.; Hertoge, K.; Zaller, J.G. Widespread contamination of soils and vegetation with current use pesticide residues along altitudinal gradients in a European Alpine valley. Comm. Earth Environ. 2024, 5, 72. [Google Scholar] [CrossRef]
- Corcoran, J.; Winter, M.J.; Tyler, C.R. Pharmaceuticals in the aquatic environment: A critical review of the evidence for health effects in fish. Critical Rev. Toxicol. 2010, 40, 287–304. [Google Scholar] [CrossRef]
- Harvey, P.J.; Taylor, M.P.; Handley, H.K. Widespread Environmental Contamination Hazards in Agricultural Soils from the Use of Lead Joints in Above Ground Large-Scale Water Supply Pipelines. Water Air Soil Pollut. 2015, 226, 178. [Google Scholar] [CrossRef]
- Srivastava, R. Solid Waste Management and Its Impact on the Environment. In Handbook of Research on Environmental and Human Health Impacts of Plastic Pollution; Wani, K.A., Ariana, L., Zuber, S., Eds.; IGI Global: Hershey, PA, USA, 2020; pp. 389–400. [Google Scholar] [CrossRef]
- Nriagu, J.O. A History of Global Metal Pollution. Science 1996, 272, 223–224. [Google Scholar] [CrossRef]
- Khan, S.; Naushad, M.; Govarthanan, M.; Iqbal, J.; Alfadul, S.M. Emerging contaminants of high concern for the environment: Current trends and future research. Environ. Res. 2022, 207, 112609. [Google Scholar] [CrossRef]
- Sauvé, S.; Desrosiers, M. A review of what is an emerging contaminant. Chem. Cent. J. 2014, 8, 15. [Google Scholar] [CrossRef]
- Diop, C.; Dewaelé, D.; Diop, M.; Touré, A.; Cabral, M.; Cazier, F.; Fall, M.; Diouf, A.; Ouddane, B. Assessment of contamination, distribution and chemical speciation of trace metals in water column in the Dakar coast and the Saint Louis estuary from Senegal, West Africa. Mar. Pollut. Bull. 2014, 86, 539–546. [Google Scholar] [CrossRef]
- Manodori, L.; Gambaro, A.; Piazza, R.; Ferrari, S.; Stortini, A.M.; Moret, I.; Capodaglio, G. PCBs and PAHs in sea-surface microlayer and sub-surface water samples of the Venice Lagoon (Italy). Mar. Pollut. Bull. 2006, 52, 184–192. [Google Scholar] [CrossRef]
- Stortini, A.M.; Martellini, T.; Del Bubba, M.; Lepri, L.; Capodaglio, G.; Cincinelli, A. n-Alkanes, PAHs and surfactants in the sea surface microlayer and sea water samples of the Gerlache Inlet Sea (Antarctica). Microchem. J. 2009, 92, 37–43. [Google Scholar] [CrossRef]
- Nawrot, N.; Wojciechowska, E.; Mohsin, M.; Kuittinen, S.; Pappinen, A.; Rezania, S. Trace Metal Contamination of Bottom Sediments: A Review of Assessment Measures and Geochemical Background Determination Methods. Minerals 2021, 11, 872. [Google Scholar] [CrossRef]
- Soloveva, O.; Tikhonova, E.; Alyomov, S.; Mirzoeva, N.; Skuratovskaya, E.; Matishov, G.; Egorov, V. Distribution and Genesis of Aliphatic Hydrocarbons in Bottom Sediments of Coastal Water Areas of the Crimea (the Black and Azov Seas). Water 2024, 16, 2395. [Google Scholar] [CrossRef]
- Al-Shamary, N.; Hassan, H.; Leitão, A.; Hutchinson, S.M.; Mondal, D.; Bayen, S. Baseline distribution of petroleum hydrocarbon contamination in the marine environment around the coastline of Qatar. Mar. Pollut. Bull. 2023, 188, 114655. [Google Scholar] [CrossRef]
- Bosch, A.C.; O’Neill, B.; Sigge, G.O.; Kerwath, S.E.; Hoffman, L.C. Heavy metals in marine fish meat and consumer health: A review. J. Sci. Food Agric. 2016, 96, 32–48. [Google Scholar] [CrossRef]
- Li, Y.; Chen, F.; Zhou, R.; Zheng, X.; Pan, K.; Qiu, G.; Wu, Z.; Chen, S.; Wang, D. A review of metal contamination in seagrasses with an emphasis on metal kinetics and detoxification. J. Hazard. Mat. 2023, 454, 131500. [Google Scholar] [CrossRef] [PubMed]
- Gola, D.; Tyagi, P.K.; Arya, A.; Chauhan, N.; Agarwal, M.; Singh, S.K.; Gola, S. The impact of microplastics on marine environment: A review. Environ. Nanotechnol. Monit. Manag. 2021, 16, 100552. [Google Scholar] [CrossRef]
- Sridharan, S.; Kumar, M.; Singh, L.; Bolan, N.S.; Saha, M. Microplastics as an emerging source of particulate air pollution: A critical review. J. Hazard. Mat. 2021, 418, 126245. [Google Scholar] [CrossRef]
- Ya, H.; Jiang, B.; Xing, Y.; Zhang, T.; Lv, M.; Wang, X. Recent advances on ecological effects of microplastics on soil environment. Sci. Total Environ. 2021, 798, 149338. [Google Scholar] [CrossRef]
- Bagaev, A.; Mizyuk, A.; Khatmullina, L.; Isachenko, I.; Chubarenko, I. Anthropogenic fibres in the Baltic Sea water column: Field data, laboratory and numerical testing of their motion. Sci. Total Environ. 2017, 599–600, 560–571. [Google Scholar] [CrossRef]
- van Sebille, E.; Wilcox, C.; Lebreton, L.; Maximenko, N.; Hardesty, B.D.; van Franeker, J.A.; Eriksen, M.; Siegel, D.; Galgani, F.; Lavender Law, K. A global inventory of small floating plastic debris. Environ. Res. Lett. 2015, 10, 124006. [Google Scholar] [CrossRef]
- Zhao, S.; Zettler, E.R.; Bos, R.P.; Lin, P.; Amaral-Zettler, L.A.; Mincer, T.J. Large quantities of small microplastics permeate the surface ocean to abyssal depths in the South Atlantic Gyre. Glob. Change Biol. 2022, 28, 2991–3006. [Google Scholar] [CrossRef]
- Alomar, C.; Estarellas, F.; Deudero, S. Microplastics in the Mediterranean Sea: Deposition in coastal shallow sediments, spatial variation and preferential grain size. Mar. Environ. Res. 2016, 115, 1–10. [Google Scholar] [CrossRef] [PubMed]
- De Ruijter, V.N.; Milou, A.; Costa, V. Assessment of microplastics distribution and stratification in the shallow marine sediments of Samos Island, Eastern Mediterranean Sea, Greece. Med. Mar. Sci. 2019, 20, 736–744. [Google Scholar] [CrossRef]
- Abel, S.M.; Primpke, S.; Int-Veen, I.; Brandt, A.; Gerts, G. Systematic identification of microplastics in abyssal and hadal sediments of the Kuril Kamchatka trench. Environ. Pollut. 2021, 269, 116095. [Google Scholar] [CrossRef]
- Cutroneo, L.; Capello, M.; Domi, A.; Consani, S.; Lamare, P.; Coyle, P.; Bertin, V.; Dornic, D.; Reboa, A.; Geneselli, I.; et al. Microplastics in the abyss: A first investigation into sediments at 2443-m depth (Toulon, France). Environ. Sci. Pollut. Res. 2022, 29, 9375–9385. [Google Scholar] [CrossRef]
- Van Cauwenberghe, L.; Vanreusel, A.; Mees, J.; Janssen, C.R. Microplastic pollution in deep-sea sediments. Environ. Pollut. 2013, 182, 495–499. [Google Scholar] [CrossRef]
- Pinheiro, L.M.; Ivar do Sul, J.A.; Costa, M.F. Uptake and ingestion are the main pathways for microplastics to enter marine benthos: A review. Food Webs 2020, 24, e00150. [Google Scholar] [CrossRef]
- Sfriso, A.A.; Tomio, Y.; Rosso, B.; Gambaro, A.; Sfriso, A.; Corami, F.; Rastelli, E.; Corinaldesi, C.; Mistri, M.; Munari, C. Microplastic accumulation in benthic invertebrates in Terra Nova Bay (Ross Sea, Antarctica). Environ. Int. 2020, 137, 105587. [Google Scholar] [CrossRef]
- Staffieri, E.; de Lucia, G.A.; Camedda, A.; Poeta, G.; Battisti, C. Pressure and impact of anthropogenic litter on marine and estuarine reptiles: An updated “blacklist” highlighting gaps of evidence. Environ. Sci. Pollut. Res. 2019, 26, 1238–1249. [Google Scholar] [CrossRef]
- Wang, J.; Wang, M.; Ru, S.; Liu, X. High levels of microplastic pollution in the sediments and benthic organisms of the South Yellow Sea, China. Sci. Tot. Environ. 2019, 651, 1661–1669. [Google Scholar] [CrossRef] [PubMed]
- Wootton, N.; Reis-Santos, P.; Gillanders, B.M. Microplastic in fish—A global synthesis. Rev. Fish Biol. Fish. 2021, 31, 753–771. [Google Scholar] [CrossRef]
- Zantis, L.J.; Carroll, E.L.; Nelms, S.L.; Bosker, T. Marine mammals and microplastics: A systematic review and call for standardization. Environ. Pollut. 2021, 269, 116142. [Google Scholar] [CrossRef]
- Chu, W.L.; Dang, N.L.; Kok, Y.Y.; Yap, K.S.I.; Phang, S.M.; Convey, P. Heavy metal pollution in Antarctica and its potential impacts on algae. Polar Sci. 2019, 20, 75–83. [Google Scholar] [CrossRef]
- Darham, S.; Zakaria, N.N.; Zulkharnain, A.; Sabri, S.; Khalil, K.A.; Merican, F.; Gomez-Fuentes, C.; Lim, S.; Ahmad, S.A. Antarctic heavy metal pollution and remediation efforts: State of the art of research and scientific publications. Braz. J. Microbiol. 2023, 54, 2011–2026. [Google Scholar] [CrossRef]
- Muir, D.C.G.; Wagemann, R.; Hargrave, B.T.; Thomas, D.J.; Peakall, D.B.; Norstrom, R.J. Arctic marine ecosystem contamination. Sci. Total Environ. 1992, 122, 75–134. [Google Scholar] [CrossRef] [PubMed]
- Kothari, U.; Arnall, A. Contestation over an island imaginary landscape: The management and maintenance of touristic nature. Environ. Plan. A 2017, 49, 980–998. [Google Scholar] [CrossRef]
- Zubair, S.; Bowen, D.; Elwin, J. Not quite paradise: Inadequacies of environmental impact assessment in the Maldives. Tour. Manag. 2011, 32, 225–234. [Google Scholar] [CrossRef]
- U.S. Department of State. Report: 2024 Investment Climate Statements: Maldives. Available online: https://www.state.gov/reports/2024-investment-climate-statements/maldives/ (accessed on 23 September 2024).
- Ministry of Tourism, Government of Maldives. Maldives Fifth Tourism Master Plan 2023–2027: Goals and Strategies; Ministry of Tourism: Malé, Maldives. Available online: https://www.tourism.gov.mv (accessed on 23 September 2024).
- Scheyvens, R. The challenge of sustainable tourism development in the Maldives: Understanding the social and political dimensions of sustainability. Asia Pac. Viewp. 2011, 52, 148–164. [Google Scholar] [CrossRef]
- Aboobakur, S.; Samarakoon, M.B. Solid waste management in Kulhudhuffushi, Maldives; Most suitable solution for the Crisis. Int. J. Environ. Agric. Biotechnol. 2019, 4, 1853–1861. [Google Scholar] [CrossRef]
- Wang, Y.; Ruiz-Aceved, A.; Rameez, E.; Raghavan, V.; Hussain, A.; Fei, X. Toward sustainable waste management in small islands developing states: Integrated waste-to-energy solutions in Maldives context. Front. Environ. Sci. Eng. 2024, 18, 24. [Google Scholar] [CrossRef]
- Fallati, L.; Castiglioni, S.; Galli, P.; Riva, F.; Gracia-Lor, E.; Gonzalez-Marino, I.; Rousis, N.I.; Shifah, M.; Messa, M.C.; Strepparava, M.G.; et al. Use of legal and illegal substances in Malé (Republic of Maldives) assessed by wastewater analysis. Sci. Tot. Environ. 2020, 698, 134207. [Google Scholar]
- Scott, P.J.B.; Davies, M. Retroactive determination of industrial contaminants in tropical marine communities. Mar. Pollut. Bull. 1997, 34, 975–980. [Google Scholar] [CrossRef]
- Colombo, A.; Bettinetti, R.; Strona, G.; Cambria, F.; Fanelli, R.; Zubair, Z.; Galli, P. Maldives: An archipelago that burns. A first survey of PCDD/Fs and DL-PCBs from human activities. Sci. Tot. Environ. 2014, 497–498, 499–507. [Google Scholar] [CrossRef]
- Rizzi, C.; Seveso, D.; Galli, P.; Villa, S. First record of emerging contaminants in sponges of an inhabited island in the Maldives. Mar. Pollut. Bull. 2020, 156, 111273. [Google Scholar] [CrossRef] [PubMed]
- Nadhiya, A.; Khandaker, M.U.; Mahmud, S.; Abdullah, W.H. The presence of toxic heavy metals in tuna fishes from Laccadive Sea and concomitant health risk. Radiat. Prot. Dosim. 2023, 199, 2224–2228. [Google Scholar] [CrossRef]
- Jumana, M.; Shaira, A. Baseline study to determine the presence of heavy metals in seawater of Thilafushi Island. AIP Conf. Proc. 2024, 3245, 060002. [Google Scholar] [CrossRef]
- Imhof, H.K.; Sigl, R.; Brauer, E.; Feyl, S.; Giesemann, P.; Klink, S.; Leupolz, K.; Löder, M.G.; Löschel, L.A.; Missun, J.; et al. Spatial and temporal variation of macro-, meso- and microplastic abundance on a remote coral island of the Maldives, Indian Ocean. Mar. Pollut. Bull. 2017, 116, 340–347. [Google Scholar]
- Patti, T.B.; Fobert, E.K.; Reeves, S.E.; Burke da Silva, K. Spatial distribution of microplastics around an inhabited coral island in the Maldives, Indian Ocean. Sci. Tot. Environ. 2020, 748, 141263. [Google Scholar]
- Saliu, F.; Montano, S.; Garavaglia, M.G.; Lasagni, M.; Seveso, D.; Galli, P. Microplastic and charred microplastic in the Faafu Atoll, Maldives. Mar. Pollut. Bull. 2018, 136, 464–471. [Google Scholar] [CrossRef]
- Raguso, C.; Saliu, F.; Lasagni, M.; Galli, P.; Clemenza, M.; Montano, S. First detection of microplastics in reef-building corals from a Maldivian atoll. Mar. Pollut. Bull. 2022, 180, 113773. [Google Scholar] [CrossRef] [PubMed]
- Cutroneo, L.; Ahmed, H.; Azzola, A.; Fontana, H.; Geneselli, I.; Mancini, I.; Montefalcone, M.; Oprandi, A.; Pancrazi, I.; Vanin, S.; et al. First Chemical–Physical Measurements by Multi-Parameter Probe in the Blue Hole of Faanu Madugau (Ari Atoll, the Maldives). Environments 2023, 10, 180. [Google Scholar] [CrossRef]
- Chen, B.; Yu, K.; Fu, L.; Wel, Y.; Liang, J.; Liao, Z.; Qin, Z.; Yu, X.; Deng, C.; Han, M.; et al. The diversity, community dynamics, and interactions of the microbiome in the world’s deepest blue hole: Insights into extreme environmental response patterns and tolerance of marine microorganisms. Microbiol. Spectr. 2023, 11, e00531-23. [Google Scholar] [CrossRef] [PubMed]
- Li, Q.; Lei, Y.; Morard, R.; Li, T.; Wang, B. Diversity hotspot and unique community structure of foraminifera in the world’s deepest marine blue hole—Sansha Yongle Blue Hole. Sci. Rep. 2020, 10, 10257. [Google Scholar] [CrossRef] [PubMed]
- Zhou, S.; Liu, J.; Yao, P.; Fu, L.; Yang, Z.; Zhang, Y.; Du, R.; Jia, C.; Chen, L.; Liang, J.; et al. Unique bacterial communities and lifestyles in deep ocean blue holes: Insights from the Yongle Blue Hole (South China Sea). Front. Mar. Sci. 2023, 10, 1086117. [Google Scholar] [CrossRef]
- Wallace, E.; Donnelly, J.; van Hengstum, P.; Winkler, T.; Dizon, C.; LaBella, A.; Lopez, I.; d’Entremont, N.; Sullivan, R.; Woodruff, J.; et al. Regional shifts in paleohurricane activity over the last 1500 years derived from blue hole sediments offshore of Middle Caicos Island. Quat. Sci. Rev. 2021, 268, 107126. [Google Scholar] [CrossRef]
- Schmitt, D.; Gischler, E.; Walkenfort, D. Holocene sediments of an inundated sinkhole: Facies analysis of the “Great Blue Hole”, Lighthouse Reef, Belize. Facies 2021, 67, 10. [Google Scholar] [CrossRef]
- Yu, X.; Duan, B.C.; Guo, K.; Li, T.; Feng, A.; Du, J.; Villemant, B.; Ning, Y.; Liu, Y. Mapping and U–Th dating of the world’s deepest blue hole (South China Sea): Implications for its timing, possible volcanogenic origin, and Pleistocene eolianites in the Xisha Islands. Mar. Geol. 2022, 447, 106776. [Google Scholar] [CrossRef]
- Colantoni, P.; Baldelli, G.; Bianchi, C.N.; Capaccioni, B.; Morri, C.; Sandrini, M.; Tassi, F. A cave flooded by marine water with hydrogen sulphide highlights the recent evolution of the Maldives (Indianc Ocean): Preliminary notes. Grotte D’Italia 2003, 4, 29–37. [Google Scholar]
- El-Haddad, K.; Fouad, M.; El-Sadeq, A.; El-Azim, I.A. Rapid Ecological Assessment of Coral Biodiversity and Reef Health in the Blue Hole Area, Dahab. In Egypt’s Protected Areas Self-Financing Project; EPASP: Cairo, Egypt, 2018; Volume 71. [Google Scholar] [CrossRef]
- Gischler, E.; Anselmetti, F.S.; Shinn, E.A. Seismic stratigraphy of the Blue Hole (Lighthouse Reef, Belize), a late Holocene climate and storm archive. Mar. Geol. 2013, 344, 155–162. [Google Scholar] [CrossRef]
- Schmitt, D.; Gischler, E.; Birgel, D.; Peckmann, J.; Anselmetti, F.S.; Vogel, H. Great Blue Hole (Lighthouse Reef, Belize): A continuous, annually resolved record of Common Era Sea surface temperature, Atlantic Multidecadal Oscillation and cyclone-controlled run-off. Quat. Sci. Rev. 2020, 247, 106570. [Google Scholar] [CrossRef]
- Zaini, N.; Briguglio, A.; Goeting, S.; Roslin, A.; Kocsis, L. Sedimentological characterisation of sea bottom samples collected offshore Muara and Tutong, Brunei Darussalam. Bull. Geol. Soc. Malays. 2020, 70, 139–151. [Google Scholar] [CrossRef]
- Mogg, A.O.M.; Attard, K.M.; Stahl, H.; Brand, T.; Turnewitch, R.; Sayer, M.D.J. The influence of coring method on the preservation of sedimentary and biogeochemical features when sampling soft-bottom, shallow coastal environments. Limnol. Oceanogr. Methods 2017, 15, 905–915. [Google Scholar]
- Rodríguez-Uribe, M.C.; Núñez-Cornú, F.J.; Chávez-Dagostino, R.M.; Trejo-Gómez, E. Granulometric Analysis of Shallow Vents Sediments at Banderas Bay (Mexico). J. Mar. Sci. Eng. 2020, 8, 342. [Google Scholar] [CrossRef]
- Giraldo-Gómez, V.M.; Arena, L.; Capello, M.; Cutroneo, L.; Azzola, A.; Montefalcone, M.; Briguglio, A. Foraminifera and sediments cored from the bottom of the Faanu Mudugau Blue Hole, Ari Atoll, Maldives: Diversity, taphonomy and environmental reconstruction of an inhabitable substrate. Mar. Geol. 2024, 478, 107428. [Google Scholar]
- Cutroneo, L.; Carbone, C.; Consani, S.; Vagge, G.; Canepa, G.; Capello, M. Environmental complexity of a port: Evidence from circulation of the water masses, and composition and contamination of bottom sediments. Mar. Pollut. Bull. 2017, 119, 184–194. [Google Scholar] [CrossRef] [PubMed]
- Cutroneo, L.; Carbone, C.; Consani, S.; Capello, M. Sediment distribution on the continental shelf in relation to stream inputs and contamination: Hydrodynamic, chemical, mineralogical, and sedimentological characteristics (Ligurian Sea, Italy). Environ. Sci. Pollut. Res. 2020, 27, 43755–43768. [Google Scholar] [CrossRef]
- Capello, M.; Cutroneo, L.; Consani, S.; Dinelli, E.; Vagge, G.; Carbone, C. Marine sediment contamination and dynamics at the mouth of a contaminated torrent: The case of the Gromolo Torrent (Sestri Levante, north-western Italy). Mar. Pollut. Bull. 2016, 109, 128–141. [Google Scholar] [CrossRef]
- Cutroneo, L.; Reboa, A.; Geneselli, I.; Capello, M. Considerations on salts used for density separation in the extraction of microplastics from sediments. Mar. Pollut. Bull. 2021, 166, 112216. [Google Scholar] [CrossRef]
- Pfeiffer, F.; Fischer, E.K. Various Digestion Protocols Within Microplastic Sample Processing—Evaluating the Resistance of Different Synthetic Polymers and the Efficiency of Biogenic Organic Matter Destruction. Front. Environ. Sci. 2020, 8, 572424. [Google Scholar] [CrossRef]
- Reboa, A.; Cutroneo, L.; Consani, S.; Geneselli, I.; Petrillo, M.; Besio, G.; Capello, M. Mugilidae fish as bioindicator for monitoring plastic pollution: Comparison between a commercial port and a fishpond (north-western Mediterranean Sea). Mar. Pollut. Bull. 2022, 177, 113531. [Google Scholar] [CrossRef] [PubMed]
- Xu, J.L.; Thomas, K.V.; Luo, Z.; Gowen, A.A. FTIR and Raman imaging for microplastics analysis: State of the art, challenges and prospects. TrAC Trends Anal. Chem. 2019, 119, 115629. [Google Scholar] [CrossRef]
- Adikaram, M.; Pitawala, A.; Ishiga, H.; Jayawardana, D.; Eichler, C.M. An Ecological Risk Assessment of Sediments in a Developing Environment—Batticaloa Lagoon, Sri Lanka. J. Mar. Sci. Eng. 2021, 9, 73. [Google Scholar] [CrossRef]
- Liu, D.; Wang, J.; Yu, H.; Gao, H.; Xu, W. Evaluating ecological risks and tracking potential factors influencing heavy metals in sediments in an urban river. Environ. Sci. Eur. 2021, 33, 42. [Google Scholar] [CrossRef]
- Oksanen, J.; Blanchet, F.G.; Friendly, M.; Kindt, R.; Legendre, P.; McGlinn, D.; Minchin, P.R.; O’hara, R.B.; Simpson, G.L.; Solymos, P.; et al. Vegan: Community Ecology Package. R Package Version 2.5-4. 2019. Available online: https://CRAN.R-project.org/package=vegan (accessed on 28 February 2025).
- Shepard, F.P. Nomenclature based on sand-silt-clay ratios. J. Sediment. Petrol. 1954, 24, 151–158. [Google Scholar]
- Gischler, E. Sedimentation on Rasdhoo and Ari Atolls, Maldives, Indian Ocean. Facies 2006, 52, 341–360. [Google Scholar]
- Morgan, K.M.; Kench, P.S. A detrital sediment budget of a Maldivian reef platform. Geomorphology 2014, 222, 122–131. [Google Scholar] [CrossRef]
- Rasheed, S.; Warder, S.C.; Plancherel, Y.; Piggott, M.D. Response of tidal flow regime and sediment transport in North Malé Atoll, Maldives, to coastal modification and sea level rise. Ocean Sci. 2021, 17, 319–334. [Google Scholar] [CrossRef]
- Wadey, M.; Brown, S.; Nicholls, R.J.; Haigh, I. Coastal flooding in the Maldives: An assessment of historic events and their implications. Nat. Hazards 2017, 89, 131–159. [Google Scholar]
- Gischler, E.; Shinn, E.A.; Oschmann, W.; Fiebig, J.; Buster, N.A. A 1500-year Holocene Caribbean climate archive from the Blue Hole, Lighthouse Reef, Belize. J. Coast. Res. 2008, 24, 1495–1505. [Google Scholar]
- Lüdmann, T.; Betzler, C.; Lindhorst, S. The Maldives, a key location of carbonate drifts. Mar. Geol. 2022, 450, 106838. [Google Scholar]
- Kench, P.S.; Brander, R.W.; Parnell, K.E.; McLean, R.F. Wave energy gradients across a Maldivian atoll: Implications for island geomorphology. Geomorphology 2006, 81, 1–17. [Google Scholar] [CrossRef]
- Secrieru, D.; Oaie, G. The relation between the grain size composition of the sediments from the NW Black Sea and their toral organic carbon (TOC) content. Geo-Eco-Mar. 2009, 15, 5–11. [Google Scholar]
- Chester, R.; Jickells, T. Marine Geochemistry, 3rd ed.; Wiley-Blackwell A John Wiley & Sons, Ltd.: Hoboken, NJ, USA, 2012; pp. 11–30. [Google Scholar]
- Prince, K.; Laya, J.C.; Budd, D.; Manche, C.J.; Jacquemyn, C. Dolomite occurrence within drift deposits, Maldives archipelago. Sediment. Geol. 2024, 470, 106711. [Google Scholar]
- Alonso-Garcia, M.; Reolid, J.; Jimenez-Espejo, F.J.; Bialik, O.M.; Zarikina, C.A.A.; Laya, J.C.; Carrasquiera, I.; Reijmer, J.J.G.; Eberli, G.P.; Betzler, C. Sea-level and monsoonal control on the Maldives carbonate platform (Indian Ocean) over the last 1.3 million years. Clim. Past 2024, 20, 547–571. [Google Scholar] [CrossRef]
- Ausili, A.; Berducci, M.T.; Maggi, C.; Sesta, G. Analisi di Sostanze Prioritarie in Matrici Marine. Parte, I. Verifica delle Metodologie Ufficiali Esistenti e loro Applicabilità alle Matrici Marine; ISPRA—Manuali e Linee Guida 175/2018; ISPRA: Rome, Italy, 2018; p. 45. Available online: https://www.isprambiente.gov.it/files2018/pubblicazioni/manuali-linee-guida/MLG_175_18.pdf (accessed on 10 February 2025).
- Canadian Council of Ministers of the Environment. Canadian Sediment Quality Guidelines for the Protection of Aquatic Life: Mercury. In Canadian Environmental Quality Guidelines; Canadian Council of Ministers of the Environment: Winnipeg, MB, Canada, 1999; Available online: https://www.ccme.ca/en/res/mercury-canadian-sediment-quality-guidelines-for-the-protection-of-aquatic-life-en.pdf (accessed on 2 December 2024).
- Republic of Maldives. Minimata Initial Assessment Report 2019. Available online: https://www.environment.gov.mv/v2/wp-content/files/publications/20200315-pub-minamata-initial-assessment-report-2019.pdf (accessed on 2 December 2024).
- Sharifuzzaman, S.M.; Rahman, H.; Ashekuzzaman, S.M.; Islam, M.M.; Chowdhury, S.R.; Hossain, M.S. Heavy Metals Accumulation in Coastal Sediments. In Environmental Remediation Technologies for Metal-Contaminated Soils; Hasegawa, H., Rahman, I., Rahman, M., Eds.; Springer: Tokyo, Japan, 2016. [Google Scholar] [CrossRef]
- Sidhu, G.P.S.; Bali, A.S. Chapter 11—Cd in the environment: Uptake, toxicity and management. In Appraisal of Metal(loids) in the Ecosystem; Kumar, V., Sharma, A., Setia, R., Eds.; Elsevier: Amsterdam, The Netherlands, 2022; pp. 283–300. [Google Scholar] [CrossRef]
- Mikhailenko, A.V.; Ruban, D.A.; Ermolaev, V.A.; van Loon, A.J. Cadmium Pollution in the Tourism Environment: A Literature Review. Geosciences 2020, 10, 242. [Google Scholar] [CrossRef]
- El-Sorogy, A.S.; Youssef, M.; Al-Kahtany, K.; Al-Otaiby, N. Assessment of arsenic in coastal sediments, seawaters and molluscs in the Tarut Island, Arabian Gulf, Saudi Arabia. J. Afr. Earth Sci. 2016, 113, 65–72. [Google Scholar] [CrossRef]
- Steibl, S.; Franke, J.; Laforsch, C. Tourism and urban development as drivers for invertebrate diversity loss on tropical islands. R. Soc. Open Sci. 2021, 8, 210411. [Google Scholar] [CrossRef]
- Dong, M.; Zhang, Q.; Xing, X.; Chen, W.; She, Z.; Luo, Z. Raman spectra and surface changes of microplastics weathered under natural environments. Sci. Tot. Environ. 2020, 739, 139990. [Google Scholar]
- Liu, Y.; Hu, J.; Lin, L.; Yang, B.; Huang, M.; Chang, M.; Huang, X.; Dai, Z.; Sun, S.; Ren, L.; et al. Overcoming the fluorescent interference during Raman spectroscopy detection of microplastics. Sci. Tot. Environ. 2023, 897, 165333. [Google Scholar]
- Dabrowska, A. Raman Spectroscopy of Marine Microplastics—A short comprehensive compendium for the environmental scientists. Mar. Environ. Res. 2021, 168, 105313. [Google Scholar] [CrossRef] [PubMed]
- Song, Y.K.; Hong, S.H.; Eo, S.; Shim, W.J. A comparison of spectroscopic analysis methods for microplastics: Manual, semi-automated, and automated Fourier transform infrared and Raman techniques. Mar. Pollut. Bull. 2021, 173, 113101. [Google Scholar] [CrossRef]
- Cabernard, L.; Roscher, L.; Lorenz, C.; Gerdts, G.; Primpke, S. Comparison of Raman and Fourier Transform Infrared Spectroscopy for the Quantification of Microplastics in the Aquatic Environment. Environ. Sci. Technol. 2018, 52, 13279–13288. [Google Scholar] [CrossRef] [PubMed]
- Albarano, L.; Maggio, C.; La Marca, A.; Iovine, R.; Lofrano, G.; Guida, M.; Vaiano, V.; Carotenuto, M.; Pedatella, S.; Spica, V.R.; et al. Risk assessment of natural and synthetic fibers in aquatic environment: A critical review. Sci. Tot. Environ. 2024, 934, 173398. [Google Scholar] [CrossRef] [PubMed]
- Li, Y.; Zhang, H.; Tang, C. A review of possible pathways of marine microplastics transport in the ocean. Anthr. Coasts 2020, 3, 6–13. [Google Scholar] [CrossRef]
- Tatsii, D.; Bucci, S.; Bhowmick, T.; Guettler, J.; Bakels, L.; Bagheri, G.; Stohl, A. Shape Matters: Long-Range Transport of Microplastic Fibers in the Atmosphere. Environ. Sci. Technol. 2024, 58, 671–682. [Google Scholar] [CrossRef]


| Trace Element | UCC | Tr |
|---|---|---|
| As | 2.0 | 10 |
| Cd | 0.2 | 2 |
| Cu | 14.3 | 5 |
| Cr | 35 | 2 |
| Ni | 18.6 | 5 |
| Pb | 17 | 5 |
| Zn | 52 | 1 |
| Hg | 0.056 | 40 |
| Slice | 1 | 2 | 3 | 4 | 5 | 6 | 7 | 8 | 9 |
|---|---|---|---|---|---|---|---|---|---|
| Number of items | 207 | 93 | 72 | 79 | 123 | 62 | 57 | 153 | 138 |
| Grain size classification (in %) | |||||||||
| Ø ≥ 2000 µm | 0.0 | 1.1 | 1.4 | 5.1 | 1.6 | 1.6 | 5.3 | 0.6 | 0.0 |
| 1000 µm ≤ Ø < 2000 µm | 1.4 | 5.4 | 8.3 | 6.3 | 4.1 | 8.1 | 10.5 | 3.3 | 7.3 |
| 500 µm ≤ Ø < 1000 µm | 4.4 | 8.6 | 13.9 | 13.9 | 10.6 | 19.3 | 10.5 | 6.5 | 9.4 |
| 250 µm ≤ Ø < 500 µm | 9.2 | 19.3 | 32.0 | 12.7 | 11.4 | 19.4 | 28.1 | 14.4 | 10.1 |
| 125 µm ≤ Ø < 250 µm | 18.8 | 32.3 | 19.4 | 30.4 | 21.9 | 22.6 | 26.3 | 32.7 | 23.9 |
| 63 µm ≤ Ø < 125 µm | 34.8 | 25.8 | 19.4 | 24.0 | 34.1 | 25.8 | 15.8 | 28.1 | 31.9 |
| Ø < 63 µm | 31.4 | 7.5 | 5.6 | 7.6 | 16.3 | 3.2 | 3.5 | 14.4 | 17.4 |
| Shape classification (in %) | |||||||||
| Fibers | 7.7 | 28.0 | 44.4 | 32.9 | 29.3 | 27.4 | 47.4 | 11.7 | 35.5 |
| Fragments | 34.3 | 24.7 | 27.8 | 34.2 | 33.3 | 41.9 | 22.8 | 39.9 | 39.1 |
| Granules | 1.0 | 12.9 | 11.1 | 6.3 | 4.9 | 9.7 | 26.3 | 19.6 | 5.1 |
| Other | 57.0 | 34.4 | 16.7 | 26.6 | 32.5 | 21.0 | 3.5 | 28.8 | 20.3 |
| Color classification (in %) | |||||||||
| White-Cream | 24.2 | 20.4 | 20.8 | 12.6 | 10.6 | 6.5 | 5.3 | 4.6 | 11.6 |
| Orange | 16.4 | 7.5 | 9.7 | 13.9 | 26.8 | 16.1 | 8.8 | 15.7 | 6.5 |
| Blue | 5.3 | 19.3 | 27.9 | 11.4 | 20.3 | 14.5 | 29.8 | 11.1 | 23.2 |
| Black | 17.9 | 19.4 | 19.4 | 25.3 | 9.0 | 27.4 | 26.3 | 27.5 | 15.2 |
| Brown | 28.5 | 28.0 | 12.5 | 20.3 | 24.4 | 27.4 | 15.8 | 34.6 | 27.5 |
| Other | 7.7 | 5.4 | 9.7 | 16.5 | 8.9 | 8.1 | 14.0 | 6.5 | 16.0 |
| µRaman results (in %) | |||||||||
| Artificial dyes/additives | 21 | 11 | 12 | 30 | 12 | 16 | 13 | 24 | 30 |
| Other components | 8 | 3 | 9 | 4 | 15 | 0 | 0 | 3 | 5 |
| Not recognized | 71 | 87 | 79 | 67 | 73 | 84 | 87 | 72 | 66 |
Disclaimer/Publisher’s Note: The statements, opinions and data contained in all publications are solely those of the individual author(s) and contributor(s) and not of MDPI and/or the editor(s). MDPI and/or the editor(s) disclaim responsibility for any injury to people or property resulting from any ideas, methods, instructions or products referred to in the content. |
© 2025 by the authors. Licensee MDPI, Basel, Switzerland. This article is an open access article distributed under the terms and conditions of the Creative Commons Attribution (CC BY) license (https://creativecommons.org/licenses/by/4.0/).
Share and Cite
Cutroneo, L.; Vercelli, S.; Montefalcone, M.; Capello, M. First Attempt to Study Sedimentological Characteristics and Contamination Levels of Bottom Sediments in the Faanu Mudugau Blue Hole (Ari Atoll, Maldives). Environments 2025, 12, 100. https://doi.org/10.3390/environments12040100
Cutroneo L, Vercelli S, Montefalcone M, Capello M. First Attempt to Study Sedimentological Characteristics and Contamination Levels of Bottom Sediments in the Faanu Mudugau Blue Hole (Ari Atoll, Maldives). Environments. 2025; 12(4):100. https://doi.org/10.3390/environments12040100
Chicago/Turabian StyleCutroneo, Laura, Sarah Vercelli, Monica Montefalcone, and Marco Capello. 2025. "First Attempt to Study Sedimentological Characteristics and Contamination Levels of Bottom Sediments in the Faanu Mudugau Blue Hole (Ari Atoll, Maldives)" Environments 12, no. 4: 100. https://doi.org/10.3390/environments12040100
APA StyleCutroneo, L., Vercelli, S., Montefalcone, M., & Capello, M. (2025). First Attempt to Study Sedimentological Characteristics and Contamination Levels of Bottom Sediments in the Faanu Mudugau Blue Hole (Ari Atoll, Maldives). Environments, 12(4), 100. https://doi.org/10.3390/environments12040100