Article

Associations Between Landfill Proximity and Water Quality Analytes from Private Domestic Wells in Rural Virginia

by
Bianca D. Owens
1,2,
Joseph Boyle
1,3,
Dana Adkins
4,
Stephen Adkins
4,
Hillary Boucher
1,
James Burch
5,
Maria D. Thomson
1,2 and
Katherine Y. Tossas
1,2,5,*,†
1
Massey Comprehensive Cancer Center, Virginia Commonwealth University, Richmond, VA 23284, USA
2
Department of Social and Behavioral Sciences, School of Public Health, Virginia Commonwealth University, Richmond, VA 23284, USA
3
Department of Family Medicine and Population Health, School of Medicine, Virginia Commonwealth University, Richmond, VA 23284, USA
4
Chickahominy Indian Tribe, Charles City County, VA 23140, USA
5
Department of Epidemiology, School of Public Health, Virginia Commonwealth University, Richmond, VA 23284, USA
*
Author to whom correspondence should be addressed.
These authors contributed equally to this work.
Environments 2025, 12(4), 103; https://doi.org/10.3390/environments12040103
Submission received: 23 February 2025 / Revised: 18 March 2025 / Accepted: 26 March 2025 / Published: 28 March 2025
(This article belongs to the Special Issue Environmental Risk Assessment of Aquatic Ecosystem, 2nd Edition)

Abstract

:
The Chickahominy T.R.U.T.H. (Trust, Research, Understand, Teach, and Heal) Project investigates water quality concerns, including potential contamination from a nearby landfill, and their corresponding health implications among residents of rural Charles City County, Virginia. This rural, majority-racial-minority county includes citizens of the Chickahominy Indian tribe. The T.R.U.T.H. Project utilizes a community-based participatory research approach and environmental justice-focused lens to study water quality and health; the present study represents the first comprehensive analysis of the drinking water quality of homes with domestic groundwater wells. We collected water samples from 121 participants located within a four-mile radius of the landfill, analyzing over 200 potential analytes that may affect water quality. Among the measured analytes, water pH, aluminum, iron, manganese, and hardness as CaCO3 were most frequently identified as having ratings outside of established EPA limits (“Bad”). Logistic regression models demonstrated that proximity to streams near the landfill was associated with significantly greater odds of worse water quality for several analytes. Specifically, residing within a mile of these streams was associated with greater odds of “Fair” or worse turbidity (OR = 4.31, 95% CI 1.31–19.53) and zinc levels (OR = 2.63, 95% CI 1.23–5.86). Additionally, residing within half a mile of a proximate stream was linked with “Poor” or worse hardness ratings (OR = 10.71, 95% CI 1.64–86.96); residing within a mile of the landfill was associated with “Bad” water pH levels (OR = 10.50, 95% CI 1.16–95.68). Though many tested analytes did not have concerning ratings or were not significantly associated with proximity to the landfill or streams, the above findings suggest that anthropogenic factors, particularly landfill proximity, may influence water quality with regard to specific analytes. Therefore, addressing water quality through enhanced monitoring, contaminant remediation, and community education is crucial for restoring trust in drinking water and improving public health outcomes.

1. Introduction

The quality and safety of drinking water is fundamental to public health. The physical and chemical properties of water, such as hardness and pH, can modify water’s taste and odor, diminish the effectiveness of soaps and detergents, and affect plumbing systems [1,2,3,4,5,6]. Additionally, the presence of heavy metals/metalloids in drinking water, such as arsenic or chromium, poses significant health risks, as these metals can accumulate in the body and lead to long-term health problems including Parkinson’s disease, muscular dystrophy, and cancer [7,8]. Contaminated water sources can also serve as vectors for harmful microorganisms, including bacteria, viruses, and parasites, causing waterborne illnesses such as cholera and typhoid [6,9,10,11]. Exposure to these contaminants can have severe consequences, particularly for vulnerable populations including children and the elderly [9,11].
One way in which the likelihood of such exposure is lessened is through access to public drinking water systems. The majority of United States (U.S.) households are served by public water systems, which are held to rigorous federal and state quality standards. The creation of these public water systems has been particularly beneficial for public health, with one study attributing almost two-thirds of the declines in child mortality and nearly one-half of overall mortality declines between 1900 and 1936 to their advent [12]. Regulations such as the Safe Drinking Water Act ensure adequate filtration, frequent monitoring, and tracking of contamination levels and water properties in public water systems [13]. However, domestic groundwater wells are usually not included in public water treatment and quality monitoring efforts. As such, these wells frequently have higher concentrations of contaminants and other hazardous water conditions [14]. Thus, understanding and monitoring the properties of drinking water are crucial for ensuring water safety [15,16]. Such monitoring is particularly relevant in rural and underserved communities, where residents are more likely to obtain their drinking water from domestic groundwater wells that are more vulnerable to contamination than public water systems [17]. Further, though public water systems are often subject to frequent monitoring and treatment, private well owners must generally ensure their own water supply’s safety at their own expense, making rural communities more susceptible to the effects of groundwater pollution [17,18,19].
Anthropogenic hazards, such as landfills, are also more likely to be located in rural, structurally underserved and minoritized communities [20]. For example, a large-scale national analysis found strong and statistically significant associations between the proportion of Black and Latine residents living in an area and the area’s presence of non-hazardous waste landfills, even after controlling for other socio-economic factors [20]. Landfills can introduce pollutants into local water sources, potentially affecting the health and well-being of residents. Numerous studies have documented contaminants in groundwater near landfills [18,19,21,22]. One possible mechanism by which this can occur is leachate transfer. Leachate produced during municipal solid waste decomposition can migrate through the soil and enter the local water supply [18,23]. This leachate may contain heavy metals and organic pollutants, which may adversely affect the health of the surrounding communities [18,24,25,26,27,28]. Therefore, addressing private well water contamination is vital for mitigating these health risks.
This issue of drinking water quality is particularly relevant in Charles City County, Virginia, a rural community with a population of 6610 and where 53% of residents are from racial and ethnic minority groups, including the Chickahominy Indian Tribe [29]. This community relies heavily on private wells for their water supply [30], like many other rural communities in Virginia [31,32]. The proximity of some of these wells to the municipal landfill or streams near it poses unique challenges for maintaining drinking water quality, which has prompted concerns among residents about their drinking water. These concerns were further amplified by suspicions of a cancer cluster within the community, which seemed to follow the establishment of the landfill. In response, a community–academic partnership was formed between the Chickahominy Indian Tribe and Virginia Commonwealth University’s Massey Comprehensive Cancer Center to assess perceptions of cancer risk and provide comprehensive drinking water testing in the homes of residents living within a four-mile radius of the landfill.
The quality and safety of drinking water are essential for public health, not only for the apparent reasons but also because it is a resource often taken for granted. The documented consequences of residing in communities facing the threat of water contamination include numerous adverse health outcomes and altered behaviors. The term “threat” is crucial in this context; even the perceived risk that the water used for daily consumption might be harmful may significantly influence individual and community behaviors. Herein, we report novel findings from the Chickahominy T.R.U.T.H. Project. Using a community-engaged approach, we sampled water from private wells and examined samples for contaminants in order to investigate associations between water quality and proximity to a municipal landfill. This research holds critical significance in unraveling potential environmental and racial health disparities in this community.

2. Methods

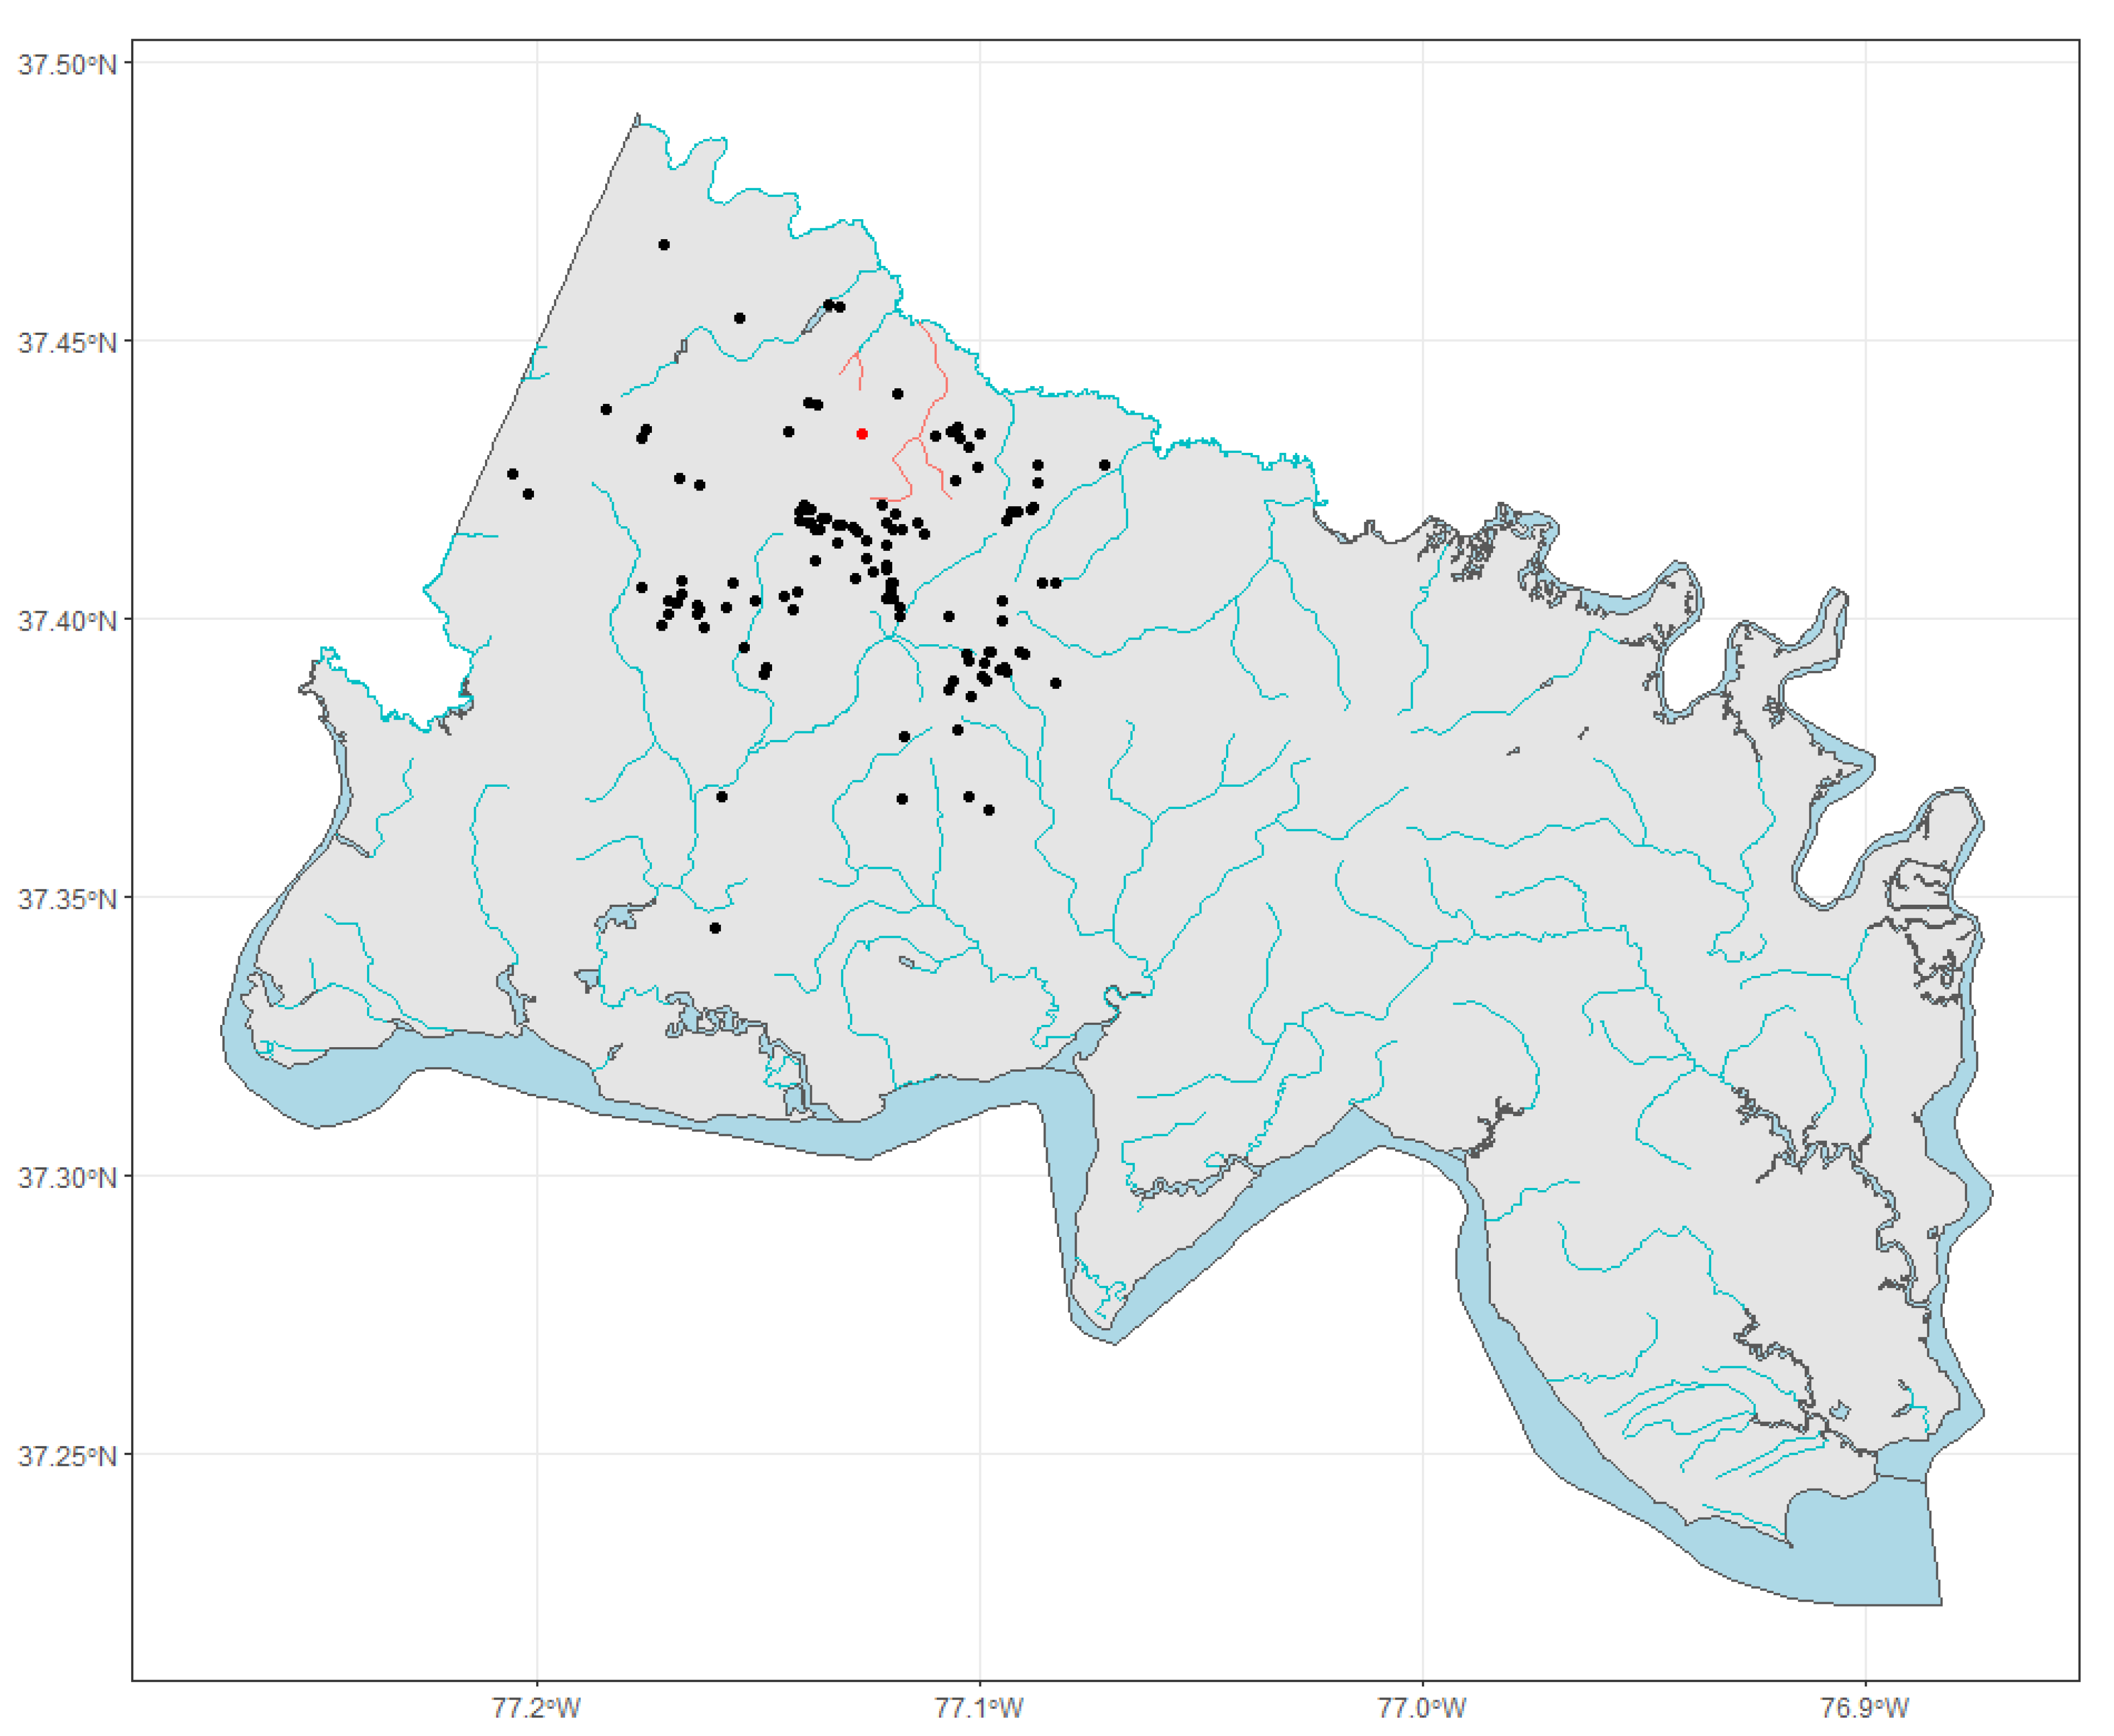
2.1. Study Sample and Design

The water samples analyzed in this study were collected as part of the Chickahominy T.R.U.T.H. (Trust, Research, Understand, Teach, and Heal) Project, which is a community–academic partnership between citizens of the Chickahominy Indian Tribe and Virginia Commonwealth University’s Massey Comprehensive Cancer Center. This initiative will be referred to as the T.R.U.T.H. Project throughout the study. The partnership seeks to understand the impact of structural and environmental factors on perceived cancer risk among residents of Charles City County, VA, USA. A detailed description of the project’s design and study population has been previously published [33]. For context, we will first provide a brief overview of relevant aspects of the T.R.U.T.H. Project’s research design and sample as they pertain to the current investigation. Project participants were recruited via advertisements posted in local business and newspapers, on social media, and a study website. Postcards describing the study were also mailed to all households in the county. Concurrently, residents were trained as Health Brigadiers. In one phase of the project, Health Brigadiers conducted semi-structured interviews with participating Charles City County residents, using an interview guide focused on health beliefs, perceptions of cancer risk, experiences, and attitudes. These questions were related to concerns of potentially elevated cancer rates in the community and subsequent establishment of the partnership. The T.R.U.T.H. Project also involved collecting drinking water samples, primarily from private wells at the homes of participating adults (18+ years) residing within a four-mile radius of the local landfill in Charles City County, Virginia. This radius was selected based on geographical data, environmental considerations, and recommendations from the tribal environmental director [33].

2.2. Description of the Landfill, Proximate Streams, and Underlying Geology

The Charles City landfill is a sanitary landfill that has been operational since 1990, covering approximately 100 acres and designed to handle municipal solid waste. The facility is designed to manage a significant volume of waste, with a capacity that allows it to accept thousands of tons of municipal solid waste annually [34,35]. The landfill employs various waste management strategies to optimize its operations, including the management of leachate and landfill gas, which are byproducts of waste decomposition [36]. The landfill’s design incorporates features that facilitate the degradation of waste, which is critical for extending the lifespan of the facility and minimizing its environmental footprint. This includes the implementation of biological, chemical, and physical processes that occur within the landfill, promoting waste breakdown and reducing the volume of waste over time. Furthermore, the landfill’s management practices align with contemporary waste management strategies that are meant to emphasize sustainability and environmental protection [34,35].
Publicly available information detailing the specific design and construction of the Charles City County Landfill is limited. However, through a Freedom of Information Act request to the County of Charles City, we obtained information regarding the planned cell construction. The design was to include a 1-foot compacted clay liner with a permeability of 10−7 cm/sec or less, in combination with a 60-mil HDPE liner, followed by 18 inches of sand with a leachate collection system. Additionally, an 80-mil HDPE liner was planned to be placed above this system, also covered by 18 inches of sand, and include a leachate collection system designed to allow identification of the phase from which leachate is collected. Notably, the landfill has been subject to multiple violations identified by the Virginia Department of Environmental Quality (DEQ) over the years. In 2019, DEQ determined that existing controls were failing to minimize pollutants in stormwater discharges from the site, and modifications to these control measures were deemed necessary to reduce environmental impacts.
We geocoded the location of the centroid of the landfill using latitude and longitude coordinates. The landfill is also located near numerous streams and small waterways. We obtained the shapefiles defining the geographic extent of these streams and waterways using a public database [37] and geocoded these as well.
Regarding underlying geology, Charles City County contains several confined aquifers separated from each other by thick layer of clay, as well as an unconfined shallow aquifer that provides water for the shallow wells that comprise the majority source of drinking water in the county [30]. Because the unconfined aquifer is shallow, it is considered susceptible to contamination. Continued groundwater withdrawal has lowered water levels throughout aquifers in recent decades. Regarding lithology, a total of eight formations are found in the county (Shirley, Charles City, Chuckatuck, Alluvium, Windsor, Bacons Castle, Chesapeake, Tabb). The primary and secondary rock types within these formations include gravel, sand, silt, clay or mud, or alluvium [38].

2.3. Data Collection

Previously recruited T.R.U.T.H. Project participants who lived within a four-mile radius of the landfill were approached by trained Health Brigadiers, who obtained consent and collected water samples. Drinking water samples from each participant in the study were collected using the EnviroTestKits SafeHome Ultimate Drinking Water Test Kit [39]. This direct-to-consumer product tests for approximately 200 properties and potential contaminants, categorized as metals, semi-volatile organic compounds, trihalomethanes, volatile organics, physical properties, and inorganics, which are referred to collectively as “analytes” herein. The majority of samples were collected from study participants (age 18+) whose homes’ primary water source was a private well. Water was primarily collected from the kitchen tap, although bathroom taps were used for a small number of homes. Additionally, a small number of water samples were collected from streams near the landfill. Samples were sent to an Environmental Protection Agency (EPA)-certified laboratory for analysis, and results were returned for N = 121 participants.

2.4. Laboratory Rating

Analytes were rated by the kits as belonging to one of four mutually exclusive categories: “Good”, “Fair”, “Poor”, or “Bad”. A “Good” rating indicated that the analyte was not detected in the water sample or that the concentration fell within the EPA’s acceptable range. A “Fair” rating indicated that the concentration was detected in the sample (if no EPA limit had been established for the analyte) or that the concentration was less than half of the EPA limit (if an EPA limit had been established for the analyte). A “Poor” rating indicated that the concentration was greater than half of the EPA limit for the analyte. A “Bad” rating indicated that the concentration was above the EPA’s limit for that analyte or that the concentration fell above the EPA’s acceptable range if applicable. Determination of concentrations was based on EPA Method 200.7 for metals, Method 524.2 for volatiles, Method 525.2 for semi-volatiles, Method 300.1 for ions, Standard Method (SM)-4500H+B for pH, SM-2320B for Alkalinity, Bicarbonate, and Carbonate, and SM-2510B for Conductivity (private communication with SafeHome).

2.5. Exposure Assignment

First, participants’ residential addresses were geocoded using the “tidygeocoder” package in R [40]. Two participants did not have addresses that produced valid geocoded coordinates, making the sample size N = 119 for the analysis described in Section 2.4. For each participating household, we calculated their Euclidean (straight-line) distance to the landfill and to the closest proximate stream within a one-mile radius of the centroid of the landfill. A map illustrating this process is provided in Figure 1. These continuous distance exposure measures, along with dichotomized versions, were used in our analysis.

2.6. Statistical Analysis

We fit logistic regression models to estimate the associations between the exposure measures and the water sampling outcomes. For each analyte, we defined three binary outcome variables: one grouping “Fair”, “Poor”, and “Bad” ratings as the occurrence of the outcome; another grouping “Poor” and “Bad” ratings; and a third considering only “Bad” ratings. Models were fitted only if the outcome occurred at least once among participants. Separate logistic regression models were fitted for each outcome variable and analyte, using different forms of exposure measures: within one mile (binary), within one half of a mile (binary), and using continuous distance to the landfill and proximate streams. Associations were considered significant if the p-value for the regression coefficient was less than 0.05. For these significant associations, we reported odds ratios along with their 95% confidence intervals. We also conducted a sensitivity analysis controlling for the underlying geological characteristics of water sampling locations using lithology data from the Virginia Department of Energy [38]. All analyses were conducted in R, Version 4.3.1 [41].

3. Results

A total of 153 residences, including one tribal center and one church, were invited to participate in the study. Of these, 151 residents expressed interest, while 2 declined participation, resulting in a recruitment rate of 98.7%. During the study period, water samples were collected from residences, one creek, a marshland area in the landfill, and two community buildings (the church and the tribal center). Among the residential water samples, 26 were collected from shallow wells (<50 feet) and the remainder from deep wells (>100 feet).
Several analytes received “Fair” or worse ratings (Figure 2) for all or all but one sample. These included various physical properties (hardness as CaCO3, Langelier Index, Ryznar Index, Total Dissolved Solids (TDS), alkalinity as CaCO3, bicarbonate, and conductivity) and the Aggressive Index. Additionally, other analytes such as calcium, sodium, turbidity, and strontium received “Fair” or worse ratings for over 100 samples. Four analytes (fluoride, water pH, aluminum, and iron) received “Poor” or worse ratings (Figure 3) for more than 10 samples. Finally, 12 and 9 samples had ratings of “Bad” for water pH and aluminum, respectively (Figure 4). The majority of water pH ratings that were “Poor” or worse were slightly acidic (water pH values of 5.5–6.5).
There were 43 analytes with at least one “Fair” or worse rating. In the logistic regression models (Table 1), samples taken from participants residing near streams proximate to the landfill were significantly more likely to have “Fair” or worse ratings for two analytes. Specifically, residing within a mile of a stream proximate to the landfill was associated with significantly higher odds of “Fair” or worse turbidity (OR = 4.31, 95% CI [1.31, 19.53], p = 0.028) and of “Fair” or worse zinc levels (OR = 2.63, 95% CI [1.23, 5.86], p = 0.015).
There were ten analytes with at least one “Poor” or worse rating and five analytes with at least one “Bad” rating. The proximity measures were also related to two of these more concerning ratings (Table 1). Specifically, residing within half a mile of a stream near the landfill was associated with significantly higher odds of a “Poor” or worse rating of hardness as CaCO3 (OR = 10.71, 95% CI [1.64, 86.96], p = 0.013). Residing within a mile of the landfill was associated with significantly higher odds of a “Bad” rating for water pH (OR = 10.50, 95% CI [1.16, 95.68], p = 0.026, Table 1). A map illustrating the spatial distribution of these two water quality outcomes by their proximity to the landfill and proximate streams is provided in Figure 5.
The sensitivity analysis found that the underlying lithology did not confound any of the significant associations identified above. Specifically, residing within a mile of a proximate stream remained associated with significantly greater odds of “Fair” or worse turbidity (OR = 4.66, 95% CI [1.40, 21.27], p = 0.022) and of “Fair” or worse zinc (OR = 2.50, 95% CI [1.15, 5.63], p = 0.023); residing within half a mile of a proximate stream remained associated with significantly greater odds of “Poor” or worse hardness as CaCO3 (OR = 9.22, 95% CI [1.41, 74.88], p = 0.020); and residing within a mile of the landfill remained associated with significantly greater odds of a “Bad” water pH rating (OR = 13.42, 95% CI [1.44, 127.15], p = 0.016).

4. Discussion

This study examined drinking water quality indicators primarily from private wells in the Chickahominy tribal community in Charles City County, VA, USA, as well as proximity to a municipal solid waste landfill. Our findings echo residents’ concerns about their drinking water, with numerous analytes showing suboptimal EPA-defined ratings. Specifically, physical properties, such as hardness as CaCO3 and water pH, and metals, such as aluminum, iron, and manganese, had “Bad” ratings at multiple residential locations in our sample. We also observed a significant number of “Fair”, “Poor”, and “Bad” readings for several analytes, as well as significant associations between proximity to the landfill and sub-optimal readings of four analytes (zinc, turbidity, hardness, water pH). Importantly, these associations were not a function of the underlying geology, as identified by the sensitivity analysis. These results highlight the significant influence of anthropogenic factors, especially proximity to potential contamination sources, in shaping water quality.
There is evidence in the literature suggesting associations between proximity to landfills and water quality measures. For example, a recent study identified greater turbidity and hardness in drinking water sites close to a landfill than far from it [42]. Talalaj and Biedka utilized a landfill water pollution index and identified a higher concentration of zinc proximate to a landfill, possibly due to its harboring of zinc-based materials and fertilizer products [43]. Additional studies identified that residence in the counties surrounding an EPA Superfund-designated waste site was associated with increased bladder cancer deaths and incidence of other cancers [44] and that residing adjacent to a landfill in Quebec was associated with increased incidence of stomach, liver, lung, and prostate cancer in men and with stomach and cervical cancer in women [45]. Finally, an analysis of twenty-four years of readings surrounding a landfill found that pollutant levels were notably higher closer to than farther from the landfill [46]. While the findings in our study do not associate a specific landfill with the incidence of specific cancers, we believe that further investigation of the findings identified here is warranted given the elevated levels of drinking water contaminants proximate to the landfill.
The analytes with sub-optimal ratings in our study have been associated with health consequences and may possibly decrease trust in the quality and health of residential well water in Charles City County. For example, CaCO3 (or hardness) indicates high levels of calcium and magnesium in the water, which can lead to scaling in pipes and appliances, potentially causing skin irritation and exacerbating skin conditions [47]. Excessive TDS indicates high concentrations of dissolved substances, which can affect the taste of water and may include harmful contaminants [48,49,50]. Further, elevated levels of alkalinity and bicarbonate can also contribute to scaling and taste issues [51,52]. High turbidity indicates the presence of suspended particles, which can harbor harmful microorganisms and reduce the effectiveness of disinfection processes.
Several analytes with multiple “Poor” or worse ratings have been linked with health consequence as well. Elevated fluoride levels, while beneficial in small amounts for dental health, can lead to dental and skeletal fluorosis at high concentrations [53,54]. Abnormal water pH levels, such as those seen in our sample (specifically, the majority of which that were slightly acidic), can cause gastrointestinal discomfort and potential pipe corrosion [55]. High aluminum levels have been associated with neurodegeneration and other negative neurological effects [56,57]. Elevated iron levels can cause gastrointestinal issues and lend an unpleasant taste and color to drinking water, affecting its palatability [58,59].
While this study was not designed to associate the Charles City County landfill with increased incidences of specific cancers or other health outcomes, we believe that further investigation is warranted. Future research should explore the potential health impacts of the findings identified here, given the elevated levels of drinking water contamination and “Fair” or below ratings on water quality indicators proximate to the landfill and its streams. Rightfully, these findings may impact the community’s perception of their drinking water quality, leading to decreased confidence in the safety of their water supply. Such a lack of trust can result in residents avoiding tap water, potentially consuming inadequate amounts of water, turning to more expensive bottled water, or drinking other non-water liquids, which could exacerbate health inequities and financial burdens. The psychological stress and anxiety related to perceived water contamination can also negatively affect overall well-being and community morale [60]. Therefore, addressing these water quality issues is essential to restoring trust and ensuring the health and safety of the community.
Notably, Charles City County residents are among the approximately 13% of U.S. residents who obtain their water from private wells rather than the public water systems that have more rigorous water quality standards [61]. For multiple reasons that include ongoing residential segregation, economic injustice, zoning decisions that exclude certain communities, and uneven governmental investment, rural communities and communities with large Black, Indigenous, and Latine populations are less likely to be served by public water systems, instead relying on private wells [62]. Prior research has documented a number of health disparities related to these inequities in water source and quality. For example, a 2017 study found higher rates of emergency room utilization for acute gastrointestinal illness in a predominantly Black community that relies on private wells for drinking water and calculated that at least 22% of these emergency room visits could be prevented by extending the public water system [63]. Another study found higher levels of arsenic in private wells as compared to public water systems, with elevated arsenic levels also seen in counties with larger Indigenous and Latine populations [64]. Likewise, a North Carolina study found that blood lead concentration levels were an average of 20% higher in children whose primary water source was private wells, as compared to public water sources, even after controlling for individual- and community-level factors [65]. Higher lead exposures have been noted across the lifespan for Black individuals as compared to their white counterparts [66], and inequities in access to higher-quality drinking water have been named as a contributing factor. This finding is notable because there is no safe level of lead exposure [65]. Our finding of elevated water properties associated with damage and corrosion to pipes raises similar concerns about the potential of increased exposure to lead for Charles City County residents.
The American Public Health Association has named water quality as an important health equity issue [67], while the American Academy of Pediatrics has called for measures to increase access to public water systems and decrease children’s exposure to water from private wells [14]. Similarly, anthropogenic hazards such as landfills and other sources of contamination are significantly more likely to be located in low-income communities of color, a practice known as environmental racism [68]. This combination of disproportionate burden of exposure to environmental hazards and a lower likelihood of being served by public water systems [62,69] therefore makes rural communities of color more susceptible to the health impacts of groundwater pollution.
It is worth noting that of the approximately 200 analytes tested, the vast majority did not have concerning readings from the water sampling analysis. Specifically, only five specific analytes had any “Bad” readings (denoting levels above EPA limits) in our sample, and only three of these (water pH, aluminum, and iron) had more than five such readings. Despite the significant associations we identified with proximity to the landfill and proximate streams, some of the detected analytes are naturally occurring, and fortunately, none of the analytes with “Bad” readings detected in our sample were any of the seven identified toxic legacy and emerging drinking water contaminant groups (arsenic, disinfection by-products, fracking-related substances, lead, nitrate, per- and polyfluorinated alkyl substances (PFAS), and uranium) [70].
Our study had several strengths. First is the design of the Chickahominy T.R.U.T.H. Project as a community–academic partnership that is motivated by community health concerns and operates with shared understanding, respect, and teamwork between all parties involved. Second is the use of powerful and comprehensive drinking water sampling kits for many study participants across our study region. Third is the use of standardized, validated EPA test methods and precise geospatial exposure assignment through geocoding and landfill, as well as proximate stream locations. Fourth is an intuitive and comprehensive analytic pipeline, which involved first defining exposure based on geographic proximity and then testing exposures with binarized analyte outcomes with logistic regression models. This pipeline can be extended or adapted to similar contexts.
The strengths of our study should be viewed in the context of its limitations. First, there is a possibility of existing analyte concentrations that fell below the detection limits of the test kits. Second, though the water sampling kits tested over 200 analytes, there is a possibility that other analytes in drinking water could be relevant for health consequences. Third, our study was cross-sectional in nature, and factors other than proximity to the landfill or proximate streams may also be associated with the sub-optimal ratings identified. Fourth, samples were collected only once at residential addresses due to the ongoing recruitment, consent, and interviewing structure of the T.R.U.T.H. Project. It is possible that temperature and precipitation variations on different sampling days may have played a role in sampling results. It would be beneficial in future research to perform water sampling several times over a longer time period to examine the stability of the testing results over time. Finally, future research should ensure comprehensive sampling coverage in this region proximate to the landfill to more fully investigate the role of proximity with continuous measures of water quality, as well as incorporate data on microbiological components.
Importantly, the Chickahominy T.R.U.T.H. Project establishes a foundation for future research and policy development aimed at safeguarding vulnerable populations from environmental health risks. These findings inform public health strategies, shape policy decisions, and promote community engagement with environmental health issues. For example, study participants with “Bad” readings of certain analytes can be offered additional water treatment services and/or additional testing kits to be able to monitor for changes in drinking water quality over time. This effort aims to support more equitable and effective health interventions and policies tailored to address the specific vulnerabilities and concerns of those relying on private well water, particularly in rural Charles City County, VA, USA.

5. Conclusions

This study suggests the influence of anthropogenic factors on private well water quality in a rural community of color in Virginia, demonstrating an association between proximity to a landfill and diminished water quality for several analytes. This effort establishes a foundation for future community-engaged research and policy development aimed at increasing access to public water systems and reducing health disparities. Our study findings highlight the need for targeted interventions to enhance water safety and rebuild community confidence in the drinking water supply. Priority actions should focus on improving water quality through intensified monitoring, remediating contaminated sites, and educating community members on water safety to enhance their ability to identify potential issues and seek appropriate intervention. Transparent communication and community involvement in water management decisions are crucial for rebuilding trust. Additionally, future research and health disparity reduction efforts should focus on measuring and addressing the impacts of anthropogenic hazards on private well water. By addressing these critical issues, we can pave the way for enhanced public health outcomes and a revitalized sense of trust and security in the safety of drinking water for all residents.

Author Contributions

Conceptualization, K.Y.T. and J.B. (Joseph Boyle); methodology, K.Y.T. and J.B. (Joseph Boyle); formal analysis, K.Y.T. and J.B. (Joseph Boyle); investigation, K.Y.T., B.D.O., D.A., S.A., H.B. and M.D.T.; resources, K.Y.T. and M.D.T.; writing—original draft preparation, K.Y.T., J.B. (Joseph Boyle) and B.D.O.; writing—review and editing, K.Y.T., J.B. (Joseph Boyle), B.D.O. and J.B. (James Burch); supervision, K.Y.T. and M.D.T.; project administration, K.Y.T. and M.D.T.; funding acquisition, K.Y.T. and M.D.T. All authors have read and agreed to the published version of the manuscript.

Funding

This work was supported by the Jeffress Trust, grant number 565004.

Data Availability Statement

A de-identified dataset with limited access may be made available upon reasonable request to the corresponding author, subject to approval from the community advisory board. The availability of the data is contingent upon ensuring the privacy and confidentiality of the study participants and aligning with the principles of community-driven research.

Acknowledgments

We extend our sincere gratitude to the participants who have generously shared their time, experiences, and insights, making this research possible. Your contributions are invaluable, and we deeply appreciate your involvement in the Chickahominy T.R.U.T.H. Project. We would also like to express our profound appreciation to the Chickahominy Indian Tribe for their unwavering support, collaboration, and partnership throughout this endeavor. Your commitment to improving the health and well-being of your community is an inspiration. The Chickahominy Health District’s invaluable assistance and guidance have been instrumental in the success of this project. We acknowledge their dedicated efforts and collaborative spirit in advancing the goals of the T.R.U.T.H. Project. Our heartfelt thanks go to the Charles City County community at large for their openness, engagement, and cooperation. Your active participation has played a pivotal role in addressing pressing health disparities and fostering positive change within the community. Together, your collective contributions have made a significant impact, underscoring the importance of community-driven research and the pursuit of health equity.

Conflicts of Interest

S.A. and D.A., citizens of the Chickahominy Indian Tribe, demonstrate an unwavering commitment to the betterment of the Charles City County community. Their dedicated involvement stems from a sincere desire to address health disparities and improve conditions in their community. Within this community–academic partnership, their active participation highlights a vested interest in the research outcomes and profound dedication to ensuring the integrity and impartiality of the study, emphasizing a commitment to advancing community welfare. Through this engagement, coupled with the oversight of the VCU study leads, K.Y.T. and M.T., in enforcing rigorous research measures, this study’s credibility is fortified, enabling meaningful strides in addressing cancer health disparities impacting the Charles City County community. All other authors declare no conflicts of interest. The funders have no role in the design of the study; in the collection, analyses, or interpretation of data; in the writing of the manuscript; or in the decision to publish the results.

References

  1. Kulthanan, K.; Nuchkull, P.; Varothai, S. The pH of water from various sources: An overview for recommendation for patients with atopic dermatitis. Asia Pac. Allergy 2013, 3, 155–160. [Google Scholar] [CrossRef] [PubMed]
  2. Dinka, M.O. Safe drinking water: Concepts, benefits, principles and standards. Water Chall. Urban. World 2018, 163. [Google Scholar] [CrossRef]
  3. Akram, S.; Rehman, F. Hardness in drinking-water, its sources, its effects on humans and its household treatment. J. Chem. Appl. 2018, 4, 1–4. [Google Scholar]
  4. Barloková, D.; Ilavskỳ, J.; Kapusta, O.; Šimko, V. Importance of calcium and magnesium in water-water hardening. In IOP Conference Series: Earth and Environmental Science; IOP Publishing: Bristol, UK, 2017; Volume 92, p. 012002. [Google Scholar]
  5. Brandt, M.; Johnson, K.; Elphinston, A.; Ratnayaka, D. Chapter 7—Chemistry, Microbiology, and Biology of Water. In Twort’s Water Supply, 7th ed.; Butterworth-Heinemann: Oxford, UK, 2017; pp. 235–321. [Google Scholar]
  6. Srivastava, A.; Sharma, V. Water Quality Monitoring and Management: Importance, Applications, and Analysis. In Applied Water Science Volume 1: Fundamentals and Applications; Published online; Scrivener Publishing LLC: Beverly, MA, USA, 2021; pp. 421–440. [Google Scholar]
  7. Järup, L. Hazards of heavy metal contamination. Br. Med. Bull. 2003, 68, 167–182. [Google Scholar] [CrossRef]
  8. Amjad, M.; Hussain, S.; Javed, K.; Khan, A.R.; Shahjahan, M. The sources, toxicity, determination of heavy metals and their removal techniques from drinking water. World 2020, 5, 34–40. [Google Scholar] [CrossRef]
  9. Bashir, S.; Salam, A.; Chhajro, M.A.; Fu, Q.; Khan, M.J.; Zhu, J.; Shaaban, M.; Kubar, K.A.; Ali, U.; Hu, H. Comparative efficiency of rice husk-derived biochar (RHB) and steel slag (SS) on cadmium (Cd) mobility and its uptake by Chinese cabbage in highly contaminated soil. Int. J. Phytoremediat. 2018, 20, 1221–1228. [Google Scholar] [CrossRef]
  10. Oka, I.A.; Upula, S.A. Physicochemical, bacteriological, and correlational evaluation of water obtained from boreholes and springs in a sub-urban community. World J. Adv. Res. Rev. 2021, 11, 134–145. [Google Scholar]
  11. Ferreira, A.P. Caffeine as an environmental indicator for assessing urban aquatic ecosystems. Cad. De Saúde Pública 2005, 21, 1884–1892. [Google Scholar] [CrossRef]
  12. Cutler, D.; Miller, G. The role of public health improvements in health advances: The twentieth-century United States. Demography 2005, 42, 1–22. [Google Scholar] [CrossRef]
  13. Tiemann, M. Safe Drinking Water Act (SDWA): A Summary of the Act and Its Major Requirements; Congressional Research Service: Washington, DC, USA, 2014.
  14. Woolf, A.D.; Stierman, B.D.; Barnett, E.D.; Byron, L.G.; Bole, A.; Balk, S.J.; Huerta-Montañez, G.M.; Landrigan, P.J.; Marcus, S.M.; Nerlinger, A.L.; et al. Drinking water from private wells and risks to children. Pediatrics 2023, 151, e2022060645. [Google Scholar] [CrossRef]
  15. Sankhla, M.S.; Kumari, M.; Nandan, M.; Kumar, R.; Agrawal, P. Heavy metals contamination in water and their hazardous effect on human health-a review. Int. J. Curr. Microbiol. App. Sci. 2016, 5, 759–766. [Google Scholar] [CrossRef]
  16. Farhan, A.; Zulfiqar, M.; Samiah, S.; Rashid, E.U.; Nawaz, S.; Iqbal, H.M.N.; Jesionowski, T.; Bilal, M.; Zdarta, J. Removal of toxic metals from water by nanocomposites through advanced remediation processes and photocatalytic oxidation. Curr. Pollut. Rep. 2023, 9, 338–358. [Google Scholar]
  17. Strosnider, W.; Schultz, S.; Strosnider, K.J.; Nairn, R. Effects on the underlying water column by extensive floating treatment wetlands. J. Environ. Qual. 2017, 46, 201–209. [Google Scholar] [PubMed]
  18. Wang, F.; Song, K.; He, X.; Peng, Y.; Liu, D.; Liu, J. Identification of groundwater pollution characteristics and health risk assessment of a landfill in a low permeability area. Int. J. Environ. Res. Public Health 2021, 18, 7690. [Google Scholar] [CrossRef]
  19. Han, M.; Chen, G.; Meng, J.; Wu, X.; Alsaedi, A.; Ahmad, B. Virtual water accounting for a building construction engineering project with nine sub-projects: A case in E-town, Beijing. J. Clean. Prod. 2016, 112, 4691–4700. [Google Scholar]
  20. Cannon, C. Examining rural environmental injustice: An analysis of ruralness, class, race, and gender on the presence of landfills across the United States. J. Rural Community Dev. 2020, 15, 89–114. [Google Scholar]
  21. James, S.C. Metals in municipal landfill leachate and their health effects. Am. J. Public Health 1977, 67, 429–432. [Google Scholar] [CrossRef]
  22. Sule, I.A.; Saleh, M.; Lawan, M.; Bunawa, A.A.; Jibril, F.M. Assessment of groundwater quality condition at Tarauni dumpsite area, Kano Northwestern Nigeria. Int. J. Phys. Sci. 2020, 15, 1–9. [Google Scholar]
  23. Kjeldsen, T.H.; Hansen, E.W.; Christensen, J.D.; Moesby, L. Baclofen influences lipopolysaccharide-mediated interleukin-6 release from murine pituicytes. Eur. J. Pharmacol. 2002, 451, 209–215. [Google Scholar]
  24. Mor, S.; Ravindra, K.; Dahiya, R.; Chandra, A. Leachate characterization and assessment of groundwater pollution near municipal solid waste landfill site. Environ. Monit. Assess. 2006, 118, 435–456. [Google Scholar] [CrossRef]
  25. Vrijheid, M. Health effects of residence near hazardous waste landfill sites: A review of epidemiologic literature. Environ. Health Perspect. 2000, 108 (Suppl. S1), 101–112. [Google Scholar] [PubMed]
  26. Siddiqua, A.; Hahladakis, J.N.; Al-Attiya, W.A.K. An overview of the environmental pollution and health effects associated with waste landfilling and open dumping. Environ. Sci. Pollut. Res. 2022, 29, 58514–58536. [Google Scholar] [CrossRef] [PubMed]
  27. Brender, J.D.; Maantay, J.A.; Chakraborty, J. Residential proximity to environmental hazards and adverse health outcomes. Am. J. Public Health 2011, 101 (Suppl. S1), S37–S52. [Google Scholar] [CrossRef]
  28. Abdul-Aziz, O.I. Wetland Processes, Modeling, and Use in Watershed Management. In Environmental Water Resources Institute Congress; American Society of Civil Engineers: Reston, VA, USA, 2023. [Google Scholar]
  29. U.S. Census Bureau. QuickFacts: Charles City County, Virginia. U.S. Census Bureeau QuickFacts. Available online: https://www.census.gov/quickfacts/fact/table/charlescitycountyvirginia/PST045222 (accessed on 15 October 2024).
  30. Charles City County Planning Commission. Charles City County Comprehensive Land Use Plan; Charles City County: Charles City, VA, USA, 2006; Volume 188, Available online: https://www.charlescityva.us/DocumentCenter/View/536/2014-Final-Comp-Plan-002 (accessed on 15 October 2024).
  31. PlanRVA. Land & Water Use. PlanRVA Environment-Lower Chickahominy. Available online: https://planrva.org/environment/lc_landwater-use/ (accessed on 15 October 2024).
  32. Benham, B.L.; Ling, E.; Ziegler, P.; Krometis, L.A.H. What’s in your water? In Development and Evaluation of the Virginia Household Water Quality Program and Virginia Master Well Owner Network; The School of Human Sciences at Mississippi State University: Starkville, MS, USA, 2016. [Google Scholar]
  33. Tossas, K.Y.; Owens, B.D.; Reitzel, S.; Wilt, J.K.; Mejía, P.T.R.; Hunley, R.; Groesbeck, H.; Boucher, H.; Schifano, K.; Brown, S.L.; et al. The Chickahominy TRUTH (Trust, Research, Understand, Teach, and Heal) Project—A Tribal Community–Academic Partnership for Understanding the Impact of Structural Factors on Perceived Cancer Risk in Rural Virginia. Int. J. Environ. Res. Public Health 2024, 21, 262. [Google Scholar]
  34. Vaverková, M.D. Landfill impacts on the environment. Geosciences 2019, 9, 431. [Google Scholar] [CrossRef]
  35. Vaverková, M.D.; Maxianová, A.; Winkler, J.; Adamcová, D.; Podlasek, A. Environmental consequences and the role of illegal waste dumps and their impact on land degradation. Land Use Policy 2019, 89, 104234. [Google Scholar]
  36. Yeşiller, N.; Hanson, J.L.; Kopp, K.B.; Yee, E.H. Heat management strategies for MSW landfills. Waste Manag. 2016, 56, 246–254. [Google Scholar]
  37. U.S. Census Bureau. TIGER/Line Shapefile. Available online: https://catalog.data.gov/dataset/tiger-line-shapefile-2017-state-north-carolina-current-block-group-state-based (accessed on 15 October 2024).
  38. Geology and Mineral Resources. Virginia Department of Energy. Available online: https://energy.virginia.gov/webmaps/GeologyMineralResources/ (accessed on 1 September 2024).
  39. SafeHome Ultimate Drinking Water Test Kit. SafeHome Test Kits. Available online: https://safehometestkits.com/product/safe-home-ultimate-drinking-water-test-kit-lab (accessed on 1 September 2024).
  40. Cambon, J.; Hernangómez, D.; Belanger, C.; Possenriede, D. tidygeocoder: An R package for geocoding. J. Open Source Softw. 2021, 6, 3544. [Google Scholar]
  41. R Core Team. R: A Language and Environment for Statistical Computing; R Foundation for Statistical Computing: Vienna, Austria, 2021. [Google Scholar]
  42. Iqbal, A.; Tabinda, A.B.; Yasar, A. Environmental risk assessment of a young landfill site and its vicinity for possible human exposure. Hum. Ecol. Risk Assess. Int. J. 2021, 27, 258–273. [Google Scholar]
  43. Talalaj, I.A.; Biedka, P. Use of the landfill water pollution index (LWPI) for groundwater quality assessment near the landfill sites. Environ. Sci. Pollut. Res. 2016, 23, 24601–24613. [Google Scholar]
  44. Budnick, L.D.; Sokal, D.C.; Falk, H.; Logue, J.N.; Fox, J.M. Cancer and birth defects near the Drake Superfund site, Pennsylvania. Arch. Environ. Health Int. J. 1984, 39, 409–413. [Google Scholar] [CrossRef] [PubMed]
  45. Goldberg, M.S.; Al-Homsi, N.; Goulet, L.; Riberdy, H. Incidence of cancer among persons living near a municipal solid waste landfill site in Montreal, Quebec. Arch. Environ. Health Int. J. 1995, 50, 416–424. [Google Scholar] [CrossRef] [PubMed]
  46. Abiriga, D.; Vestgarden, L.S.; Klempe, H. Groundwater contamination from a municipal landfill: Effect of age, landfill closure, and season on groundwater chemistry. Sci. Total Environ. 2020, 737, 140307. [Google Scholar] [CrossRef] [PubMed]
  47. Sengupta, P. Potential health impacts of hard water. Int. J. Prev. Med. 2013, 4, 866. [Google Scholar]
  48. Dargahi, A.; Shokri, R.; Mohammadi, M.; Azizi, A.; Tabandeh, L.; Jamshidi, A.; Beidaghi, S. Investigating of the corrosion and deposition potentials of drinking water sources using corrosion index: A case study of Dehloran. J. Chem. Pharm. Sci. 2016, 974, 2115. [Google Scholar]
  49. Sherrard, J.H.; Moore, D.R.; Dillaha, T.A. Total dissolved solids: Determination, sources, effects, and removal. J. Environ. Educ. 1987, 18, 19–24. [Google Scholar] [CrossRef]
  50. Adjovu, G.E.; Stephen, H.; James, D.; Ahmad, S. Measurement of total dissolved solids and total suspended solids in water systems: A review of the issues, conventional, and remote sensing techniques. Remote Sens. 2023, 15, 3534. [Google Scholar] [CrossRef]
  51. Dietrich, A.M.; Devesa, R. Characterization and removal of minerals that cause taste. In Taste and Odour in Source and Drinking Water: Causes, Controls, and Consequences; IWA Publishing: London, UK, 2019; pp. 113–142. [Google Scholar]
  52. Adams, H.; Burlingame, G.; Ikehata, K.; Furatian, L.; Suffet, I.H. The effect of pH on taste and odor production and control of drinking water. AQUA—Water Infrastruct. Ecosyst. Soc. 2022, 71, 1278–1290. [Google Scholar] [CrossRef]
  53. Ozsvath, D.L. Fluoride and environmental health: A review. Rev. Environ. Sci. Bio/Technol. 2009, 8, 59–79. [Google Scholar] [CrossRef]
  54. Kabir, H.; Gupta, A.K.; Tripathy, S. Fluoride and human health: Systematic appraisal of sources, exposures, metabolism, and toxicity. Crit. Rev. Environ. Sci. Technol. 2020, 50, 1116–1193. [Google Scholar] [CrossRef]
  55. Soni, R. A comparative study of acid water treatment by grasses. Sustain. Agri. Food Environ. Res. Discontin. 2023, 12. [Google Scholar] [CrossRef]
  56. Bondy, S.C. Prolonged exposure to low levels of aluminum leads to changes associated with brain aging and neurodegeneration. Toxicology 2014, 315, 1–7. [Google Scholar] [PubMed]
  57. Bondy, S.C. Low levels of aluminum can lead to behavioral and morphological changes associated with Alzheimer’s disease and age-related neurodegeneration. Neurotoxicology 2016, 52, 222–229. [Google Scholar] [CrossRef] [PubMed]
  58. Mirlohi, S. Characterization of metallic off-flavors in drinking water: Health, consumption, and sensory perception. Int. J. Environ. Res. Public Health 2022, 19, 16829. [Google Scholar] [CrossRef]
  59. Shaikh, M.; Birajdar, F. Ensuring Purity and Health: A Comprehensive Study of Water Quality Testing Labs in Solapur District for Community Well-being. Int. J. Innov. Sci. Res. Technol. 2024, 9, 271–281. [Google Scholar]
  60. Legg, R.; Prior, J.; Adams, J.; McIntyre, E. The relations between mental health and psychological wellbeing and living with environmental contamination: A systematic review and conceptual framework. J. Environ. Psychol. 2023, 87, 101994. [Google Scholar] [CrossRef]
  61. Dieter, C.A.; Maupin, M.A. Public Supply and Domestic Water Use in the United States, 2015; US Geological Survey: Reston, VA, USA, 2017.
  62. MacDonald Gibson, J.; Pieper, K.J. Strategies to improve private-well water quality: A North Carolina perspective. Environ. Health Perspect. 2017, 125, 076001. [Google Scholar]
  63. Stillo, F.; MacDonald Gibson, J. Exposure to Contaminated Drinking Water and Health Disparities in North Carolina. Am. J. Public Health 2017, 107, 180–185. [Google Scholar] [CrossRef]
  64. Spaur, M.; Lombard, M.A.; Ayotte, J.D.; Harvey, D.E.; Bostick, B.C.; Chillrud, S.N.; Navas-Acien, A.; Nigra, A.E. Associations between private well water and community water supply arsenic concentrations in the conterminous United States. Sci. Total Environ. 2021, 787, 147555. [Google Scholar] [CrossRef]
  65. Gibson, J.M.; Fisher, M.; Clonch, A.; MacDonald, J.M.; Cook, P.J. Children drinking private well water have higher blood lead than those with city water. Proc. Natl. Acad. Sci. USA 2020, 117, 16898–16907. [Google Scholar] [CrossRef]
  66. Cassidy-Bushrow, A.E.; Sitarik, A.R.; Havstad, S.; Park, S.K.; Bielak, L.F.; Austin, C.; Johnson, C.C.; Arora, M. Burden of higher lead exposure in African-Americans starts in utero and persists into childhood. Environ. Int. 2017, 108, 221–227. [Google Scholar] [CrossRef] [PubMed]
  67. American Public Health Association. Creating the Healthiest Nation: Water and Health Equity; American Public Health Association: Washington, DC, USA, 2018. [Google Scholar]
  68. Mohai, P.; Pellow, D.; Roberts, J.T. Environmental justice. Annu. Rev. Environ. Resour. 2009, 34, 405–430. [Google Scholar] [CrossRef]
  69. Heaney, C.D.; Wing, S.; Wilson, S.M.; Campbell, R.L.; Caldwell, D.; Hopkins, B.; O’Shea, S.; Yeatts, K. Public infrastructure disparities and the microbiological and chemical safety of drinking and surface water supplies in a community bordering a landfill. J. Environ. Health 2013, 75, 24–37. [Google Scholar]
  70. Levin, R.; Villanueva, C.M.; Beene, D.; Cradock, A.L.; Donat-Vargas, C.; Lewis, J.; Martinez-Morata, I.; Minovi, D.; Nigra, A.E.; Olson, E.D.; et al. US drinking water quality: Exposure risk profiles for seven legacy and emerging contaminants. J. Expo. Sci. Environ. Epidemiol. 2024, 34, 3–22. [Google Scholar] [CrossRef]
Figure 1. Spatial distribution of water sampling locations for T.R.U.T.H. Project participants. The red dot denotes the location of the landfill, and the red lines denote streams proximate to it. Blue lines denote streams in the study area, and the blue shaded area denotes the portion of the James River that is in Charles City County. Participant locations have been randomly jittered by a small radius to protect confidentiality.
Environments 12 00103 g001
Figure 2. Analytes with the greatest number of “Fair” or worse ratings. N = 121. Blue, green, and red dots denote physical properties, metals, and inorganics, respectively. Groupings of analytes are based on those provided by the water testing manufacturer. It is possible to consider metals as inorganics.
Environments 12 00103 g002
Figure 3. Analytes with the greatest number of “Poor” or worse ratings. N = 121. Blue, green, red, and purple dots denote physical properties, metals, inorganics, and semi-volatile organic solvents, respectively. Groupings of analytes are based on those provided by the water testing manufacturer. It is possible to consider metals as inorganics.
Environments 12 00103 g003
Figure 4. Analytes with the greatest number of “Bad” ratings. N = 121. Blue and red dots denote physical properties and metals, respectively. Groupings of analytes are based on those provided by the water testing manufacturer. It is possible to consider metals as inorganics.
Environments 12 00103 g004
Figure 5. Spatial distribution of T.R.U.T.H. Project participants with “Poor” or “Bad” ratings for water hardness as CaCO3 (pink dots), “Bad” ratings for water pH (orange dots), or neither of these (black dots). The red dot denotes the location of the landfill, and the red lines denote streams proximate to it. Blue lines denote streams in the study area, and the blue shaded area denotes the portion of the James River that is in Charles City County. Participant locations have been randomly jittered by a small radius to protect confidentiality.
Environments 12 00103 g005
Table 1. Summary of significant associations from logistic regression models for drinking water analytes and exposures to landfill and proximate streams.
AnalyteOutcomeExposurep-ValueOdds Ratio
(95% Confidence Interval)
Zinc
(Metals)
Fair or worseStream, <1 mi0.0152.63 (1.23, 5.86)
Turbidity
(Physical properties)
Fair or worseStream, <1 mi0.0284.31 (1.31, 19.53)
Hardness as CaCO3
(Physical properties)
Poor or worseStream, <0.5 mi0.01310.71 (1.64, 86.96)
Water pH
(Physical properties)
BadLandfill, <1 mi0.02610.50 (1.16, 95.68)
Disclaimer/Publisher’s Note: The statements, opinions and data contained in all publications are solely those of the individual author(s) and contributor(s) and not of MDPI and/or the editor(s). MDPI and/or the editor(s) disclaim responsibility for any injury to people or property resulting from any ideas, methods, instructions or products referred to in the content.

