Abstract
This study investigates the effect of different microalgae diets on the microbiomes associated with the marine copepod Acartia tonsa. Copepods were fed with two different mixed-diet compositions: (i) Isochrysis galbana (ISO) and Rhinomonas reticulata (RHI)—(ISO + RHI) and (ii) ISO and Rhodomonas baltica (RHO)—(ISO + RHO). 16S rDNA metabarcoding and comparative statistic have been adopted to study microbial diversity associated with algae and copepods. Diversity index, taxonomic profiling, and statistically significant taxa differential abundances were evaluated with reference to the different algal and copepod microbiomes. Results showed that the different feeding regimes shape different copepod microbial communities. The abundance of Vermiphilaceae, OM190, KI89A_clade, Cyanobium_PCC-6307, and Cyclobacteriaceae increased in copepod microbiomes independently by the feeding regimes. On the other hand, Tistlia sp., Bradymonadales, and Alteromonadaceae were differentially enriched in copepod microbiomes in relation to the different feeding regimes. Differences in the microbial community composition between ISO + RHI and ISO + RHO were observed, suggesting that the specific algal diet plays a pivotal role in shaping microbiome structure.
1. Introduction
Copepods, small crustaceans belonging to the subclass Copepoda, are the most abundant animals in the ocean [1]. They serve as a critical link between primary producers and higher trophic levels in marine food webs [2,3] and represent a cornerstone of marine ecosystem productivity and function. Copepods may account for over 60% of the biomass of zooplankton in marine ecosystem, underscoring their importance as a primary food source for higher trophic levels [4,5]. By dominating zooplankton biomass, copepods significantly contribute to global biogeochemical cycles, including carbon sequestration via the biological pump and nutrient recycling [6]. Their role extends beyond energy transfer, as they are crucial vectors for essential compounds like polyunsaturated fatty acids (PUFAs), including omega-3 fatty acids such as DHA and EPA, which are vital for vertebrate health, particularly brain function and cellular integrity [7,8].
Acartia tonsa [9] is a widely distributed calanoid copepod which thrives in subtropical and temperate coastal waters and exhibits remarkable tolerance to salinity fluctuations (5–35 PSU), making it an integral species in estuarine and marine food webs [10,11]. As a primary food source for many fish larvae, A. tonsa directly influence fish recruitment and population dynamics [12,13]. Furthermore, its adaptability to laboratory conditions has established A. tonsa as a preferred model organism in ecotoxicology, aquaculture, and ecological research [14,15,16,17,18,19,20].
Acartia tonsa is a herbivorous species and phytoplanktonic microalgae provide essential nutrients for their growth and development [21]. Recently, the role of microbial communities, particularly bacteria, in health, nutritional metabolism, and immune functions of copepods is increasingly recognized. Microbial symbionts contribute to copepod survival and productivity by aiding in the digestion of food, synthesis of essential nutrients, and protection against pathogens [22,23,24]. Furthermore, the interactions between microalgae and bacteria influence algal growth and improve nutrient cycling [17,25]. Copepod-microbial interactions, shaped by dietary inputs like microalgae, may influence copepod physiology and functionality [26]. Microalgae–bacteria consortia further modulate these dynamics, as certain bacterial species provide essential vitamins, such as B12, and metabolites, facilitating the growth and survival of both algae and copepods [27,28,29].
In this study, we conducted 16S rDNA metabarcoding to analyze the microbiome characterizing three monoalgal cultures, Isochrysis galbana (ISO), Rhinomonas reticulata (RHI), and Rhodomonas baltica (RHO), used in two different combinations as food for A. tonsa copepod. More precisely, the microbiomes of A. tonsa fed two different mixed-algal foods: (i) I. galbana and R. reticulata (ISO + RHI) and (ii) I. galbana and R. baltica (ISO + RHO). ISO was used as the baseline diet in both feeding groups due to its high di-gestibility, balanced fatty acid profile, and widespread use in copepod larval culture. [30]. The choice of the dietary regime was selected for the following reasons. ISO ensured that copepods received adequate essential nutrients, particularly EPA and DHA, facilitating meaningful comparisons between treatments [31,32]. RHI and RHO were selected as secondary algae components because they both belong to the Cryptophyceae class but differ in pigment composition, biochemical properties, and potential functional properties. RHI has a unique ultrastructure and hydrocarbon degradation capacity, potentially providing unique bioactive compounds [33]. On the other hand, RHO is rich in phycoerythrin pigments, which stimulate feeding responses in zooplankton while also providing high quality polyunsaturated fatty acids [34]. Diversity indexes (Chao1, Hill–Shannon, Hill–Simpson), beta diversity (PCoA), taxonomic profiling, and statistically significant taxa differential abundances (ANCOM-BC) were evaluated with reference to the different algal and copepod microbiomes. The aim was to compare bacterial community structure and diversity across monoalgal and copepod mixed-diet feeding regimes, in order to evaluate how dietary complexity influences the microbiome of A. tonsa.
2. Materials and Methods
2.1. Microalgal Culture
Three species of microalgae, Isochrysis galbana [35]., (ISO), Rhinomonas reticulata [36] (RHI), and Rhodomonas baltica [37] (RHO), were cultured separately in 1 L sterile conical flasks [35,36,37,38]. The cultures were aerated to maintain suspension and provided with a 14:10 h light/dark photoperiod, as described in Zhang et al. [21]. The culture medium used was F/2 medium [39], prepared with 0.45 μm filtered seawater (FSW) with a salinity of 30 Practical Salinity Units (PSU), corrected with MilliQ water. The cultures were maintained at a stable temperature of 20 ± 1 °C. For DNA extraction, monoalgal cultures (100 mL) were collected at the concentrations of 8.48 × 10⁵, 3.13 × 10⁵, and 20.0 × 10⁵ cells/mL, respectively, for ISO, RHI, and RHO. Samples were centrifuged at 14,000× g for 15 min, and the resulting pellets were transferred into 1.5 mL sterile centrifuge tubes and stored at −80 °C until DNA extraction.
2.2. Copepod Culture
One thousand eggs of A. tonsa were collected from the main copepod culture reared in ISPRA. Two groups of 500 eggs each were transferred to a 500 mL glass beaker filled with 0.22 μm FSW at the same salinity (30 PSU) and temperature (20 ± 1 °C) of the main culture. Hatched copepods in each group were then fed as follows: one group with a mixture of ISO + RHI and the other with ISO + RHO. Mixed algae were supplied at 3000 µg Carbon/L for the first three days. On the 4th day, nauplii and egg stages were observed, and the cultures were transferred to 1 L beakers. The feeding concentration was then reduced to 1500 µg Carbon/L supplied every two days. After 11 days, nearly all individuals became copepodites and after 14 days a new generation of nauplii (F1) was observed and the cultures were transferred to 2 L beakers. After almost 80 days, copepod culture (F3) from each feeding group was filtered and 500 individuals > 130 μm size were stored at −80 °C for DNA extraction. For each experimental group, three replicates were considered.
2.3. DNA Extraction and 16S rRNA Sequencing
Almost 500 A. tonsa copepods > 130 μm were collected, as described above, for DNA extraction to analyze their associated microbiome, following a modified protocol from Moisander et al. [40], which combines mechanical freezing–thawing cycles with enzymatic lysis. All collected copepods were processed to evaluate variability due to the diet regime on the animals, in cases where the diet itself might be a source of variability in dietary supply, while avoiding unnecessary analysis of variability between individual animals. After removing the samples from the freezer, 360 µL of Lysis Buffer ATL (QIAamp DNA Micro Kit, Qiagen, Germantown, MD, USA) was added to each sample. The samples were subjected to three cycles of freezing at −80 °C for 30 min, followed by thawing at 65 °C for 10 min to ensure effective cell lysis. To assess whether microbiomes were carried by the copepods or the food algae, we also extracted DNA from monoalgal cultures. Approximately 0.02 g of high-concentration centrifuged algae was used per sample for DNA extraction.
The quantity of DNA was measured using a Qubit 3.0 Fluorometer (ThermoFisher Scientific, Milan, Italy). The DNA purity and quality was determined spectrophotometrically (Biotek Powerwave Xs Microplate Spectrophotometer, Milan, Italy) by measuring absorbance at 260/280 and 260/230 nm. The primers used for amplifying the 16S rRNA gene were as follows: the forward primer 515F-GTGCCAGCMGCCGCGGTAA and the reverse primer 907R-CCGTCAATTCCTTTGAGTTT, amplifying 374 bp the fourth and fifth hypervariable (V4–V5) region of the 16S rRNA gene [41]. The sequencing library was prepared by Novogene company (Hong Kong). Illumina sequencing was performed using the Illumina NovaSeq 6000 platform, amplifying 250 bp forward and reverse of the V4-V5 374 bp amplified region. The raw sequencing data have been submitted to the NCBI database under the accession number PRJNA1288420.
2.4. Bioinformatics Analyses
The 250 bp paired-end reads generated from sequencing the 16S libraries of different metagenomes were first demultiplexed based on unique barcodes assigned to each sample by Novogene. These barcodes were then removed using Cutadapt v4.6 [42]. The resulting reads were then clustered into Amplicon Sequence Variants (ASVs) using the DADA2 plugin v1.26 with QIIME2 v2023.2 [43,44,45]. The forward and reverse reads were merged, followed by quality filtering (requiring a minimum Phred-scaled quality score of 10), and the removal of potential chimeric sequences. Reference data from SILVA 138.2 (99% OTUs, 16S rRNA) (https://www.arb-silva.de/ accessed on 1 September 2025), targeting the relevant hypervariable region, were processed and curated using the QIIME 2 RESCRIPt plugin v2023.2.0 [46] to build a region-specific Naive Bayes classifier, which was then used to assign taxonomy to the DADA2-derived ASVs. Chloroplast-derived 16S rRNA gene sequences—here barely co-amplified by bacterial 16S primers—were removed during the quality control filtering step as they do not represent bacterial community members.
The ASV abundance data obtained through the QIIME2 pipeline were normalized using the coverage-based method (0.9950 ± 0.0025), implemented with iNEXT v3.0.2 (https://besjournals.onlinelibrary.wiley.com/doi/10.1111/2041-210X.12613 accessed on 1 September 2025). Alpha diversity was evaluated as the Hill–Simpson, Hill–Shannon diversity, and the Chao1 richness estimator, using the metagMisc_R package v0.5.0 [47,48,49]. Statistical significance of diversity indices was assessed using non-parametric measures ANOVA, followed by post hoc Dunn tests, implemented with the nparLD v2.2 and rstatix v0.7.2 packages [50]. Furthermore, rarefaction curves for observed species were constructed based on the coverage threshold. Beta diversity was estimated through Principal Coordinate Analysis (PCoA) using weighted UniFrac distances, conducted with the Phyloseq v1.41.1 and Vegan v2.6–4 packages [51,52].
In the taxonomic heatmap, the color scale represents the Z-score values of each taxon across the samples. The Z-score is calculated as the difference between the relative abundance of a taxon in a given sample and its mean relative abundance across all samples, divided by the standard deviation. Positive Z-scores indicate that a taxon is more abundant in that sample compared to its overall average, while negative Z-scores indicate that its abundance is lower than the mean. This standardization highlights relative differences in abundance patterns, allowing the identification of taxa that are enriched or depleted in specific samples or groups, regardless of their absolute abundance.
The core microbiome was defined as taxa with a relative abundance greater than 0.1% in each sample and present in at least 50% of all samples. More specifically, a taxon was considered part of the core microbiome if it was detected in at least two of the three sequencing replicates per sample, using the microbiome package v1.24.0 [45].
3. Results
3.1. Bacterial Community Diversity
In relation to the16S rDNA metabarcoding analysis, a total of 963,710 raw reads were processed. These latter corresponded to a medium value of 64,247 total reads per microbiomes (ISO 63,708; RHI 63,434; RHO 63,577; ISORHI 65,911; ISORHO 64,605). The filtering processes returned a total of 893,966 reads grouped in the following medium value per microbiome: ISO 60,004; RHI 59,204; RHO 59,751; ISORHI 61,667; ISORHO 57,361. The merging returned a total of 770,121 reads grouped in the following medium value per microbiome: ISO 57,503; RHI 54,910; RHO 56,310; ISORHI 53,468; ISORHO 34,514. The chimera removal step returned a total of 713,119 ASVs, grouped in the following medium value per microbiome: ISO 48,491; RHI 53811; RHO 54,950; ISORHI 48,462; ISORHO 31,991. These latter reads corresponded to 3,085 unique ASVs which will hereinafter be referred to as taxa (see Supplementary Information: ASV table, Taxonomy table, ASV sequences).
The core microbiome analysis (Figure 1) showed that only 64 ASVs were shared among the five microbiomes, indicating that most of the bacteria were specifically distributed in the different groups. The copepods fed with mixed algae ISO + RHI (1136 ASVs) and ISO + RHO (1219 ASVs) had the largest number of ASVs, with 819 and 857 unique ASVs, respectively. In contrast, ISO microalgal culture exhibited the lowest bacterial richness, the total number of ASVs (347) and unique ASVs (222).
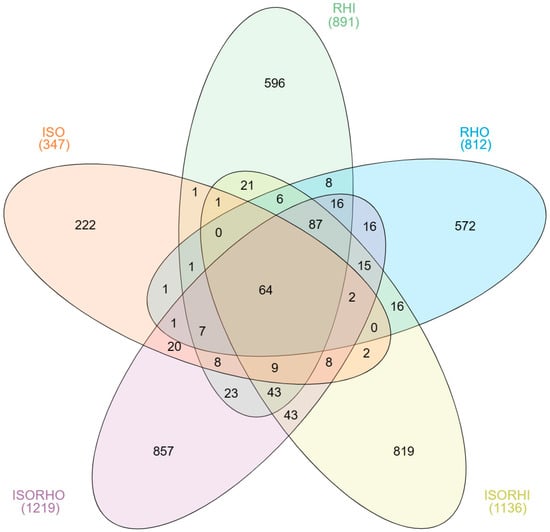
Figure 1.
Venn diagrams show the unique and shared ASVs among the three microalgae and the two copepod core microbiomes.
Alpha diversity analysis showed that there were no significant differences between the different analyzed microbiomes in terms of richness, biodiversity, and evenness, with the sole exception of the ISO microbiome that showed a lower richness with reference to the copepod group fed with the combination ISO + RHI (ISORHI) and ISO + RHO (ISORHO) (Figure 2A). Although any statically significant difference has been observed, a trend can be described. A tendency towards higher bacterial richness was observed in the two copepod culture groups. The Hill–Shannon index results showed that the diversity of the ISO microbiome was the lowest, followed by the RHO one (Figure 2B). The diversity indices of RHI, ISORHI, and ISORHO microbiomes were relatively high, with similar median values, even though the standard deviation of the ISORHO microbiome was relatively large. The trend of the Hill–Simpson index (Figure 2C) was similar to the Hill–Shannon one. The microbiome diversity of the microalgae ISO and RHO alone was relatively low compared with RHI.
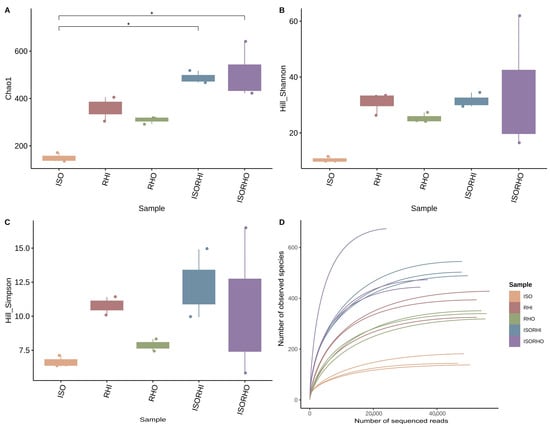
Figure 2.
Chao1 index (A), Hill–Shannon (B), Hill–Simpson index (C), each calculated after rarefaction to a coverage of 99.5%, and rarefaction curves of observed species of bacterial community composition (D). Rarefaction curves display the relationship between sequencing depth and the number of observed species, allowing the assessment of sampling completeness and comparison of species richness among groups. Box and whiskers represent the minimum (Q0), 1st quartile (Q1), median (Q2), 3rd quartile (Q3), and maximum (Q4) of each group. Reported p-value is calculated by the Kruskal–Wallis test (α = 0.05). Post hoc statistical test is based on the Dunn test with Benjamini–Hochberg correction for multiple comparisons. (*) Significant difference between the groups p < 0.05.
Rarefaction curves assessed the adequacy of sequencing depth and confirmed the tendency towards higher bacterial richness of the microbiome associated with copepods fed two different algal regimes (Figure 2D).
Beta analysis revealed distinct bacterial community compositions across the five microbiomes (Figure 3). In particular, the microbiome associated with ISO was the most distinct and had the largest separation from all other groups. The microbiomes of RHI and RHO were closely clustered, indicating similar bacterial compositions. In addition, the copepod groups fed on mixed algae (ISORHI and ISORHO) showed similar microbiome compositions among each other but distinct from the one associated with the three monoalgal cultures.
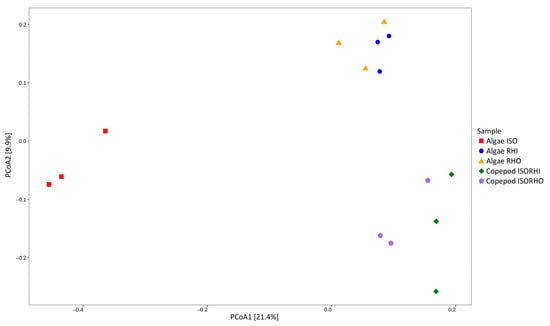
Figure 3.
Principal component analysis (PCoA) represents microalgae and copepod microbiomes, based on weighted UniFrac distance for each sample replicate, without taxonomic filtering or aggregation. Colors and shape indicate time category for each datapoint. The percentage reported on axes represents the amount of total variance depicted by each.
3.2. Microbiome Taxonomic Composition
The heatmap of the 40 most abundant bacterial species showed differences in the microbial community structure of the five groups (Figure 4). Among the most represented taxa across all the microbiomes, the genera Marivita (14.26%), Oceanicaulis (7.83%), and Muricauda (3.01%) showed higher abundance in the monoalgal ISO group with reference to the other groups. On the other hand, the dominant genus Cyanobium_PCC-6307 (13.45%) was significantly represented at high relative abundance in the ISO + RHI copepod microbiome, even though not highly represented in any of the monoalgal microbiome. In addition, genus Phaeodactylibacter (4.27%) and SMA102 (2.96%) showed higher abundance in the monoalgal ISORHI group with reference to the other. In the ISO + RHI copepod, the most represented bacterial genera were not dominant either in the three monoalgal microbiomes and in the ISO + RHO copepod microbiome. The genera Jannaschia (9.37%) and Vibrio (2.49%) showed higher abundance in the microbiome of copepod ISORHO. The genera Winogradskyella, Tropicimonas, and Arenibacter showed the highest relative abundance in the RHI microbiome. The genera Gilvibacter had the highest bacterial abundance in the RHO microbiome. However, these bacterial genera of monoalgal RHI and RHO were not dominant across all the microbiomes; the proportion ranges from 0.26% to 2.48%.
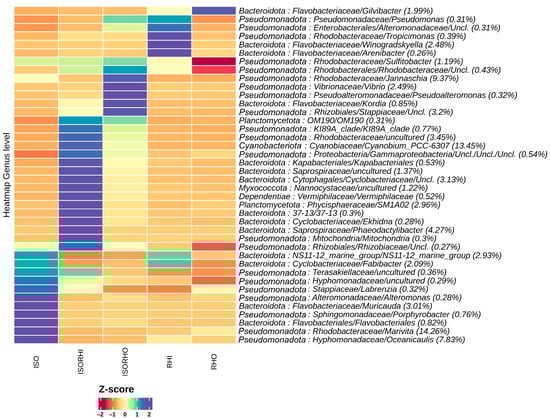
Figure 4.
The heatmap of microalgae and copepod microbiomes showing the relative abundance of the 40 most abundant bacterial species in the different microbiomes at the genus level. Hierarchical clustering was performed on columns by Pearson correlation, based on Euclidean distance. The color scheme represents row-wise Z-scores of ASV counts. The percentage reported near ASV names represent the relative abundance of the sum of ASV counts per sample against total sum (i.e., Z = 0 matches reported percentage).
To better analyze possible differences in copepod microbiomes potentially related to dietary regime, an analysis of compositions of microbiomes with bias correction (ANCOM-BC) was performed to identify significant differences in abundance at the genus and family levels in the different microbiomes (Figure 5).
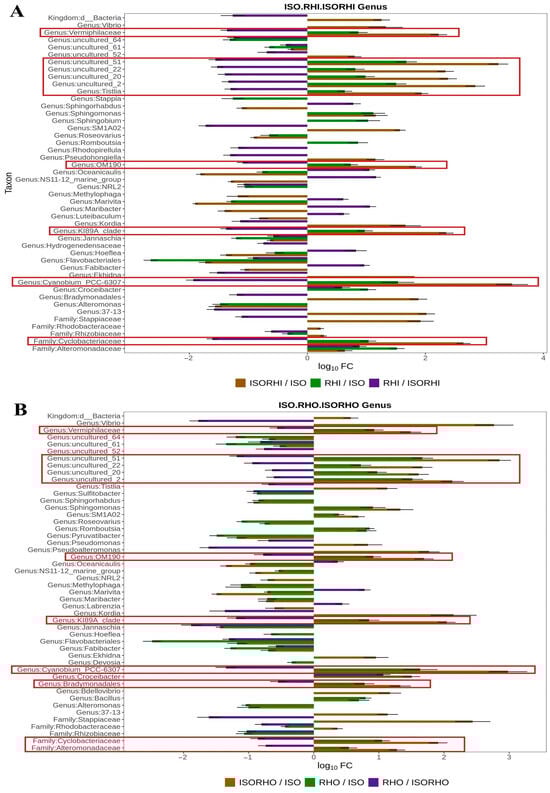
Figure 5.
Log10 fold change (log10FC) in the relative abundance of associated bacterial taxa comparing monoalgal cultures and copepods fed mixed-algal diets. (A) Comparisons among monoalgal ISO and RHI cultures and copepods fed the mixed-ISO + RHI diet. (B) Comparisons among monoalgal ISO and RHO cultures and copepods fed the mixed-ISO + RHO diet. Bars show taxa identified by ANCOM-BC2 as exhibiting a statistically significant increase or decrease in contribution in at least one pairwise comparison; multiple-comparison correction is applied internally by the ANCOM-BC2 procedure. Positive log10FC values indicate higher relative abundance in copepods fed mixed algae versus monoalgal cultures, negative values indicate lower relative abundance. The red rectangles refer to the taxa that increase significantly in relative abundances in the copepod with reference to the algae providing dietary supply.
Results revealed that there were differences in bacterial abundance and adaptability between monoalgal culture and mixed-algal feeding copepod groups. In the comparison between ISO, RHI, and ISORHI (Figure 5A), the families Vermiphilaceae, Cyclobacteriaceae, genera Tistlia, Cyanobium_PCC-6307, OM190, KI89A_clade, the uncultured 51, uncultured 22, uncultured 20, and uncultured 2 were more abundant in the monoalgal RHI microbiome than in the ISO one. At the same time, the above bacteria abundance increased in the copepod ISORHI microbiome with respect to the monoalgal ISO and to RHI cultures.
In comparison between ISO, RHO, and ISORHO microbiomes (Figure 5B), the bacte-rial order Bradymonadales, families Vermiphilaceae, Cyclobacteriaceae, and Alteromonadaceae, genera Cyanobium_PCC-6307, OM190, KI89A_clade, and the uncultured 51, uncultured 22, uncultured 20, uncultured 2 were more abundant in RHO microbiome when compared to the ISO one. At the same time, the above-mentioned bacteria were more abundant in the copepod ISORHO microbiomes with reference to the ISO and RHO microbiomes.
Results obtained showed that the bacterial taxa that increase in representativeness in the copepod microbiomes were more abundant in monoalgal RHI and RHO microbiomes with reference to the ISO one. Bacterial taxa increased significantly in the monoalgal RHI and RHO microbiomes and in the copepod microbiomes. Table 1 reports the similarities and the differences in the contribution of the different diets to the microbiomes of the copepods.

Table 1.
Bacterial species that show a higher representativeness in both RHI and RHO monoalgal microbiomes with reference to ISO, increasing in representativeness also in the copepod microbiomes.
4. Discussion
Bacterial communities are crucial for maintaining copepod growth and well-being as they play key roles in pathogen resistance, immune regulation, and nutrient cycling [25,53]. The use of various microalgae diets to culture copepods and improve their nutritional intake enhances larval performance, e.g., monoalgal diets can negatively affect reproductive output and naupliar survival [21,30,54]. However, research on how differences in diets and changes in copepod-associated microbiota affect copepod development remains limited. Moreover, detailed studies of the changes in the copepod microbial ecology in response to different algal feeding regimes, in terms of taxonomy, are also still missing.
In this study, we compared the bacterial composition in monoalgal microbiomes and copepod cultures fed with different mixed algae. This comparison aimed to investigate the effect of dietary diversity in shaping the bacterial communities associated with the copepod A. tonsa.
We observed a unique bacterial community in the ISO microalgal culture, with the lowest richness and diversity among the different microbiomes observed. In contrast, the RHI and RHO monoalgal cultures were associated with a higher richness that increased significantly if the copepods were fed with the two different algal mixtures. Both the core microbiome analysis and the taxonomic profile of the most represented bacterial species in the five analyzed microbiomes evidenced significant differences in the microbial composition of the monoalgal culture and the two copepod microbiomes. These differences were associated with a particular clusterization of beta diversity, where the ecology of the monocultural ISO algae resulted to be distant from the one of the RHI and RHO. On the other hand, these latter were similar but distinct from the one of the copepods fed under the two diet regimes. In fact, the copepod microbiomes were clustering separately but showed more reciprocal similarity with respect to the other analyzed microbiomes. Copepods fed with mixed-algal diets exhibited higher bacterial richness and diversity of all the groups observed, suggesting the importance of dissecting the effect of the complexity of the diet in shaping the copepod microbiome. In this direction, our results showed that in copepod microbiomes of the ISORHI group, Cyanobium_PCC-6307, Phaeodactylibacter, and SMA102 were predominant. On the other hand, in ISORHO group, Jannaschia and Vibrio were more prevalent. Some of these highly enriched bacteria are also considered to be beneficial bacteria for aquatic organisms. Cyanobium_PCC-6307 acts as a probiotic by enhancing the photosynthetic efficiency of Symbiodiniaceae under high-temperature conditions, thereby supporting coral health and resilience to environmental stress [55]. Phaeodactylibacter contributes to improving water quality in crab larviculture by participating in nitrogen removal through heterotrophic nitrification and denitrification, highlighting its beneficial role in recirculating aquaculture systems [56]. SMA102 is a potentially beneficial symbiotic bacterium that promotes the recovery and stability of the core functional bacterium Candidatus brocadia in the reactor, thereby supporting the restoration of nitrogen removal performance [57]. Vibrio sp. 01, isolated from copepod carcasses, possesses ester bond hydrolysis capabilities and has the potential to participate in the degradation process of bioplastic PBSA [58]. However, Jannaschia showed to induce a low feeding and assimilation rate in copepods [59].
An accurate quantitative assessment of differential abundance in microbiome data by correcting for compositional bias is a crucial approach and tool for identifying truly significant microbial changes across the different microbiomes. Results obtained showed that the most significant effect of the diet on the copepod microbiome derived from the monoalgal RHI and RHO. In fact, several bacterial taxa shared between the three algae resulted to be more abundant in the RHI and RHO microbiomes when compared to the ISO microbiome. Interestingly the same taxa showed a significant increment in representativeness also in the copepod’s microbiome with reference to the algal microbiomes as well. The bacterial taxa Vermiphilaceae, OM190, KI89A_clade, Cyanobium_PCC-6307, and Cyclobacteriaceae are consistently favored under both feeding regimes, as evidenced by their increased relative abundance in both ISORHI and ISORHO copepod microbiomes. These bacterial taxa may represent microbial groups particularly responsive to the presence of copepods or to trophic interactions associated with mixed-algal environments. Despite this overlap, distinct differences in the microbial community composition between ISORHI and ISORHO microbiomes were observed, suggesting that the specific algal diet influences the copepod microbiome structure.
Notably, the relative abundance of Tistlia sp. increased in the ISORHI microbiome, and Bradymonadales and Alteromonadaceae in the ISORHO one. As a beneficial microbe contributing to nitrogen fixation, the genus Tistlia holds ecological potential in saline environments [60]. Díaz-Cárdenas et al. [61] described Tistlia consotensis as a novel aerobic, nitrogen-fixing alphaproteobacterium with broad metabolic versatility and moderate halotolerance, suggesting its adaptability to saline and marine-like environments. These physiological traits indicate that Tistlia may play a beneficial role in nitrogen cycling and organic matter turnover within coastal or mild saline ecosystems. Gong et al. [62] found that Bradymonabacteria strains, under the order Bradymonadales, showed efficient predation ability under low-proportion mixed-culture conditions and were able to invade and eliminate adjacent prey colonies, indicating that they have strong ecological competitiveness and environmental adaptability. In combination with their broad-spectrum predation on a variety of prey, Bradymonabacteria shows potential in controlling drug-resistant pathogens and can be used as a new, environmentally friendly probiotic candidate in aquaculture. Moreover, Mu et al. [63] highlighted the ecological importance of Bradymonadales in saline environments, noting their widespread distribution and significant abundance in marine and salt-lake sediments. The distinct metabolic characteristics of Bradymonabacteria, including biosynthetic deficiencies and a strong starvation response, suggest a transitional strategy between obligate and facultative predation, with potential roles in both microbial community regulation and nutrient cycling. Smahajcsik et al. [64] demonstrated that members of the family Alteromonadaceae play a central role in the inhibition of aquaculture pathogens within complex algal-associated microbiomes. They found that Alteromonadaceae were consistently enriched in the most effective anti-Vibrio anguillarum communities derived from I. galbana, suggesting a direct or synergistic contribution to pathogen suppression. Previous studies have also reported that Alteromonadaceae are common members of the core microbiome of microalgae and copepods [65,66,67,68], highlighting their ecological relevance and potential as probiotic candidates in aquaculture.
5. Conclusions
In conclusion, this study demonstrates that bacterial taxa abundant in monoalgal cultures, particularly RHI and RHO, were also consistently abundant in the corresponding copepod microbiomes, suggesting possible microbial direct transfer from diet to host. The bacterial taxa Vermiphilaceae, OM190, KI89A_clade, and Cyanobium_PCC-6307 showed high relative abundance both in microalgae and copepods, suggesting their adaptability and potential ecological roles in nutrient cycling or algal degradation within the copepods. Differentially enriched bacteria in copepods fed with mixed-algal diets, such as Bradymonadales and Alteromonadaceae, were enriched specifically in the ISORHO microbiome, while Tistlia sp. exhibited an increased relative abundance exclusively in the ISORHI microbiome. These bacterial taxa have been described to enhance nitrogen fixation, organic matter cycling, and pathogen suppression, and might be useful in designing mixed diets according to specific ecological functional requirements. The results highlight the influence of dietary composition on copepod microbiome structure. Since copepods are hot spot of microbiome diversity in the sea, the putative functions of bacteria retained or enriched in copepods under the two different diet regimes interestingly play key roles in functions such as digestion, reproduction, and in antibiotic and marine biogeochemical cycles. Thus, diet-dependent microbial selection can be used to optimize microbiome composition in aquaculture applications. Since the copepod microbiome—composed of both the gut and external colonizing microbial communities as a whole—plays a role in providing beneficial microorganisms in aquaculture, our results are consistent with this assessment, and future dedicated experiments might provide new scenarios for cultivating beneficial microbiomes in organisms at higher trophic levels.
Supplementary Materials
The following supporting information can be downloaded at: https://www.mdpi.com/article/10.3390/environments12090325/s1.
Author Contributions
Conceptualization, J.F. and I.B.; methodology, I.B. and S.D.G.; software, J.F. and G.B.; validation, V.V.; formal analysis, J.F., I.B., S.D.G. and G.B.; investigation, J.F. and V.V.; resources, I.B.; data curation, J.F. and G.B.; writing—original draft preparation, J.F.; writing—review and editing, M.M., I.B. and S.D.G.; visualization, J.F. and G.B.; supervision, I.B., M.M. and X.Y.; project administration, I.B.; funding acquisition, J.F. and S.D.G. All authors have read and agreed to the published version of the manuscript.
Funding
This research was partially funded by the China Scholarship Council as PhD scholarship, grant number 202208330035 and by the Interreg Marittimo Italia-Francia 2021-2027 project: AQuaBioS: la fattoria del mare, per un’acquacoltura biologica e sostenibile (I43C2300018005) to ISPRA.
Data Availability Statement
The original contributions presented in this study are included in the article/Supplementary Material.
Acknowledgments
The authors have reviewed and edited the output and take full responsibility for the content of this publication.
Conflicts of Interest
The authors declare no conflict of interest.
Abbreviations
The following abbreviations are used in this manuscript:
| ISO | Isochrysis galbana |
| RHI | Rhinomonas reticulata |
| RHO | Rhodomonas baltica |
| PCoA | Principal Component Analysis |
| ANCOM-BC | An analysis of compositions of microbiomes with bias correction |
| FSW | Filtered seawater |
| DNA | Deoxyribonucleic Acid |
| ASVs | Amplicon Sequence Variants |
| log10FC | Log10 fold change |
References
- Humes, A.G. How many copepods? In Ecology and Morphology of Copepods; Ferrari, F.D., Bradley, B.P., Eds.; Springer: Dordrecht, The Netherlands, 1994; pp. 1–7. [Google Scholar]
- Mauchline, J. The Biology of Calanoid Copepods; Academic Press: Cambridge, MA, USA, 1998. [Google Scholar]
- Yang, K.; Jing, S.; Liu, Y.; Zhou, H.; Liu, Y.; Yan, M.; Yi, X.; Liu, R. Acute toxicity of tire wear particles, leachates and toxicity identification evaluation of leachates to the marine copepod, Tigriopus japonicus. Chemosphere 2022, 297, 134099. [Google Scholar] [CrossRef] [PubMed]
- Van Ginderdeuren, K. Zooplankton and Its Role in North Sea Food Webs: Community Structure and Selective Feeding by Pelagic Fish in Belgian Marine Waters. Ph.D. Thesis, Ghent University, Ghent, Belgium, 2013; pp. 1–226. [Google Scholar]
- Turner, J.T. The importance of small planktonic copepods and their roles in pelagic marine food webs. Zool. Stud. 2004, 43, 255–266. [Google Scholar]
- Verity, P.; Smetacek, V. Organism life cycles, predation, and the structure of marine pelagic ecosystems. Mar. Ecol. Prog. Ser. 1996, 130, 277–293. [Google Scholar] [CrossRef]
- Drouin, G.; Rioux, V.; Legrand, P. The n-3 docosapentaenoic acid (DPA): A new player in the n-3 long chain polyunsaturated fatty acid family. Biochimie 2019, 159, 36–48. [Google Scholar] [CrossRef] [PubMed]
- von Schacky, C. Importance of EPA and DHA blood levels in brain structure and function. Nutrients 2021, 13, 1074. [Google Scholar] [CrossRef]
- Dana, J.D. Conspectus crustaceorum, quae in orbis terrarum circumnavigatione, Carolo Wilkes, e classe Reipublicae foederatae duce, lexit et descripsit Jacobus D. Dana. Pars II. Proc. Am. Acad. Arts Sci. 1849–1852, 2, 9–61. [Google Scholar]
- Calliari, D.; Andersen Borg, M.C.; Thor, P.; Gorokhova, E.; Tiselius, P. Instantaneous salinity reductions affect the survival and feeding rates of the co-occurring copepods Acartia tonsa Dana and A. clausi Giesbrecht differently. J. Exp. Mar. Biol. Ecol. 2008, 362, 18–25. [Google Scholar] [CrossRef]
- Miller, D.D.; Marcus, N.H. The effects of salinity and temperature on the density and sinking velocity of eggs of the calanoid copepod Acartia tonsa Dana. J. Exp. Mar. Biol. Ecol. 1994, 179, 235–252. [Google Scholar] [CrossRef]
- Castonguay, M.; Plourde, S.; Robert, D.; Runge, J.A.; Fortier, L. Copepod production drives recruitment in a marine fish. Can. J. Fish. Aquat. Sci. 2008, 65, 1528–1531. [Google Scholar] [CrossRef]
- Marcus, N.H.; Wilcox, J.A. A Guide To The Meso-Scale Production of The Copepod Acartia tonsa. Florida State University: Tallahassee, FL, USA, 2007; pp. 1–29. Available online: https://repository.library.noaa.gov/pdfjs/web/viewer.html?file=/view/noaa/35372/noaa_35372_DS1.pdf (accessed on 16 June 2025).
- Zhou, C.; Vitiello, V.; Casals, E.; Puntes, V.F.; Iamunno, F.; Pellegrini, D.; Changwen, W.; Benvenuto, G.; Buttino, I. Toxicity of nickel in the marine calanoid copepod Acartia tonsa: Nickel chloride versus nanoparticles. Aquat. Toxicol. 2016, 170, 1–12. [Google Scholar] [CrossRef] [PubMed]
- Vu, M.T.T.; Hansen, B.W.; Kiørboe, T. The constraints of high-density production of the calanoid copepod Acartia tonsa Dana. J. Plankton Res. 2017, 39, 1028–1039. [Google Scholar] [CrossRef]
- Vitiello, V.; Oliva, M.; Renzi, M.; Cuccaro, A.; Fumagalli, G.; Anselmi, S.; Bentivoglio, T.; Matarazzi, I.; Sanna, V.; Pellegrini, D.; et al. Ecotoxicological assays with the calanoid copepod Acartia tonsa: A comparison between Mediterranean and Baltic strains. Water 2024, 16, 1171. [Google Scholar] [CrossRef]
- Ali, S.; Waqas, W.; Bakky, M.A.H.; Zada, S.; Saif, U.M.; Hasan, M.T.; Shafiq, M.; Dildar, T.; Hui, W. Implications of microalgal–bacterial interactions in modern aquaculture practices: A review of the current knowledge. Rev. Aquac. 2024, 17, e12980. [Google Scholar] [CrossRef]
- Buttino, I.; Vitiello, V.; Macchia, S.; Scuderi, A.; Pellegrini, D. Larval development ratio test with the calanoid copepod Acartia tonsa as a new bioassay to assess marine sediment quality. Ecotoxicol. Environ. Saf. 2018, 149, 1–9. [Google Scholar] [CrossRef] [PubMed]
- Syberg, K.; Nielsen, A.; Khan, F.R.; Banta, G.T.; Palmqvist, A.; Jepsen, P.M. Microplastic potentiates triclosan toxicity to the marine copepod Acartia tonsa (Dana). J. Toxicol. Environ. Health A 2017, 80, 1369–1371. [Google Scholar] [CrossRef]
- Jepsen, P.M.; van Someren Gréve, H.; Jørgensen, K.N.; Kjær, K.G.W.; Hansen, B.W. Evaluation of high-density tank cultivation of the live-feed cyclopoid copepod Apocyclops royi (Lindberg 1940). Aquaculture 2021, 533, 736125. [Google Scholar] [CrossRef]
- Zhang, J.; Ianora, A.; Wu, C.; Pellegrini, D.; Esposito, F.; Buttino, I. How to increase productivity of the copepod Acartia tonsa (Dana): Effects of population density and food concentration. Aquac. Res. 2015, 46, 2982–2990. [Google Scholar] [CrossRef]
- Rong, R.L.; Gagnat, M.R.; Attramadal, Y.; Vadstein, O. Microbial water quality of the copepod Acartia tonsa in cultures for use as live feed. Aquaculture 2022, 560, 738439. [Google Scholar] [CrossRef]
- Ramakrishnan, B.; Maddela, N.R.; Venkateswarlu, K.; Megharaj, M. Potential of microalgae and cyanobacteria to improve soil health and agricultural productivity: A critical view. Environ. Sci. Adv. 2023, 2, 586–611. [Google Scholar] [CrossRef]
- Natrah, F.M.I.; Bossier, P.; Sorgeloos, P.; Yusoff, F.M.; Defoirdt, T. Significance of microalgal-bacterial interactions for aquaculture. Rev. Aquac. 2014, 6, 48–61. [Google Scholar] [CrossRef]
- Feng, J.T.; Di Gregorio, S.; Niccolini, L.; Vitiello, V.; Ye, Y.; Guo, B.; Yan, X.; Buttino, I. Marine copepods as a microbiome hotspot: Revealing their interactions and biotechnological applications. Water 2023, 15, 4203. [Google Scholar] [CrossRef]
- Wirth, R.; Pap, B.; Böjti, T.; Shetty, P.; Lakatos, G.; Bagi, Z.; Kovács, K.L.; Maróti, G. Chlorella vulgaris and its phycosphere in wastewater: Microalgae–bacteria interactions during nutrient removal. Front. Bioeng. Biotechnol. 2020, 8, 557572. [Google Scholar] [CrossRef]
- Cirri, E.; Pohnert, G. Algae–bacteria interactions that balance the planktonic microbiome. New Phytol. 2019, 223, 100–106. [Google Scholar] [CrossRef]
- Holmes, B.; Paddock, M.B.; VanderGheynst, J.S.; Higgins, B.T. Algal photosynthetic aeration increases the capacity of bacteria to degrade organics in wastewater. Biotechnol. Bioeng. 2020, 117, 62–72. [Google Scholar] [CrossRef]
- Wierzchos, J.; DiRuggiero, J.; Vítek, P.; Artieda, O.; Souza-Egipsy, V.; Škaloud, P.; Tisza, M.; Davila, A.F.; Vílchez, C.; Garbayo, I.; et al. Adaptation strategies of endolithic chlorophototrophs to survive the hyperarid and extreme solar radiation environment of the Atacama Desert. Front. Microbiol. 2015, 6, 934. [Google Scholar] [CrossRef]
- Zhang, J.; Wu, C.; Pellegrini, D.; Romano, G.; Esposito, F.; Ianora, A.; Buttino, I. Effects of different monoalgal diets on egg production, hatching success and apoptosis induction in a Mediterranean population of the calanoid copepod Acartia tonsa (Dana). Aquaculture 2013, 400–401, 65–72. [Google Scholar] [CrossRef]
- Helm, M.M.; Bourne, N.; Lovatelli, A. The Hatchery Culture of Bivalves: A Practical Manual; FAO Fisheries and Aquaculture Department: Rome, Italy, 2004; p. 201. [Google Scholar]
- Sánchez, S.; Martínez, M.E.; Espinola, F. Biomass production and biochemical variability of the marine microalga Isochrysis galbana in relation to culture medium. Biochem. Eng. J. 2000, 6, 13–18. [Google Scholar] [CrossRef] [PubMed]
- Du, S.H.; Cui, J.L.; Meng, F.P.; Li, H.; Cui, H.; Xia, Y. Bioremediation of propylbenzenes by a novel marine microalga Rhinomonas reticulata S6A isolated from Daya Bay: Performance, acute toxicity, growth kinetics and biodegradation. Front. Mar. Sci. 2023, 10, 1171944. [Google Scholar] [CrossRef]
- Hill, D.R.; Rowan, K.S. The biliproteins of the Cryptophyceae. Phycologia 1989, 28, 455–463. [Google Scholar] [CrossRef]
- Parke, M. Studies on marine flagellates. J. Mar. Biol. Assoc. 1949, 28, 255–288. [Google Scholar] [CrossRef]
- Novarino, G. Observations on Rhinomonas reticulata comb. nov. and R. reticulata var. eleniana var. nov. (Cryptophyceae), with comments on the genera Pyrenomonas and Rhodomonas. Nord. J. Bot. 1991, 11, 243–252. [Google Scholar]
- Karsten, G. Rhodomonas baltica N. g. et sp. Wissenschaftliche Meeresuntersuchungen: Abteilung Kiel, 1898; pp. 15–16. [Google Scholar]
- Guiry, M.D.; Guiry, G.M.; AlgaeBase. World-Wide Electronic Publication, National University of Ireland, Galway. 2024. Available online: http://www.algaebase.org/ (accessed on 6 July 2025).
- Guillard, R.R. Culture of phytoplankton for feeding marine invertebrates. In Culture of Marine Invertebrate Animals; Smith, W.L., Chanley, M.H., Eds.; Springer: Boston, MA, USA, 1975; pp. 29–60. [Google Scholar]
- Moisander, P.H.; Sexton, A.D.; Daley, M.C. Stable associations masked by temporal variability in the marine copepod microbiome. PLoS ONE 2015, 10, e0138967. [Google Scholar] [CrossRef]
- Bernabei, G.; De Simone, G.; Becarelli, S.; Di Mambro, R.; Gentini, A.; Di Gregorio, S. Co-metabolic growth and microbial diversity: Keys for the depletion of the α, δ, β and γ-HCH isomers. J. Hazard. Mater. 2024, 480, 135963. [Google Scholar] [CrossRef]
- Martin, M. Cutadapt removes adapter sequences from high-throughput sequencing reads. EMBnet J. 2011, 17, 10–12. [Google Scholar] [CrossRef]
- Nearing, J.T.; Douglas, G.M.; Comeau, A.M.; Langille, M.G.I. Denoising the denoisers: An independent evaluation of microbiome sequence error-correction approaches. PeerJ 2018, 6, e5364. [Google Scholar] [CrossRef]
- Prodan, A.; Tremaroli, V.; Brolin, H.; Zwinderman, A.H.; Nieuwdorp, M.; Levin, E. Comparing bioinformatic pipelines for microbial 16S rRNA amplicon sequencing. PLoS ONE 2020, 15, e0227434. [Google Scholar] [CrossRef] [PubMed]
- Bolyen, E.; Rideout, J.R.; Dillon, M.R.; Bokulich, N.A.; Abnet, C.C.; Al-Ghalith, G.A.; Alexander, H.; Alm, E.J.; Arumugam, M.; Asnicar, F.; et al. Reproducible, interactive, scalable and extensible microbiome data science using QIIME 2. Nat. Biotechnol. 2019, 37, 852–857. [Google Scholar] [CrossRef] [PubMed]
- Robeson, M.S.; O’Rourke, D.R.; Kaehler, B.D.; Ziemski, M.; Dillon, M.R.; Foster, J.T.; Bokulich, N.A.; Pertea, M. RESCRIPt: Reproducible sequence taxonomy reference database management. PLoS Comput. Biol. 2021, 17, e1009581. [Google Scholar] [CrossRef] [PubMed]
- Chao, A.; Gotelli, N.J.; Hsieh, T.C.; Sander, E.L.; Ma, K.H.; Colwell, R.K.; Ellison, A.M. Rarefaction and extrapolation with Hill numbers: A framework for sampling and estimation in species diversity studies. Ecol. Monogr. 2014, 84, 45–67. [Google Scholar] [CrossRef]
- Alberdi, A.; Gilbert, M.T.P. A guide to the application of Hill numbers to DNA-based diversity analyses. Mol. Ecol. Resour. 2019, 19, 804–817. [Google Scholar] [CrossRef]
- Gotelli, N.J.; Chao, A. Measuring and estimating species richness, species diversity, and biotic similarity from sampling data. In Encyclopedia of Biodiversity; Academic Press: San Diego, CA, USA, 2013; pp. 195–211. [Google Scholar]
- Noguchi, K.; Gel, Y.R.; Brunner, E.; Konietschke, F. nparLD: An R software package for the nonparametric analysis of longitudinal data in factorial experiments. J. Stat. Softw. 2012, 50, 1–23. [Google Scholar] [CrossRef]
- McMurdie, P.J.; Holmes, S. phyloseq: An R package for reproducible interactive analysis and graphics of microbiome census data. PLoS ONE 2013, 8, e61217. [Google Scholar] [CrossRef]
- Dixon, P. VEGAN, a package of R functions for community ecology. J. Veg. Sci. 2003, 14, 927–930. [Google Scholar] [CrossRef]
- Yan, J.; Herzog, J.W.; Tsang, K.; Brennan, C.A.; Bower, M.A.; Garrett, W.S.; Sartor, B.R.; Aliprantis, A.O.; Charles, J.F. Gut microbiota induce IGF-1 and promote bone formation and growth. Proc. Natl. Acad. Sci. USA 2016, 113, E7554–E7563. [Google Scholar] [CrossRef] [PubMed]
- Brugnano, C.; Guglielmo, L.; Zagami, G. Food type effects on reproduction of hyperbenthic calanoid species Pseudocyclops xiphophorus Wells, 1967, under laboratory conditions. Chem. Ecol. 2008, 24, 111–117. [Google Scholar] [CrossRef]
- Xu, Y.; Liang, J.; Qin, L.; Niu, T.; Liang, Z.; Li, Z.; Yu, K. The Dynamics of Symbiodiniaceae and Photosynthetic Bacteria under High-Temperature Conditions. Microb. Ecol. 2024, 87, 169. [Google Scholar] [CrossRef] [PubMed]
- Lu, Z.; Lin, W.; Li, Q.; Wu, Q.; Ren, Z.; Mu, C.; Ye, Y. Recirculating Aquaculture System as Microbial Community and Water Quality Management Strategy in the Larviculture of Scylla paramamosain. Water Res. 2024, 252, 121218. [Google Scholar] [CrossRef]
- Wan, K.; Yu, Y.; Hu, J.; Liu, X.; Deng, X.; Yu, J.; Xiao, C. Recovery of Anammox Process Performance after Substrate Inhibition: Reactor Performance, Sludge Morphology, and Microbial Community. Bioresour. Technol. 2022, 357, 127351. [Google Scholar] [CrossRef]
- Di Gregorio, S.; Niccolini, L.; Seggiani, M.; Strangis, G.; Barbani, N.; Vitiello, V.; Becarelli, S.; Petroni, G.; Yan, X.; Buttino, I. Marine copepod culture as a potential source of bioplastic-degrading microbiome: The case of poly(butylene succinate-co-adipate). Chemosphere 2024, 362, 142603. [Google Scholar] [CrossRef]
- Cnudde, C.; Moens, T.; Hoste, B.; Willems, A.; De Troch, M. Limited Feeding on Bacteria by Two Intertidal Benthic Copepod Species as Revealed by Trophic Biomarkers. Environ. Microbiol. Rep. 2013, 5, 301–309. [Google Scholar] [CrossRef][Green Version]
- Yan, B.C.; Rabbani, G.; Lee, N.L.Y.; Ooi, J.L.S.; Lee, J.N.; Huang, D.; Wainwright, B.J. The microbiome of the seagrass Halophila ovalis: Community structuring from plant parts to regional scales. Aquat. Microb. Ecol. 2021, 87, 139–150. [Google Scholar] [CrossRef]
- Díaz-Cárdenas, C.; Patel, B.K.C.; Baena, S. Tistlia consotensis gen. nov., sp. nov., an aerobic, chemoheterotrophic, free-living, nitrogen-fixing alphaproteobacterium, isolated from a Colombian saline spring. Int. J. Syst. Evol. Microbiol. 2010, 60, 1437–1443. [Google Scholar] [CrossRef]
- Gong, Y.; Ping, X.-Y.; Zeng, C.-H.; Wang, S.-X.; Zhou, Y.; Wang, M.-Y.; Mu, D.-S.; Du, Z.-J. Predation capacity of Bradymonabacteria, a recently discovered group in the order Bradymonadales, isolated from marine sediments. Arch. Microbiol. 2022, 204, 695. [Google Scholar] [CrossRef] [PubMed]
- Mu, D.-S.; Wang, S.; Liang, Q.-Y.; Du, Z.-Z.; Tian, R.; Ouyang, Y.; Wang, X.-P.; Zhou, A.; Gong, Y.; Chen, G.-J.; et al. Bradymonabacteria, a novel bacterial predator group with versatile survival strategies in saline environments. Microbiome 2020, 8, 126. [Google Scholar] [CrossRef]
- Smahajcsik, D.; Roager, L.; Strube, M.L.; Zhang, S.D.; Gram, L. Stronger together: Harnessing natural algal communities as potential probiotics for inhibition of aquaculture pathogens. Microbiol. Spectr. 2025, 13, e00421-25. [Google Scholar] [CrossRef] [PubMed]
- Roager, L.; Sonnenschein, E.C.; Gram, L. Sequence-Based Characterization of Microalgal Microbiomes: Impact of DNA Extraction Protocol on Yield and Community Composition. Microbiol. Spectr. 2023, 11, e0340822. [Google Scholar] [CrossRef]
- Ahern, O.M.; Whittaker, K.A.; Williams, T.C.; Hunt, D.E.; Rynearson, T.A. Host Genotype Structures the Microbiome of a Globally Dispersed Marine Phytoplankton. Proc. Natl. Acad. Sci. USA 2021, 118, e2105207118. [Google Scholar] [CrossRef]
- Park, B.S.; Choi, W.-J.; Guo, R.; Kim, H.; Ki, J.-S. Changes in Free-Living and Particle-Associated Bacterial Communities Depending on the Growth Phases of Marine Green Algae, Tetraselmis suecica. J. Mar. Sci. Eng. 2021, 9, 171. [Google Scholar] [CrossRef]
- Shoemaker, K.M.; McCliment, E.A.; Moisander, P.H. Copepod-associated gammaproteobacterial alkaline phosphatases in the North Atlantic Subtropical Gyre. Front. Microbiol. 2020, 11, 1033. [Google Scholar] [CrossRef]


Disclaimer/Publisher’s Note: The statements, opinions and data contained in all publications are solely those of the individual author(s) and contributor(s) and not of MDPI and/or the editor(s). MDPI and/or the editor(s) disclaim responsibility for any injury to people or property resulting from any ideas, methods, instructions or products referred to in the content. |
© 2025 by the authors. Licensee MDPI, Basel, Switzerland. This article is an open access article distributed under the terms and conditions of the Creative Commons Attribution (CC BY) license (https://creativecommons.org/licenses/by/4.0/).