3.1. Characterization of EPS
Table 1 summarizes the composition of the EPS in 1.0 mmol L
−1 NaCl after 72 h of incubation for yeast to release EPS, showing that the EPS is mainly composed of ~70 mg L
−1 organic carbon, ~0.50 mmol L
−1 K
+, and ~0.16 mmol L
−1 total phosphorous including ~0.12 mmol L
−1 orthophosphate. The Na
+ concentration does not represent sodium release from the yeast, but the sodium initially added to the solution to adjust the ionic strength. The fraction of orthophosphate is approximately 80% in the total P concentration and the rest is P associated with organic compounds. Masaki and others have already reported that the dissolved organic matter in the EPS consists of various species as determined by HPLC [
29].
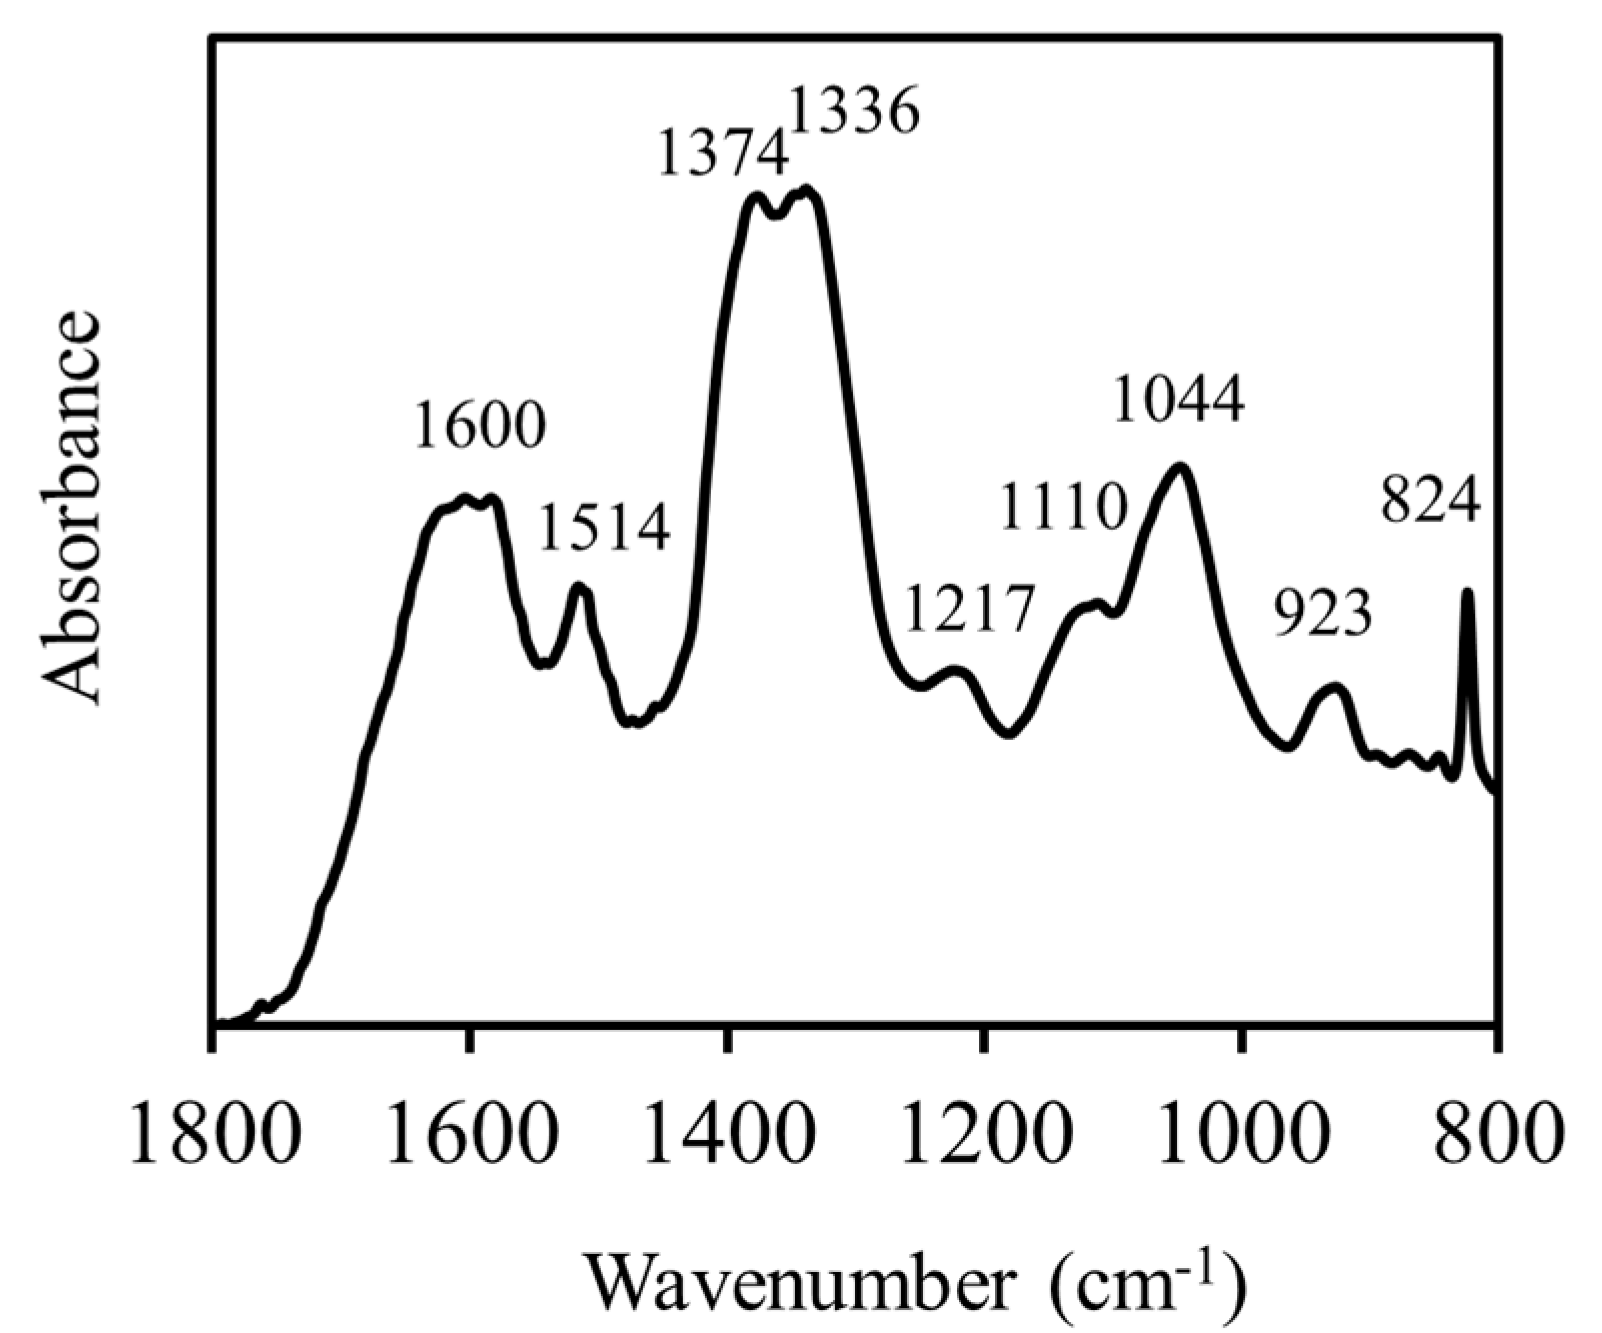
Figure 1 shows the ATR-FTIR spectra of EPS prior to contact with CeNPs. The band assignments are summarized in
Table 2, along with supporting references. A large absorption band at 1374 cm
−1 corresponds to symmetric stretching of COO- groups (ν
s C-O) that are derived from proteins and carboxylated polysaccharides [
30]. The band at ~1600 cm
−1 corresponds to the stretching vibration of C=O groups in amide I (amides associated with proteins). The band at ~1514 cm
−1 corresponds to the stretching vibration of C-N groups and deformation vibrations of N-H groups in amide II (-CO-NH- of proteins) [
31]. These bands at 1600 and 1514 cm
−1 indicate the presence of proteins in the EPS. The band at ~1110 cm
−1 corresponds to ring vibrations of C-O-C in polysaccharides and stretching vibrations of P=O bonds in proton dissociated orthophosphate. In addition, the band at ~1044 cm
−1 corresponds to symmetric stretching vibrations of P=O in the phosphoryl group. It should be noted that the phosphate bands overlap the band of polysaccharide vibrations and these features are difficult to separate; nevertheless, it is concluded that polysaccharides and phosphoryl species can be identified as the EPS constituents released from
S. cerevisiae. These species are also contained in the EPS released from other microorganisms [
32,
33,
34].
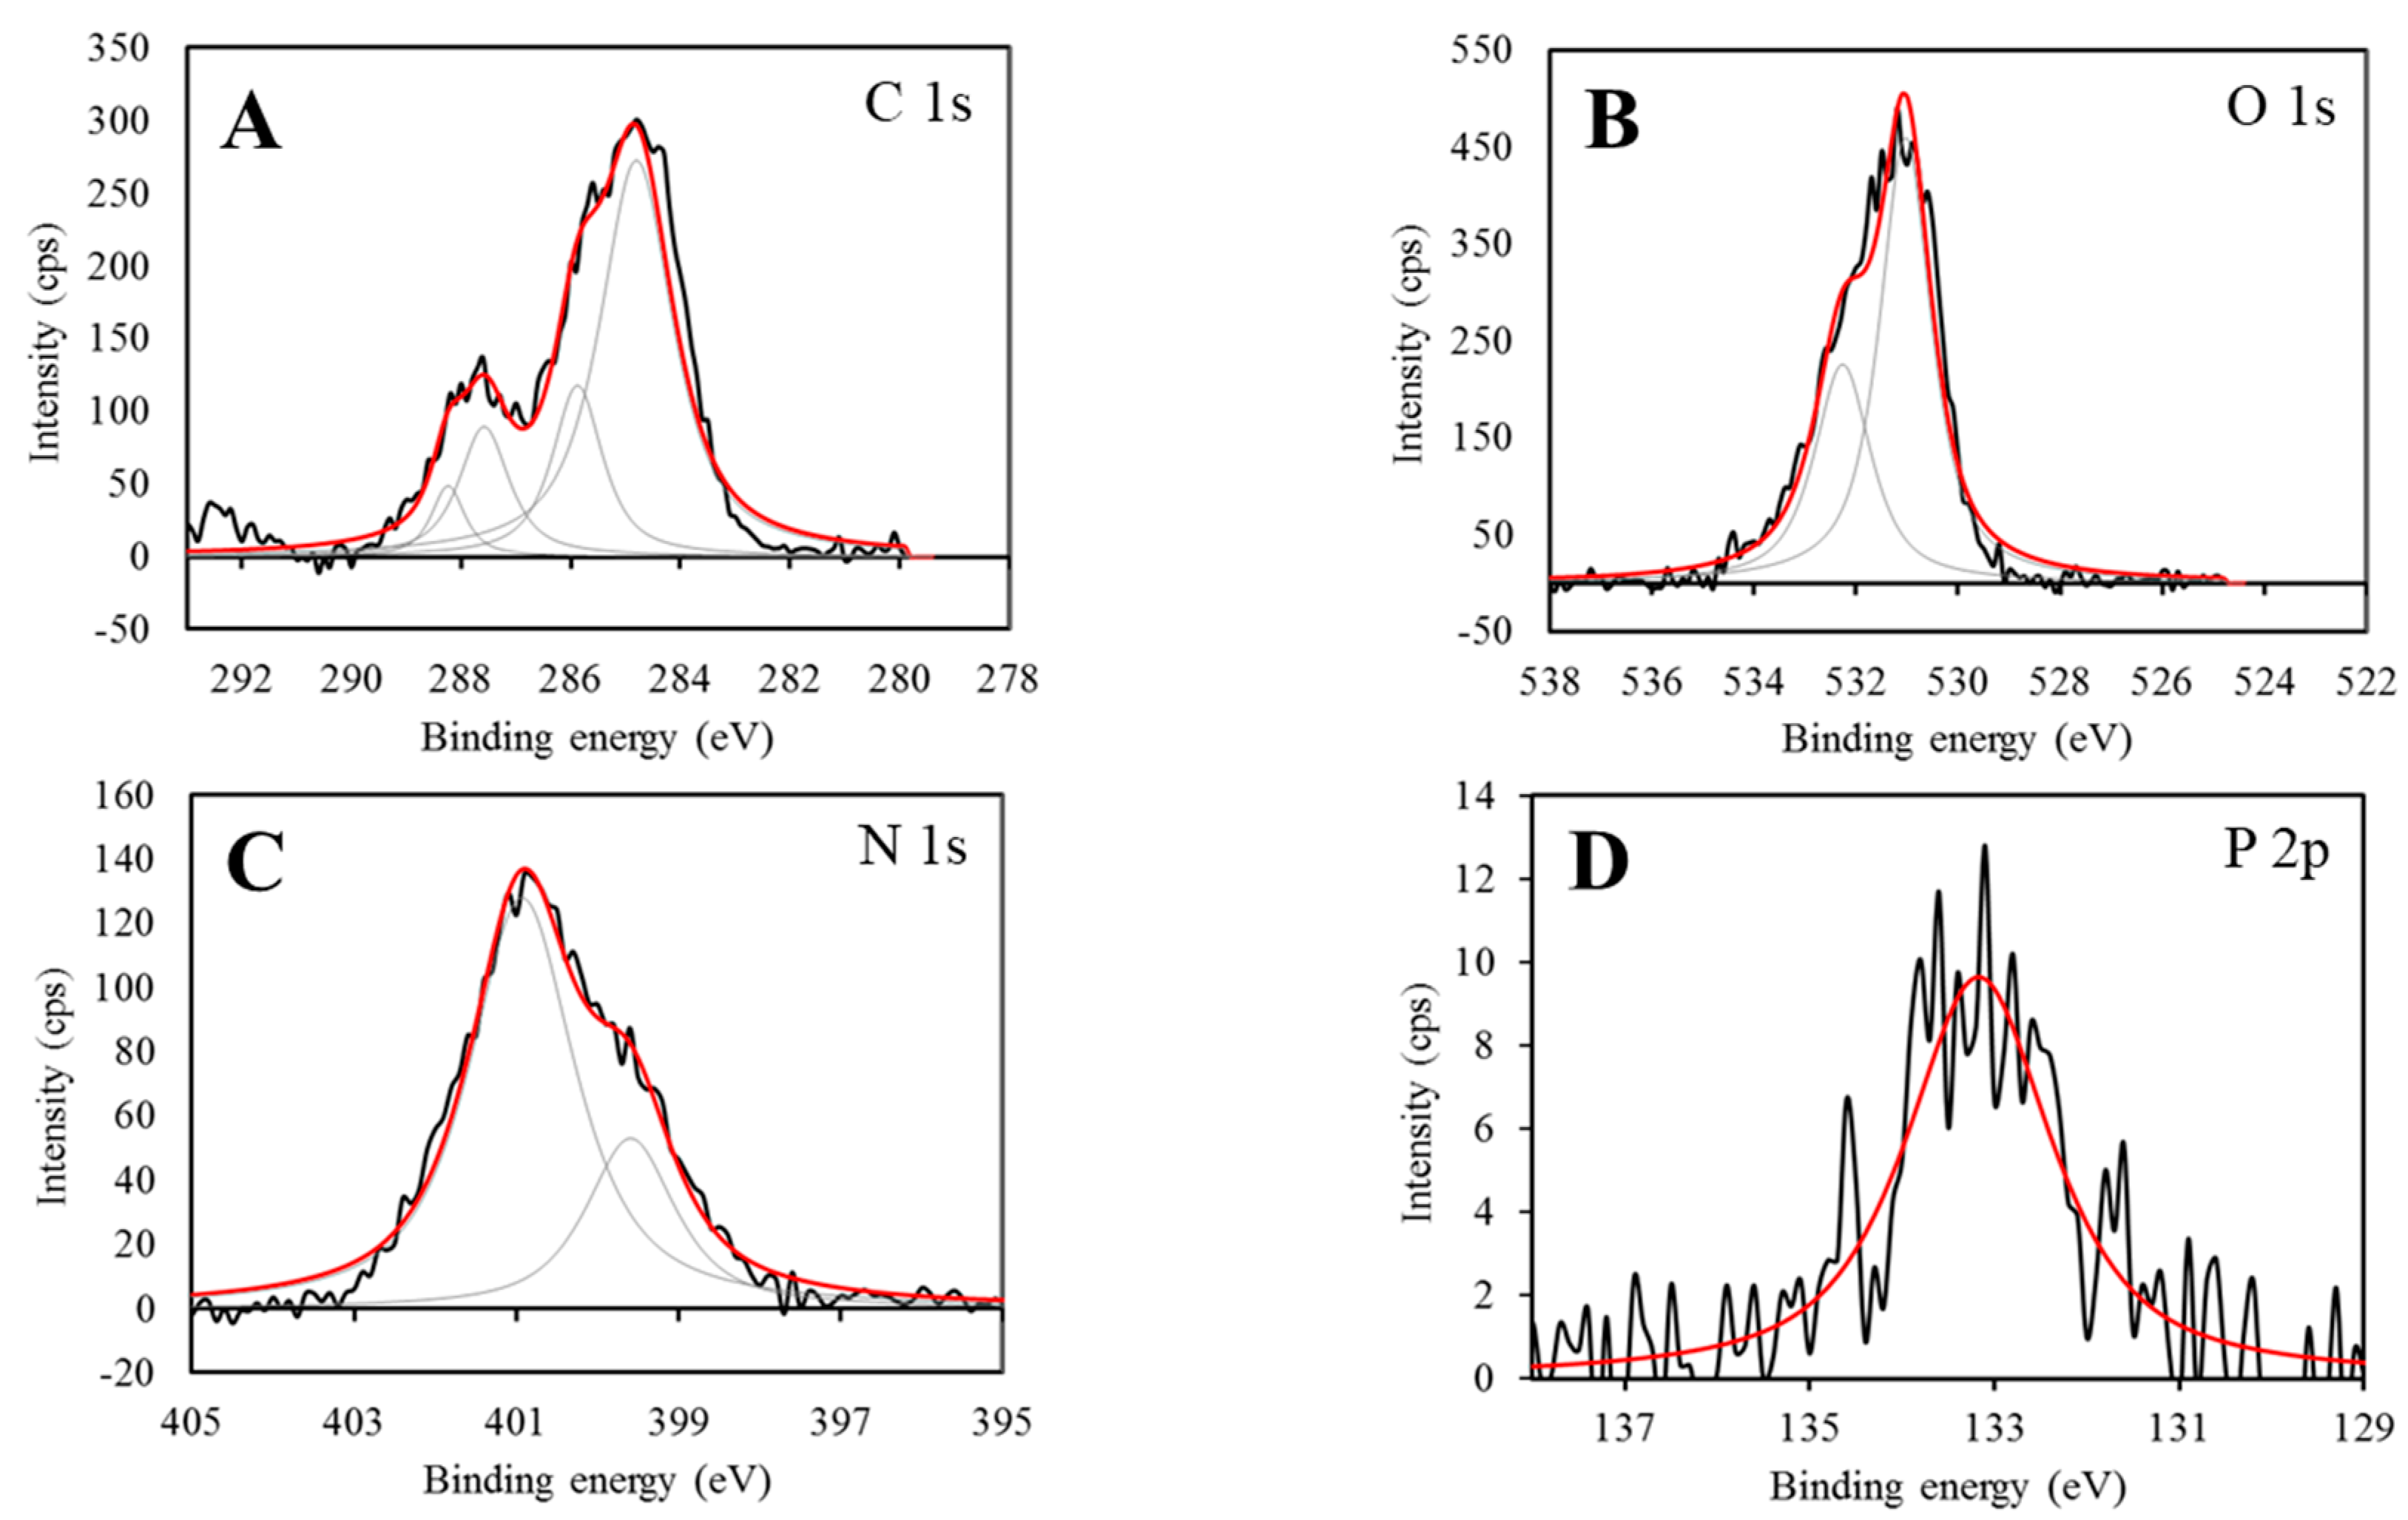
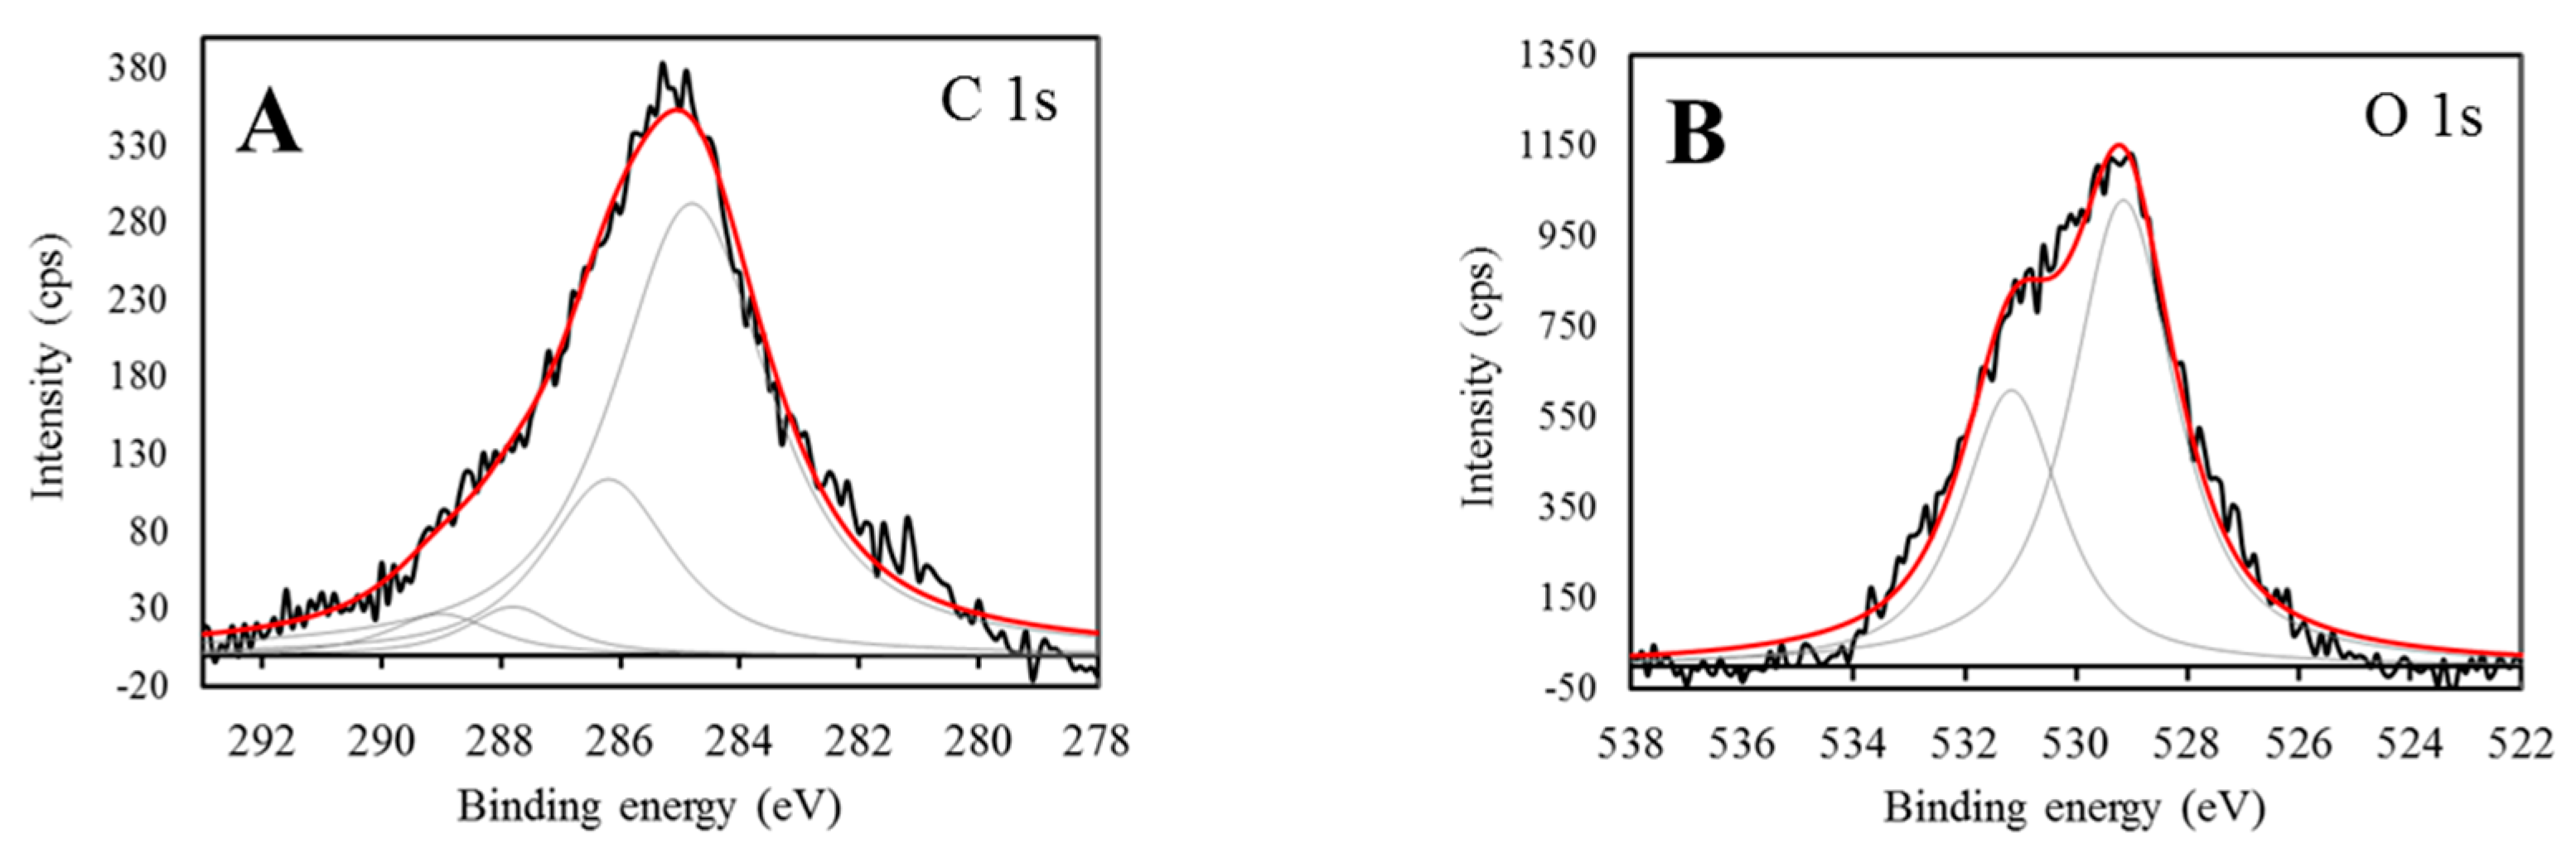
Figure 2 shows the XPS spectra of the EPS prior to the adsorption to CeNPs. Based on a peak assignment proposed by Badireddy and others [
37], the C 1s peak (
Figure 2A) was resolved into four component peaks, which were assigned as follows: (i) the peak at 284.8 eV is attributed to C-(C, H) in lipids, amino acid side chains, or saccharide ring chains; (ii) the peak at 286.2 eV is derived from C-(O, N) that is associated with alcohol, ester, amine, or amide; (iii) the peak at 287.8 eV is assigned to C=O or O-C-O, which is included in carboxylate, carbonyl, amide, or hemiacetal; (iv) the peak at 289.0 eV arises from O=C-OH and O=C-OR, commonly found in carbonyl or ester groups. The O 1s peak (
Figure 2B) was decomposed into two peaks: the peak at 531.3 eV is mainly a contribution from O=C, as in carboxylate, carbonyl, ester, or amide, whereas the peak at 532.7 eV is assigned to O-(C, H), including hydroxide, acetal, and hemiacetal. Identification of acetal, hemiacetal, and hydroxide indicates the presence of carbohydrates, while carboxylate and carboxyl groups most likely represent the presence of proteins and acidic carbohydrates [
37].
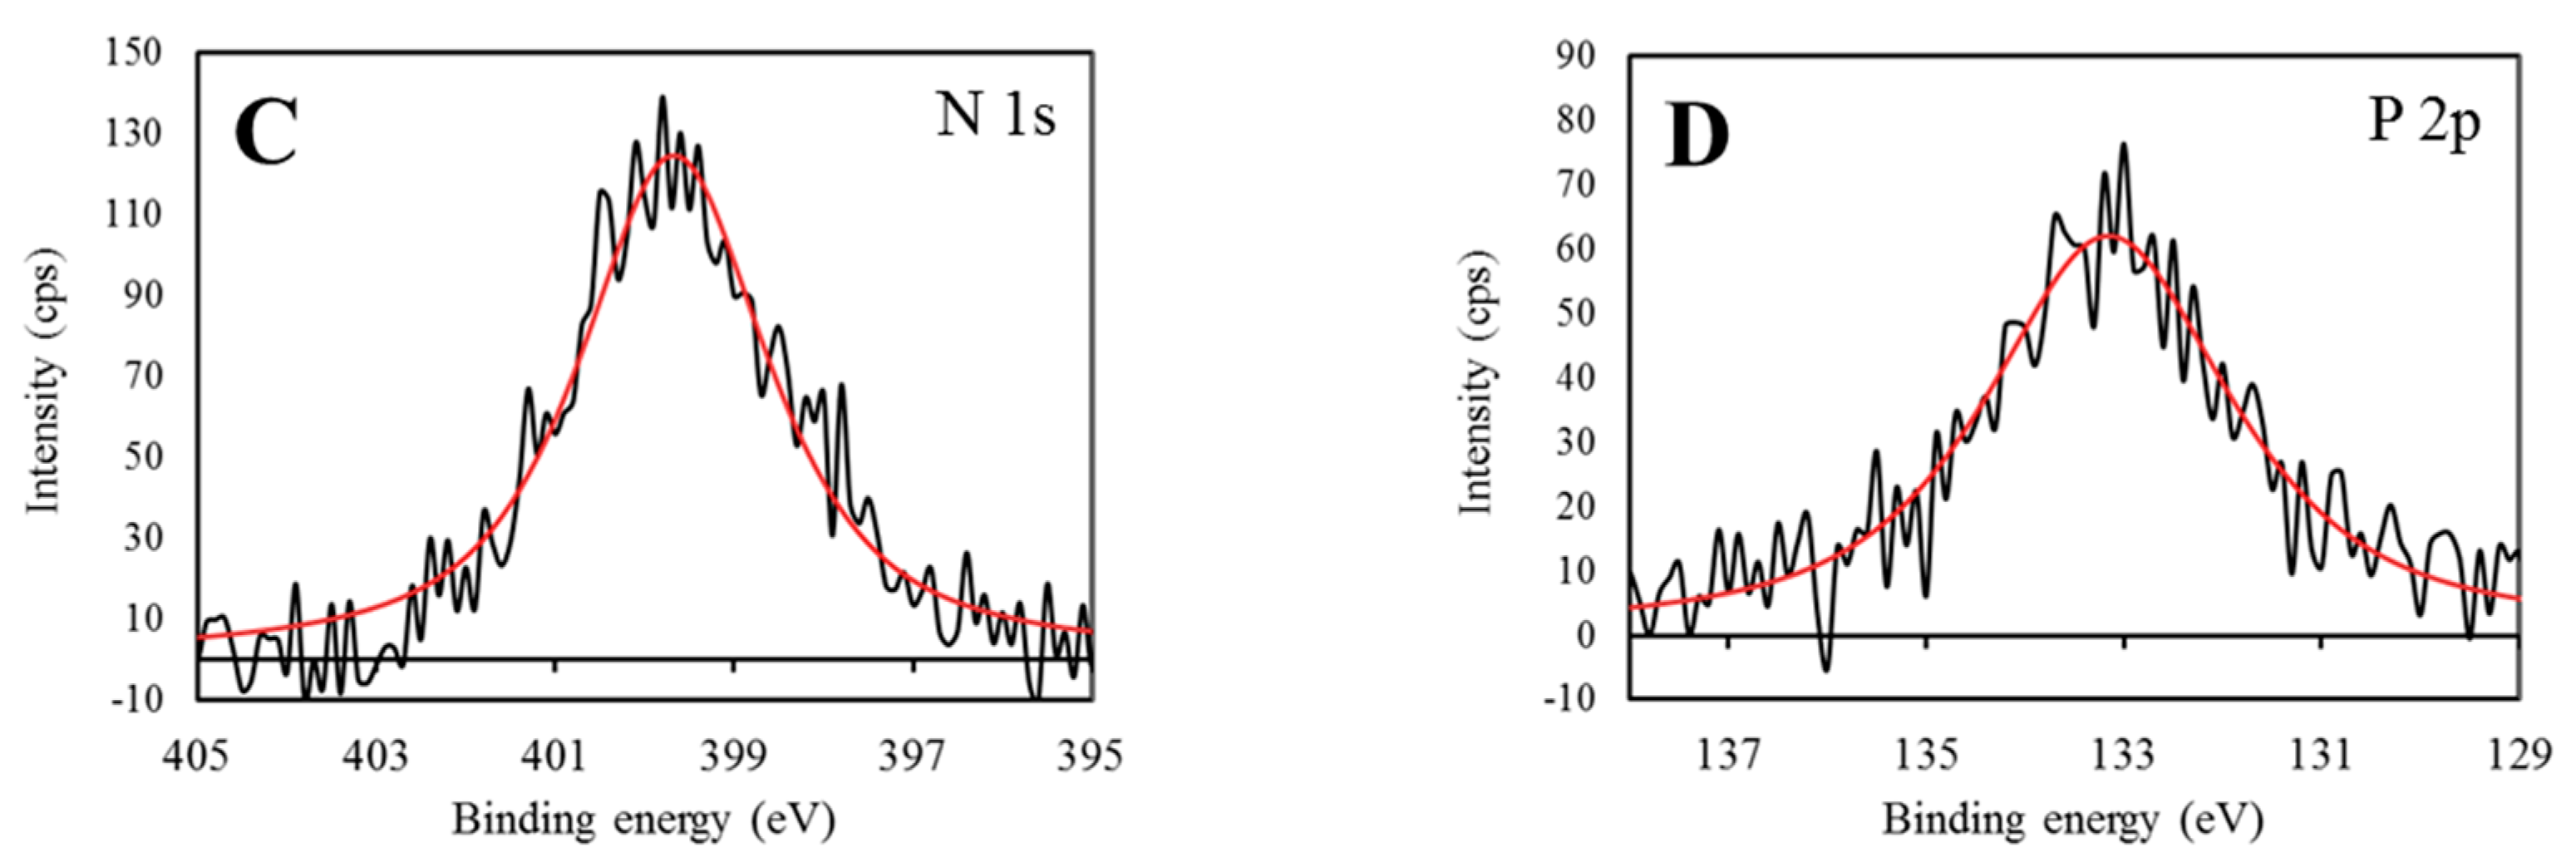
The N 1s peak was also resolved into two component peaks (
Figure 2C). The peak at 399.6 eV can be assigned to nonprotonated nitrogen, N
nonpr, such as in amines and amides, and the other peak at 401.3 eV is mainly ascribed to protonated amines, N
pr [
37]. Since the EPS specimen for the present XPS analysis was prepared after adjusting the pH of the EPS solution to 6.0, the amount of nonprotonated amine groups in the EPS is minimal. Thus, the peak at 399.6 eV is mainly derived from amides.
It was difficult to resolve the P 2p peak due to low intensity (
Figure 2D). However, two peaks typically appear at 133.2 eV and 134.2 eV, which are derived from orthophosphate and phosphoryl group such as adenosine monophosphate, respectively. The peak assigned to phosphoryl group was not observed in this analysis because most of the phosphorus compounds in the EPS is orthophosphate (
Table 1). The concentration of phosphoryl group in the EPS was too low to further analyze the peak in detail. Consequently, the results of XPS analyses suggest that the EPS released from
S. cerevisiae is composed of lipids, proteins, saccharides, amines, and orthophosphate, which is consistent with the results of FTIR. On the other hand, the functional groups of EPS determined by both methods are not inconsistent with typical functional groups of the cell surfaces described in previous reports [
38,
39].
3.2. Adsorption of EPS on CeNPs
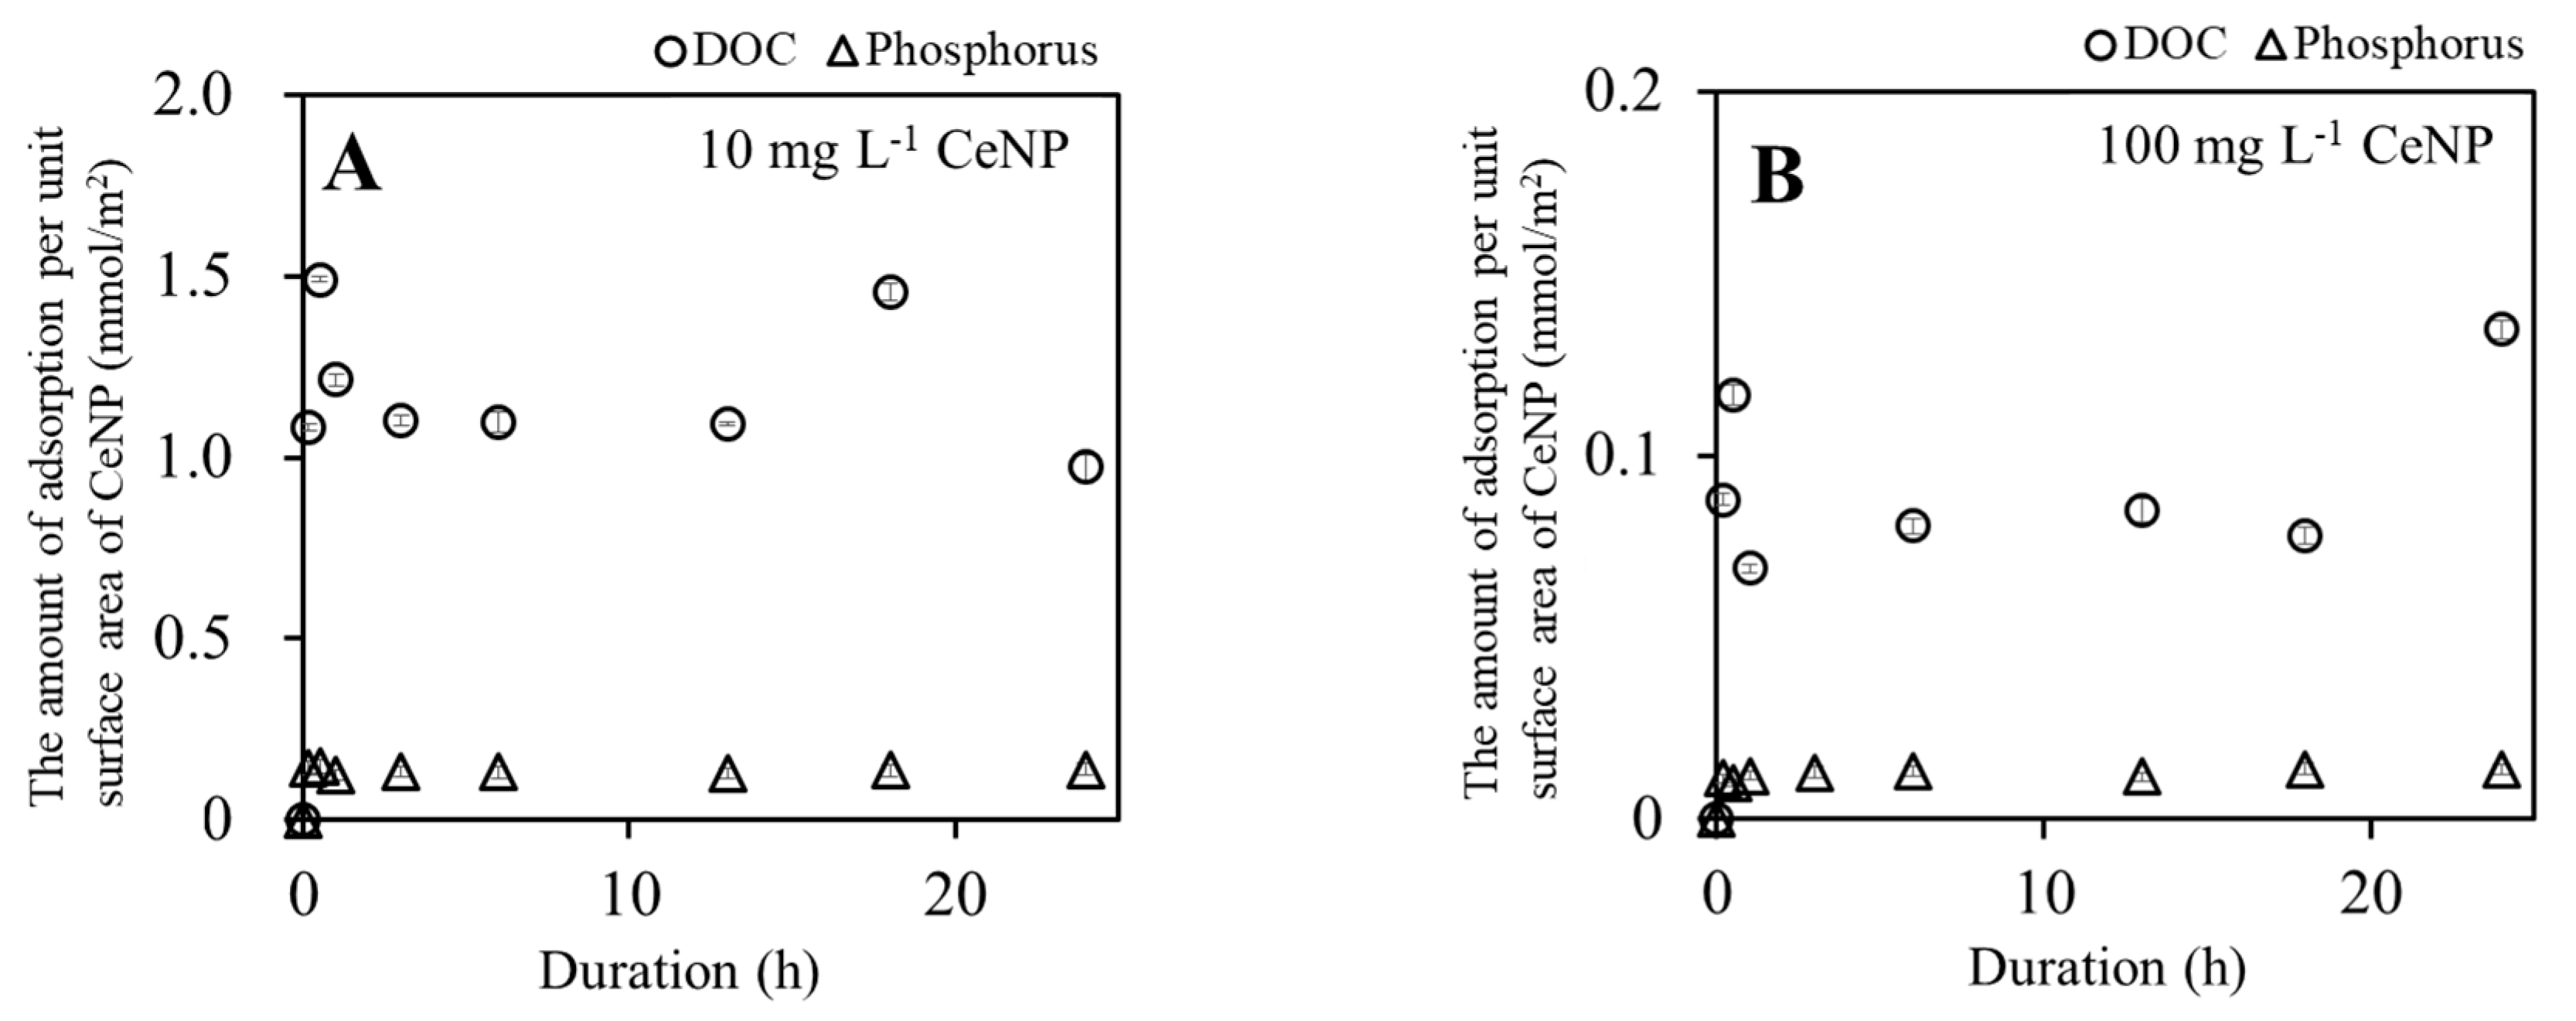
Adsorption measurements of DOC and phosphate on CeNPs at pH 6.0 reached apparent equilibrium within only ten minutes both in the solutions with 10 mg L
−1 (
Figure 3A) and 100 mg L
−1 (
Figure 3B). The amount of adsorbed species per unit surface area on 10 mg L
−1 of CeNPs was about an order of magnitude greater than that on 100 mg L
−1 of CeNPs. This is because the number of availabel adsorption sites decreased for CeNPs at 100 mg L
−1 concentration due to aggregation at this high particle concentration.
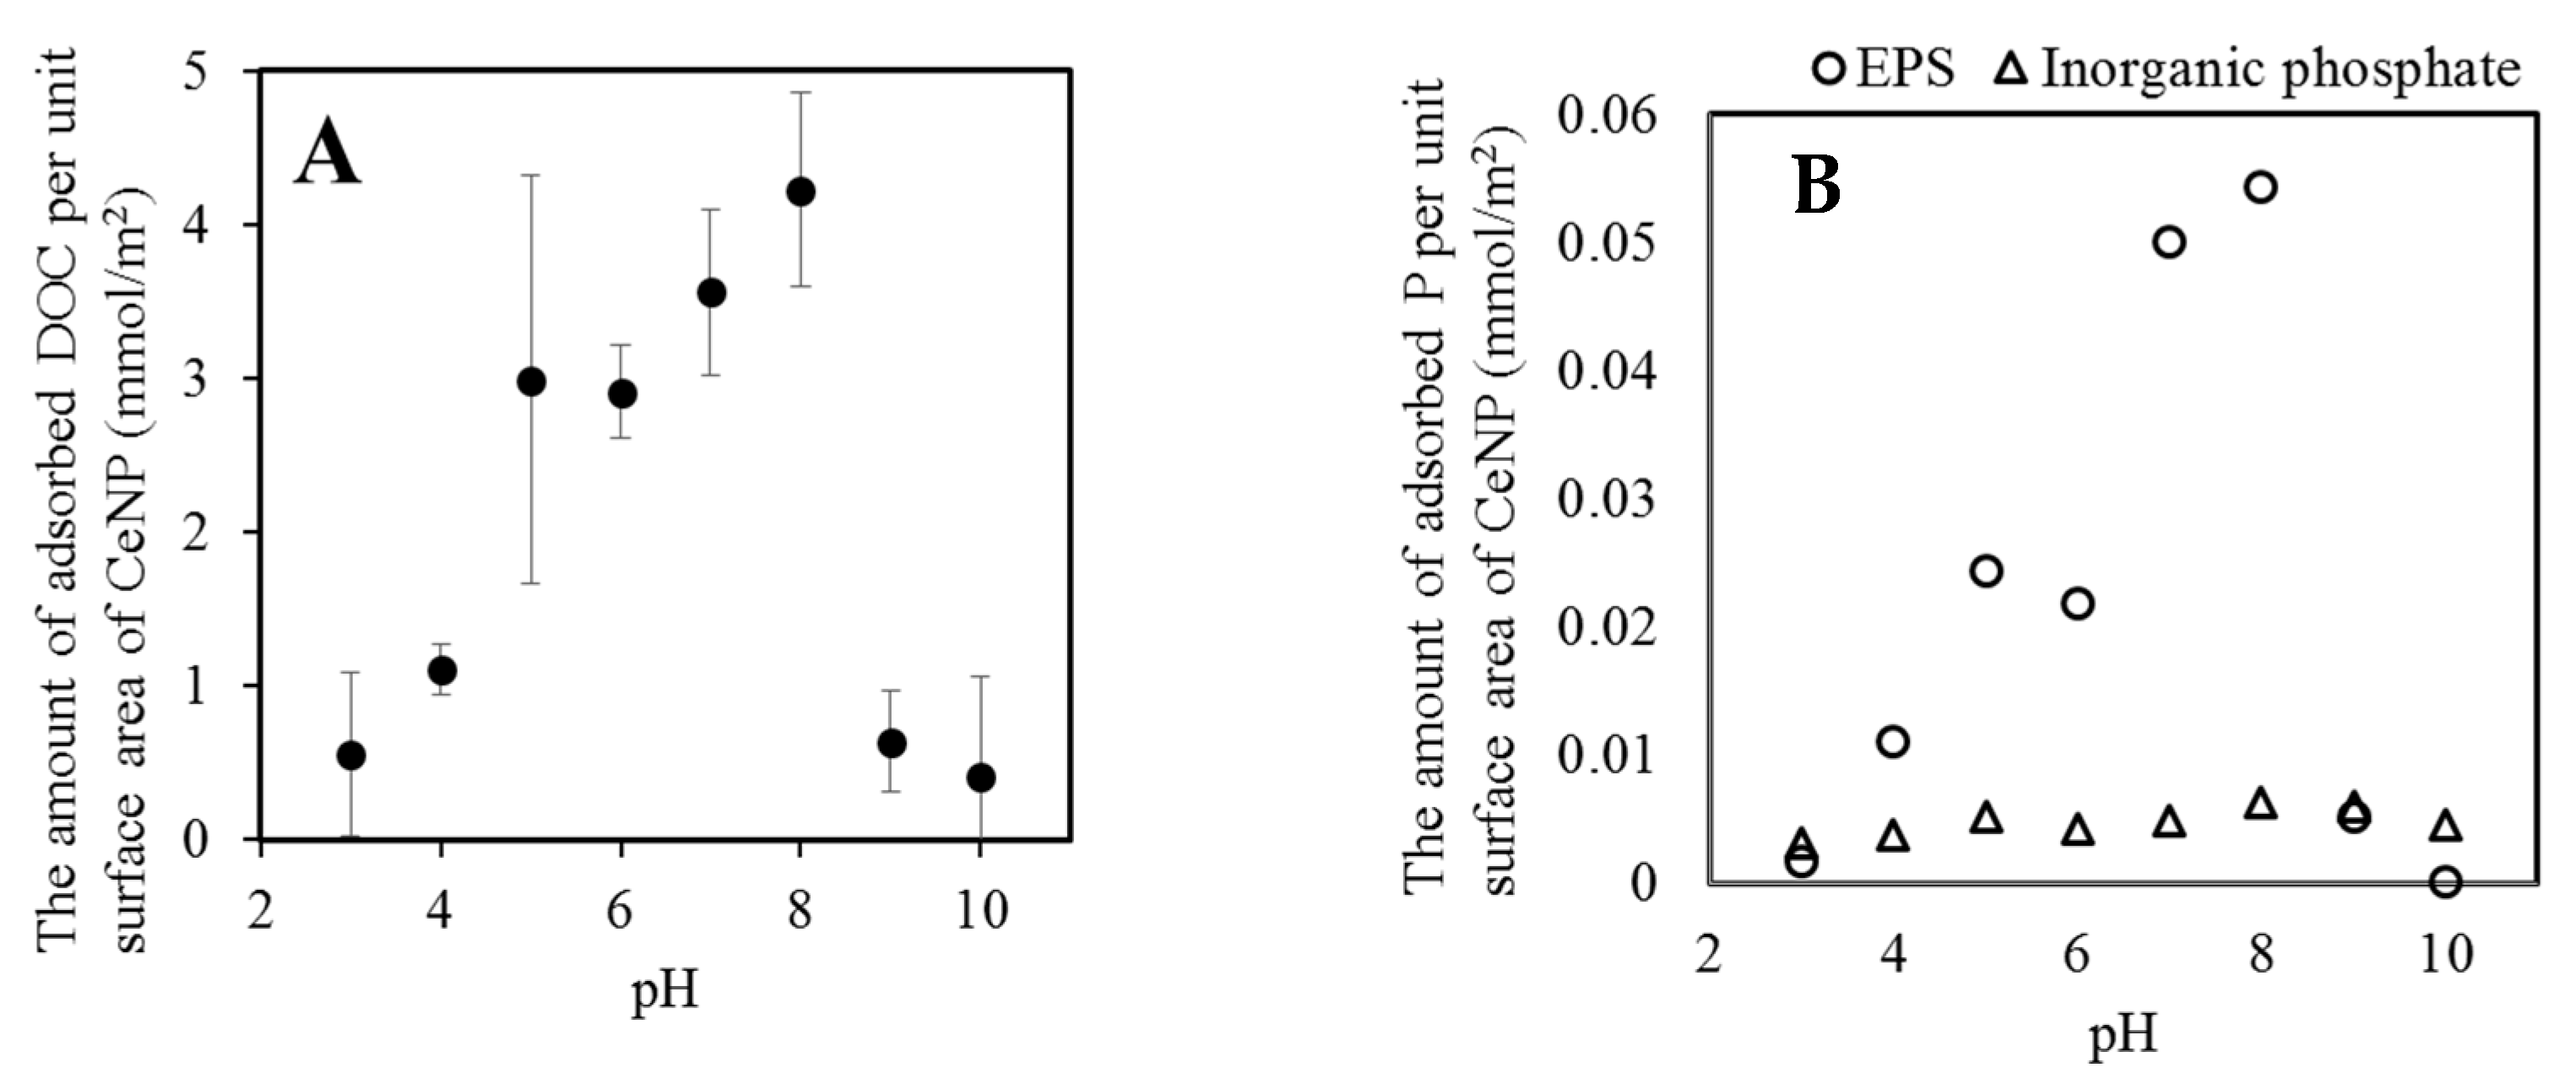
Figure 4 shows the amount of DOC (
Figure 4A) and phosphorus compounds (
Figure 4B) adsorbed onto CeNPs as a function of pH after 1 h of the adsorption experiment. The amount of adsorbed DOC exhibited maximum content at pH 8 at the level of ~4 mmol/m
2. There was no pH dependence for the adsorption of inorganic phosphate; however, adsorption of phosphorus species derived from the EPS revealed similar pH dependency to that of DOC (
Figure 4), despite that the majority of phosphorus compounds adsorbed onto the CeNP surfaces was identified to be orthophosphate (
Table 3). Gerke found a similar phenomenon, in which phosphorous exhibited higher affinity to Fe complex with organic matter than to Fe in Fe-oxide [
40]. Similarly, adsorption of DOC facilitated the phosphate adsorption onto the CeNP surfaces in the present experiment as well.
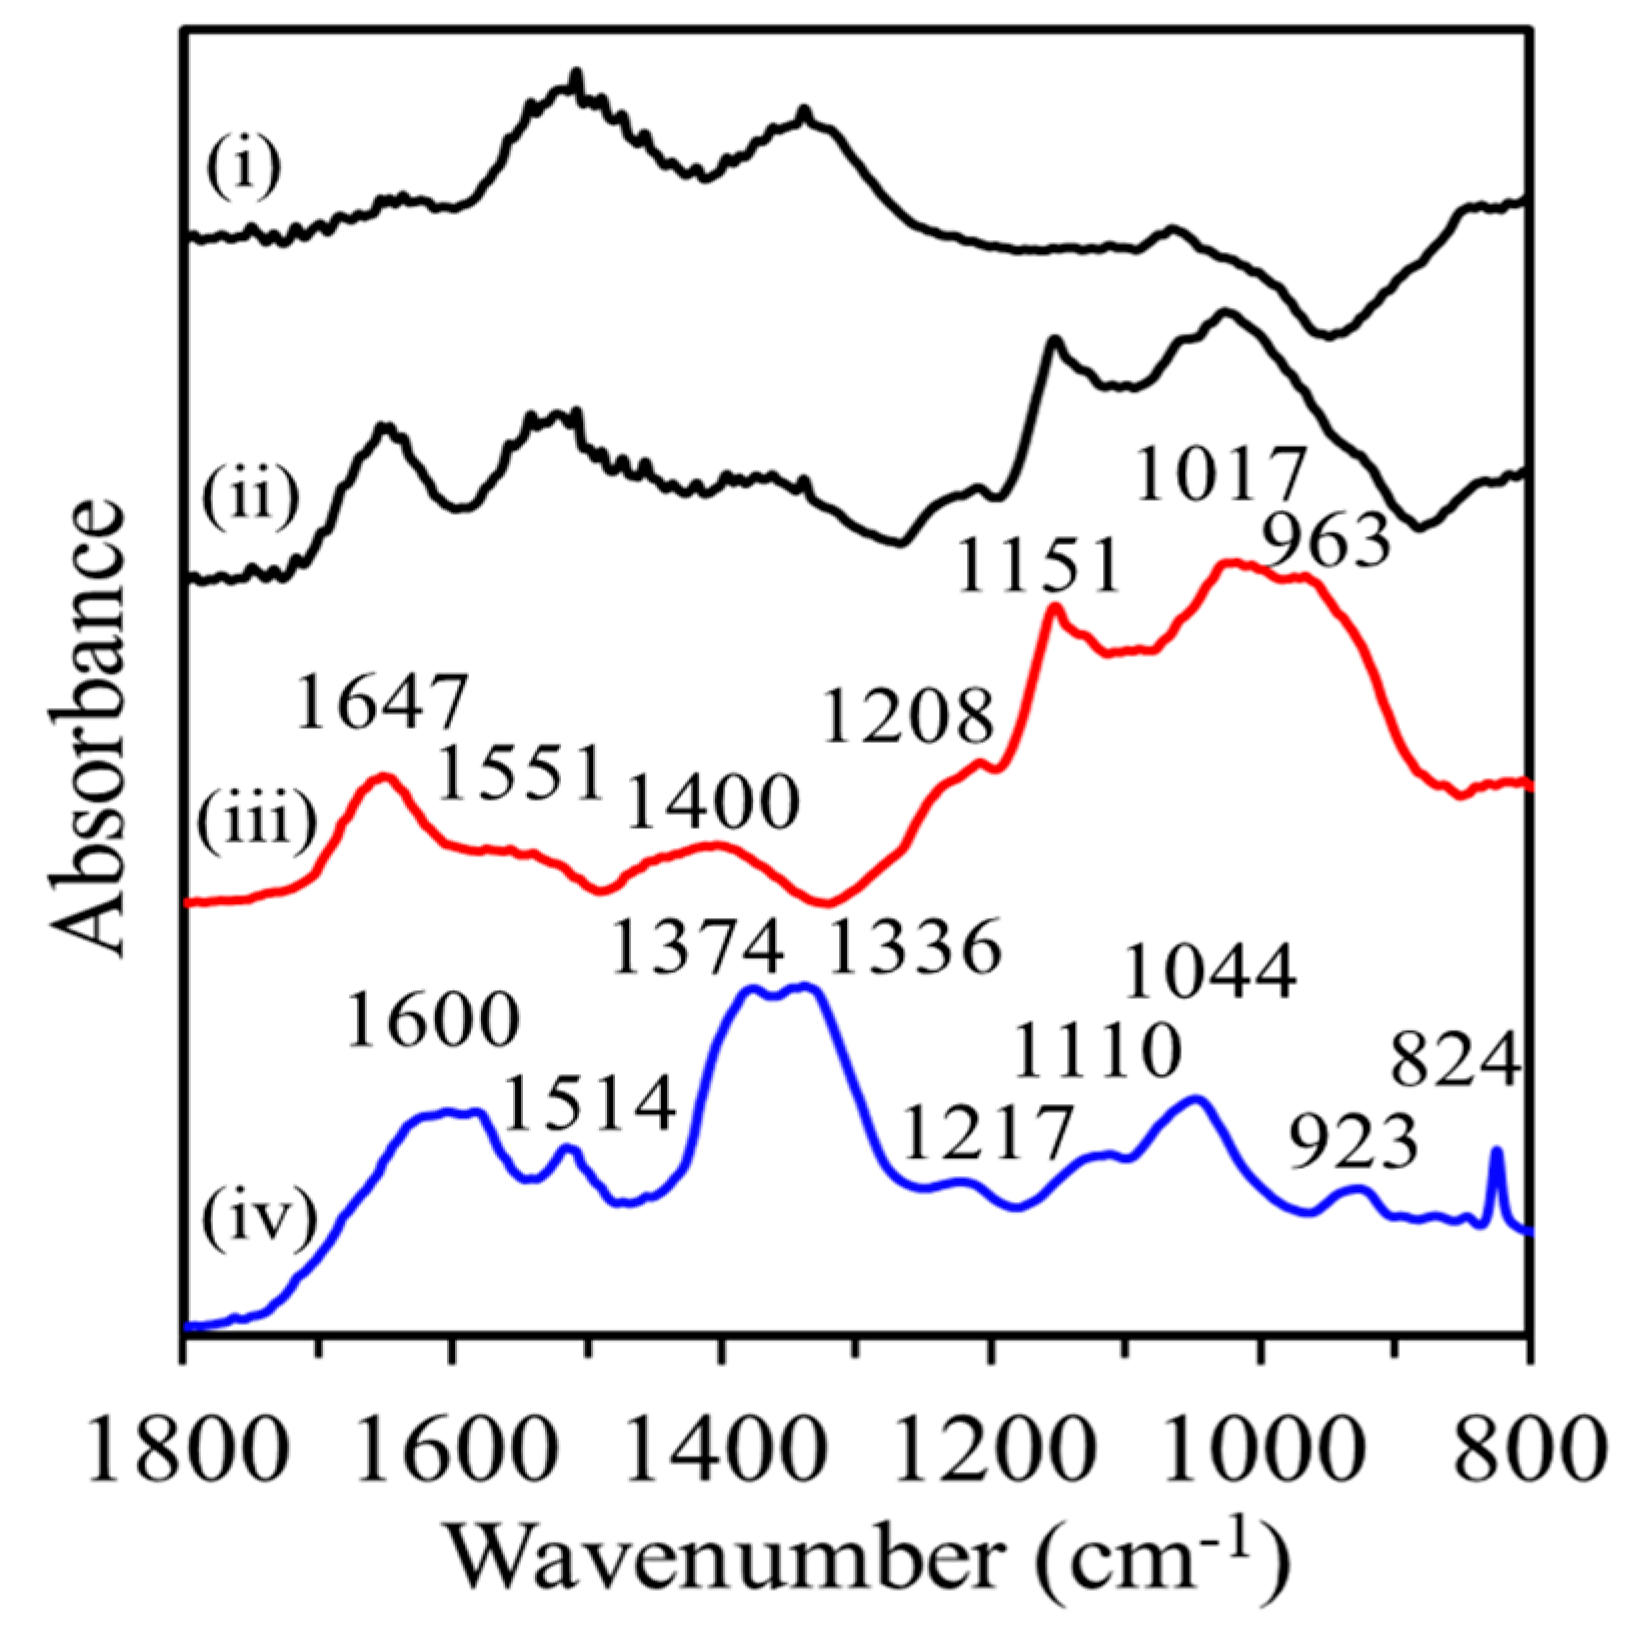
Figure 5 shows the results of the FTIR spectra of pristine CeNPs (i) and CeNPs adsorbing EPS (ii); and the difference between these two spectra (red line (iii)); which corresponds to the spectrum of only the adsorbed EPS components. The band assignments are summarized in
Table 2. The FTIR spectrum explicitly revealed the significant difference in the relative intensity of the band between the adsorbed EPS (red line (iii)) and that of unreacted EPS (blue line (iv)); suggesting the preferential adsorption of particular EPS components onto the CeNPs; phosphoryl group and saccharides were preferentially adsorbed, while the relative intensity of the bands assigned to amide I, amide II and carboxyl group were suppressed after adsorption. In particular, the relative intensity of the amide II band was suppressed more than that of the amide I band. Because the amide I absorbance band is derived from the vibration of C=O in the amide I and carboxylate, the relative decrease of amide I band indicates that protein adsorption was not a dominant process. These results are consistent with a previous study by Omoike and others reporting that polysaccharide and phosphate groups selectively adsorb onto amorphous Al(OH)
3 surfaces [
35], whereas less protein was adsorbed. It is already known that the adsorption of phosphate groups is configured by inner-sphere surface complexes between phosphoryl-containing compound such as phospholipids, and Fe-oxide minerals (goethite and hematite) [
41], while sugar acids adsorb on the amorphous Al(OH)
3 surface by weaker electrostatic interactions [
32]. One can expect that the adsorption onto CeNP surfaces may be controlled by inner-sphere coordination and weaker electrostatic interaction.
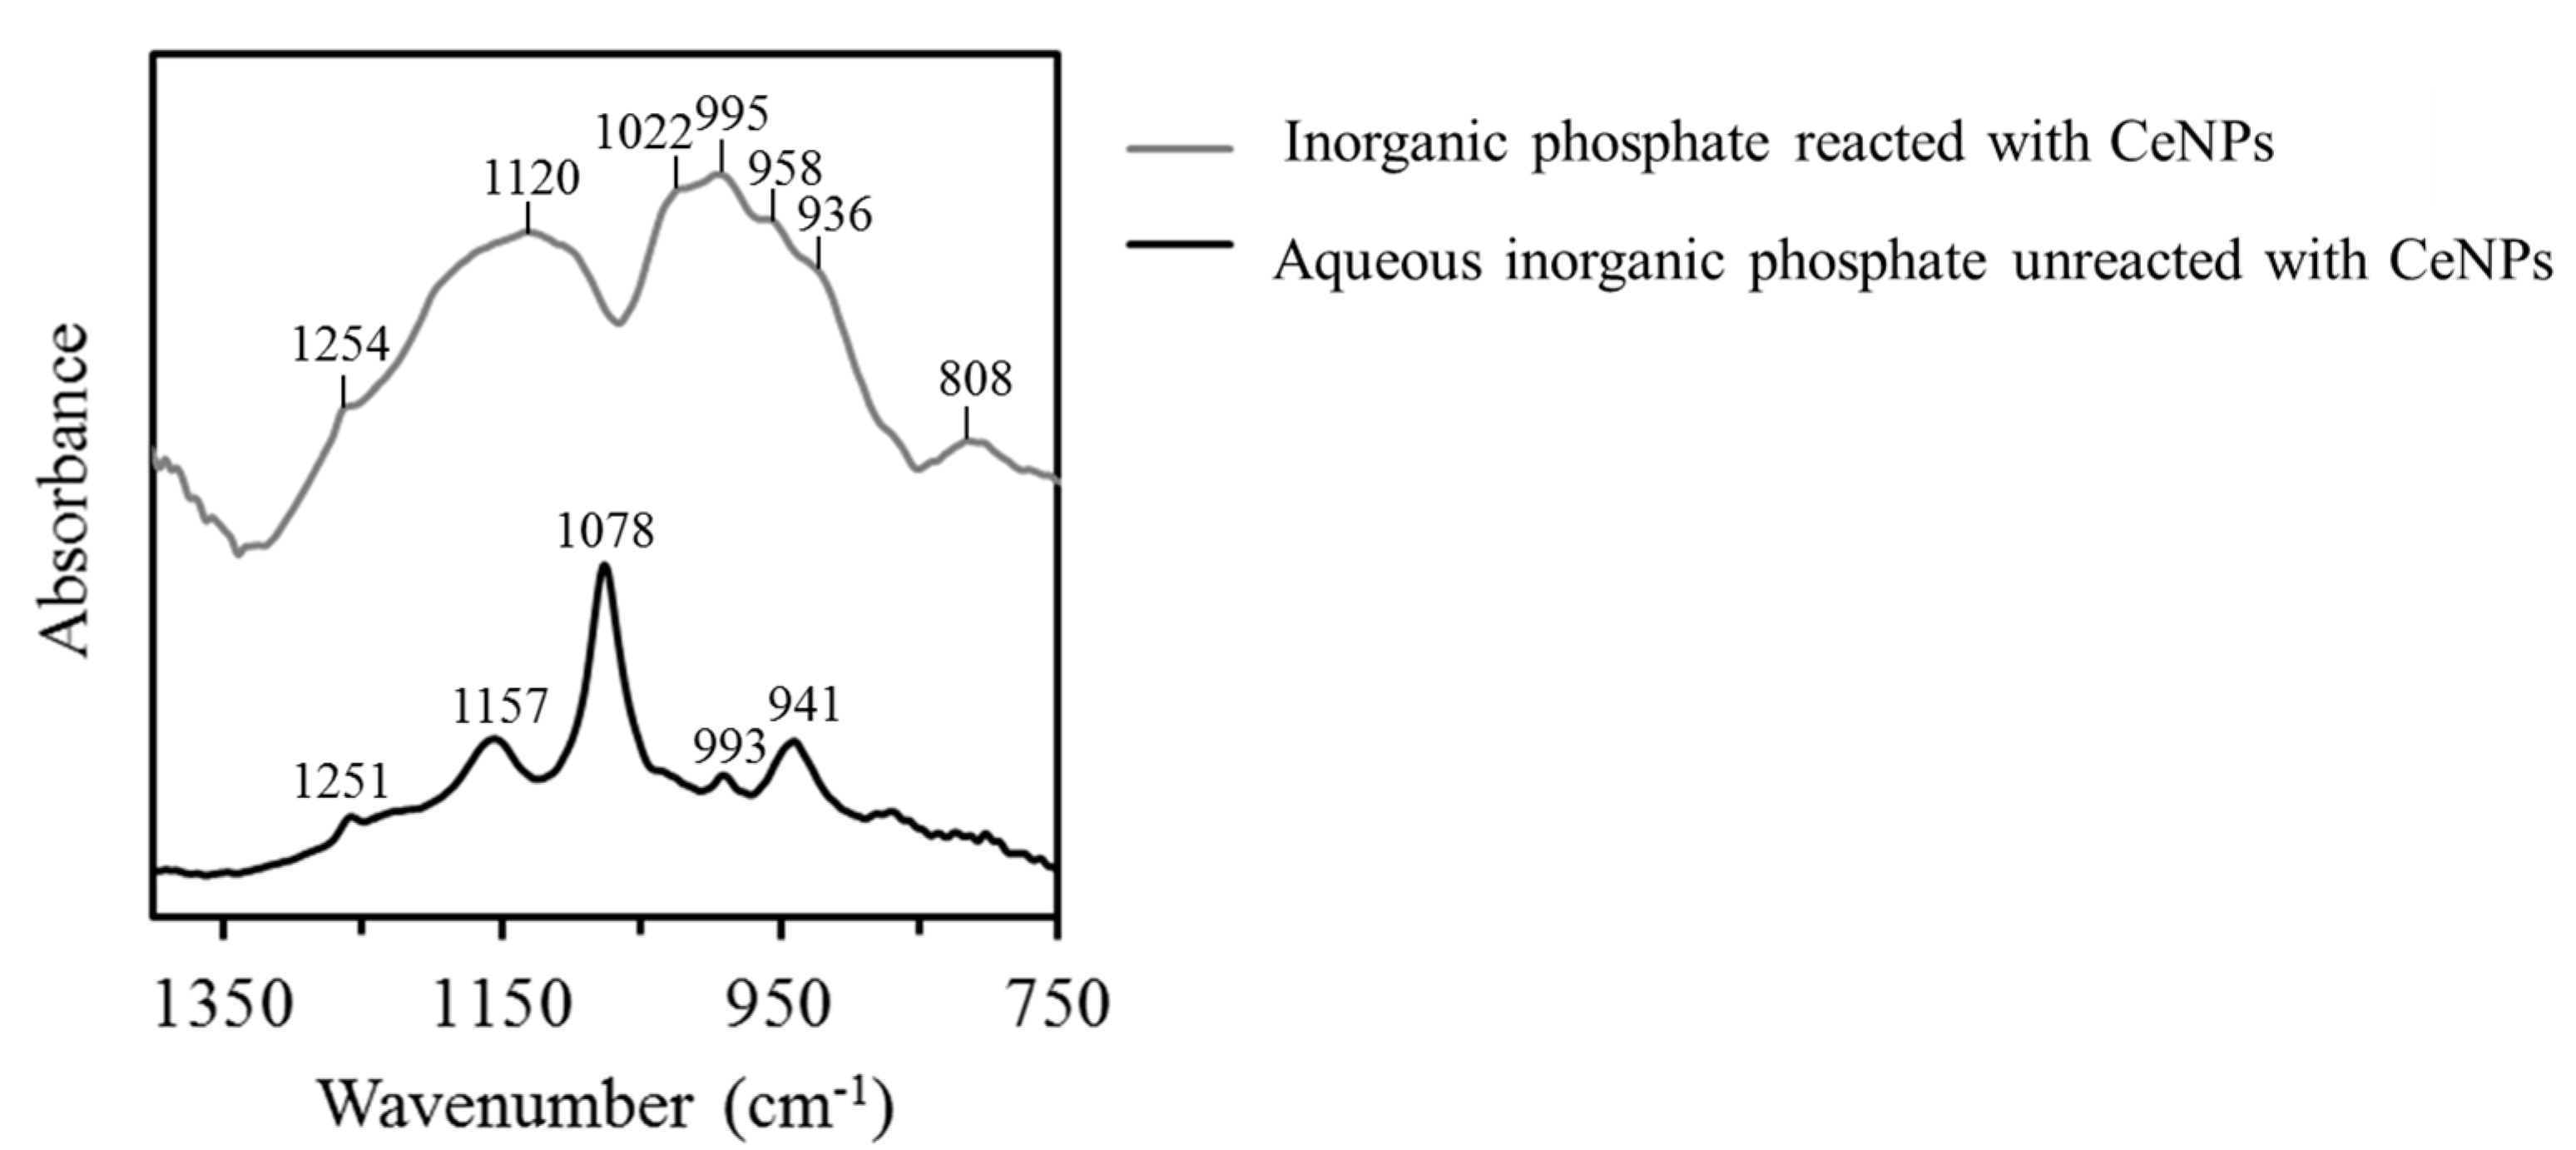
Figure 6 shows the FTIR spectra of orthophosphate in aqueous solution and orthophosphate adsorbed onto CeNPs. In aqueous solution, orthophosphate can dissociate to four species depending on the solution pH through the following reactions:
The dissociation constants of the above reactions are
Ka1 = 10
−2.2,
Ka2 = 10
−7.2, and
Ka3 = 10
−12.3, respectively [
42]. A diagram plotting the speciation of orthophosphate reveals that H
2PO
4− is the predominant species at solution pH 6 (
Figure S1). For the FTIR spectrum of orthophosphate in aqueous solution, the bands at 1157 and 1078 cm
−1 can be assigned to the P=O stretching mode of the H
2PO
4− ion, and the one at 941 cm
−1 to the P-O stretching mode of the H
2PO
4− ion. The band at 993 cm
−1 can be assigned to the P=O stretching mode of the HPO
42− ion [
36]. The FTIR spectrum of orthophosphate adsorbed onto CeNPs revealed the P=O stretching band of the adsorbed orthophosphate species at 1070–1250 cm
−1 and P-OX stretching mode of adsorbed orthophosphate (X = H or Ce) at 845–1070 cm
−1. Broadness of the bands is attributed to two factors: one is the change in the P-OX vibration frequency. The electron density of the P-OCe bond is greater than that of the P-OH bond because of the smaller electronegativity of Ce than that of H. Thus, the frequency of the P-OCe vibration became greater than that of the P-OH mode. The broadness represents that both P-OH and P-OCe vibration are present at the CeNPs surface. The other factor is various adsorption forms such as monodentate or bidentate complexes. The frequency values of the P=O and P-OX vibration are altered by the adsorption form. Barja and others reported that the adsorption form is constrained by the adsorption density, where bridging bidentate complexes can transform to protonated monodentate complexes with increasing the adsorption density [
43]. Similarly, the broadening of the bands should be partly ascribed to the multiple adsorption forms at the CeNPs surface in the present experiments. Thus, orthophosphate adsorbs onto CeNPs as an inner-sphere surface complex under both conditions with and without organic matter in the present experiment.
Figure 7A–D show the XPS spectra of CeNPs reacted with EPS for 1 h. Deconvolution was performed in a similar manner to the procedure done for
Figure 2. The O 1s peak at 529.0 eV was first assigned to oxygen in CeO
2. Compared to the spectrum of pristine EPS (
Figure 2), the P/C molar ratio of the EPS adsorbed onto CeNPs, which was calculated based on the integrated intensity of the P and C peaks, increased from 0.026 to 0.137 (
Table 4), indicating that phosphorus compounds preferentially adsorbed onto CeNP surfaces. This is consistent with the FTIR results, revealing the preferential adsorption of phosphate. The peak position of P 2p did not shift after EPS adsorption (
Figure 2D and
Figure 7D), because orthophosphate is dominantly present in both cases.
Table 5 summarizes the fraction of the functional groups among each element based on the integrated intensity of each corresponding peak after peak separation compared with the total intensity of peaks for each element. Notably, the fraction of C-(C,H) species among total C species increased compared with that of the pristine EPS, indicating that organic matter containing carbon chains such as lipids, amino acid side chains, or ring chains of saccharides preferentially adsorbed onto CeNP surfaces compared with proteins and carboxylates. As for the N 1s peak in the pristine EPS before the adsorption experiments, the fraction of amides (non-protonated) that are generally characterized as adenosine, nucleic acid, and amino acid is less than that of the protonated amine group (
Figure 2C,
Table 5). In contrast, the N compounds adsorbed onto CeNPs were protonated amine groups, indicating the presence of only proteins among the N compounds. As a consequence, XPS analysis revealed that the lipids, saccharides, and phosphates preferentially adsorbed onto CeNP surfaces, while only a small amount of proteins adsorbed. These results are consistent with that of FTIR analysis.
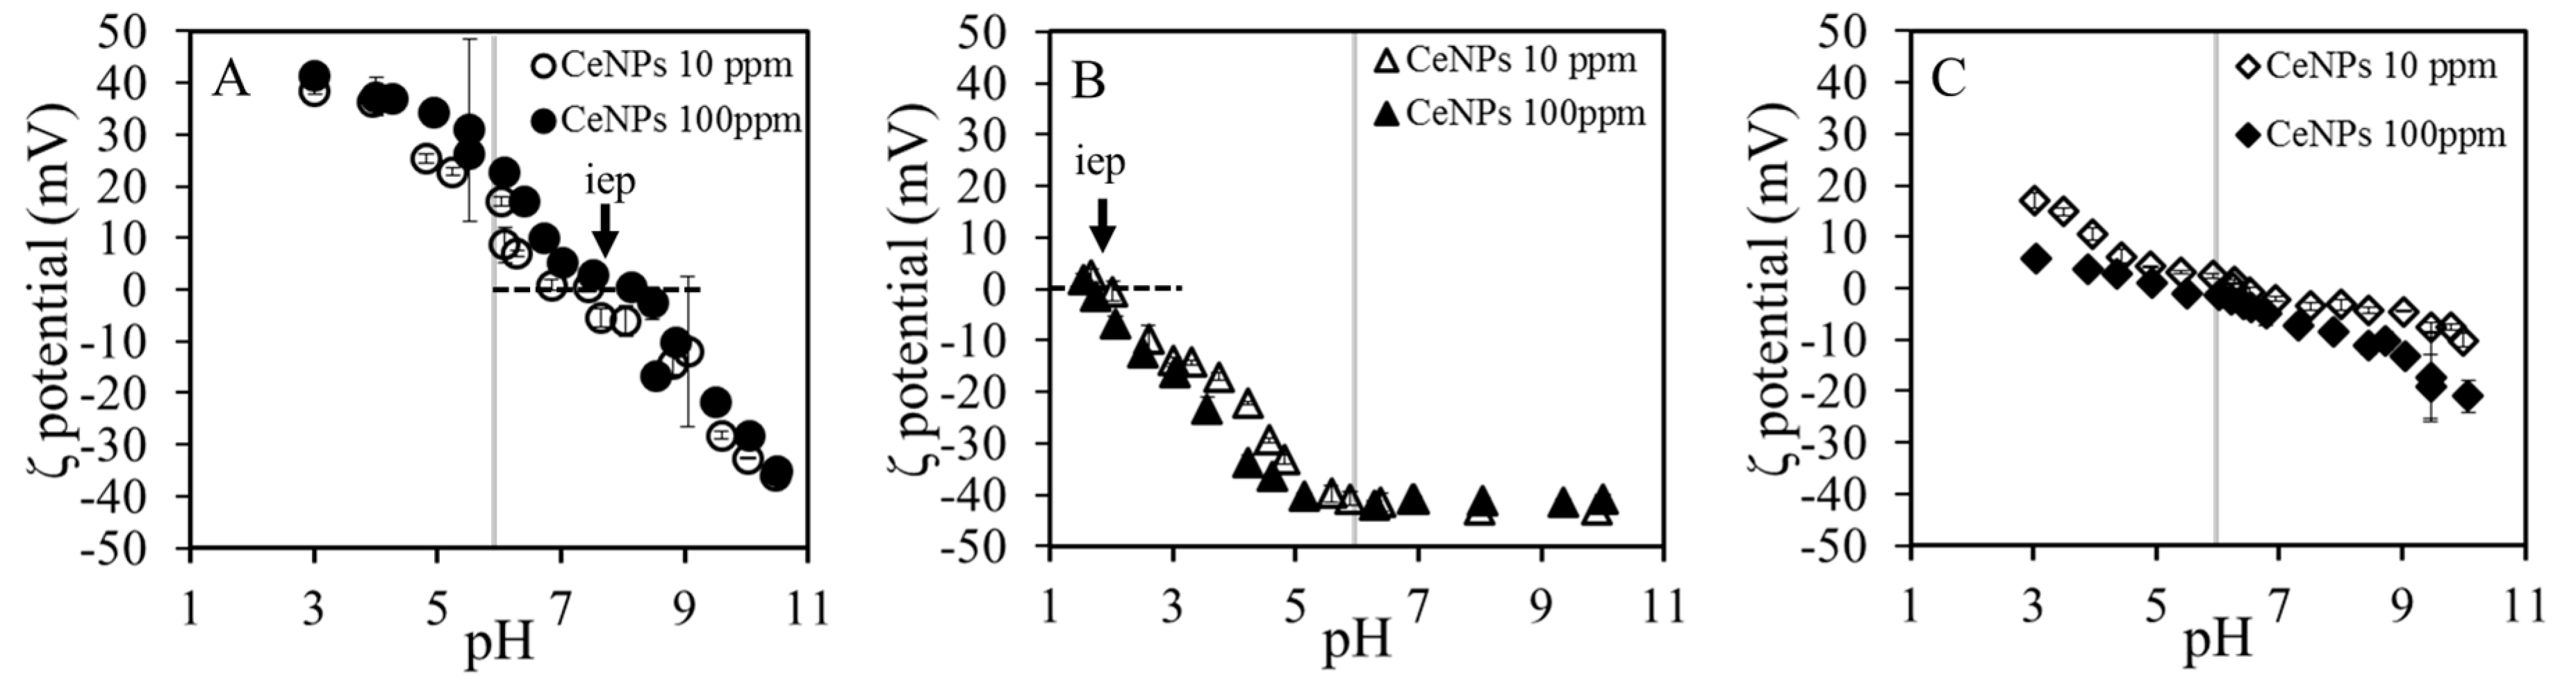
3.3. Effects of EPS on Zeta Potential of the CeNPs
The ζ potential of 10 or 100 mg L
−1 CeNPs in 1 mM NaCl solution is plotted as a function of solution pH in
Figure 8. The isoelectric point (iep) of the pristine CeNP surface was estimated to be 7.5 (
Figure 8A), which is in good agreement with the value previously reported; 6.6 and 8.0 [
9,
44]. In the presence of phosphate, the ζ potential decreased dramatically, and the iep decreased to ~2.0. Regardless of the CeNP concentration, the reduction of ζ potential remained unchanged. At pH > 1, H
2PO
4− and/or HPO
42−, can be present in the solution and the ζ potential decreased due to the adsorption of anionic species on CeNP surfaces (
Figure 8B). A similar mechanism was recognized in case of the phosphate adsorption onto goethite [
36]. In contrast, the adsorption of EPS neutralized the ζ potential regardless of the CeNPs concentration (
Figure 8C). Slight difference in the pH dependence of ζ potential between the two different CeNP concentrations may be ascribed to the different coverage of adsorbed EPS compounds over the CeNP surfaces. In the experiment of EPS adsorption, phosphate also adsorbed onto CeNP surfaces as described in the previous section, and the amount of adsorbed phosphate is greater than that in the adsorption experiment of inorganic P (
Figure 3). Despite the fact that a greater amount of P is adsorbed onto the CeNP surfaces, the ζ potential appeared to be neutralized and unaffected by the phosphate adsorption. It is known that low molecular weight organic matter such as citric acids can modify the surface charge by adsorption, which typically lower the ζ potential. Thus, the neutralizing effect of EPS on the ζ potentials cannot be fully explained by the adsorption of organic matter with low molecular weight [
12,
45]. In general, the ζ potential reflects the potential difference between the shear plane and the bulk phase, and the shear plane potential is affected by charge of the outermost surface. In case of the EPS adsorption, saccharides and proteins are likely present at the outermost surface because the molecular size is much larger than the molecular size of orthophosphate. Thus, the effects of phosphate adsorption on the ζ potential was suppressed by adsorption of these large molecules in the EPS solution.
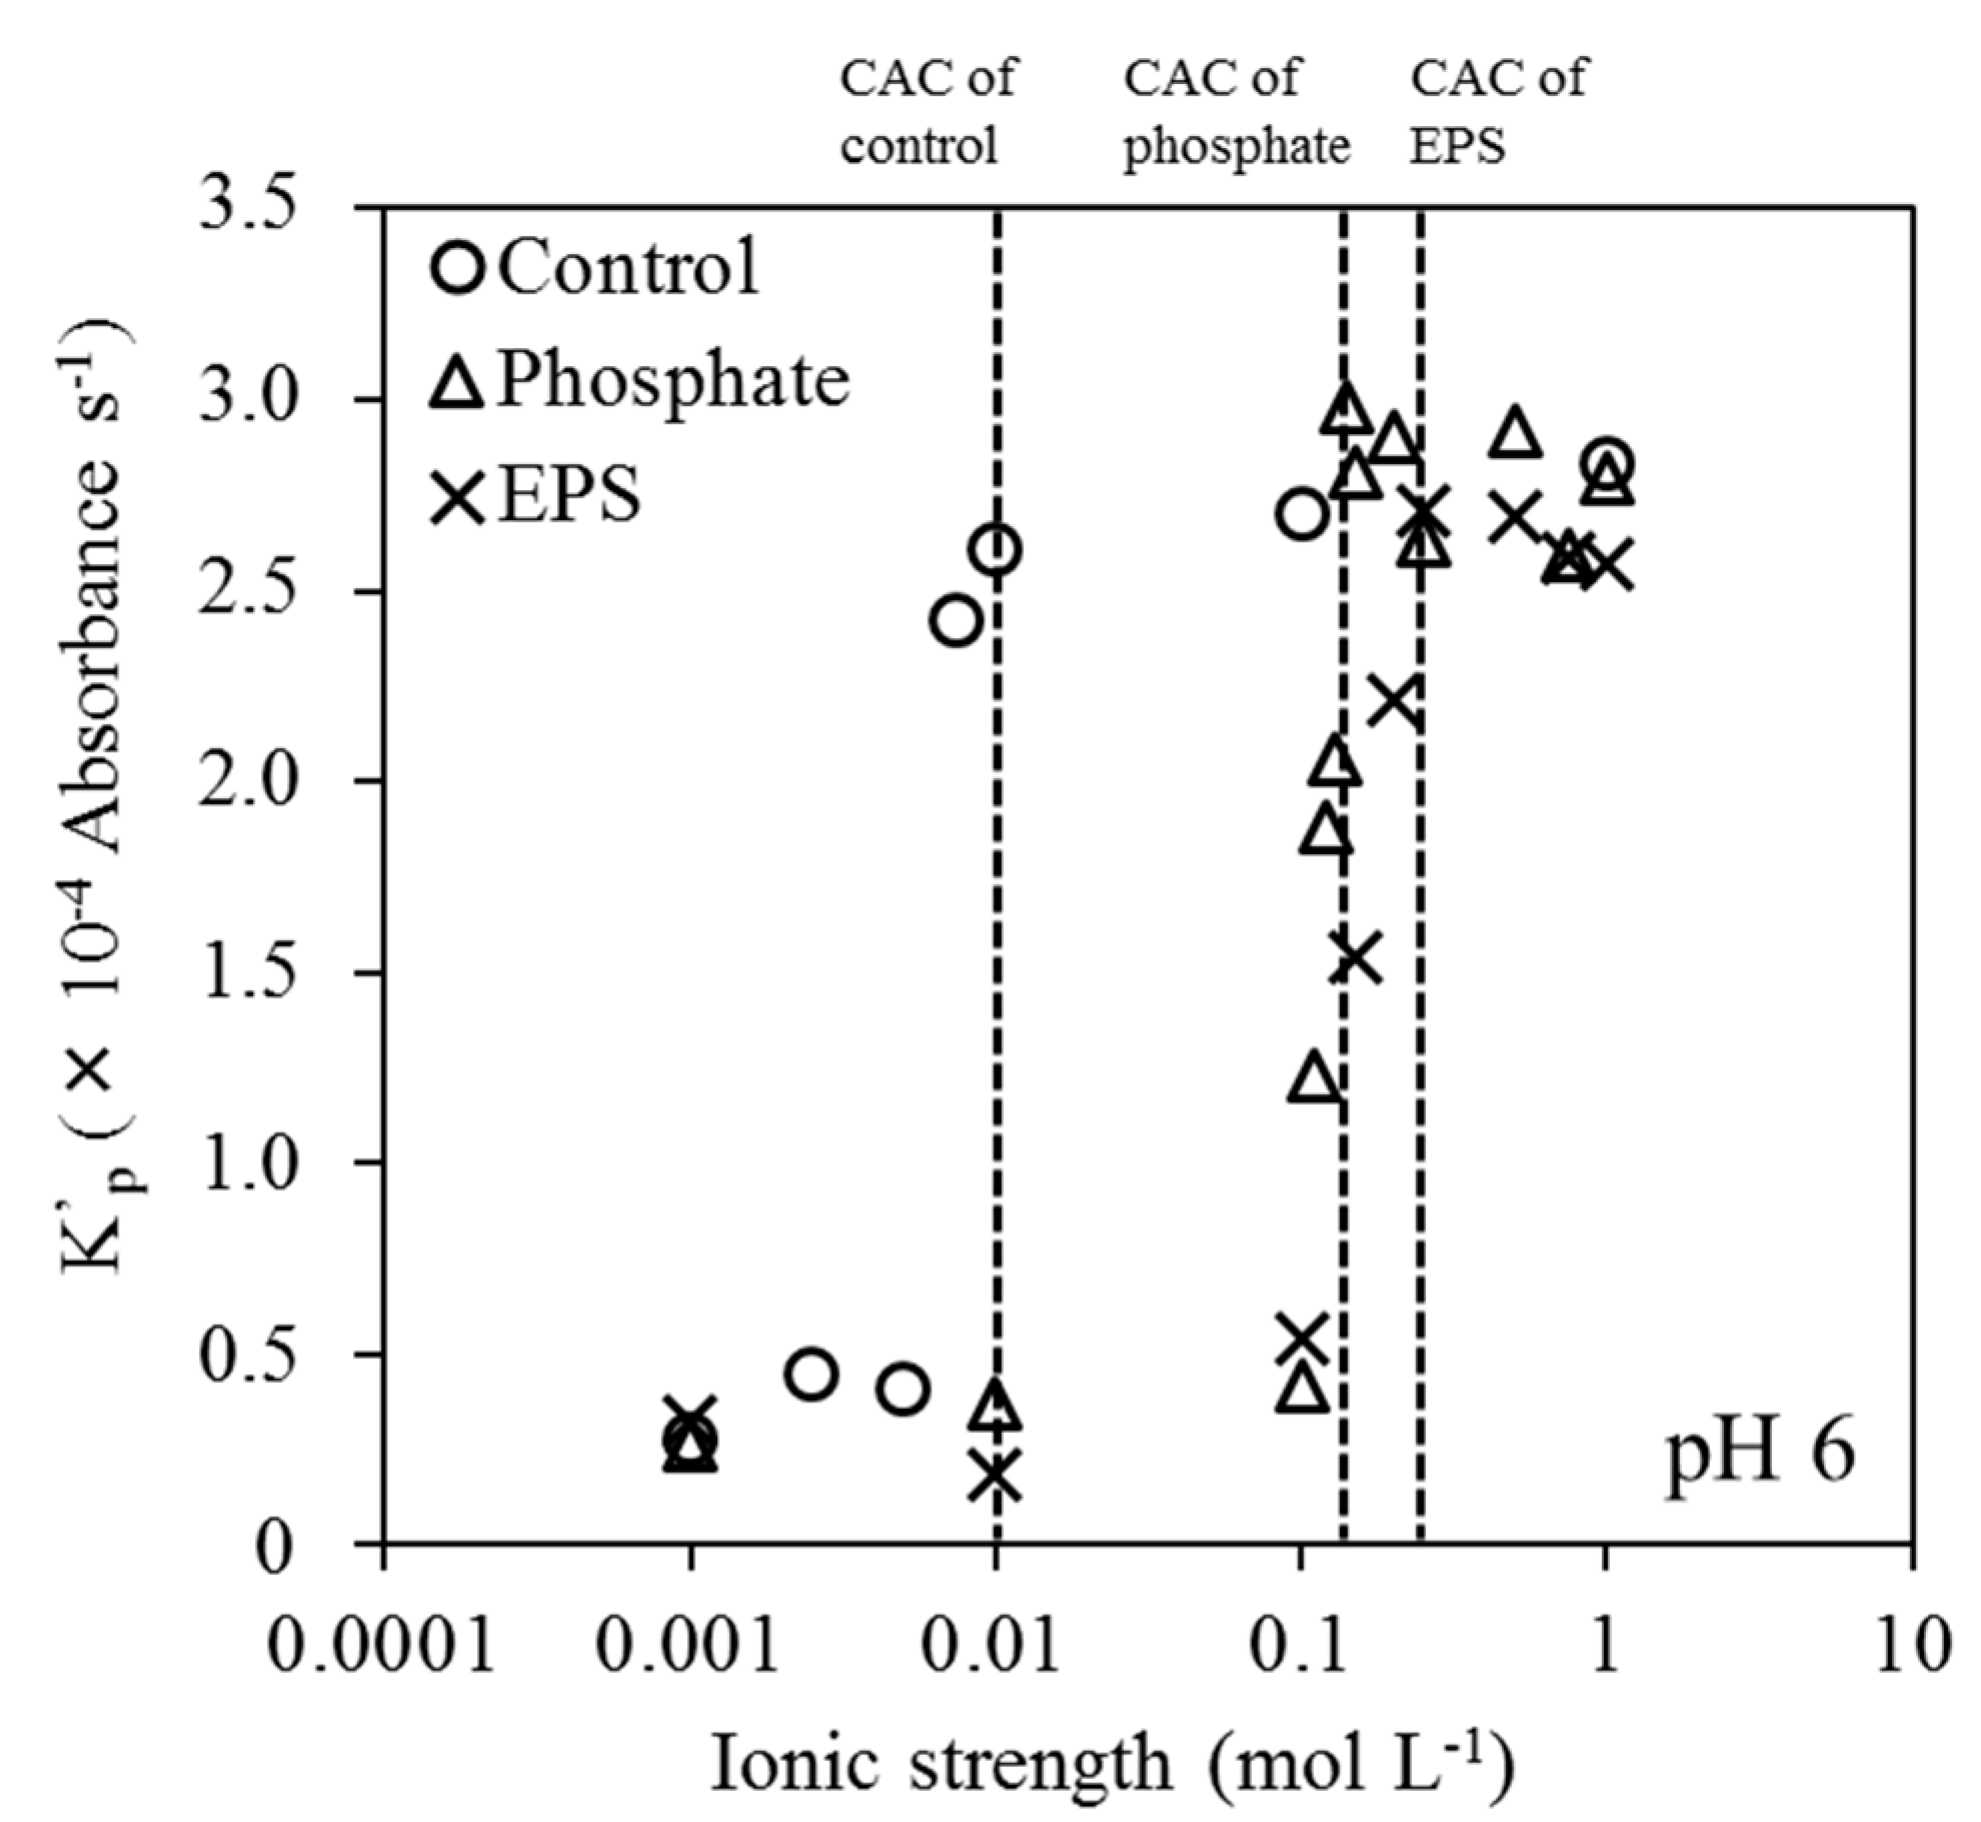
3.4. Effects of EPS on Aggregation and Sedimentation
In the present experiments, the optical absorbance was measured using UV-Vis to analyze the turbidity of solution in three different conditions: control solution, inorganic orthophosphate solution, and EPS solution with 100 mg L
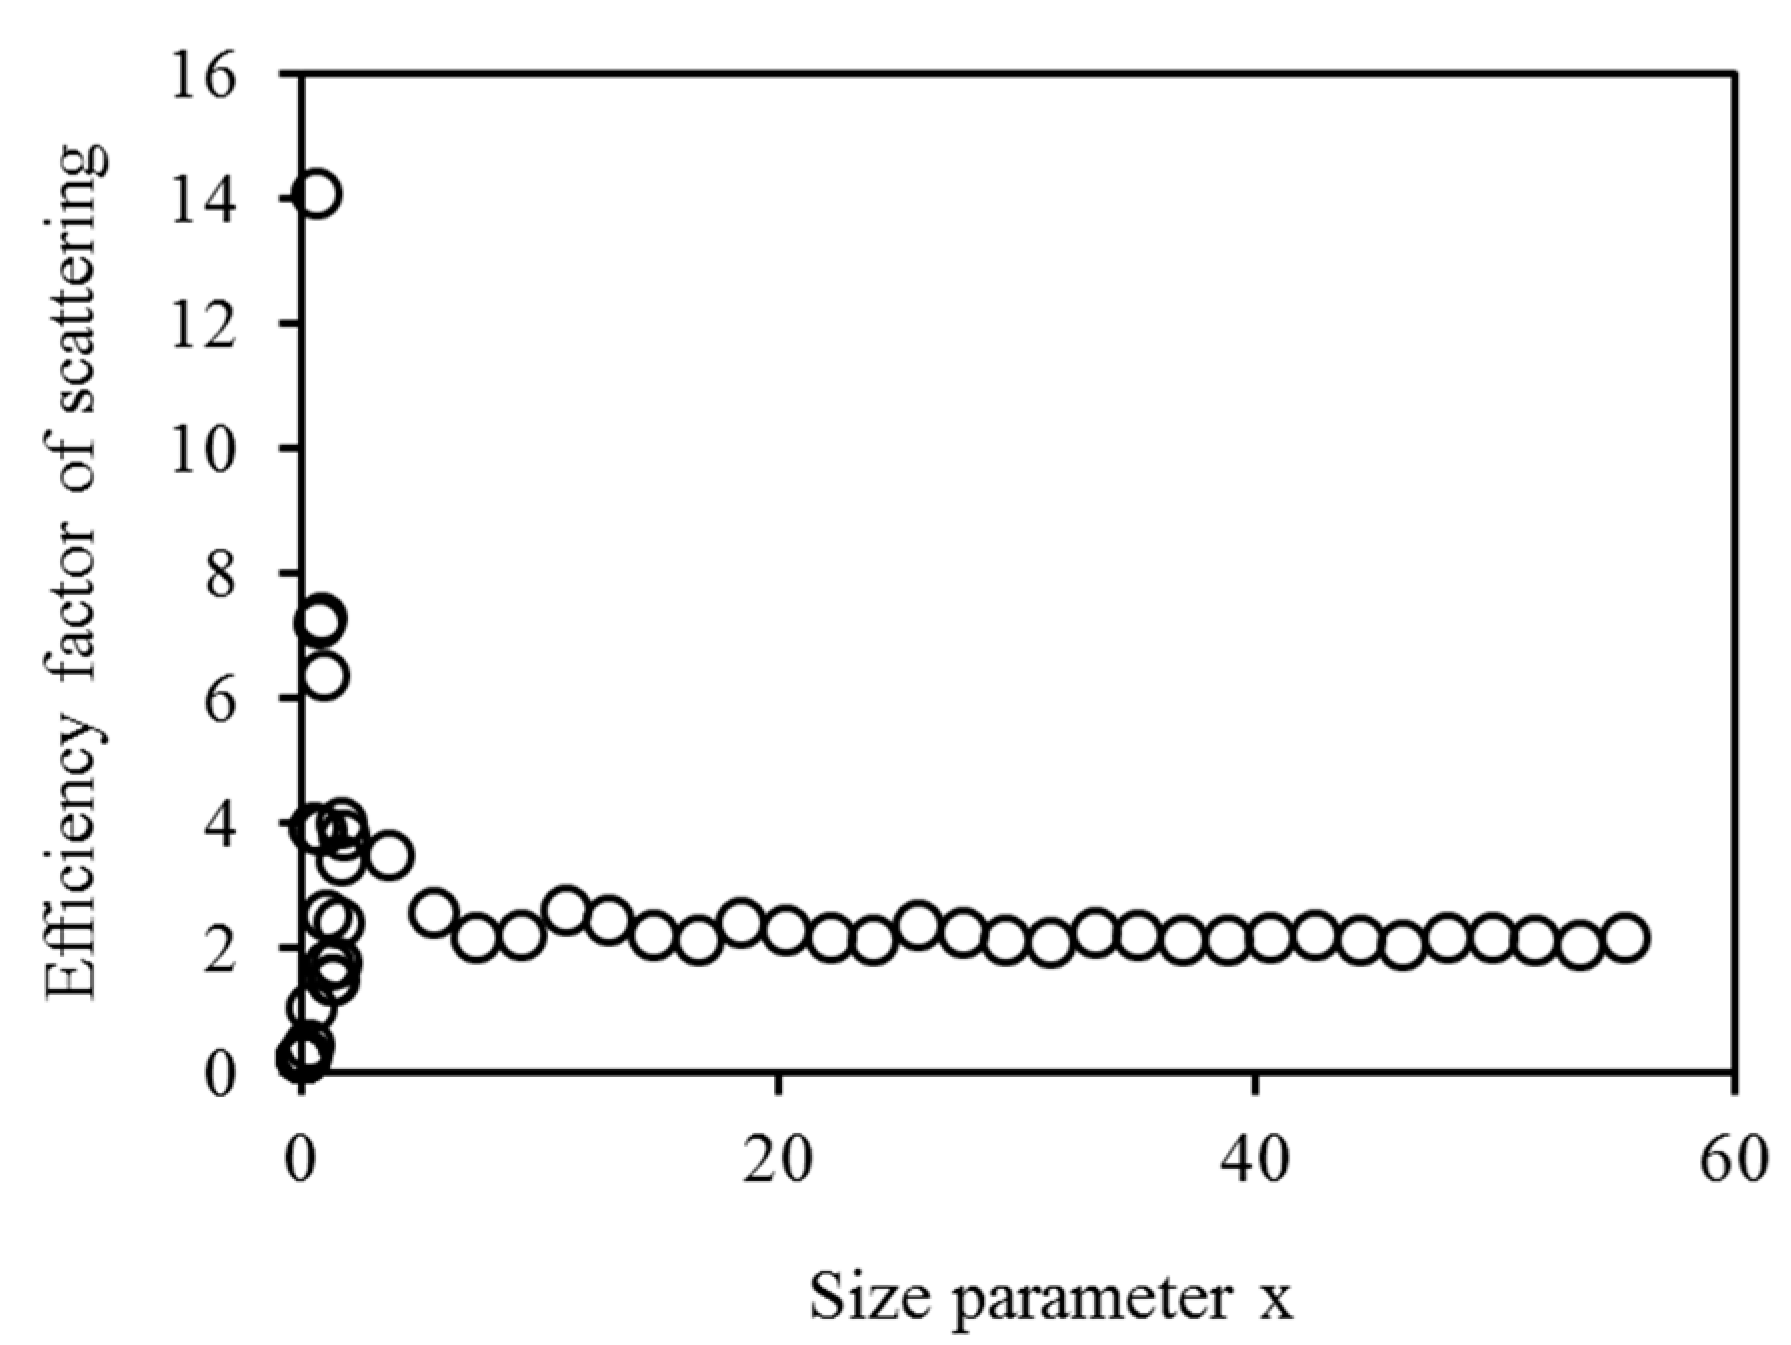
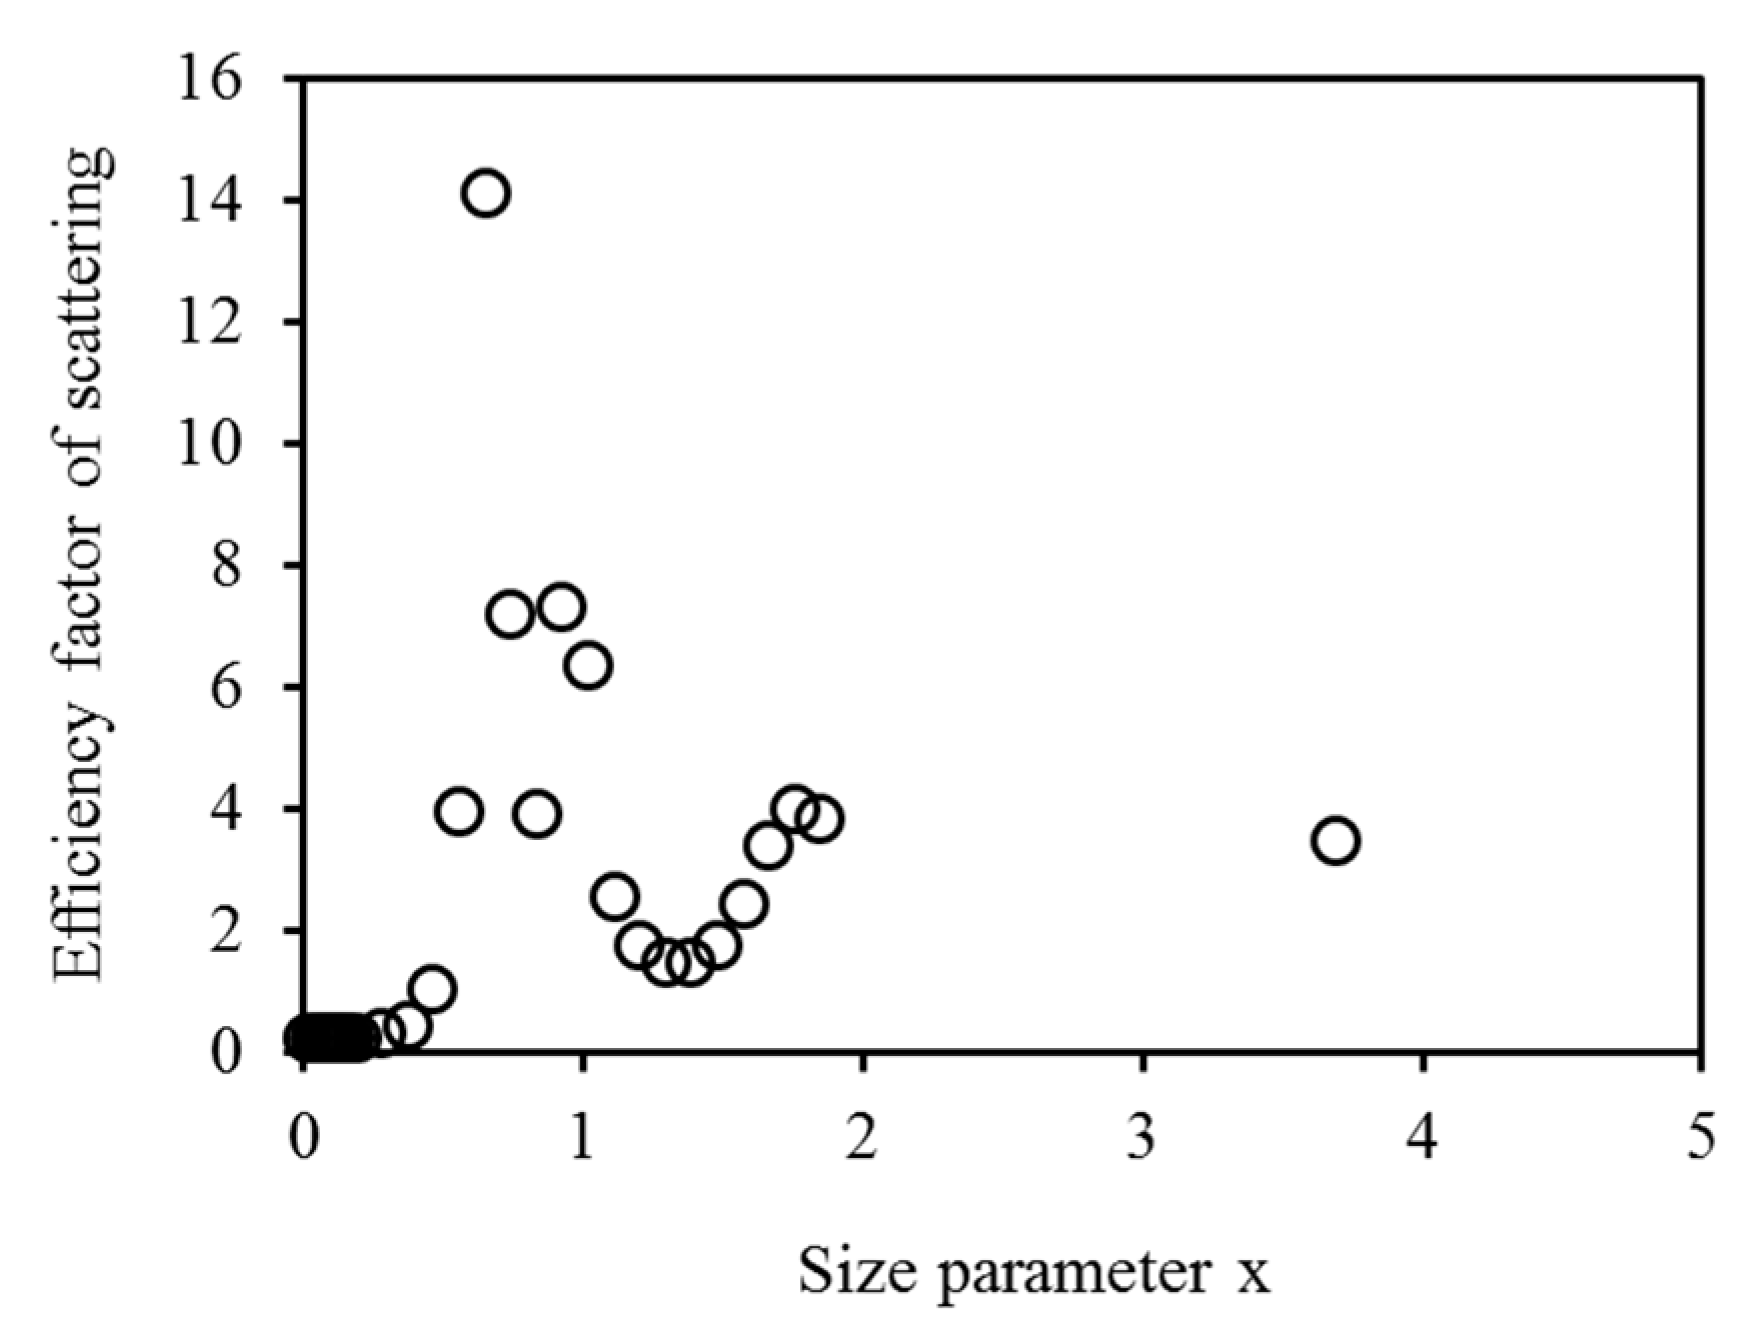
−1 CeNP concentration. Then, the absorbance was converted to the number of particle based on theoretical considerations, which are described in detail in the
Appendix. The aggregation rate constant,
Kp′, was calculated based on Equation (2) as described in the materials and methods section, and the results were summarized in
Table 6.
The
Kp′ plot as a function of ionic strength revealed a drastic increase at the different ionic strengths in the three solutions: 0.01 mol L
−1 for control, 0.14 mol L
−1 for inorganic phosphate, and 0.25 mol L
−1 for EPS solution, which corresponds to the critical aggregation concentration, CAC. Obviously, the CACs in the inorganic phosphate and EPS solutions are greater than that in the control solution at pH of 6, indicating that the adsorption of phosphate and saccharides increased the dispersibility. The enhanced dispersibility was also confirmed by the DLS analysis (
Figure S2). It is noted that the CAC in the EPS solution is slightly higher than that in the inorganic phosphate solution, which may be attributed to the presence of organic molecules such as saccharides and proteins in the EPS solution. In the inorganic phosphate solution, the surface charge is strongly negative (−40 mV) compared with that in the control solution (+23 mV) at pH 6 (
Figure 8). It is known that the electrostatic repulsive force is effective between the particles with negative charge, because the energetic barrier appears over ±20 mV according to the DLVO theory (
Figure S3). In case of the inorganic phosphate solution, the enhanced dispersibility was simply attributed to electrostatic repulsion. The aggregation rate constant dramatically increased above the CAC, because the thickness of the diffuse double layer collapses with increasing ionic strength (
Equation (S5) in Supplementary Materials). On the other hand, in the EPS solution, the dispersibility of CeNPs was also enhanced despite the ζ potential being ~0 mV at pH 6, indicating that the dispersibility was not enhanced only by electrostatic interaction and there is additional mechanism constraining the ζ potential in EPS. In particular, the adsorbed organic matter of EPS, predominantly saccharides and proteins, might play a role on enhancing the dispersibility in the EPS solution. Indeed, Safinajafabadi and others also reported that the colloidal stability was enhanced by the adsorption of saccharides including glucose, maltose, and dextrin [
46]. Protein (bovine serum albumin) adsorption can also enhance the dispersibility of SiO
2 nanoparticles near the isoelectric point [
47]. In general, the adsorption of organic matter forms a steric barrier over the particles, leading to the colloidal stabilization. The steric barrier can occur even with the molecular weight as low as ~650 and becomes more significant with increasing molecular weight [
48]. Hence, it is plausible that the adsorption of saccharides enhanced the colloidal stability by forming the steric barrier over CeNPs in the EPS solution in the present experiment. Although the difference in CAC between EPS solution and inorganic phosphate solution was small as revealed in
Figure 9, the increment of the aggregation rate constant near CAC in the EPS solution is slightly more moderate than that in the inorganic phosphate solution, implying that the steric stabilization is relatively resistant to the effect of ionic strength compared with the electrostatic stabilization.
Apparently natural sub-surface environment is a more complex system than the present experimental setting, because there are EPS derived from numerous kinds of microorganisms and a variety of nanoparticle phases along with many other molecular species in solution. Nevertheless, the present study at least demonstrates that EPS derived from microorganisms can adsorb to metal oxide nanoparticles with specific organic species preferentially adsorbed, modified the surface properties, and changed their stability through the steric barrier derived from organic compounds as well as the electrostatic repulsive forces of the adsorbed ionic species in EPS. In the present experiments, the EPS was released after the incubation in YPD media that contains high P content and thus, the P concentration in the EPS is most likely higher than the one released from microorganisms in subsurface environments except for the microorganisms colonized adjacent to apatite [
49]. In typical shallow groundwater with the ionic strength of the order of 10
−2 mol L
−1 [
14]. Hence, the adsorption of microbial EPS can potentially modify stability and transport of these colloids in groundwater.


