Article

Strategic Environmental Impact Assessment for Onshore Windfarm Siting in Greece

by
Dimitra G. Vagiona
* and
Xenia Karapanagiotidou
Department of Spatial Planning and Development, Aristotle University of Thessaloniki, Thessaloniki 54124, Greece
*
Author to whom correspondence should be addressed.
Environments 2019, 6(8), 94; https://doi.org/10.3390/environments6080094
Submission received: 11 June 2019 / Revised: 2 August 2019 / Accepted: 6 August 2019 / Published: 7 August 2019

Abstract

:
The distance between theory and practice in the strategic environmental assessment (SEA) process is particularly noticeable. The development of an integrated, comprehensive and systematic approach guided by the related literature is considered to be an ideal condition for enhancing the value of SEA and increasing its effectiveness. The aim of the present paper was to develop a methodological approach of the most technical and critical stages of SEA for onshore wind farm (OWF) siting. The methodological framework included the proposal of the SEA objectives along with the indicators’ development, the identification of alternatives, the selection of a ‘most viable or sustainable’ alternative, the identification of potential impacts, their assessment, and finally, the proposal of a SEA monitoring system using both qualitative and quantitative methods, tools, and techniques. OWF siting within low and/or moderate sensitivity areas was considered as the most viable/sustainable alternative. SEA highlighted that OWF siting caused moderately to highly significant negative impacts on the thematic section of biodiversity and extremely significant positive impacts on the thematic sections of renewable energy sources, economy, and society. Although the proposed methodology was applied on SEA of OWF siting in Greece, it can be used universally to identify the impacts of OWF siting planning.

1. Introduction

The conceptualization of SEA started much earlier, almost in parallel with environmental impact assessment (EIA) at a project level. The main purpose of strategic environmental assessment (SEA) is to facilitate an early and systematic consideration of potential environmental impacts in strategic decision-making [1,2]. In recent years, SEA has evolved and been applied worldwide in a variety of sectors and in various ways to identify and assess the potential environmental impacts of policies, plans, and programs (PPPs), as well as to identify and evaluate alternatives to avoid, mitigate, or compensate for these impacts [3,4,5,6,7].
During this time, several critical issues relating not only to its theoretical framework, but also to its methodological approach, have appeared. Regarding the implementation level, these issues can be categorized into two basic groups. The first concern the lack of a SEA guideline and the second, the lack of training by experts [8]. In the first case, the lack of a comprehensive, systematic, and formal guideline on SEA techniques and methodology [8,9] strengthens its methodological uncertainty and key questions that remain unanswered, such as how SEA should be conducted according to the implementation level PPPs; the sector, and their impact on the environment, economy, and society [10]; which analytical and participatory methods and tools should be used and in which stages of SEA process, etc. Noble et al. [9] highlighted that present discussions and surveys on a SEA methodology development are marginal. In addition, the absence of a methodological guideline further increases the distance between theory and practice. This is reflected in the continuous development of various ad hoc practices in SEA [11]. Although the related theoretical framework suggests that SEA is a process that has substantial differences compared to EIA (strategic or higher decision making, early execution, etc.), its implementation in many cases seems to explicitly follow the technical-rational approach of the latter [12].
These issues are particularly important as they significantly affect the effectiveness of SEA, generating intense concerns and debates. Many attempts have been performed to explore the factors which act catalytically in its achievement (e.g., [13,14,15,16]), with the one of Li et al. [17] standing out because of its interesting research results. They identified three main factors that influence effectiveness, including its legislative framework, management (process, methods, techniques, etc.) and the decision-making process (data, consultation, contribution of specialists, etc.). In terms of management, it was noted that an inefficient SEA would result due to its late implementation, the lack of basic mechanisms determining the ‘uncertainty’ factor and the appropriate methods, techniques, and assessment indicators [17].
Several methods, tools, and techniques (e.g., scenario analysis, life cycle assessment, input-output analysis, risk assessment, multi-criteria analysis, environmental objectives, economic valuation, surveys), as well as combinations of them, could be used in SEA process. However, according to [9], SEA offers great flexibility in selecting methods that can be used, but this possibility seems restricted, as the methods implemented are limited. Dalkmann et al. [18] recommended the inclusion of multi-criteria analysis technique to favor the applicability of SEA results in the decision-making process, which has been strongly advised by various authors in several sectors [2,19,20,21,22].
Greece has a great tradition of planning and a well-structured planning system which covers multiple planning scales (national, regional, metropolitan, sub-regional, municipality level) and various sectors (e.g. urban and regional planning, energy, transportation, water resources, wastes) through its strategic and regulatory plans. However, SEA has not yet been well established. In fact, environmental impact assessment in Greece is conducted and recognized mainly at project level (EIA), while the attempts for SEA are quite limited. The European Directive 2001/42/EC or SEA Directive [23] was adopted and entered into force at national level with the Greek Law on 6 September 2006 after the Common Ministerial Decision of the Ministry of Environment, Energy, and Climate Change and the Minister of Finance and Economics [24]. This delay, combined with the general lack of an SEA guideline, has resulted in Greece becoming rather an amateur in SEA-related issues. One of the first and most substantial efforts for SEA development was the one conducted for the Special Framework for Spatial Planning and Sustainable Development for Renewable Energy Sources (SFSPSD-RES) [25], which constitutes a reference point of the present paper. Despite this effort, a structured approach to SEA and an overall methodological framework are still lacking.
Considering the extensive literature and research on theoretical issues related to SEA, although there are significant methodological deficiencies, it is suggested that the former should adequately support the latter in conjunction with some new additions. In this framework, the objective of the present paper was to excerpt and combine all the critical elements, such as theoretical background, recommended methods, and tools and techniques, to formulate a more comprehensive methodological approach of the most technical and crucial stages of SEA. The present paper proposes a methodological framework of the SEA process that consists of six well-defined stages and uses various analytical tools, methods and techniques. The proposed methodological approach involves the use of qualitative and quantitative techniques for environmental impact assessment as well as the use of tools for processing spatial information such as the geographic information system (GIS). A critical advantage of the proposed methodology is that it meets existing methodological gaps on strategic environmental impact assessment by (i) providing an integrated methodology, including the most technical and basic stages of SEA; and (ii) addressing not only thematic sections that the SEA directive proposes, but also covering economic, social, and political issues. The proposed methodology was applied on SEA of an onshore wind farm (OWF) siting in Greece. SEAs for energy generation are scarce in the international literature [21,26] and the analysis of SEA practice related to renewable energy development has been limited to a few studies (e.g., [27]). This paper is the first international English-speaking publication on SEA in Greece.

2. Environmental, Economic, and Social Baseline of the Study Area

Greece covers 131,957 km and its total population was estimated at 10.7 million people in 2018 [28], showing a steadily downward trend. It displays a variety of environmental elements of particular interest. According to land cover data, the largest area of the country is covered by agricultural land, forests, and developed land, with the former two showing a shrinking of 0.04% (total area 51,269 km2) and 0.17% (total area 24,872 km2) respectively, while the latter, an increase of 0.69% (total area 3741 km2) for the period 2000–2012 [29]. Moreover, there is a remarkable and complicated biodiversity, ranking it among the richest countries in Europe for biodiversity [30]. In order to protect and preserve this diversity, many areas are subject to more than one national (National and Regional Parks, Preserved Monuments of Nature, Wildlife Refuges, etc.) or international (Natura 2000 Network, Wetlands of International Importance-Ramsar, etc.) protection regime. A remarkable number of protection regimes concerning cultural heritage protection and reservation—e.g., UNESCO World Heritage Sites and Monuments, archaeological sites, traditional settlements, etc.—exist in the country. Figure 1a,b illustrate the environmentally protected areas defined by these conventions and the country’s cultural heritage accordingly.
According to the national program, “monitoring of the water quality of river, lake, coastal and transitional waters of Greece for the implementation of Article 8 of the Water Framework Directive 2000/60/EC” (i) with respect to the quantitative status, 81–83% of the monitoring points are classified as good status, 15–17% as bad status and roughly 2–3% remain in an unknown condition due to the lack of measurements and insufficient data; and (ii) with respect to the qualitative (chemical) status, 58–60% is in good status, 30% is in bad status [30].
A declination tendency for the main pollutant gases emission levels (NOx, SOx, CO, PM2.5, PM10, NH3, NMVOC) exists and reductions in the range of 20–80% were observed for all pollutants in 2015 (base year 1990) [30]. More specifically, 2015 emissions of sulfur oxides (SOx as SO2) were reduced by 80% in comparison to 1990. Emissions of nitrogen oxides (NOx as NO2) also diminished by 31% since 1990, and similar reductions (37% and 34% for 2015 since 1990) have been also recorded for emissions of NMVOCs and PM2.5, respectively. The decline of emissions of NH3 and PM10 has been of a lesser magnitude: (22%) and (20%), respectively [30]. Regarding climate change, Greece is in full compliance with the goals of the Paris Agreement 2015 under the United Nations Framework Convention on Climate Change [31]. Particularly, there is a gradual reduction of greenhouse gas (GHG) emissions level for the period 2007–2015, with emissions from energy production diminishing by 31.3% and from transport by 26.3% [30].
Regarding economic situations and trends, the number of employed persons in Greece was estimated at 3830.99 thousand people in 2018 and the seasonally adjusted unemployment rate edged up to 18.4% in December 2018 [28]. The gross value added generated by mines and quarries, energy processing, water supply, water treatment, and waste management, shows a significant variance for the period 1995–2017, where in 2017, it increased and reached almost 25,000 million euros [32]. The main energy indicators that outline Greece’s energy profile are as follows [33]: (i) RES production was 1.29 Mtoe in 1995 and reached 2.64 Mtoe in 2015; (ii) RES net imports was 0 and 0.13 Mtoe in 1995 and 2015, respectively; (iii) RES gross inland consumption was 1.29 and 2.78 Mtoe in 1995 and 2015, respectively; (iv) RES power generation capacity increased from 2.53 in 1995 to 8.08 GW in 2015; (v) RES gross electricity generation reached 3.82 and 14.9T Wh in 1995 and 2015, respectively; and (vi) RES in gross final energy (RES with aviation cap) increased from 7% in 2005 to 15.4% in 2015.
Finally, the results of the Report on Health Profile of Greece on health situations and trends show that it is constantly improving, as 74% of the population declare themselves as healthy, exceeding the European average [34]. The life expectancy is 81.5 years, the healthy years are up to 65 and most deaths are due to heart diseases and cancer, and an important factor causing health problems is the exposure to certain atmospheric pollutants such as NO2 and O3 [34].

3. Methodological Framework

The SEA process encompasses the following stages: identifying PPP objectives (screening), setting goals (scoping), selecting indicators (baseline), predicting impacts (scenarios), and public consultation and monitoring [2,35]. The methodological approach deployed in this paper includes the following six stages: (i) the development of SEA objectives and indicators, (ii) the identification of alternatives, (iii) the selection of the ‘most viable or sustainable’ alternative, (iv) the identification of potential impacts, (v) impact assessment, and (vii) the proposed monitoring process. Figure 2 presents the methods, tools, and techniques used as well as the main outputs of each stage.

3.1. Development of SEA Objectives and Indicators

In order to integrate sustainable development principles into OWF siting planning, the objectives and indicators (OI) effectiveness criteria by [5,36], as well as the OI development guide proposed by [36] were adopted.
The development of an OI system is a rather difficult and complicated process in most cases. Therivel [5] and Donnelly et al. [36] argued that objectives and indicators should have the following characteristics: being understandable, referring to the corresponding scale of PPPs, requiring available data, avoiding overlapping, showing compatibility, focusing on results, being defined in technical terms, providing a quick update, and referring to corresponding conditions.
Donnelly et al. [36] proposed a systematic guide for developing objectives and indicators which is considered as a highly significant methodological step and as one of the rare handful attempts for SEA methodology formulation. The main objective of the guide is to develop a diagrammatic process based on a sequence of questions that finally recommends an effective and integrated system of objectives and indicators.
In this paper, the proposed system was developed considering twelve thematic sections (TS), including those that the SEA directive proposes (TS1), as well as sections introduced by the authors (TS2) to cover environmental, economic, and social parameters. The TS are biodiversity (TS1), population and health (TS1), soil (TS1), water (TS1), air quality (TS1), climate factors (TS1), material assets (TS1), cultural heritage (TS1), landscape (TS1), RES (TS2), economy (TS2), and society (TS2).

3.2. Identification of Alternatives

The existing legal framework for OWF siting in Greece (SFSPSD-RES) [25] suggests a siting approach using several national-level siting criteria that are adapted to the characteristics of the host regions. The present paper proposes the following alternatives considering both the SFSPSD-RES and the contemporary literature on OWF siting:
  • Alternative 1 or ‘Do nothing’ scenario: OWF siting considering the existing siting criteria. This scenario includes the criteria as well as the restrictions included in the existing SFSPSD-RES.
  • Alternative 2: OWF siting within low and/or moderate sensitivity areas considering several exclusion criteria. The proposed criteria consider numerous technical, environmental and economic restrictions as well as various social aspects.
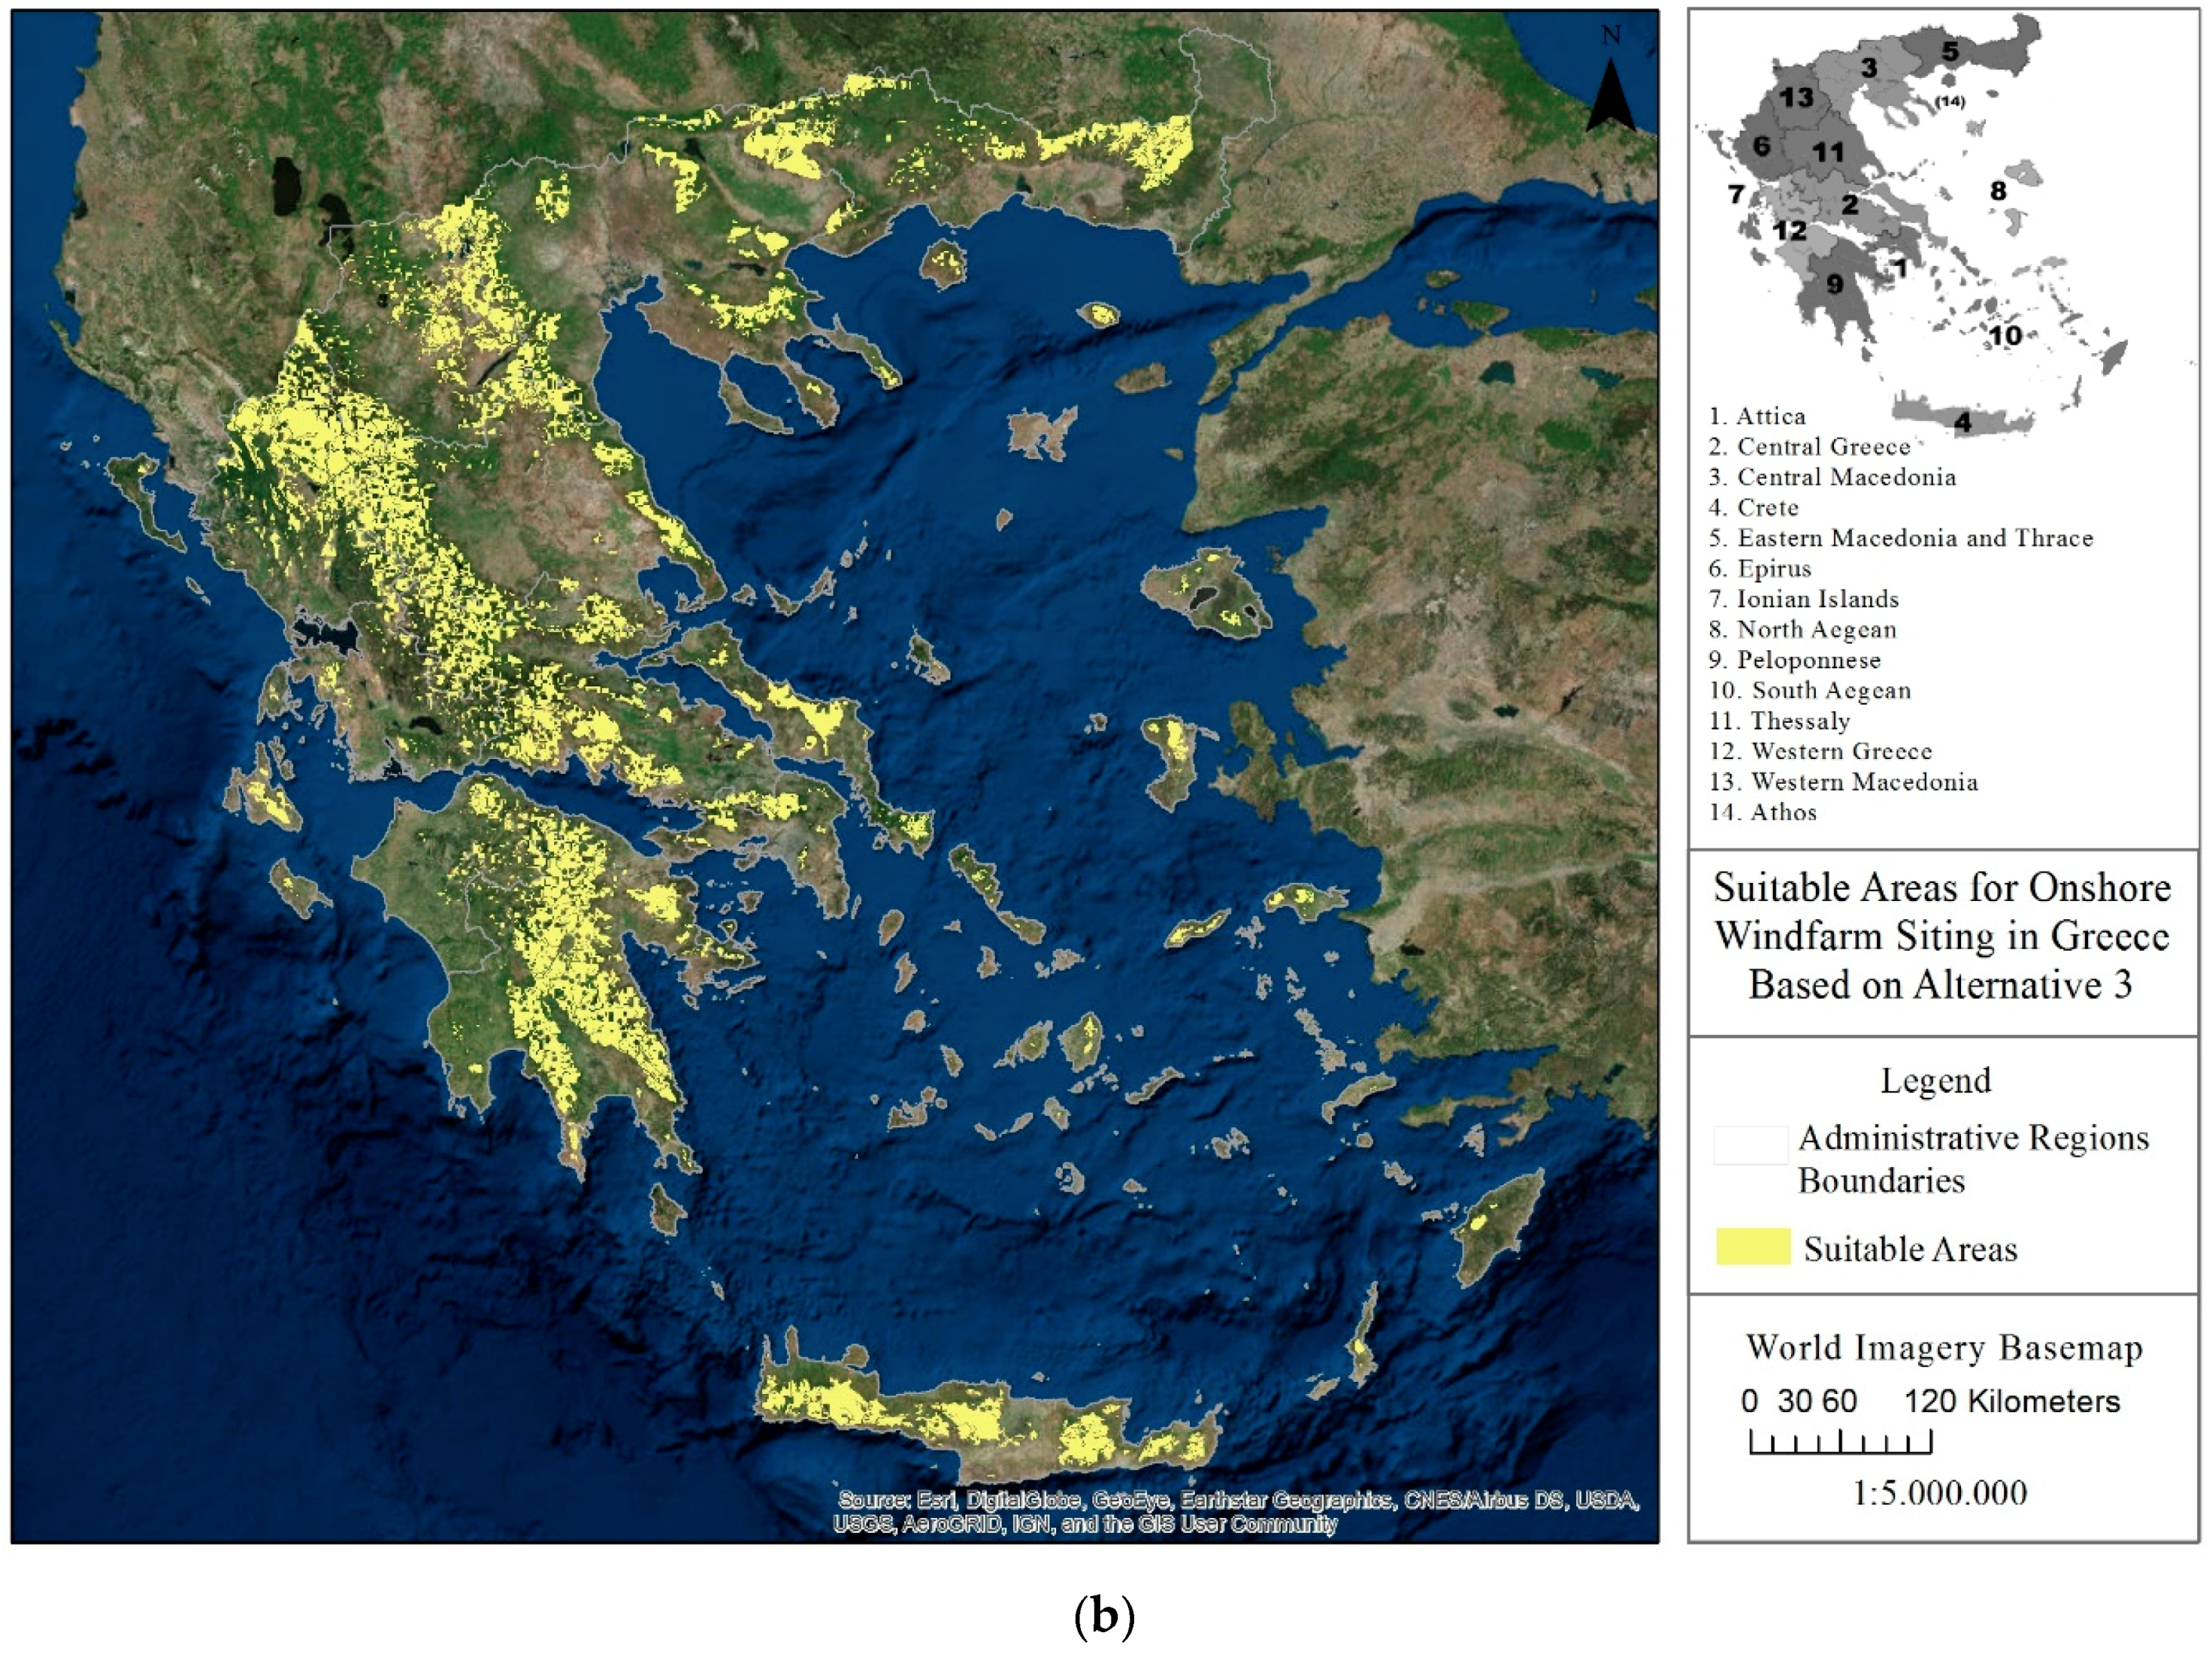
  • Alternative 3: OWF siting within or close to high sensitivity areas considering several exclusion criteria. This alternative maintains the criteria considered under alternative 2, apart from the criterion of ‘protected areas’.
Although numerous studies in the literature suggest criteria and their minimum allowed limits for OWF development at global level (e.g., [37,38,39,40,41,42,43,44,45,46]), in this paper, the literature review is restricted to Greek case studies found in the literature (e.g., [47,48,49,50]). Finally, a few criteria were suggested by the authors and not found either in the SFSPSD-RES or in the literature review (e.g., continuous and discontinuous urban web). The criteria, as well as their minimum limits applied for alternative 2, are presented in Table 1. The same criteria were also applied for alternative 3, apart from the criterion of ‘protected areas’, whose minimum allowed distance was set equal to 0 m.

3.3. Selection of the ‘Most Viable or Sustainable’ Alternative

One of the most common methods of the decision-making process is the use of criteria. Criteria provide the opportunity for comparability and assessment of different development scenarios in order to identify the one that best meets planning needs [5,55,56,57,58]. In addition, SEA is considered to be a strategic decision-making tool as its stages are developed in a similar way to those of strategic decision-making [5]. In this paper, various decision-making criteria (Table 2) were suggested to compare and assess the three proposed alternatives for OWF siting in Greece.

3.4. Identification of Potential Impacts

Extensive literature investigating the environmental, economic, and social impacts of OWF energy is available. The land use conflict, the shrinkage of areas with remarkable environmental elements, the loss of biodiversity, the aesthetics of OWF, and public opposition towards OWF projects (not in my back yard (NIMBY) Syndrome), the impacts on human health, and economic profit are only a few of the issues that incite intense controversy and discussions in the international community (e.g., [59,60,61,62,63]). It should be noted that although NIMBY syndrome as a social phenomenon appears mainly in cases of projects and activities such as landfilling, mining, etc., renewable energy sources with strong general support are also subject to local opposition (e.g., Town of the Blue Mountains, Ontario [64]). At this stage, an effort was made to identify impacts on TS1 and TS2, considering not only the impacts that come directly from wind turbines themselves, but also the impacts attributed to their associated facilities/projects such as roads, support structures, networks, stations, etc.

3.5. Impact Assessment

Impact assessment is one of the most crucial stages of SEA. In order to respond satisfactorily to the requirements of this stage, the present paper adopted both qualitative and quantitative assessment to evaluate any potential impact that might be caused by the planning of OWF siting.

3.5.1. Qualitative Impact Assessment

The qualitative impact assessment process was performed in two steps. More specifically, a set of criteria (direct/indirect, short/long-term, construction phase (CP)—operation and maintenance (O/MP)—withdrawal (WP) phase of appearance, cumulative or not) was developed to identify the key characteristics of the impacts at each TS. In the second step, several criteria, including type (positive/negative), extend (low/moderate/high), duration (CP-O/MP-WP), intensity (low/moderate/high), time of appearance (primary/secondary), and probability of appearance (low/moderate/high) were used to further qualitatively assess the individual impacts of the OWF siting.

3.5.2. Quantitative Impact Assessment

Once the impacts were identified, analyzed, and prioritized through the qualitative impact assessment process, a quantitative impact assessment followed in order to further identify the major—positive and negative—impacts under three possible OWF siting scenarios of different total output capacity scales. These scenarios were developed to incorporate different OWF siting characteristics. Thus, the first scenario (Scenario 1) concerned the case that OWF development is characterized by (i) small land occupation, (ii) small wind turbine size, and (iii) small distance between wind turbines. The second scenario (Scenario 2) is characterized by (i) medium land occupation, (ii) medium wind turbine, and (iii) medium distance between wind turbines. The third scenario (Scenario 3) is characterized by (i) extended land occupation, (ii) large wind turbine, and (iii) large distance between wind turbines. In this context, the rapid impact assessment matrix (RIAM) initiated by Pastakia and Jensen in 1998 [65] was applied as an assessment tool which allows subjective judgments to be quantitatively recorded.
The RIAM method is based on adaptive and categorized assessment criteria which are given an indicative value system to provide an accurate and independent score. The assessment criteria are categorized into two pre-defined groups. The first group (Group A) includes criteria that are of high importance and can individually affect the score obtained, and the second group (Group B) includes criteria that are of high importance but individually do not have a significant effect. In this paper, the criteria of the qualitative assessment that preceded were used, and the defined groups were formed as follows: Group A included type (A1), area (A2), duration (A3), and intensity (A4); while Group B included the time of appearance (B1), the probability of appearance (B2), and cumulative impacts generation (B3). Τhese criteria were further attributed to a scoring system based on their escalating intensity and significance displayed in the three OWF development scenarios (Table A1). Then the method determined the application of the following formulae (1,2,3) to allow weighted scores to be defined on the same basis.
(a1) * (a2) *…(an) = aT,
(b1) + (b2)…+(bn) = bT,
(aT) * (bT) = ES,
where,
  • (a1), (a2) … (an) are the individual criteria scores for Group A
  • (b1), (b2) … (bn) are the individual criteria scores for Group B
  • aT is the result of the multiplication of all Group A scores
  • bT is the result of the summation of all Group B scores
ES is the final assessment score that is the result of the multiplication of the scores of the Group A criteria with the sum of the scores of the Group B criteria.
Once formulas (Equations (1)–(3)) were applied, ES was recorded, and the impacts were demonstrated using scales. The proposed ES range and range bands are presented in Table A2, where positive and negative impacts range from 6 (extremely significant positive impact) highly significant to -6 (extremely significant negative impact).

3.6. Proposed Monitoring Process

Article 10 of the SEA Directive (ED 2001/42/EC) underlines that “the development and the implementation of a monitoring system is very crucial for identifying the likely adverse impacts and mitigate or even eliminate them”. The present paper aimed to develop an appropriate monitoring system including not only environmental components but also economic and social parameters. In addition, this system complies with the SEA objectives and indicators system proposed in the first stage in order to achieve compatibility in the exported results and raise its effectiveness.

4. Results and Discussion

4.1. SEA Objectives and Indicators

Analyzing and evaluating the current situation of the environment, as well as measuring the performance baseline of OWF deployment, can be a tedious and complex process which requires an integrated, systematic, and consistent approach. The Development Guide by Donnelly et al. [36] was initially applied and the indicators were further elaborated to adapt and conform to available and accessible data. The final system of the SEA objectives and indicators for OWF siting in Greece is summarized in Table 3. It should be noted that the proposed OI System integrates and highlights the major environmnental, economic, and social factors related to OWF siting issues.

4.2. Identification of OWF Siting Areas in Greece (Based on Alternatives)

Taking into account the criteria presented in Table 1, as well as their constraints, and processing their data with the use of multiple tools in a geographic information system (GIS) environment, the maps in Figure 3a,b were created. These maps are the main output of the above process proposing the appropriate areas for OWF siting in Greece based on alternatives 2 and 3 (Section 3.2). It should be noted that the basic differentation of alternatives 2 and 3 relates to protected areas criterion management, where in alternative 2, OWF siting within them was avoided, as opposed to alternative 3 (however with an additional environmental study submitted).
The appropriate areas for OWF siting in Figure 3a are quite limited compared to the areas presented in Figure 3b, due to more severe environmental restrictions. The largest part considered as appropriate for OWF siting is located mainly in Western Macedonia, in a part of Central Greece and Peloponnese. Several individual areas also appear in Eastern Macedonia and Thrace and Crete and less in Central Macedonia, Epirus, and Western Greece. The appropriate areas for OWF siting in Greece are numerous both in the mainland and islands, especially in cases where OWF sitting is suggested within or close to environmental protected areas (Figure 3b).

4.3. ‘Most Viable or Sustainable’ Alternative Selection

Based on the criteria (C1-C10) presented in Table 2, the three proposed alternatives were qualitatively assessed. Table A3 presents the interactions of alternatives with each criterion individually and estimates the effects using key symbols as follows:
  • (++) in case the alternative covers satisfactorily the criterion;
  • (+) in case the alternative covers the criterion;
  • (−) in case the alternative does not cover the criterion;
  • (?) in case there are doubts as to whether the alternative covers the criterion or not.
The qualitative assessment indicates that alternative 2 satisfies the criteria in most cases and more effectively (+++++++++++?+−+). More specifically, alternative 2 fully meets criteria C1, C2, C3, C5, and C6. It also adequately covers criteria C4, C8, and C10. However, there are doubts concerning the extent to which the second alternative is accepted by the local population without generating any conflict (C7) as the degree of acceptance depends on several factors such as the technology used, environmental education, etc. Finally, the selected alternative follows the directions of previous and existing policies and thus its innovation (C9) is considered low.

4.4. Identification of Impacts

The main impacts of OWF siting in the examined TS of natural and anthropogenic environment are briefly introduced in Figure 4.

4.5. Impact Assessment Results

4.5.1. Qualitative Impact Assessment

Table 4 and Table 5 are indicative illustrations of the qualitative impact assessment. More specifically, Table 4 presents the general structure of the first step of qualitative impact assessment (step 1), applied in one of the TS (biodiversity), while Table 5 presents the corresponding structure of the second step of qualitative impact assessment, applied in one of the impacts of biodiversity (loss, fragmentation, and/or degradation of habitants).

4.5.2. Quantitative Assessment

Following the technical process steps of RIAM method by categorizing the proposed assessment criteria in the defined categories, attributing a scoring system based on the intensity and significance of criteria for each OWF development siting scenario and applying the formula system as previously described in Section 3.5.2, Table A4 in the Appendix A was developed, displaying the results of ES as well as their matching with the appropriate Range Band (RB).
More specifically, an expert panel (the authors of the paper) evaluated the impacts of each of the three defined scenarios against the main impacts of OWF siting in the examined TS and determined a score for each impact, based on the assessment criteria, providing a measure of expected impact. The panel members were exposed and well informed about the current situation of the region (Greece), background information about aspects of SEA planning work, as well as theoretical framework and technical aspects of the RIAM process. It should be mentioned that their expertise covered a variety of fields such as environmental planning, land-use planning, water resources, renewable energy sources, impact assessment.
A score for each main impact of OWF siting in the examined TS for the three scenarios was determined by expert judgment. In performing this task, the experts relied on the criteria described in Section 3.5.2 (Group A: type (A1), area (A2), duration (A3), and intensity (A4); Group B: time of appearance (B1), probability of appearance (B2), and cumulative impacts generation (B3)). In this way, each impact received a score based on the A and B criteria. If the scores for the A1, A2, A3, A4, B1, B2, and B3 criteria differed, depending on the expertise of the panel, the mean of the scores was selected to represent the A and B criteria for a given impact.
For example, impacts concerning loss, fragmentation, and/or degradation of habitants under the first scenario are considered negative: −2 (type), low: 1 (area), occurring in all three phases of the project lifecycle: 3 (duration), low: 1 (intensity), secondary: 2 (time of appearance), moderate: 2 (probability of appearance) and positive-yes: 1 (cumulative impact generation). With this information available, the ES values were calculated using Equations (1)–(3). Under this scenario, the ES for this specific impact equals ((−2) * 1 * 3 * 1) * (2 + 2 + 1) = (−6) * (5) = −30.
According to the results obtained in Table A4, the most critical impacts that may be caused under the first OWF siting scenario are changes in physical phenomena and RES promotion with very significant negative and positive impacts, respectively. Considering scenario 2, extremely significant negative impacts were caused due to loss, fragmentation and/or degradation of habitats, collision risk, and cultural heritage quantity and quality degradation, whereas RES promotion, job growth, and market diversification caused extremely significant positive impacts. Finally, scenario 3 presents almost the same impacts are scenario 2, although it caused extremely significant negative impacts because of habitat disorder and displacement.

4.6. SEA Monitoring System

Monitoring could be facilitated and performed in a systematic and simple manner through the use of indicators. According to [5], the system of objectives and indicators developed at an initial stage (development of SEA objectives and indicators), should also be maintained at the monitoring stage.

5. Conclusions

Strategic environmental assessment has been widely recognized as an assessment tool, especially in recent years. This recognition stems from its own value and ability to support a strategic decision-making process towards sustainable development. More particularly, the ability to develop a sustainability strategy through objectives and indicators, identifying and selecting the most suitable alternative based on this strategy, as well as identifying and addressing the cumulative impacts of policies, plans and programs (PPPs) at early stages in planning, are key advantages over other assessment tools (e.g., health impact assessment (HIA), environmental impact assessment (EIA), risk assessment (RA)).
Although SEA has many advantages, there is an appreciable and crucial distance between its theoretical and methodological approaches. This distance is mainly caused by the lack of a formal, systematic, and comprehensive guideline, with methodological proposals and clarifications on several aspects and critical questions related to SEA implementation.
The present paper attempted to develop a methodological approach for the most technical stages of SEA, combining both qualitative and quantitative methods. More specifically, this paper developed a framework that included the following stages: (i) the development of SEA objectives and indicators, (ii) the identification of alternatives, (iii) the selection of the ‘most viable or sustainable’ alternative, (iv) the identification of potential impacts, (v) impact assessment, and (vii) a proposed monitoring process.
The system of objectives and indicators includes 19 objectives and 30 indicators considering literature review related to SEA effectiveness, national and European legislative frameworks, energy studies requirements, and personal judgment. The system of objectives and indicators addresses not only the thematic sections proposed by the SEA directive, but also other thematic sections, covering economic as well as social aspects of sustainable development, providing an integrated system of objectives and indicators. At the second stage, three alternatives were developed: (i) OWF siting considering the existing siting criteria, (ii) OWF siting within low and/or moderate sensitivity areas considering several exclusion criteria, and (iii) OWF siting within or close to high sensitivity areas considering several exclusion criteria. This stage presents, implements, and visualizes through thematic maps, realistic alternatives that fulfil certain environmental, economic, and social criteria and restrictions, minimizing potentially incompatible land-uses and consequently unsustainable development. At the third stage, the alternative that satisfies more efficiently the proposed assessment criteria (C1–C10) was selected through qualitative assessment (second alternative). The proposed set of assessment criteria can provide an integrated assessment of alternatives based on monitoring the extent of the achievement of national and SEA objectives, as well as their effectiveness. In the fourth stage, the identification of potential impacts concerns both natural and anthropogenic environment. The involvement of an anthropogenic environment in the SEA process distinguishes this work from similar efforts. In the next stage, the main potential impacts caused by the second OWF siting alternative were identified and then qualitatively and quantitively assessed. In terms of qualitative impact assessment, several criteria were used to evaluate the impacts at TS level as well as each individual impact separately, while in terms of quantitative impact assessment, a modified RIAM method was applied in order to further identify the most crucial impacts for three OWF sitting scenarios. The modified version of the RIAM method includes different assessment criteria and scaling. Finally, a system of objectives and indicators were developed to support the monitoring process, following the SEA objectives and indicators’ direction suggested at the first stage of the methodology.
The key findings of this study were (a) OWF siting within low and/or moderate sensitivity areas considering several technical, environmental, and economic restrictions, as well as various social aspects were considered as the most viable/sustainable alternative of OWF siting; (b) OWF siting caused moderate to extremely significant negative impacts on the thematic section of biodiversity and extremely significant positive impacts on the thematic sections of renewable energy sources, economy, and society; and (c) SEA monitoring should be achieved by the constant monitoring of a proposed system of indicators (impact monitoring indicators—IMI).
The attempt to develop a methodological approach for the technical stages of the SEA is a laborious, time-consuming process that might conclude to an undoubtedly effective proposal. A single and systematic SEA guideline that will include holistic methodological proposals is necessary, not only to facilitate but also to coordinate the whole process. Τhe proposed methodology for SEA of OWF siting planning in Greece adapts and combines several remarkable tools and techniques. The distinct stages that the relevant methodology includes can be applied in relation to various study areas and diverse planning scales, contributing effectively to sustainable development.

Author Contributions

Conceptualization, D.G.V. and X.K.; Methodology, D.G.V. and X.K.; Formal analysis, D.G.V. and X.K.; Investigation, X.K.; Data curation, X.K.; Writing—original draft preparation, D.G.V. and X.K.; Writing—review and editing, D.G.V.; Visualization, X.K.; Supervision, D.G.V.

Funding

This research received no external funding.

Conflicts of Interest

The authors declare no conflict of interest.

Appendix A

Table A1. Scoring system of impact assessment criteria.
Group A Criteria and Scoring DefinitionGroup B Criteria and Scoring Definition
Type (A1)−2 = negative
+2 = positive
Time of Appearance (B1)1 = primary
2 = secondary
Area (A2)1 = low
2 = moderate
3 = high
Probability of Appearance (B2)1 = low
2 = moderate
3 = high
Duration (A3)1 = only in one phase
2 = in two phases
3 = in all three phases of the project’s lifecycle
Cumulative impact generation (B3)1 = yes
0 = no
Intensity (A4)1 = low
2 = moderate
3 = high
Table A2. ES and range bands.
ESRange Bands (RB)
Above 109+6
72 to 1085
36 to 714
19 to 353
10 to 182
1 to 91
00
−9 to −1−1
−18 to −10 −2
−35 to −19−3
−71 to −36−4
−108 to −72−5
below −109−6
Table A3. Qualitative assessment of the proposed alternatives.
CriterionAlternatives
123
(C1)+++
(C2)++++++
(C3)++++++
(C4)++
(C5)+++
(C6)+++++
(C7)??
(C8)+++
(C9)+
(C10)++?
Table A4. Evaluation matrix (environmental scores and range bands).
Impacts/TSScenario 1Scenario 2Scenario 3
ESRBESRBESRB
Biodiversity
Loss, fragmentation, and/or degradation of habitants−30−3−120−6−324−6
Collision risk−30−3−120−6−324−6
Access and accessibility disruption−60−4−60−4−72−5
Species displacement−20−3−80−5−144−6
Population and Health
Disturbance by noise−24−3−30−3−30−3
Disturbance by shadow effect−8−1−10−2−10−2
Residents relocation−8−1−16−2−16−2
Soil
Geological features degradation−30−3−60−4−60−4
Soil sealing−20−2−20−2−20−2
Soil contamination−32−3−80−5−80−5
Changes in physical phenomena−72−5−96−5−96−5
Water
Quantity degradation−24−3−120−2−120−5
Quality degradation−18−2−96−5−96−5
Air Quality
Local air quality changes162323905
Climate Factors
GHGs emission reduction484484905
Climate change management484484905
Exposure to natural hazards−8−1−16−2−16−2
Material Assets
Wind energy participation in GDP increase3647251085
Cultural Heritage
Quantity degradation−30−3−120−6−270−6
Quality degradation−30−3−120−6−270−6
Landscape
Aesthetic nuisance152303454
RES
RES promotion108521663246
Economy
Job growth30312062706
Market diversification30312062706
Society
Social cohesion303604604

References

  1. Therivel, R.; Partidario, M.R. The Practice of Strategic Environmental Assessment; Earthscan: London, UK, 1996. [Google Scholar]
  2. Finnveden, G.; Nilsson, M.; Johansson, J.; Persson, A.; Moberg, A.; Carlsson, T. Strategic environmental assessment methodologies—Applications within the energy sector. Environ. Impact Assess. Rev. 2003, 23, 91–123. [Google Scholar] [CrossRef]
  3. Chaker, A.; El-Fadl, K.; Chamas, L.; Hatjian, B.A. A review of strategic environmental assessment in 12 selected countries. Env. Impact Assess. Rev. 2006, 26, 15–56. [Google Scholar] [CrossRef]
  4. Lemos, C.C.; Fischer, T.B.; Souza, M.P. Strategic environmental assessment in tourism planning—Extent of application and quality of documentation. Env. Impact Assess. Rev. 2012, 35, 1–10. [Google Scholar] [CrossRef]
  5. Therivel, R. Strategic Environmental Assessment in Action; Earthscan: London, UK, 2004. [Google Scholar]
  6. Wang, S.; Liu, J.; Ren, L.; Zhang, K.; Wang, R. The development and practices of strategic environmental assessment in Shandong province, China. Environ. Impact Assess. Rev. 2009, 29, 408–420. [Google Scholar] [CrossRef]
  7. Zhu, D.; Ru, J. Strategic environmental assessment in China: Motivations, politics, and effectiveness. J. Environ. Manag. 2008, 88, 615–626. [Google Scholar] [CrossRef] [PubMed]
  8. Ludovico, D.D.; Fabietti, V. Strategic Environmental Assessment, key issues of its effectiveness. The results of Speedy Project. Environ. Impact Assess. Rev. 2018, 68, 19–28. [Google Scholar] [CrossRef]
  9. Noble, B.F.; Gunn, J.; Martin, J. Survey of current methods and guidance for strategic environmental assessment. Impact Assess. Proj. A 2012, 30, 139–147. [Google Scholar] [CrossRef]
  10. Montis, A.D.; Ledda, A.; Caschili, S. Overcoming implementation barriers: A method for designing Strategic Environmental Assessment guidelines. Environ. Impact Assess. Rev. 2016, 61, 78–87. [Google Scholar] [CrossRef]
  11. Noble, B.F. Promise and dismay: The state of strategic environmental assessment systems and practices in Canada. Environ. Impact Assess. Rev. 2009, 29, 66–75. [Google Scholar] [CrossRef]
  12. Lobos, V.; Partidario, M. Theory versus practice in Strategic Environmental Assessment (SEA). Environ. Impact Assess. Rev. 2014, 48, 34–46. [Google Scholar] [CrossRef]
  13. Chanchitpricha, C.; Bond, A. Conceptualising the effectiveness of impact assessment processes. Environ. Impact Assess. Rev. 2013, 43, 66–72. [Google Scholar] [CrossRef]
  14. Van Doren, D.; Driessen, P.P.J.; Schijf, B.; Runhaar, H.A.C. Evaluating the substantive effectiveness of SEA: Towards a better understanding. Environ. Impact Assess. Rev. 2013, 38, 120–130. [Google Scholar] [CrossRef]
  15. Bina, O.; Jing, W.; Brown, L.; Partidario, W.R. An inquiry into the concept of SEA effectiveness: Towards criteria for Chinese practice. Environ. Impact Assess. Rev. 2011, 31, 572–581. [Google Scholar] [CrossRef]
  16. Theophilou, V.; Bond, A.; Cashmore, M. Application of the SEA Directive to EU structural funds: Perspectives on effectiveness. Environ. Impact Assess. Rev. 2010, 30, 136–144. [Google Scholar] [CrossRef]
  17. Li, T.; Wang, H.; Deng, B.; Ren, W.; Xu, H. Strategic environmental assessment performance factors and their interaction: An empirical study in China. Environ. Impact Assess. Rev. 2016, 59, 55–60. [Google Scholar] [CrossRef]
  18. Dalkmann, H.; Herrera, R.J.; Bongardt, D. Analytical strategic environmental assessment (ANSEA) developing a new approach to SEA. Environ. Impact Assess. Rev. 2004, 24, 385–402. [Google Scholar] [CrossRef]
  19. Fischer, T.B. Strategic environmental assessment in post-modern times. Environ. Impact Assess. Rev. 2003, 23, 155–170. [Google Scholar] [CrossRef]
  20. Garfì, M.; Ferrer-Martí, L.; Bonoli, A.; Tondelli, S. Multi-criteria analysis for improving strategic environmental assessment of water programmes. A case study in semi-arid region of Brazil. J. Environ. Manag. 2010, 92, 665–675. [Google Scholar] [CrossRef]
  21. Jay, S. Strategic environmental assessment for energy production. Energy Policy 2010, 38, 3489–3497. [Google Scholar] [CrossRef]
  22. Salhofer, S.; Wassermann, G.; Binner, E. Strategic environmental assessment as an approach to assess waste management systems. Experiences from an Austrian case study. Environ. Model. Softw. 2007, 22, 610–618. [Google Scholar] [CrossRef]
  23. European Commission. Directive 2001/42/EC of the European Parliament and of the Council of 27 June 2001 on the assessment of the effects of certain plans and programmes on the environment. Off. J. Eur. Community 2001, L197, 30–37. [Google Scholar]
  24. MEECC; MFE. Common Ministerial Decision of the Ministry of Environment, Energy and Climate Change; The Minister of Finance and Economics. In Strategic Environmental Impact Assessment of Plans and Programmes in Compliance with Directive 2001/42/EU. OGG 1225/B/05.09.2006; The Official Government Gazette: Athens, Greece, 2006. (In Greek) [Google Scholar]
  25. SFSPSD-RES. Special Framework for Spatial Planning and Sustainable Development for Renewable Energy Resources. OGG 2464B′/2008; The Official Government Gazette: Athens, Greece, 2008. (In Greek) [Google Scholar]
  26. Athanas, A.K.; McCormick, N. Clean energy that safeguards ecosystems and livelihoods: Integrated assessments to unleash full sustainable potential for renewable energy. Renew. Energy 2013, 49, 25–28. [Google Scholar] [CrossRef]
  27. Josimović, B.; Pucar, M. The strategic environmental impact assessment of electric windenergy plants: Case study ‘Bavanište’ (Serbia). Renew. Energy 2010, 35, 1509–1519. [Google Scholar] [CrossRef]
  28. Trading Economics (TE). Population in Greece 2018. Available online: https://tradingeconomics.com/greece/population (accessed on 13 March 2019).
  29. OECD. Land-Use Planning Systems in the OECD: Country Fact. Sheets; OECD Publishing: Paris, France, 2017. Available online: https://www.oecd.org/publications/land-use-planning-systems-in-the-oecd-9789264268579-en.htm (accessed on 10 January 2019).
  30. National Center of Environment and Sustainable Development (NCESD). Greece State of the Environment Report. 2018. Available online: http://ekpaa.ypeka.gr/index.php/soer-2018 (accessed on 14 January 2019).
  31. UNFCCC. Decision 1/CP.21: Adoption of the Paris Agreement. In Proceedings of the Paris Climate Change Conference, Paris, France, 30 November–11 December 2015. [Google Scholar]
  32. ELSTAT. Gross Value Added by Industry (A10) (Provisional Data) (2000–2016). Available online: https://www.statistics.gr/statistics/-/publication/SEL45/- (accessed on 10 January 2019). (In Greek).
  33. EC (European Commission). EU Energy in Figures—Statistical Pocketbook 2017. Available online: https://publications.europa.eu/en/publication-detail/-/publication/2e046bd0-b542-11e7-837e-01aa75ed71a1/language-en/format-PDF/source-79936148 (accessed on 10 January 2019).
  34. OECD (European Observatory on Health Systems and Policies). State of Health in the EU. Greece: Country Health Profile 2017; OECD Publishing: Paris, France; European Observatory on Health Systems and Policies: Brussels, Belgium, 2017. [Google Scholar] [CrossRef]
  35. Arce, R.; Gullón, N. The application of Strategic Environmental Assessment to sustainability assessment of infrastructure development. Environ. Impact Assess. Rev. 2000, 20, 393–402. [Google Scholar] [CrossRef]
  36. Donnelly, A.; Jones, M.; Mahony, T.O.; Byrne, G. Decision support framework for establishing objectives, targets and indicators for use in strategic environmental assessment. Impact Assess. Proj. A 2006, 24, 151–157. [Google Scholar] [CrossRef]
  37. Jangid, J.; Bera, A.K.; Joseph, M.; Singh, V.; Singh, T.P.; Pradhan, B.K.; Das, S. Potential zones identification for harvesting wind energy resources in desert region of India—A multi criteria evaluation approach using remote sensing and GIS. Renew. Sustain. Energy Rev. 2016, 65, 1–10. [Google Scholar] [CrossRef]
  38. Talinli, I.; Topuz, E.; Aydin, E.; Kabakci, S. A Holistic approach for wind farm site selection by using FAHP. In Wind Farm—Technical Regulations, Potential Estimation and Siting Assessment; Suvire, G.O., Ed.; InTech Open: London, UK, 2011; pp. 213–234. [Google Scholar] [CrossRef]
  39. Gigovic, L.; Pamucar, D.; Bozanic, D.; Ljubojevic, S. Application of the GIS-DANP-MABAC multi-criteria model for selecting the location of wind farms: A case study of Vojvodina, Serbia. Renew. Energy 2017, 103, 501–521. [Google Scholar] [CrossRef]
  40. Watson, J.J.W.; Hudson, M.D. Regional Scale wind farm and solar farm suitability assessment using GIS-assisted multi-criteria evaluation. Landsc. Urban Plan. 2015, 138, 20–31. [Google Scholar] [CrossRef]
  41. Hansen, H.S. GIS-based multi-criteria analysis of wind farm development. In Proceedings of the 10th Scandinavian Research Conference on Geographical Information Science (ScanGis), Stockholm, Sweden, 13–15 June 2005; pp. 13–15. [Google Scholar]
  42. Höfer, T.; Sunak, Y.; Siddique, H.; Madlener, R. Wind farm siting using a spatial Analytic Hierarchy Process approach: A case study of the Städteregion Aachen. Appl. Energy 2016, 163, 222–243. [Google Scholar] [CrossRef]
  43. Jager, T.; McKenna, R.; Fichtner, W. The feasible onshore wind energy potential in Baden-Württemberg: A bottom-up methodology considering socio-economic constraints. Renew. Energy 2016, 96, 662–675. [Google Scholar] [CrossRef]
  44. Haaren, R.V.; Fthenakis, V. GIS-based wind farm site selection using spatial multi-criteria analysis (SMCA): Evaluating the case for New York State. Renew. Sust. Energy Rev. 2015, 15, 3332–3340. [Google Scholar] [CrossRef]
  45. Baban, S.M.J.; Parry, T. Developing and applying a GIS-assisted approach to locating wind arms in the UK. Renew. Energy 2001, 24, 59–71. [Google Scholar] [CrossRef]
  46. Pamučar, D.; Gigović, L.; Bajić, Z.; Janošević, M. Location Selection for Wind Farms Using GIS Multi-Criteria Hybrid Model: An Approach Based on Fuzzy and Rough Numbers. Sustainability 2017, 9, 1315. [Google Scholar] [CrossRef]
  47. Voivontas, D.; Assimacopoulos, D.; Mourelatos, A.; Corominas, J. Evaluation of renewable energy potential using a GIS decision support system. Renew. Energy 1998, 13, 333–344. [Google Scholar] [CrossRef]
  48. Tegou, L.I.; Polatidis, H.; Haralambopoulos, D. Environmental management framework for wind farm siting: Methodology and case study. J. Environ. Manag. 2010, 91, 2134–2147. [Google Scholar] [CrossRef]
  49. Xydis, G. A techno-economic and spatial analysis for the optimal planning of wind energy in Kythira Island, Greece. Int. J. Prod. Econ. 2013, 146, 440–452. [Google Scholar] [CrossRef]
  50. Bili, A.; Vagiona, D. Use of multicriteria analysis and GIS for selecting sites for onshore wind farms: The case of Andros Island (Greece). Eur. J. Environ. Sci. 2018, 8, 5–13. [Google Scholar] [CrossRef]
  51. Latinopoulos, D.; Kechagia, K. A GIS-based multi-criteria evaluation for wind farm site selection. A regional scale application in Greece. Renew. Energy 2015, 78, 550–560. [Google Scholar] [CrossRef]
  52. Panagiotidou, M.; Xydis, G.; Koroneos, C. Environmental Siting Framework for Wind Farms: A Case Study in the Dodecanese Islands. Resources 2016, 5, 24. [Google Scholar] [CrossRef]
  53. Ministry of Environment, Energy and Climate Change (MEECC). Permissible Noise Levels. Provisions of Presidential Decree 1180/81. Official Government Gazette Paper 293/A/6.10.1981; Ministry of Environment, Energy and Climate Change: Athens, Greece, 1981. [Google Scholar]
  54. EC. Directive 2008/50/EC of the European Parliament and of the Council of 21May 2008 on Ambient Air Quality and Cleaner Air for Europe. Off. J. Eur. Union 2008, 152, 1–56. [Google Scholar]
  55. Desmond, M. Decision criteria for the identification of alternatives in strategic environmental assessment. Impact Assess. Proj. A 2007, 25, 259–269. [Google Scholar] [CrossRef]
  56. Korhonen, P.; Moskowitz, H.; Wallenius, J. Multiple criteria decision support—A review. Eur. J. Oper. Res. 1992, 63, 361–375. [Google Scholar] [CrossRef]
  57. Benson, J. What is the alternative? Impact Assessment Tools and Sustainable Planning. Impact Assess. Proj. A 2003, 21, 261–280. [Google Scholar] [CrossRef]
  58. Torrieri, F.; Batà, A. Spatial Multi-Criteria Decision Support System and Strategic Environmental Assessment: A Case Study. Buildings 2017, 7, 96. [Google Scholar] [CrossRef]
  59. José, F.H.-A.; Probst, O.; Réthoré, P.-E.; Larsen, G.C. A Review of Methodological Approaches for the Design and Optimization of Wind Farms. Energies 2014, 7, 6930–7016. [Google Scholar] [CrossRef]
  60. Tabassum, A.; Premalatha, M.; Abassi, T.; Abassi, S.A. Wind energy: Increasing deployment, rising environmental concerns. Renew. Sust. Energy Rev. 2014, 31, 270–288. [Google Scholar] [CrossRef]
  61. Bond, S. Community Perceptions of Wind Farm Development and the Property Value Impacts of Siting Decisions. Pac. Rim Prop. Res. J. 2010, 16, 52–69. [Google Scholar] [CrossRef]
  62. Theresa, M.; Groth, C.A. Rural wind farm development: Social, environmental and economic features important to local residents. Renew. Energy 2014, 63, 1–8. [Google Scholar] [CrossRef]
  63. Ottinger, G.; Hargrave, T.J.; Hopson, E. Procedural justice in wind facility siting: Recommendations for state-led siting processes. Energy Policy 2014, 65, 662–669. [Google Scholar] [CrossRef]
  64. Jenden, J.; Lloyd, E.; Donev, J. Energy Education—Not in My Back Yard Syndrome. 2018. Available online: https://energyeducation.ca/encyclopedia/Not_in_my_back_yard_syndrome#cite_note-13 (accessed on 18 July 2019).
  65. Pastakia, C.M.R.; Jensen, A. The Rapid Impact Assessment Matrix (RIAM) for EIA. Environ. Impact Assess. Rev. 1998, 18, 461–482. [Google Scholar] [CrossRef]
Figure 1. (a) Environmental protection frameworks in Greece. (b) Cultural heritage protection frameworks in Greece.
Environments 06 00094 g001aEnvironments 06 00094 g001b
Figure 2. Methodological framework.
Environments 06 00094 g002
Figure 3. (a) Appropriate areas for OWF siting in Greece considering alternative 2. (b) Appropriate areas for OWF siting in Greece considering alternative 3.
Environments 06 00094 g003aEnvironments 06 00094 g003b
Figure 4. The main impacts of OWF siting.
Environments 06 00094 g004
Table 1. Criteria and minimum limits of alternative 2.
CriteriaMinimum Allowed LimitSource
TechnicalWind Speed4 m/s[48]
Slope>25%[51]
Altitude500 mProposed
Road Network150 m[51]
High Voltage Electricity Network50 m[52]
EnvironmentalProtected Areas1000 m[50,51]
Lakes150 m[52]
Rivers150 m[52]
Swimming Areas1500 m[50,52]
Coastline500 m[52]
SocialNoise Level38 Db(a)[53]
PollutantsLimit values of PM10; O3; NO2; SO2; CO[54]
Archaeological and Historic Sites1000 m[50,51]
World Heritage3000 m[50,52]
Monasteries500 m[48,50,52]
Continuous and Discontinuous Urban Web1000 mProposed
Traditional Settlements1500 m[48,49,50,51,52]
Airports3000 m[51]
Industrial and Commercial Centers500 mProposed
Harbors500 m[52]
Mines500 m[49,52]
Tourist Facilities1000 m[49,50,51]
Table 2. Alternative assessment criteria.
CriteriaExplanation
SEA objectives achievement (C1)The extent to which the proposed alternative considers and satisfies SEA objectives
Scale (C2)The geographical area that the proposed alternative covers
Implementation time (C3)The required time for carrying out, execution, or practicing of the proposed alternative
Licensing time (C4)The required time for the authorization of the proposed alternative
Sustainability (C5)The extent to which the proposed alternative incorporates the principles of sustainable development
Cohesion (C6)The extent to which the proposed alternative results from the description of the baseline conditions and SEA objectives
Tolerance (C7)The extent to which the proposed alternative is accepted
Implementation (C8)The extent to which the proposed alternative can be implemented based on available resources
Innovation (C9)The extent to which the proposed alternative differs from the existing OWF siting directions
Efficiency (C10)The extent to which the proposed alternative minimizes or avoids any potential impact
Table 3. SEA objectives and indicators.
TSSEA Objectives SEA Indicators
Biodiversity1. Protect and restore ecosystems—regulate the loss, fragmentation, or/and degradation of biodiversity1. Habitat losses due to OWF siting (number, %)
2. Number of species may be affected by OWF siting (number)
3. Number of species that change their behavior due to OWF siting (number)
4. Change in the number of migratory birds before and after the OWF siting (%)
5. Change in the percentage of protected areas (%)
Population and Health2. Avoid disturbance, discomfort, and/or adverse impacts for health improvement
3. Maintain or/and increase the local population
6. Number of people might be affected by OWF siting (number)
7. Frequency of disturbances and/or other adverse impacts on health during construction, operation, maintenance, and withdrawal phase of OWF projects
8. Number of people that have moved out an area due to OWF siting (number)
Soil4. Protection of significant geological features
5. Reduce land occupation to ensure soil quality and quantity
6. Reuse of brownfields against greenfields
9. Change in land cover (%)
10. Reuse of abandoned areas/brownfields (%)
11. Change in qualitative or/and quantitative status of soil systems (number and surface (ha))
Water7. Ensure the quality and quantity of water bodies
8. Improve water use efficiency
12. Percentage of water bodies in good/medium/poor ecological status (%)
13. Percentage of water bodies in good/medium/poor chemical status (%)
14. Percentage of reused water during the construction, operation/maintenance, and withdrawal phase (%)
15. Number of water bodies that their quantity and/or quality status has been changed (number)
Air Quality9. Decrease the level of air pollution16. SO2, NOx emissions (Gg)
17. Number of exceedances of various pollutants (NOx, SOx, CO, PM2.5, PM10, NH3, NMVOC limit values (number))
Climatic Factors10. Achieve the emission control targets and develop climate change resilience
11. Use RES technologies to address climate change
18. CO2 emission per capita (tn/person)
19. CO2 emissions from electricity and heating (CO2/kWh)
20. Level of population exposure to natural hazards
21. GHG emissions/capita (t CO2 eq. per capita)
Material Assets12. Increase wind energy participation in GDP22. Percentage of wind energy participation (value of electricity generated) in GDP (%)
Cultural Heritage13. Preserve and protect the cultural heritage 23. Cases of loss, fragmentation, and/or degradation of cultural heritage elements (number)
Landscape14. Preserve and protect landscape quality24. Cases of loss, fragmentation, and/or degradation of landscape (number)
RES15. Promote wind energy and RES
16. Decrease energy net imports
25. Produced, imported, and final wind power consumption (MW)
26. Share of energy from renewable sources (in % of gross final energy consumption)
Economy17. Increase the employment
18. Strengthen the economy
27. Number of employees in the energy sector at local and national level (number)
28. Employment rate (%)
29. Energy investments (euro)
Society19. Improve quality of life30. RES access rate (%)
Table 4. First step of the qualitative impact assessment.
TSBiodiversity-Loss, Fragmentation, and/or Degradation of Habitants
Direct/IndirectDirect
Short/Long-termShort-term
Phase of appearanceCP-O/MP-WP
Cumulative impactHigh odds due to large OWF development or a set of smaller OWF, combined with existing pressures
Table 5. Second step of the qualitative impact assessment.
TS/ImpactBiodiversity/Loss, Fragmentation and/or Degradation of Habitants
Type of impactNegative
ExtentLow-to-high
DurationCP-O/MP-WP
IntensityLow-to-high
Time of appearancePrimary
Probability of appearanceModerate-to-high

