How Much Is Too Much? The Impact of Update Frequency on Crowdfunding Success

Abstract
1. Introduction
2. Theory and Hypothesis Development
3. Sample and Model Specification
4. Data Analysis and Findings
4.1. Descriptive Statistics
4.2. Regression Estimation Results
4.3. Robustness Check
5. Discussion
5.1. Theoretical
5.2. Practical Implications
5.3. Limitations and Future Research
6. Conclusions
Funding
Institutional Review Board Statement
Informed Consent Statement
Data Availability Statement
Conflicts of Interest
| 1 | www.headstart.co.il (accessed on 27 November 2024). |
References
- Ahlers, Gerrit. K.C., Douglas Cumming, Christina Günther, and Denis Schweizer. 2015. Signaling in equity crowdfunding. Entrepreneurship Theory and Practice 39: 955–80. [Google Scholar] [CrossRef]
- Baron, Robert A. 1998. Cognitive mechanisms in entrepreneurship: Why and when enterpreneurs think differently than other people. Journal of Business Venturing 13: 275–94. [Google Scholar] [CrossRef]
- Beier, Michael, and Kerstin Wagner. 2015. Crowdfunding Success: A Perspective from Social Media and E-Commerce. Paper presented at ICIS 2015, Fort Worth, TX, USA, December 13–16. [Google Scholar]
- Bukhari, Farasat Ali Shah, Sardar Muhammad Usman, Muhammad Usman, and Khalid Hussain. 2020. The effects of creator credibility and backer endorsement in donation crowdfunding campaigns success. Baltic Journal of Management 15: 215–35. [Google Scholar] [CrossRef]
- Butticè, Vincenzo, Massimo G. Colombo, and Mike Wright. 2017. Serial crowdfunding, social capital, and project success. Entrepreneurship Theory and Practice 41: 183–207. [Google Scholar] [CrossRef]
- Cappa, Francesco, Michele Pinelli, Riccardo Maiolini, and Maria Isabella Leone. 2021. “Pledge” me your ears! The role of narratives and narrator experience in explaining crowdfunding success. Small Business Economics 57: 953–73. [Google Scholar] [CrossRef]
- Chan, C.S. Richard, Haemin Dennis Park, Julie Y. Huang, and Annaleena Parhankangas. 2020. Less is more? Evidence for a curvilinear relationship between readability and screening evaluations across pitch competition and crowdfunding contexts. Journal of Business Venturing Insights 14: e00176. [Google Scholar] [CrossRef]
- Cordova, Alessandro, Johanna Dolci, and Gianfranco Gianfrate. 2015. The determinants of crowdfunding success: Evidence from technology projects. Procedia-Social and Behavioral Sciences 181: 115–24. [Google Scholar] [CrossRef]
- Cornelius, Philipp B., and Bilal Gokpinar. 2020. The role of customer investor involvement in crowdfunding success. Management Science 66: 452–72. [Google Scholar] [CrossRef]
- Courtney, Christopher, Supradeep Dutta, and Yong Li. 2017. Resolving information asymmetry: Signaling, endorsement, and crowdfunding success. Entrepreneurship Theory and Practice 41: 265–90. [Google Scholar] [CrossRef]
- De Larrea, Gabriela Lelo, Mehmet Altin, and Dipendra Singh. 2019. Determinants of success of restaurant crowdfunding. International Journal of Hospitality Management 78: 150–58. [Google Scholar] [CrossRef]
- Deng, Lingfei, Qiang Ye, DaPeng Xu, Wenjun Sun, and Guangxin Jiang. 2022. A literature review and integrated framework for the determinants of crowdfunding success. Financial Innovation 8: 41. [Google Scholar] [CrossRef]
- Edmunds, Angela, and Anne Morris. 2000. The problem of information overload in business organisations: A review of the literature. International Journal of Information Management 20: 17–28. [Google Scholar] [CrossRef]
- Elitzur, Ramy, and Eliran Solodoha. 2021. Does gender matter? Evidence from crowdfunding. Journal of Business Venturing Insights 16: e00268. [Google Scholar] [CrossRef]
- Eppler, Martin J., and Jeanne Mengis. 2008. The Concept of Information Overload-A Review of Literature from Organization Science, Accounting, Marketing, MIS, and Related Disciplines (2004) The Information Society: An International Journal 20 (5), 2004. pp. 1–20. In Kommunikationsmanagement im Wandel: Beiträge aus 10 Jahren= mcminstitut. Wiesbaden: Gabler Verlag, pp. 271–305. [Google Scholar]
- Evers, Mart, Carlos Lourenço, and Paul Beije. 2012. Main Drivers of Crowdfunding Success: A Conceptual Framework and Empirical Analysis. Rotterdam: Erasmus Universiteit. [Google Scholar]
- Fisher, Greg, Donald F. Kuratko, James M. Bloodgood, and Jeffrey S. Hornsby. 2017. Legitimate to whom? The challenge of audience diversity and new venture legitimacy. Journal of Business Venturing 32: 52–71. [Google Scholar] [CrossRef]
- Greene, William H. 2000. Econometric Analysis, 4th ed. International edition. Saddle River: Prentice Hall, pp. 201–15. [Google Scholar]
- Hobbs, Jake, Georgiana Grigore, and Mike Molesworth. 2016. Success in the management of crowdfunding projects in the creative industries. Internet Research 26: 146–66. [Google Scholar] [CrossRef]
- Hornuf, Lars, and Armin Schwienbacher. 2018. Market mechanisms and funding dynamics in equity crowdfunding. Journal of Corporate Finance 50: 556–74. [Google Scholar] [CrossRef]
- Hsieh, Hui-Ching, Ying-Che Hsieh, and Thi Huyen Chi Vu. 2019. How social movements influence crowdfunding success. Pacific-Basin Finance Journal 53: 308–20. [Google Scholar] [CrossRef]
- Jackson, Thomas W., and Pourya Farzaneh. 2012. Theory-based model of factors affecting information overload. International Journal of Information Management 32: 523–32. [Google Scholar] [CrossRef]
- Jin, Yong, Chao Ding, Yang Duan, and Hsing Kenneth Cheng. 2020. Click to success? Temporal Effects of Facebook Like on Crowdfunding. Journal of the Association for Information Systems 21: 6. [Google Scholar] [CrossRef]
- Joenssen, Dieter, Anne Michaelis, and Thomas Müllerleile. 2014. A Link to New Product Preannouncement: Success Factors in Crowdfunding. Available online: https://ssrn.com/abstract=2476841 (accessed on 27 November 2024).
- Kleinert, Simon, Christine Volkmann, and Marc Grünhagen. 2020. Third-party signals in equity crowdfunding: The role of prior financing. Small Business Economics 54: 341–65. [Google Scholar] [CrossRef]
- Koch, Jascha-Alexander. 2016. The Phenomenon of Project Overfunding on Online Crowdfunding Platforms—Analyzing the Drivers of Overfunding. Available online: https://aisel.aisnet.org/ecis2016_rp/85 (accessed on 27 November 2024).
- Koch, Jascha-Alexander, and Michael Siering. 2015. Crowdfunding Success Factors: The Characteristics of Successfully Funded Projects on Crowdfunding Platforms. Available online: https://papers.ssrn.com/sol3/papers.cfm?abstract_id=2808424 (accessed on 27 November 2024).
- Koh, Yoon, Minwoo Lee, Jaewook Kim, and Yun Yang. 2020. Successful restaurant crowdfunding: The role of linguistic style. International Journal of Contemporary Hospitality Management 32: 3051–66. [Google Scholar] [CrossRef]
- Kromidha, Endrit, and Paul Robson. 2016. Social identity and signalling success factors in online crowdfunding. Entrepreneurship & Regional Development 28: 605–29. [Google Scholar]
- Kuppuswamy, Venkat, and Barry L. Bayus. 2017. Does my contribution to your crowdfunding project matter? Journal of Business Venturing 32: 72–89. [Google Scholar] [CrossRef]
- Lagazio, Corrado, and Francesca Querci. 2018. Exploring the multi-sided nature of crowdfunding campaign success. Journal of Business Research 90: 318–24. [Google Scholar] [CrossRef]
- Lind, Jo Thori, and Halvor Mehlum. 2010. With or without U? The appropriate test for a U-shaped relationship. Oxford Bulletin of Economics and Statistics 72: 109–18. [Google Scholar] [CrossRef]
- Mollick, Ethan. 2014. The dynamics of crowdfunding: An exploratory study. Journal of Business Venturing 29: 1–16. [Google Scholar] [CrossRef]
- Moradi, Masoud, and Vishag Badrinarayanan. 2021. The effects of brand prominence and narrative features on crowdfunding success for entrepreneurial aftermarket enterprises. Journal of Business Research 124: 286–98. [Google Scholar] [CrossRef]
- Moutinho, Nuno, and Pedro M. Leite. 2013. Critical success factors in crowdfunding: The case of Kickstarter. Cad. do Merc. De. Valores Mobilia´ rios 45: 8–32. [Google Scholar]
- Müllerleile, Thomas, and Dieter William Joenssen. 2015. Key success-determinants of crowdfunded projects: An exploratory analysis. In Data Science, Learning by Latent Structures, and Knowledge Discovery. Berlin and Heidelberg: Springer, pp. 271–81. [Google Scholar]
- Shafi, Kourosh, Ali Mohammadi, and Sofia A. Johan. 2020. Investment ties gone awry. Academy of Management Journal 63: 295–327. [Google Scholar] [CrossRef]
- Shepherd, Dean A., Jeffery S. Mcmullen, and William Ocasio. 2017. Is that an opportunity? An attention model of top managers’ opportunity beliefs for strategic action. Strategic Management Journal 38: 626–44. [Google Scholar] [CrossRef]
- Shneor, Rotem, and Amy Ann Vik. 2020. Crowdfunding success: A systematic literature review 2010–2017. Baltic Journal of Management 15: 149–82. [Google Scholar] [CrossRef]
- Solodoha, Eliran, and Reut Blaywais. 2023. Do updates matter? A comparison between rewards-based and donation-based crowdfunding platforms. Journal of General Management, 03063070231205634. [Google Scholar] [CrossRef]
- Spence, A. Michael. 1973. Time and communication in economic and social interaction. The Quarterly Journal of Economics 87: 651–60. [Google Scholar] [CrossRef]
- Spence, Michael. 2002. Signaling in retrospect and the informational structure of markets. American Economic Review 92: 434–59. [Google Scholar] [CrossRef]
- Sun, Man, and Tianyu Wang. 2019. Research on psychological reading fatigue of intermediate and advanced chinese learners. Paper presented at 2019 9th International Conference on Education and Management (ICEM 2019), Penang, Malaysia, July 30–31; pp. 491–96. [Google Scholar]
- Tafesse, Wondwesen. 2021. Communicating crowdfunding campaigns: How message strategy, vivid media use and product type influence campaign success. Journal of Business Research 127: 252–63. [Google Scholar] [CrossRef]
- Thapa, Nischal. 2020. Being cognizant of the amount of information: Curvilinear relationship between total-information and funding-success of crowdfunding campaigns. Journal of Business Venturing Insights 14: e00195. [Google Scholar] [CrossRef]
- Thies, Ferdinand, Michael Wessel, Jan Rudolph, and Alexander Benlian. 2016. Personality Matters: How Signaling Personality Traits can Influence the Adoption and diffusion of Crowdfunding Campaigns. Paper presented at Twenty-Fourth European Conference on Information Systems (ECIS), İstanbul, Turkey, June 12–15. [Google Scholar]
- Ullah, Saif, and Yulin Zhou. 2020. Gender, anonymity and team: What determines crowdfunding success on Kickstarter. Journal of Risk and Financial Management 13: 80. [Google Scholar] [CrossRef]
- Usman, Sardar Muhammad, Farasat Ali Shah Bukhari, Huiwei You, Daniel Badulescu, and Darie Gavrilut. 2020. The effect and impact of signals on investing decisions in reward-based crowdfunding: A comparative study of China and the United Kingdom. Journal of Risk and Financial Management 13: 325. [Google Scholar] [CrossRef]
- Wang, Nianxin, Qingxiang Li, Huigang Liang, Taofeng Ye, and Shilun Ge. 2018. Understanding the importance of interaction between creators and backers in crowdfunding success. Electronic Commerce Research and Applications 27: 106–17. [Google Scholar] [CrossRef]
- Wang, Wei, Ling He, Yenchun Jim Wu, and Mark Goh. 2021. Signaling persuasion in crowdfunding entrepreneurial narratives: The subjectivity vs objectivity debate. Computers in Human Behavior 114: 106576. [Google Scholar] [CrossRef]
- Wang, Wei, Wei Chen, Kevin Zhu, and Hongwei Wang. 2020. Emphasizing the entrepreneur or the idea? The impact of text content emphasis on investment decisions in crowdfunding. Decision Support Systems 136: 113341. [Google Scholar] [CrossRef]
- Wells, John D., Joseph S. Valacich, and Traci J. Hess. 2011. What signal are you sending? How website quality influences perceptions of product quality and purchase intentions. MIS Quarterly 35: 373–96. [Google Scholar] [CrossRef]
- Wessel, Michael, Ferdinand Thies, and Alexander Benlian. 2016. The emergence and effects of fake social information: Evidence from crowdfunding. Decision Support Systems 90: 75–85. [Google Scholar] [CrossRef]
- Wooldridge, Jeffrey M. 2010. Econometric Analysis of Cross Section and Panel Data. Cambridge, MA: MIT Press. [Google Scholar]
- Yang, Jinbi, Libo Liu, and Chunxiao Yin. 2019. A non-liner decision model for green crowdfunding project success: Evidence from China. International Journal of Environmental Research and Public Health 16: 187. [Google Scholar] [CrossRef]
- Zhao, Liang, and Tsvi Vinig. 2020. Guanxi, trust and reward-based crowdfunding success: A Chinese case. Chinese Management Studies 14: 455–72. [Google Scholar] [CrossRef]


| M | SD | 1 | 2 | 3 | 4 | 5 | 6 | 7 | 8 | 9 | |
|---|---|---|---|---|---|---|---|---|---|---|---|
| 1. Supported amount percentage | 1.050 | 0.493 | 1 | ||||||||
| 2. Ln (funds raised) | 10.628 | 0.887 | 0.322 ** | 1 | |||||||
| 3. Number of updates | 6.683 | 5.17 | 0.205 ** | 0.228 ** | 1 | ||||||
| 4. Number of words per update | 26.189 | 22.981 | 0.137 ** | 0.094 ** | −0.294 ** | 1 | |||||
| 5. Men entrepreneurs | 0.703 | 0.847 | −0.004 | 0.054 * | −0.031 | 0.029 | 1 | ||||
| 6. Women entrepreneurs | 0.815 | 0.570 | −0.011 | −0.100 ** | −0.014 | −0.001 | −0.357 ** | 1 | |||
| 7. Prior entrepreneurship experience | 0.213 | 0.410 | −0.122 ** | −0.241 ** | −0.042 * | −0.095 ** | 0.307 ** | 0.012 | 1 | ||
| 8. Video | 0.740 | 0.438 | 0.069 ** | 0.101 ** | 0.128 | −0.009 | −0.046 * | 0.018 | −0.056 * | 1 | |
| 9. Number of gift options | 16.333 | 13.014 | 0.014 | 0.278 ** | 0.200 ** | 0.082 ** | 0.009 | 0.029 | −0.071 ** | 0.162 ** | 1 |
| Dependent Variable: Supported Amount Percentage | Model 1 | Model 2 | Model 2 | |||||||
|---|---|---|---|---|---|---|---|---|---|---|
| B | SE | p | B | SE | p | B | SE | p | ||
| Number of updates | 0.017 | 0.004 | 0.000 | 0.007 | 0.001 | 0.000 | 0.017 | 0.004 | 0.000 | |
| Number of updates2 | −4.75 × 10⁻⁴ | −1.68 × 10⁻⁴ | 0.005 | −4.38 × 10⁻⁴ | 1.69 × 10⁻⁴ | 0.010 | ||||
| Number of words per update | 0.001 | 0.001 | 0.008 | 0.002 | 0.001 | 0.001 | 0.002 | 7.93 × 10⁻⁴ | 0.003 | |
| Number of words per update2 | −1.33 × 10⁻⁵ | −5.95 × 10⁻⁶ | 0.025 | −1.16 × 10⁻⁵ | 5.98 × 10⁻⁶ | 0.050 | ||||
| Mmen entrepreneurs | 0.013 | 0.010 | 0.215 | 0.012 | 0.010 | 0.254 | 0.012 | 0.010 | 0.251 | |
| Women entrepreneurs | −0.024 | 0.015 | 0.113 | −0.024 | 0.015 | 0.107 | −0.025 | 0.015 | 0.103 | |
| Prior entrepreneurship experience | 0.004 | 0.022 | 0.841 | −0.004 | 0.022 | 0.848 | −0.002 | 0.022 | 0.899 | |
| Video | −0.001 | 0.020 | 0.973 | 0.002 | 0.020 | 0.914 | 0.002 | 0.020 | 0.990 | |
| Number of gift options | 0.001 | 0.001 | 0.895 | 0.001 | 0.001 | 0.765 | 0.001 | 0.001 | 0.982 | |
| Geographic location | Abroad | |||||||||
| North | 0.039 | 0.053 | 0.455 | 0.047 | 0.053 | 0.370 | 0.040 | 0.053 | 0.450 | |
| South | 0.021 | 0.058 | 0.708 | 0.032 | 0.058 | 0.580 | 0.025 | 0.058 | 0.64 | |
| Center dummy | 0.047 | 0.050 | 0.344 | 0.053 | 0.050 | 0.290 | 0.046 | 0.050 | 0.352 | |
| Jerusalem and surrounding | 0.027 | 0.052 | 0.591 | 0.034 | 0.052 | 0.506 | 0.027 | 0.052 | 0.591 | |
| Categories (fixed effect) | ||||||||||
| Founding year (fixed effect) | ||||||||||
| Constant | 0.894 | 0.332 | 0.007 | 0.279 | 0.333 | 0.008 | 0.863 | 0.332 | 0.010 | |
| n | 2582 | 2582 | 2582 | |||||||
| R2 | 0.129 | 0.128 | 0.129 | |||||||
| Dependent Variable: Ln (Funds Raised) | Model 4 | Model 5 | Model 6 | |||||||
|---|---|---|---|---|---|---|---|---|---|---|
| B | SE | p | B | SE | p | B | SE | p | ||
| Number of updates | 0.043 | 0.005 | 0.000 | 0.021 | 0.002 | 0.000 | 0.042 | 0.004 | 0.000 | |
| Number of updates2 | −0.001 | 0.001 | 0.000 | −0.001 | 0.001 | 0.000 | ||||
| Number of words per update | 0.003 | 0.001 | 0.000 | 0.007 | 0.001 | 0.000 | 0.007 | 0.001 | 0.000 | |
| Number of words per update2 | −3.59 × 10⁻⁴ | −3.59 × 10⁻⁴ | 0.000 | −3.21 × 10⁻⁵ | 7.39 × 10⁻⁶ | 0.000 | ||||
| Target amount | −0.001 | 0.001 | 0.000 | −0.001 | 0.001 | 0.000 | −0.001 | 0.001 | 0.000 | |
| Men entrepreneurs | 0.012 | 0.013 | 0.344 | 0.009 | 0.013 | 0.470 | 0.009 | 0.013 | 0.455 | |
| Women entrepreneurs | −0.025 | 0.019 | 0.192 | −0.026 | 0.019 | 0.171 | −0.026 | 0.019 | 0.160 | |
| Prior entrepreneurship experience | 0.092 | 0.027 | 0.000 | −0.291 | 0.027 | 0.000 | −0.288 | 0.027 | 0.000 | |
| Video | 0.080 | 0.025 | 0.002 | 0.087 | 0.025 | 0.001 | 0.083 | 0.025 | 0.001 | |
| Number of gift options | 0.001 | 0.001 | 0.533 | 0.001 | 0.001 | 0.414 | 0.001 | 0.001 | 0.695 | |
| Geographic location | Abroad | |||||||||
| North | −0.021 | 0.065 | 0.740 | −0.004 | 0.065 | 0.948 | −0.02 | 0.065 | 0.754 | |
| South | 0.033 | 0.071 | 0.640 | 0.058 | 0.071 | 0.416 | 0.043 | 0.071 | 0.547 | |
| Center | 0.007 | 0.062 | 0.911 | 0.004 | 0.062 | 0.938 | −0.009 | 0.062 | 0.880 | |
| Jerusalem and surrounding | −0.079 | 0.064 | 0.218 | −0.064 | 0.064 | 0.351 | −0.079 | 0.064 | 0.217 | |
| Categories (fixed effect) | included | included | included | |||||||
| Founding year (fixed effect) | included | included | included | |||||||
| Constant | 9.754 | 0.412 | 0.000 | 9.701 | 0.412 | 0.000 | 9.668 | 0.411 | 0.000 | |
| n | 2852 | 2852 | 2852 | |||||||
| Adj R2 | 0.587 | 0.570 | 0.590 | |||||||
| Supported Amount Percentage | Ln (Funds Raised) | |||||||
|---|---|---|---|---|---|---|---|---|
| Model 7A | Model 7B | Model 8A | Model 8B | |||||
| Number of updates | Average words to update | Number of updates | Average words to update | |||||
| Bounds | Lower bound | Upper bound | Lower bound | Upper bound | Lower bound | Upper bound | Lower bound | Upper bound |
| Interval | 0 | 44 | 0 | 244 | 0 | 44 | 0 | 244 |
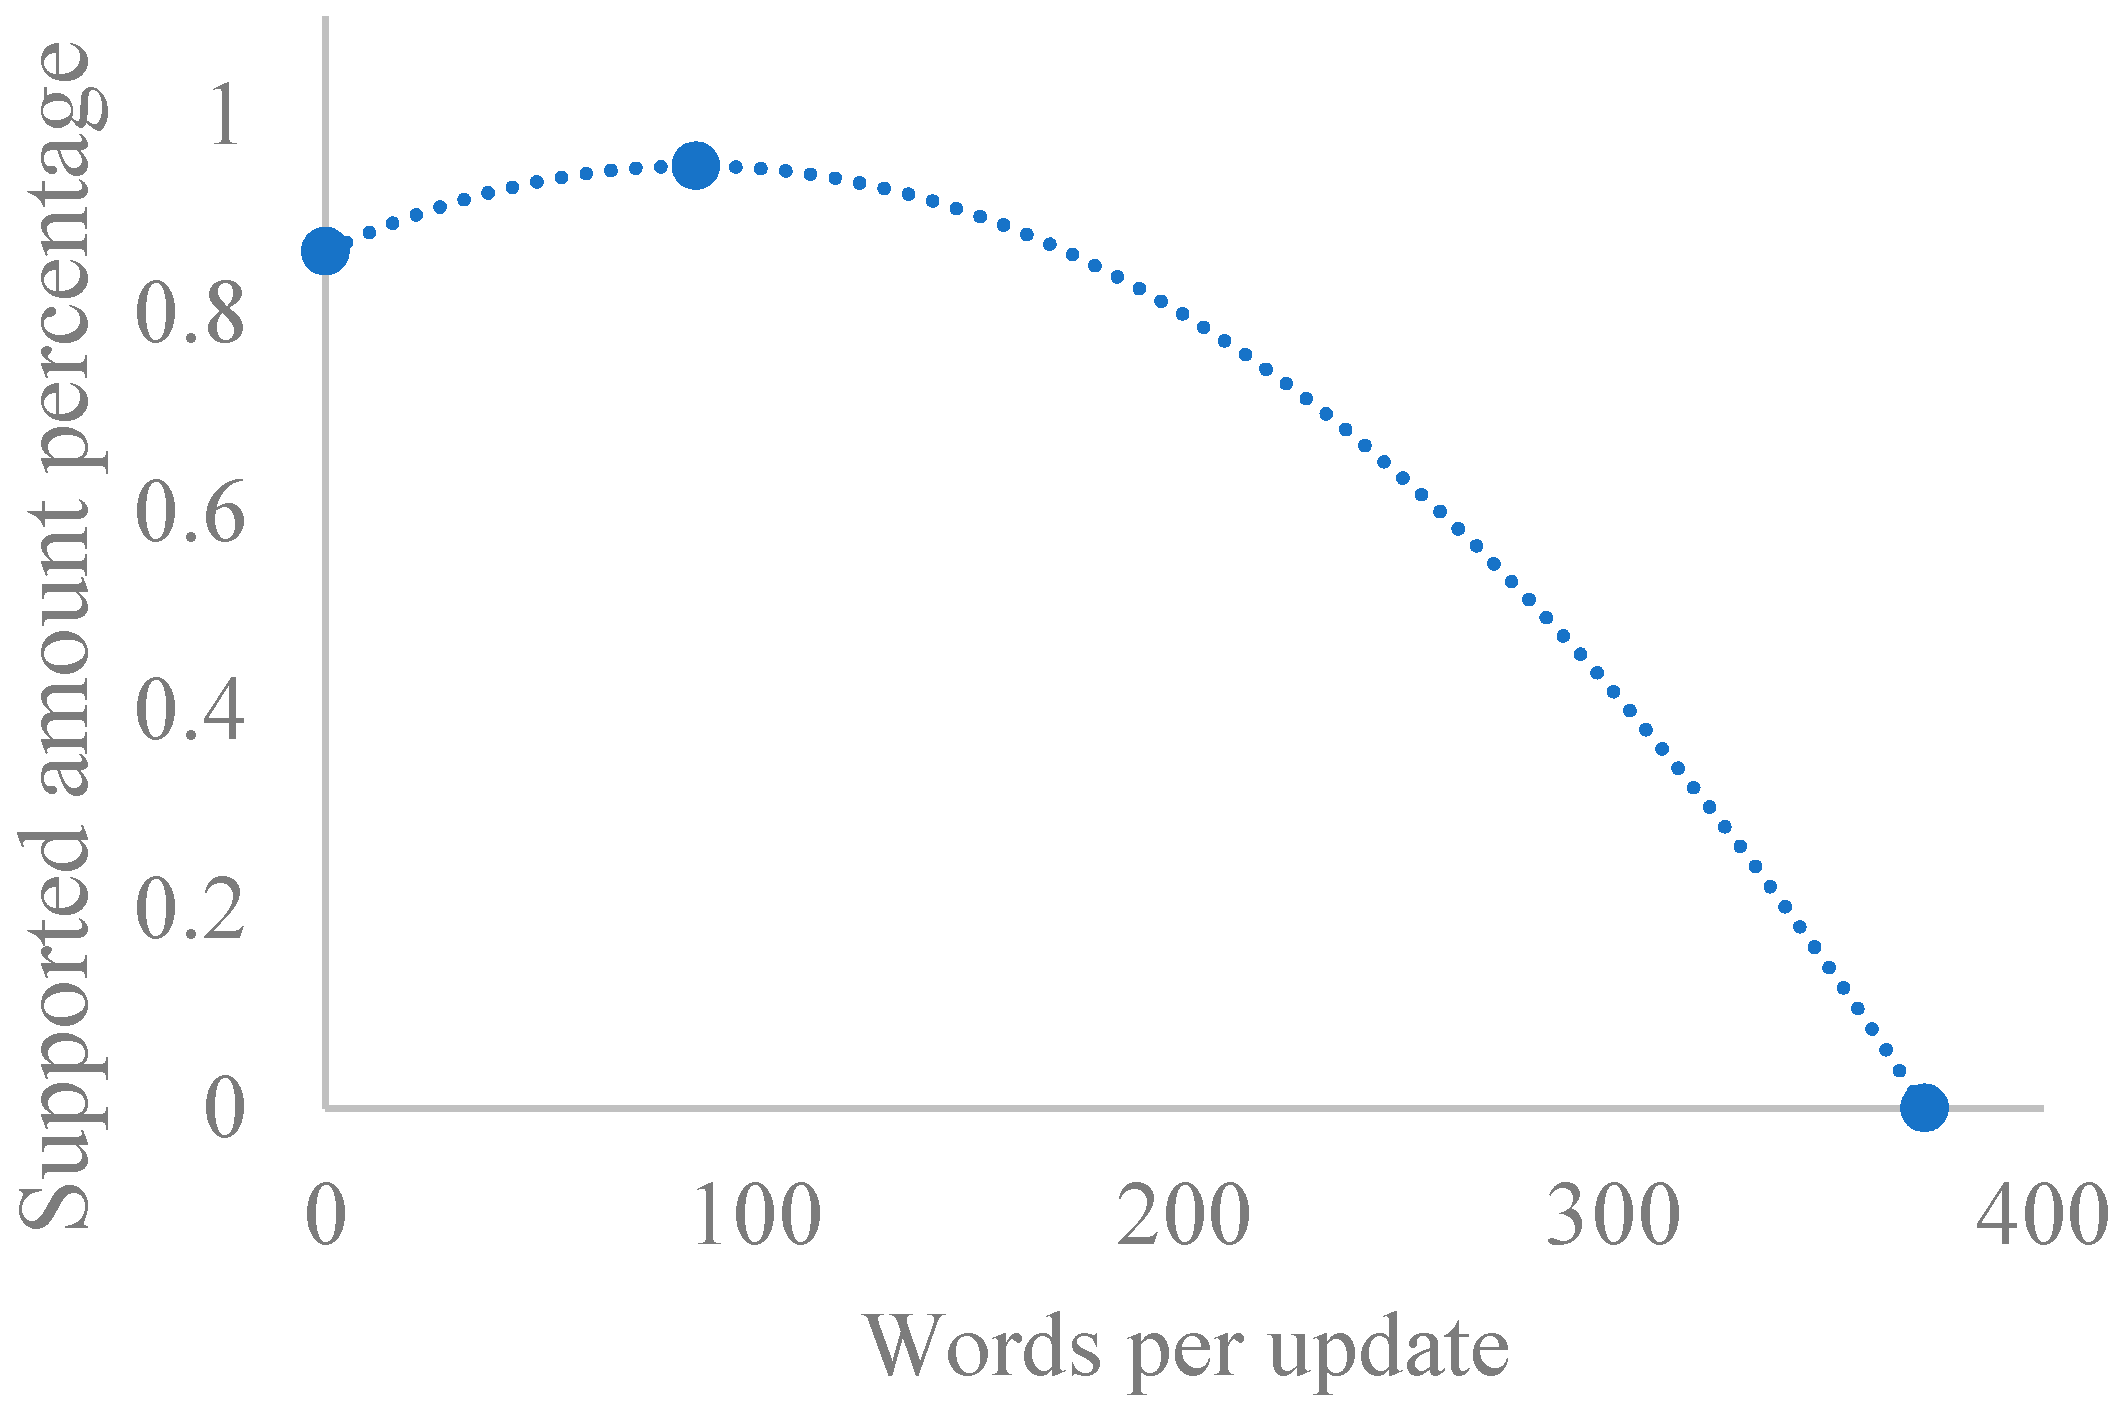
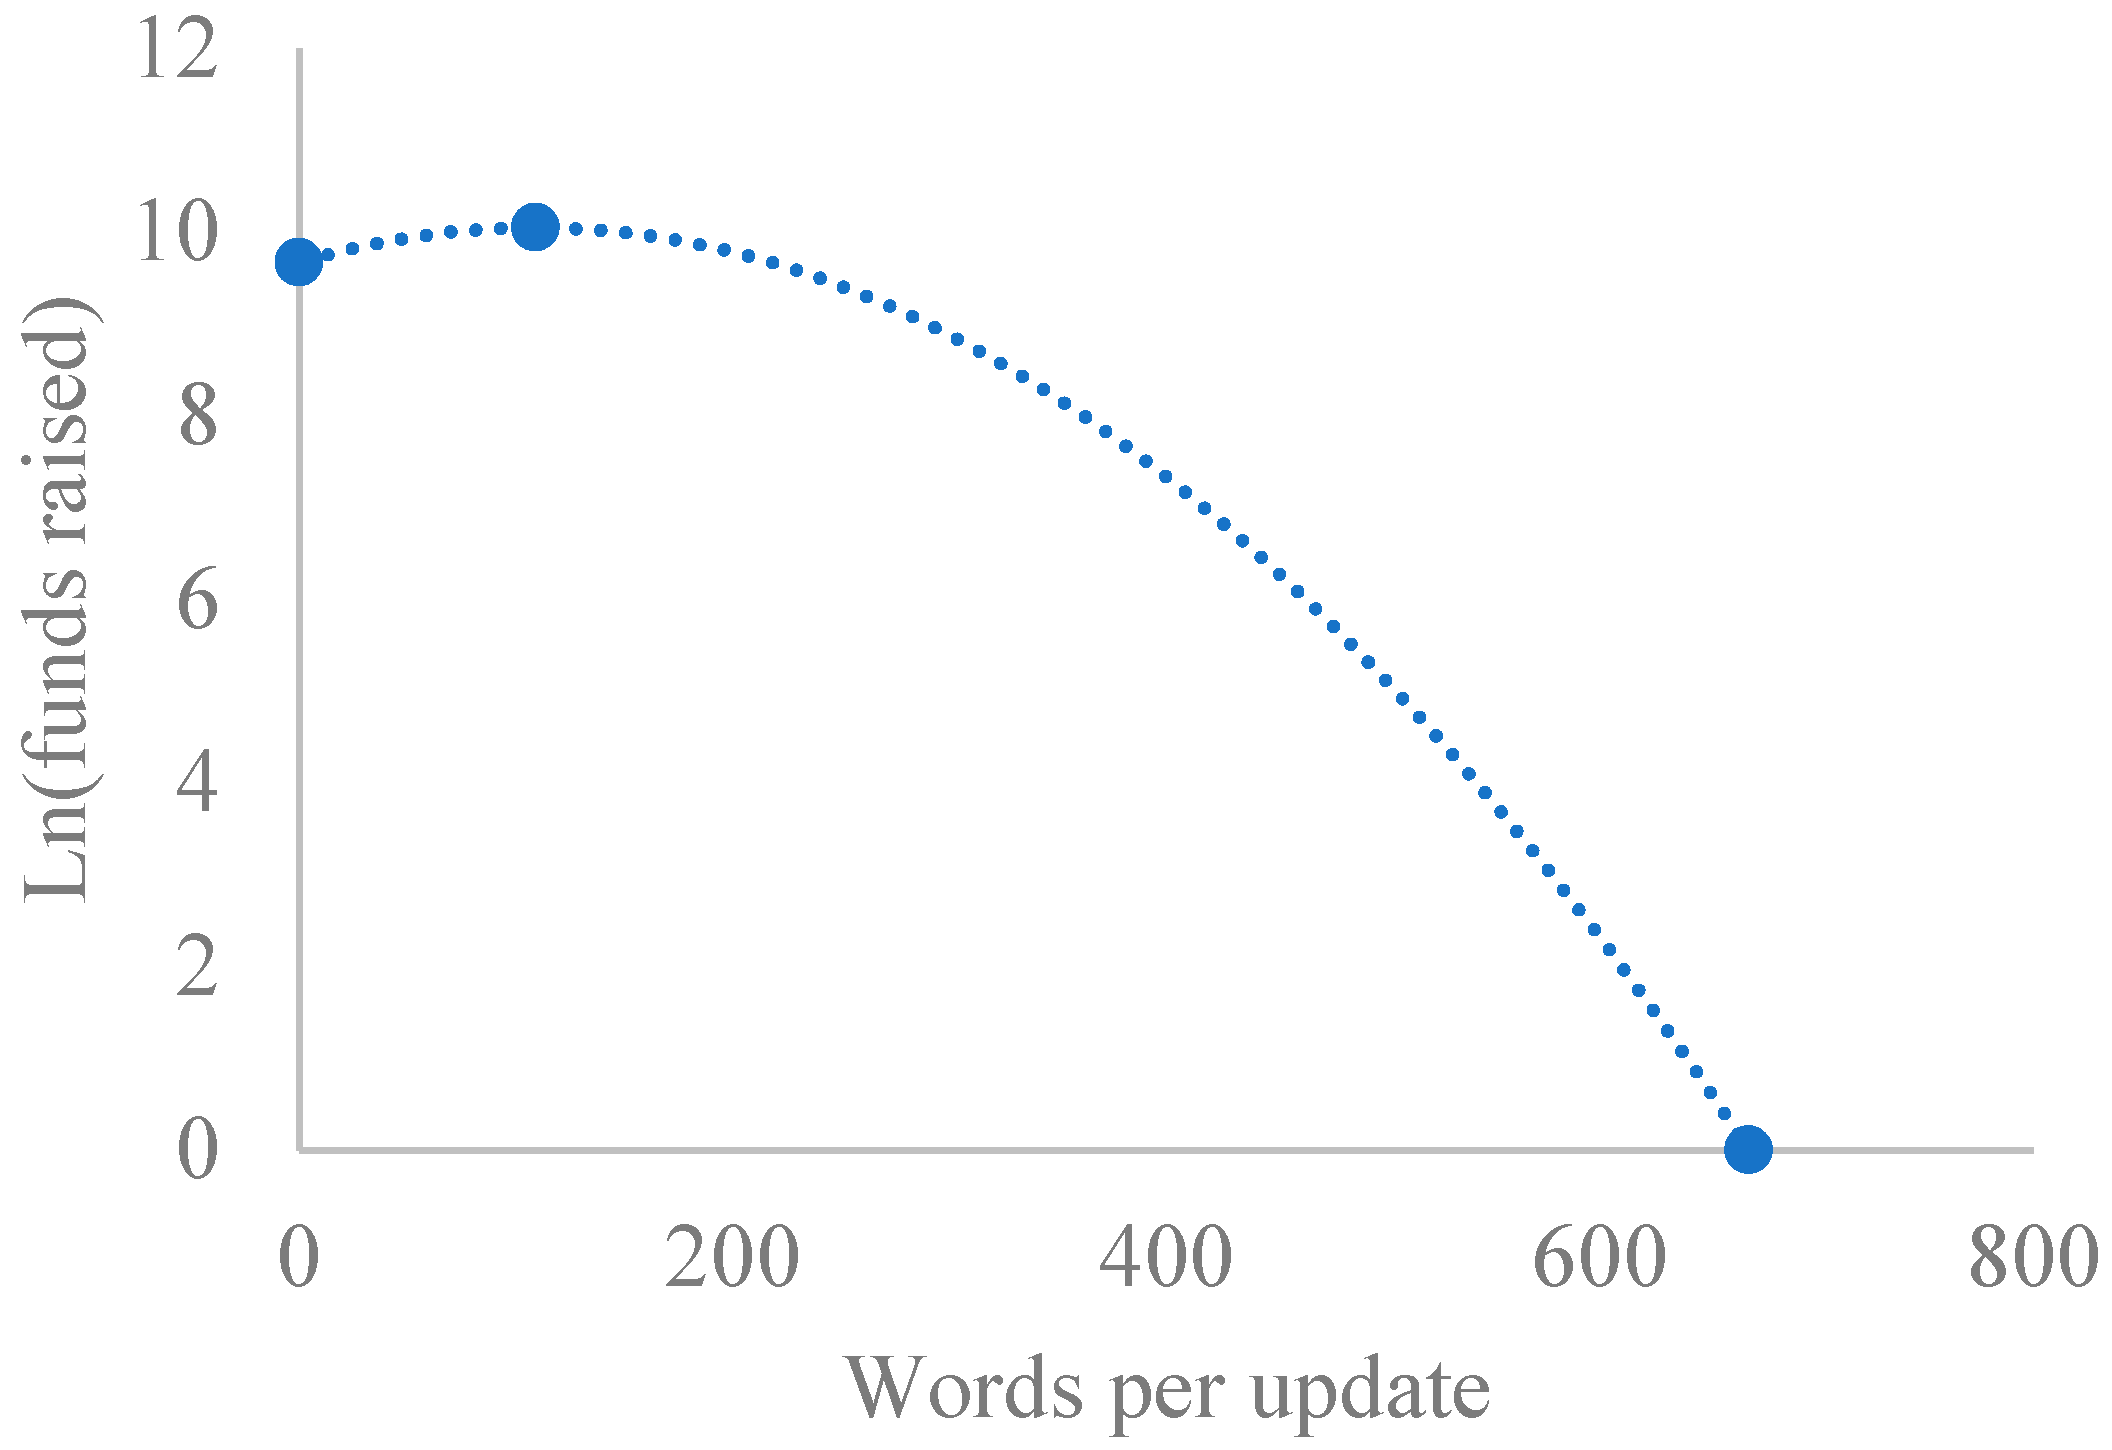
| Slope | 0.017 | −0.021 | 0.002 | −0.003 | 0.042 | −0.041 | 0.007 | −0.008 |
| t-value | 4.116 | −2.982 | 2.868 | −2.273 | 7.762 | −3.193 | 6.455 | −2.519 |
| p > |t| | 0.000 | 0.001 | 0.002 | 0.0115 | 0.000 | 0.000 | 0.000 | 0.005 |
| Extremum point: | 19.520 | 103.201 | 22.235 | 114.600 | ||||
| Overall test of: | Inverted U-shape | Inverted U-shape | Inverted U-shape | Inverted U-shape | ||||
| T value | 2.98 | 2.27 | 3.19 | 2.52 | ||||
| p > T | 0.001 | 0.011 | 0.000 | 0.006 | ||||
Disclaimer/Publisher’s Note: The statements, opinions and data contained in all publications are solely those of the individual author(s) and contributor(s) and not of MDPI and/or the editor(s). MDPI and/or the editor(s) disclaim responsibility for any injury to people or property resulting from any ideas, methods, instructions or products referred to in the content. |
© 2024 by the author. Licensee MDPI, Basel, Switzerland. This article is an open access article distributed under the terms and conditions of the Creative Commons Attribution (CC BY) license (https://creativecommons.org/licenses/by/4.0/).
Share and Cite
Solodoha, E. How Much Is Too Much? The Impact of Update Frequency on Crowdfunding Success. Adm. Sci. 2024, 14, 324. https://doi.org/10.3390/admsci14120324
Solodoha E. How Much Is Too Much? The Impact of Update Frequency on Crowdfunding Success. Administrative Sciences. 2024; 14(12):324. https://doi.org/10.3390/admsci14120324
Chicago/Turabian StyleSolodoha, Eliran. 2024. "How Much Is Too Much? The Impact of Update Frequency on Crowdfunding Success" Administrative Sciences 14, no. 12: 324. https://doi.org/10.3390/admsci14120324
APA StyleSolodoha, E. (2024). How Much Is Too Much? The Impact of Update Frequency on Crowdfunding Success. Administrative Sciences, 14(12), 324. https://doi.org/10.3390/admsci14120324