Article

Determining the Relationships between Price and Online Reputation in Lodgings

by
Manuel Rodríguez-Díaz
1,*,
Crina Isabel Rodríguez-Voltes
2 and
Ana Cristina Rodríguez-Voltes
2
1
Department of Economics and Business, University of Las Palmas de Gran Canaria, 35001 Las Palmas, Spain
2
Instituto Canario de Sicología y Educación, 35007 Las Palmas, Spain
*
Author to whom correspondence should be addressed.
Adm. Sci. 2019, 9(3), 53; https://doi.org/10.3390/admsci9030053
Submission received: 25 June 2019 / Revised: 20 July 2019 / Accepted: 22 July 2019 / Published: 29 July 2019
(This article belongs to the Special Issue Tourism Destination Management)

Abstract

:
Currently, lodgings’ competitiveness depends on pricing, based on the online reputation measured by quantitative scales of variables. The purpose of this article is to analyze the different prices set by lodgings by season in relation to the variables that measure their online reputation. This is an essential aspect in determining prices competitively in a constantly changing market. The study analyzes the offer of three tourist destinations (Gran Canaria and Tenerife in Spain and Agadir in Morocco) and online customer reviews on the quality of service, value, and added value obtained from Booking.com. Bivariate regressions with different functions were carried out to determine which one best matches these variables to the prices. The results show that added value has the greater relationship with prices. The cubic and quadratic functions have the best fit between quality of service and added value with regard to lodging prices. Based on the results obtained, it is possible to determine the most competitive prices lodgings can set depending on the quality of service and the added value offered to customers. To the extent that destinations from different countries are analyzed, the research reaches an international scope that is in line with the competitive reality of the tourism market.

1. Introduction

In today’s digital age, the competitiveness of tourist destinations and lodgings is conditioned by their online reputation (Rodríguez-Díaz and Espino-Rodríguez 2017a, 2017b). Therefore, competitiveness in tourism develops according to the image transmitted by lodgings and destinations (Govers et al. 2007; Lai and Li 2016; Sancho and Álvarez Rateike 2010). The intense exchange of information between customers and companies on the Internet generates an online reputation that directly influences consumer behavior and is a source of competitive advantage (Ye et al. 2014; Therkelsen 2003; Yacouel and Fleischer 2012; Chun 2005; Hernández Estárico et al. 2012). Likewise, online reputation also affects revenue level, with the relationship existing between price level and online reputation measured through the quality of service scales on websites specializing in the online opinions of tourism customers (Varini and Sirsi 2012; Kim and Park 2017).
The competitiveness of lodgings depends on their strategic positioning in the market, which is defined by Hooley et al. (1998) as a combination of the company’s choice of its target market and the differential advantage that can be exploited to secure that market. In this context, positioning is determined on the basis of consumer ratings that assess companies competing in a market, focusing on certain variables (Lovelock 1991). Currently, a large amount of quantitative and qualitative information can be obtained on the Internet that facilitates positioning studies on tourism companies, based on online customer opinions (Rodríguez-Díaz et al. 2015). Quantitative data normally measure the service quality and perceived value of lodgings, whereas the price variable can be obtained from the lodgings’ own websites or specialized webs (Yacouel and Fleischer 2012); Rodríguez-Díaz and Espino-Rodríguez (2017a, 2017b).
Quantitative and qualitative information available in specialized databases generates the online reputation of lodgings, influencing companies’ performance (Noone et al. 2011; Ye et al. 2009; Varini and Sirsi 2012; Anderson 2012). From this perspective, Lee and Jang (2013) differentiate lodgings in terms of quality, and rates are probably determined on the basis of their most direct competitors. These authors also point out that, whereas competition between lodgings has been the subject of various studies, price competition between lodgings, and its implications for commercial strategies, has not been addressed as much. Furthermore, according to Masiero and Nicolau (2012a), the identification of patterns in tourists based on their sensitivity to prices contributes to price fixing and to more clearly defining the target segments that lodgings and destinations attract.
In this new environment of Internet communications, tourist accommodation companies need to establish mechanisms to determine whether their pricing strategy agrees with the expectations created by customers at all times (Abrate et al. 2012). They need to apply methods of analysis and pricing in an international competitive environment such as tourist destinations (Crouch 1992). Insofar as online reputation directly influences customer decisions, it is essential to establish whether the strategy of creating value for customers matches the price level offered (Martens and Hilbert 2011; Conti 2013). According to Hernández Estárico et al. (2012), online reputation is based on the evaluations, comments, and images of a good or service that are transmitted on the Internet. In this regard, the value perceived by customers is directly related to quality of service and inversely to price (Holbrook 1994; Rust and Oliver 1994), and these factors are directly related to online reputation (Ye et al. 2009; Rodríguez-Díaz et al. 2015). Jena and Jog (2017, p. 1236) establish that “rapid changes can occur in pricing policies (as a reaction to a rival’s action) by making it a flexible tool and an influential competitive element”. Therefore, price is a tactical marketing variable that has high strategic value because it is essential in defining the competitive positioning of companies and the market segments on which they are going to focus (Lovelock 1991; Lockyer 2005; Hung et al. 2010; Masiero and Nicolau 2012a), due to the fact that room prices affect perceived service quality (Oh 1999, 2000; Oh and Kim 2017) and consumer satisfaction (Mattila and O’Neill 2003; Kim and Park 2017).
The purpose of this article is to determine the relationship between the price level of a lodging and its online reputation, measured by the scale used on the Booking.com website. To accomplish this objective, we have collected information about the opinions of lodging customers of three tourist destinations and the price levels of these destinations in different seasons (high season and low season): South of Gran Canaria (Canary Islands, Spain), South of Tenerife (Canary Islands, Spain), and Agadir (Morocco). In order to determine what relationship fits best, a different type of regression analysis was carried out. In order to achieve the objective established in this article, the study begins with a review of the academic literature and then describes the methodology applied in the research. The next section describes the results obtained, both jointly and individually for each destination. Finally, the article presents the main conclusions reached, limitations, and suggestions for future research.

2. Literature Review

One of the main problems faced by lodging managers is how to set prices based on the online reputation determined by customers (Rodríguez-Díaz et al. 2018). From a practical point of view, this is an essential objective that requires technological tools to facilitate constant price updating (Yacouel and Fleischer 2012). Therefore, there are two essential aspects of this research; an aspect associated with prices, on the one hand, and the determination of online reputation, on the other. Cross et al. (2009) explains how the concept and scope of revenue management in lodging has evolved. At first, it basically focused on the task of fixing room prices according to the expected occupancy level, in order to obtain the maximum amount of income. At present, this is a more dynamic task, taking on a more strategic role in tourism companies, including the definition of marketing, sales, and design, and the selection of sales channels. Thus, the responsibility of revenue management has been extended to include pricing and demand management (Noone et al. 2011; Li et al. 2013). This involves the implementation of a customer-focused approach to attract the necessary demand in terms of volume and specific target segments in a market dominated by Internet communication and mass media (Abrate et al. 2012).
Yacouel and Fleischer (2012, p. 225) studied online travel agencies and their impact on lodging prices, concluding that “since the information on hotels’ past quality is revealed to the guests, the guests are willing to pay higher price to hotels with a good record (hotels that they expect to keep on providing high service quality). This price premium for a good reputation motivates the hoteliers to actually invest in providing high standards of service quality”. Ye et al. (2009) also established the direct relationship between users’ online reviews and hotel sales levels. Furthermore, Kim and Park (2017) demonstrated that the social media rating has greater predictive power of hotel performance than the measure of traditional consumer satisfaction. They point out that it is a more effective procedure for managers to use to determine the performance of the accommodation. Likewise, Xie et al. (2014) concluded in their study that ratings of the hotel’s purchase value, location, and cleanliness are the three important attributes that can influence hotel performance.
Therefore, the relationship between online reputation and price level has been observed by several authors (Varini and Sirsi 2012; Ye et al. 2009; Noone et al. 2011; Yacouel and Fleischer 2012; Mauri and Minazzi 2013; Xie et al. 2014; Kim and Park 2017). However, there has not been much research on the relationship between prices and the online reputation of accommodations, measured in different ways (e.g., quality of service, value, and added value). The research on prices in tourism has focused on analyzing different aspects, such as price asymmetry (Lee and Jang 2013), the identification of factors influencing price evolution (Lee 2011), the effect of discounts (Croes and Semrad 2012; Blal and Graf 2013), dynamic pricing strategies (Abrate et al. 2012), the impact of oil prices on tourism (Lennox 2012), the relationship between hotel room prices and location (Zhang et al. 2011), the impact of advertising on pricing and profit in the tourism supply chain (Jena and Jog 2017), the relationships with the category of lodgings (Israeli 2012; Tanford et al. 2012), price elasticity of the lodging demand depending on advertising (Chen et al. 2015), customers’ price perceptions (Kleinsasser and Wagner 2011; Masiero and Nicolau 2012b), pricing determinants in hotels (Hung et al. 2010; Espinet et al. 2003), the competitive positioning of lodgings (Rodríguez-Díaz et al. 2015, 2018), the importance of price in hotel selection (Lockyer 2005), and the relationship between the room rate and lodging performance (Qu et al. 2002; Enz et al. 2009; Ye et al. 2009; Chen et al. 2011; Noone et al. 2011; Chen and Chang 2012; Xie et al. 2014).
Jena and Jog (2017) regard the seasonality of tourist markets as a decisive factor in the price variable. Prices tend to be altered depending on the occupancy level and the decisions of competitors (Espinet et al. 2003). Hung et al. (2010, p. 378) find tourism demand to be uncertain and fluctuating. In this context, tourism is an unmodifiable service and causes problems due to cancellations or overbooking. Rodríguez-Díaz et al. (2018) show the differences between the prices of lodgings in high season and low season, considering price alterations within each season. All of this means that managers have to make dynamic and constant decisions in order to achieve the desired results. (Abrate et al. 2012). Hence, it can be deduced that the pricing strategy for lodgings can be adapted according to the period of time when substantial changes in demand are detected, either by segment type or total demand.
Because online reputation has a direct influence on prices, the content and scope of this concept should be determined. Online reputation is the idea that is generated from the image, positioning, or assessment of a particular company, brand, or product/service, through the opinions shared by customers through the Internet. This is an activity of shared communication between customers, and/or the company produces a mental image that influences customers’ purchasing behavior. Therefore, it is an interactive process where users share and exchange information through different online communication channels and mass media (Einwiller 2003; Mudambi and Schuff 2010). From this perspective, companies largely lose control of communication about their goods and services, forcing them to develop new marketing strategies adapted to the digital era (Vermeulen and Seegers 2009; Pantelidis 2010; Ryu and Han 2010; Zhang et al. 2010; Gössling et al. 2016).
The flow of information shared about lodgings over the Internet is a public way of assessing the perceived quality of service and perceived value for clients (Xie et al. 2014; Ye et al. 2014; Hu et al. 2008; Rodríguez-Díaz et al. 2015). Online customer feedback can be shared through qualitative feedback and quantitative assessments of specific attributes or constructs related to the lodgings’ activity (Rodríguez-Díaz and Espino-Rodríguez 2017b). Torres (2014) states that service quality is a result that is usually measured quantitatively, whereas customer satisfaction is often measured qualitatively through content analysis (Li et al. 2013; O’Connor 2010). Value is a widely studied concept in the academic literature on marketing and management, because companies must be oriented toward generating the greatest possible value for their clients (Porter 1980; Oh 1999; Grönroos 2007; Payne and Frow 2005; Payne and Holt 2001). In service companies, the subjective characteristic of this construct is highlighted (Zeithaml 1988; Anderson and Narus 1998; Oh 2000; Holbrook 1994; Rust and Oliver 1994) and is directly related to the quality of service and inversely related to the price level of goods and services (Holbrook 1994; Rodríguez-Díaz and Espino-Rodríguez 2017a).
Perceived value has been the object of study in relation to the quality of service, (Parasuraman et al. 1988; Oh 2000; Xie et al. 2014; Sparks et al. 2008; Nasution and Mavondo 2008; Núñez-Serrano et al. 2014) and customer satisfaction (Oliver 1997; Oh 1999; Li et al. 2013; O’Connor 2010). According to Prebensen et al. (2012), the perceived value in tourism is usually assessed through a single variable measuring the “quality-price relationship” or “value for money”. However, some authors believe that this way of measuring perceived value is insufficient (Gallarza and Saura 2006; Gallarza et al. 2011; Sweeney et al. 1999), although the reality of the Internet requires the use of scales with very few variables in order to make it easy for users to share their assessments.
Regarding the added value of lodgings (Jeong 2002), Rodríguez-Díaz et al. (2015) proposed an approach to measure it based on online customer ratings, by subtracting the perceived quality of service from the perceived value by customers. The results obtained showed that higher-category lodgings tended to have a lower added value because of higher prices. These results agree with those obtained by López Fernández and Serrano Bedia (2004) and O’Connor (2010), showing that the more stars an accommodation has, the more demanding the customers are. This study will analyze the relationships between the price variable and online reputation, measured through perceived value, perceived quality of service, and added value, based on the quantitative information available on Booking.com for lodgings in three tourist destinations. The aim is to establish what type of function and construct obtains a better fit between the analyzed variables.

3. Research Methodology

The empirical study of the relationship between price and the dimensions of perceived value, perceived service quality, and added value was carried out using a database of 403 lodgings. These tourism companies are located in three tourist destinations specialized in sun and beach tourism that compete with each other: South of Gran Canaria (Canary Islands, Spain), South of Tenerife (Canary Islands, Spain), and Agadir (Morocco). The Canary Islands receive more than 12 million tourists per year, making it one of the main destinations in Europe (ISTAC 2015), whereas Agadir is located in the Moroccan region of Souss Massa Drâa, which receives 4 million tourists a year (ICEX 2011).
The data were collected from the Booking.com website. There were a total of 69,024 customer ratings of the lodgings. Of them, 38,096 were from the destination of Gran Canaria, where 272 accommodations were analyzed. In Tenerife, 82 lodgings with 20,950 comments were studied, whereas in Agadir 49 lodgings were considered, with 9,978 customer evaluations. The information gathered on Booking.com has a strong guarantee of reliability because it corresponds to real customers (Rodríguez-Díaz et al. 2015). The scale used by Booking.com has seven variables measured with 10 points (1 = very low rating; 10 = very high rating). However, this score is not the same as the one given in the customer survey because, according to Mellinas et al. (2015), only four response alternatives are offered to customers, later transformed into a 10-point scale. Despite the bias of Booking.com, Rodríguez-Díaz and Espino-Rodríguez (2017a, 2017b) show that it is one of the most reliable and valid tools available on the Internet.
The quantitative variables used by web portals to evaluate customer opinions usually measure the quality of service perceived and the perceived value (Rodríguez-Díaz and Espino-Rodríguez 2017b). Booking.com uses a scale that currently consists of seven variables, one that measures perceived value (value for money V) and six that measure quality of service: personnel (S), service/installations (F), cleaning (Cl), comfort (Cl), location (L), and wifi (W) (see Table 1). On this basis, Booking.com also calculates an average score for these variables in order to give a global hotel score (HAS). Furthermore, information on lodging categories and their prices is also available on this website. According to authors such as Espinet et al. (2003), Hung et al. (2010), and Jena and Jog (2017), tourism prices change throughout the year depending on fluctuations in demand, the level of competitiveness at any given time, and the market segments to which they are oriented in each period of time.
In the destinations studied, a distinction is made between high season (winter) and low season (summer) because their greatest demand occurs when other competitive destinations are closed in winter. There are also periods of higher demand and prices within each season and vice versa. Therefore, this study differentiates between the highest and lowest common prices in each season. In winter, the highest common prices are usually offered in the months of November, February, and March, whereas the lowest prices are usually offered in the first 20 days of December and April. It should be noted that the highest prices are those paid at Christmas, but it is only one week, and so it is not considered the most common price in winter. On the other hand, the highest prices in the summer season are found in the last ten days of July, August, and October, whereas the lowest are found in the months of May, June, and the first twenty days of July. This information was obtained from interviews with lodging and tour operation managers, and subsequently compared to the prices obtained on the Booking.com website.
The study carried out consists of determining the relationship between prices and the variables of perceived value (V), perceived service quality (Q), and added value (AV). The variable value for money included in the Booking.com scale is used to measure the price variable. In order to quantify the average of the perceived quality of service (Q), the average of the personnel (S), service/facilities (F), cleaning (Cl), comfort (Co), and location (L) variables were calculated. The wifi variable was not included, because it depends to a large extent on public infrastructure and telecommunications companies external to lodgings. Finally, the value-added variable was established following the procedure proposed by Rodríguez-Díaz et al. (2015), and is the result of subtracting the average quality of service (Q) from the value (V). This variable can have positive, negative, or zero scores. When the added value of a lodging is zero, it is offering a quality of service in accordance with the price it establishes. If the added value has a positive score, it means that customers think the price to be paid for the lodging is lower than the quality of the service they receive. By contrast, a negative added value indicates that customers think they pay extra for the quality of the service received. The latter is usually the case for higher category lodgings.
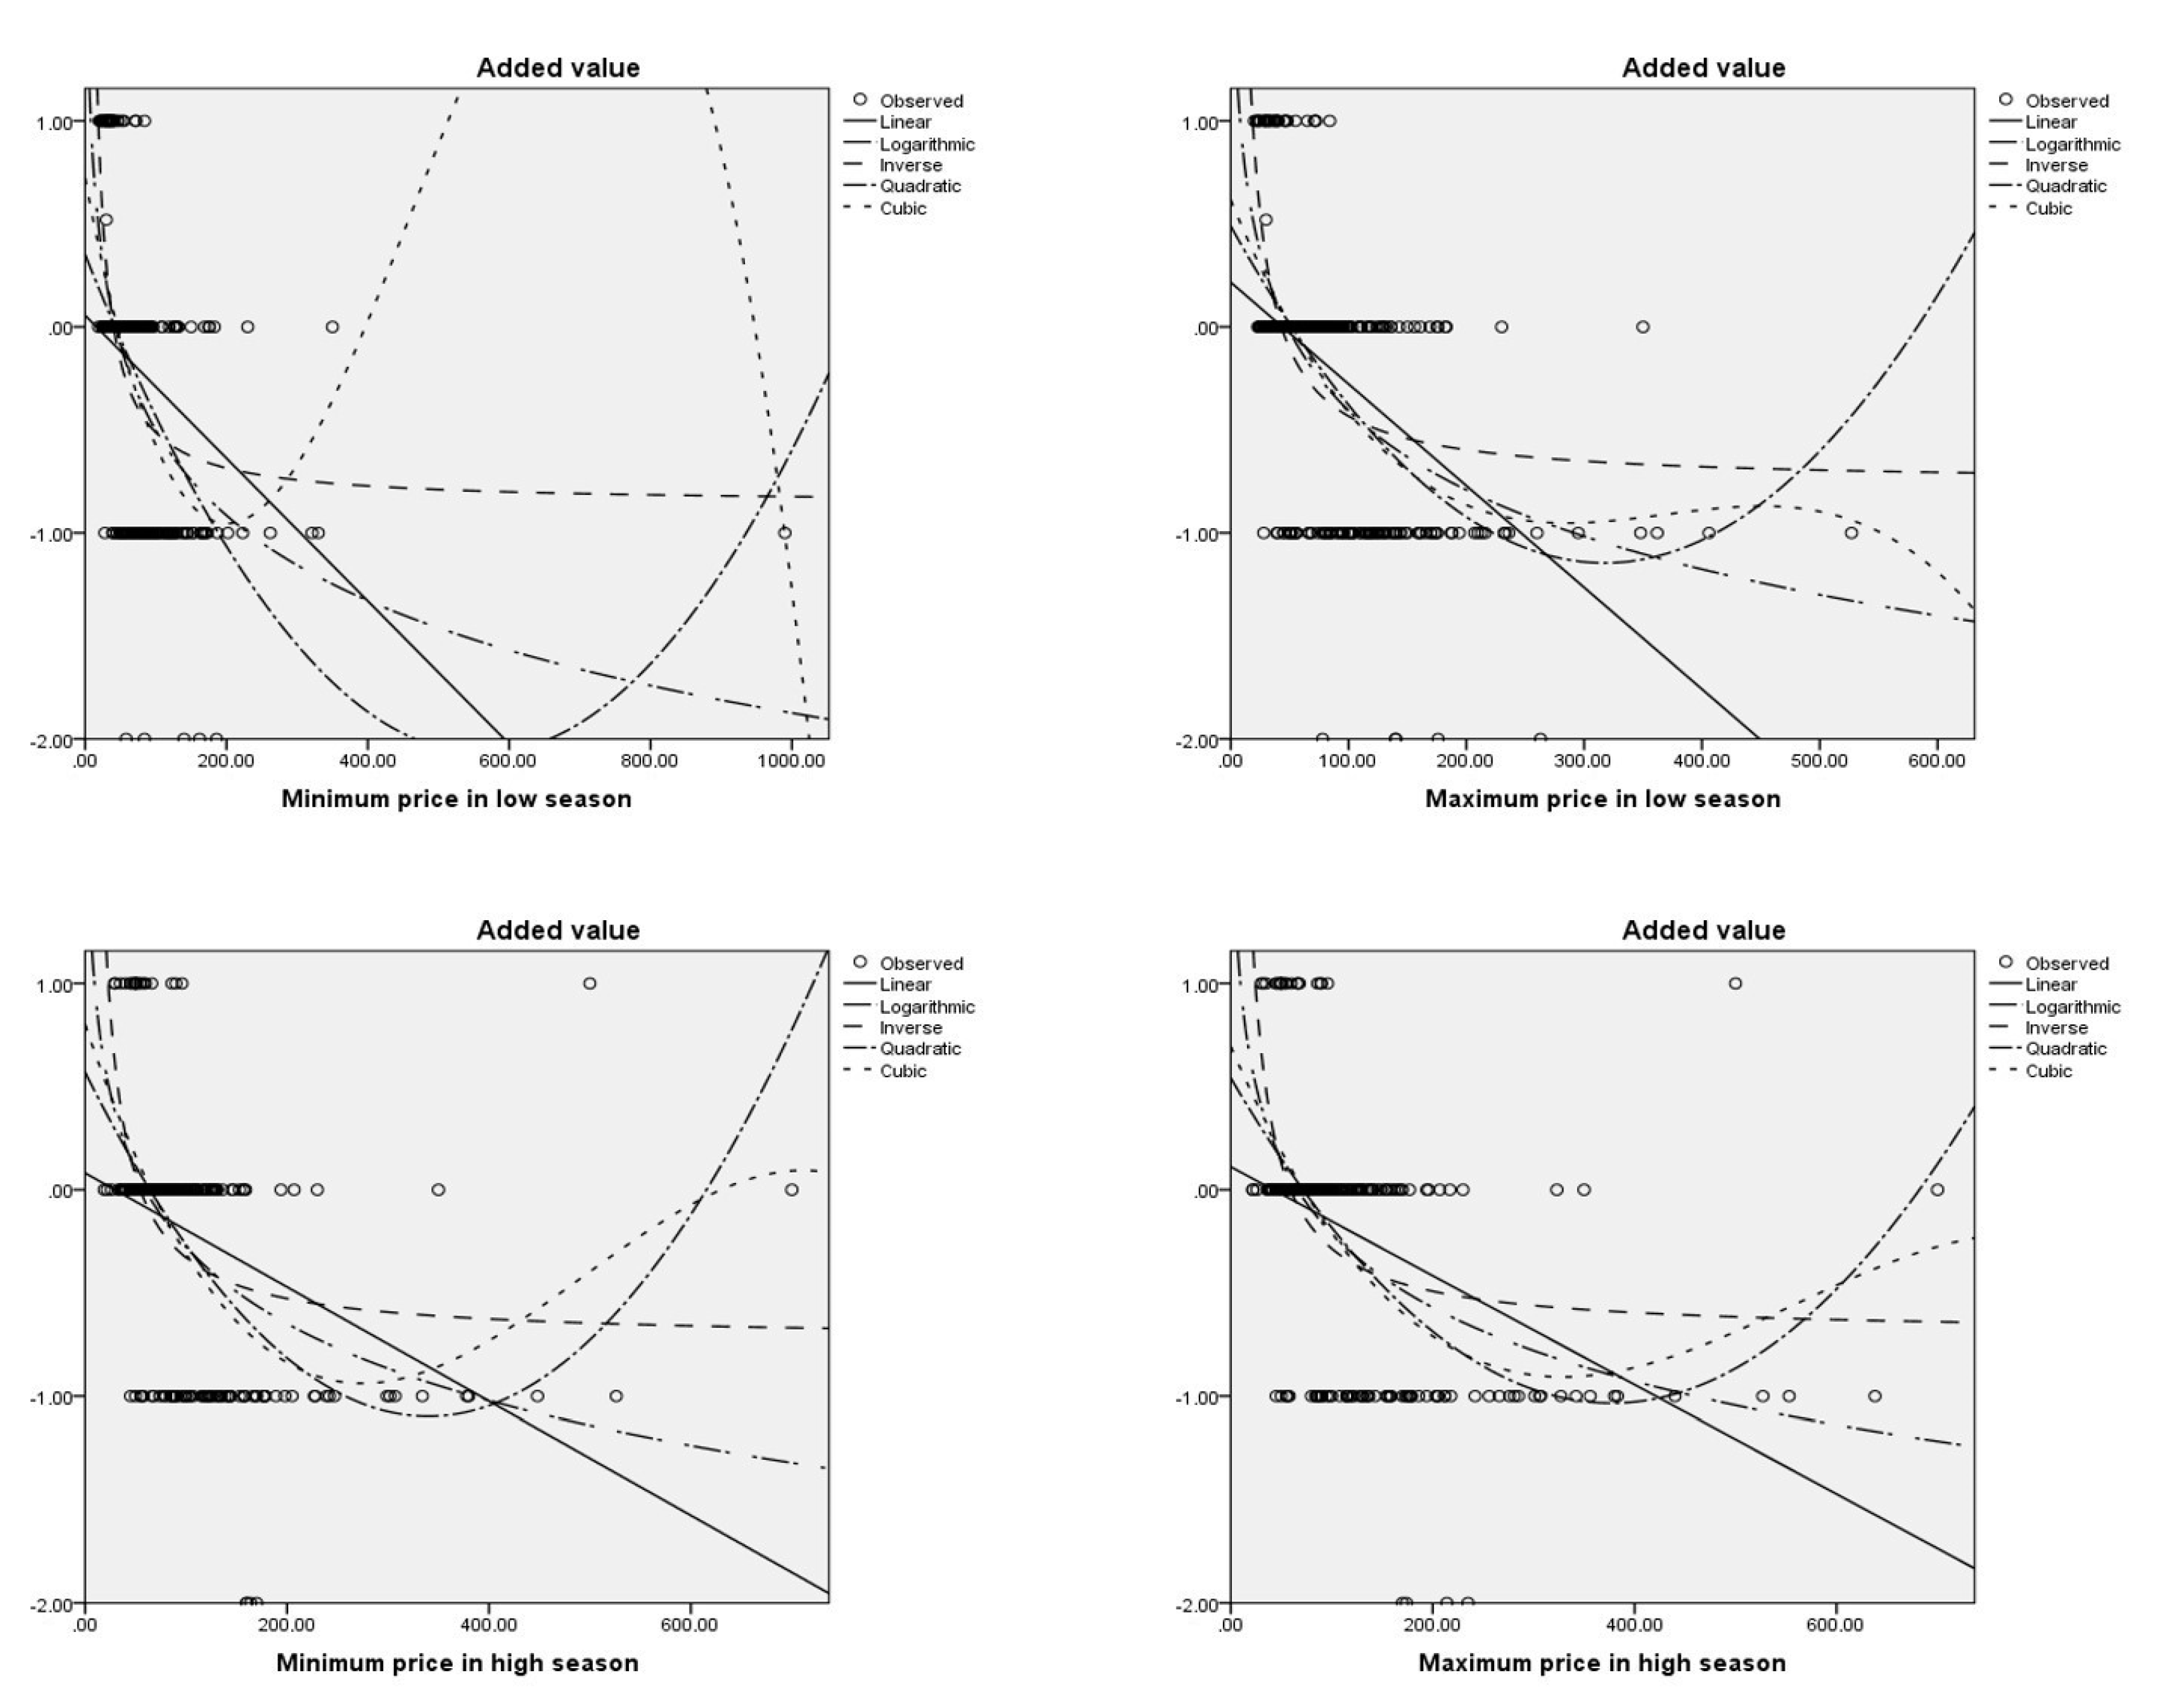
The statistical analysis carried out was the regression of curve estimation models using the SPSS statistical program. The regressions were bivariate; prices were the independent variables, and the perceived value (V), the average of the perceived quality of service (Q), and the added value (AV) were dependent variables. The aim of the study was to determine the function with the best fit of the relationships in the different types of prices. To this end, the regression was carried out in the linear, logarithmic, inverse, quadratic, and cubic functions, as described below:
  • Linear: Model with the equation y = b0 + b1*t.
  • Logarithmic: Model with the equation y = b0 + b1*ln(t).
  • Inverse: Model with the equation y = b0 + (b1/t).
  • Quadratic: Model with the equation y = b0 + b1*t + b2*t2.
  • Cubic: Model with the equation y = b0 + b1*t + b2*t2 + b3*t3.

4. Analysis of Results

Bivariate regression analyses were carried out with the information collected on prices in different seasons and time periods, as well as online customer evaluations of the perceived value, perceived average service quality, and added value variables. The aim was to determine which of the three online reputation variables examined was most closely related to price. To this end, all the information from the three tourist destinations together was analyzed first. Subsequently, the same regression analysis was carried out for each of the destinations to find out whether the results were consistent.

4.1. All Destinations

The results of the regressions of the perceived value variable as a dependent variable and the four prices as independent variables are shown in Table 2. It can be observed that all the results have a very low adjusted R2, which shows that there is no significant relationship between perceived value and price. The results for the average quality of service are shown in Table 3 and confirm that the adjusted R2 scores are relevant for a social science study. With regard to minimum prices in low season, the function that obtained the highest R2 (0.2019) was logarithmic, as it was for maximum prices in low season (0.1885) and high season (0.2415). On the other hand, the cubic function obtained the highest R2 (0.2751) for the lowest prices in high season. Finally, the added value achieved much higher results than the previous ones, as Table 4 reveals. Thus, the cubic function obtained an adjusted R2 of 0.3264 for the lowest prices in low season 0.3248 for the maximum prices in low season 0.3208 for the minimum prices in high season, and 0.3171 for the maximum prices in low season. However, the quadratic and logarithmic functions also performed strongly, demonstrating that value added is the variable most closely linked to price. These results are shown in Figure 1, where all the functions analyzed are represented in the variables that obtained the best fit to each type of price.

4.2. Gran Canaria Destination

The study carried out in the destination of Gran Canaria obtained very similar results. Table 5 shows that the models assessed with price and perceived value are not significant, because the adjusted R2 are very low, around zero. However, the average quality of service is directly related to price. The inverse (0.2085), cubic (0.2024), and logarithmic (0.1921) functions obtain the highest adjusted R2 at the lowest prices in low season (see Table 6). For the maximum price in low season, the inverse function obtains the highest adjusted R2 (0.1813), although the rest of the functions obtain similar results. For the lowest prices in high season, the cubic function has the best fit (0.2506), and for the highest prices in high season, the inverse function shows the best fit (0.2174), followed by the cubic function (0.2097). Regarding added value, Table 7 shows that this variable fits the three variables studied best. For the lowest prices in low season, the cubic function obtains the highest adjusted R2 (0.2839), as well as for the maximum prices in low season (0.2692), the lowest prices in high season (0.3410), and the highest prices in high season (0.3152). As the table shows, the adjusted R2 obtained are quite high, and the graphic representation of the functions that obtain the best fit to each type of price is shown in Figure 2.

4.3. Tenerife Destination

The results obtained in the destination of Tenerife differ moderately with regard to the rest of the analyses carried out. In the case of the perceived value, Table 8 shows that it is still not directly related to lodging prices because it obtains adjusted R2 values close to zero. The differences are found in Table 9, where the adjusted R2 of the average service quality perceived is higher than those of value added at the lowest prices in low season (square and cubic function 0.3797), minimum prices in high season (cubic function 0.4982), and maximum prices in high season (cubic function 0.4480). On the other hand, the added value obtains the highest R2 adjusted in the cubic function of the maximum prices in low season (0.3869). However, Table 10 shows that the adjusted R2 obtained by the added value is very similar to those of the average perceived quality of service, as the inverse function obtained an adjusted R2 of 0.3632 in the lowest low season prices 0.4531 in the minimum high season prices, and 0.4411 in the maximum high season prices. The reason the average quality of the service perceived obtained somewhat higher results than the added value may be that the sample from the Tenerife destination was more concentrated in a certain offer of lodgings, whereas in Gran Canaria the types of accommodations and categories were more diverse. Figure 3 shows the graphs with the functions considered in the analysis, with the variables that achieved the best fit in each type of price studied.

4.4. Agadir Destination

Finally, the results obtained from the regression analysis in the Agadir destination highlight the great difference in value added compared to the other two variables studied. In this destination, Table 11 shows once again that the perceived value is not related to the prices studied because the adjusted R2 are close to zero. It should also be noted that the adjusted R2 achieved by the average quality of service were particularly low, with the adjusted R2 of the cubic function for the maximum prices in the low season reaching only 0.1999 (see Table 12). In contrast, the adjustments attained by the added value variable were very high compared to the rest of the regressions carried out. Table 13 shows that the cubic function reaches an adjusted R2 of 0.5419 at the lowest prices in low season, followed very closely by the quadratic (0.5393) and linear (0.5372) functions. For the maximum prices in low season, the cubic function also obtains the best fit 0.5344, as well as ford the minimum prices in high season (0.534) and the maximum prices in high season (0.5125). It is necessary to emphasize that the quadratic and linear functions have also acquired some high adjusted R2 close to those of the quadratic function. The graphic summary of the results obtained in the Agadir destination is shown in Figure 4, where the added value is the variable that obtained the best results in all the regressions carried out.

5. Conclusions

The study presents a method for determining which online reputation variables are most closely related to lodging prices. This is a critical factor in the pricing process in the highly dynamic and competitive environment of the digital age. Online reputation has a direct influence on consumers’ buying behavior and, therefore, on the demand for each lodging. At the same time, a price that does not match the quality of service level offered can have an impact on the creation of customer expectations, which, when frustrated, will reinforce the devaluation of online reputation.
Price is a variable that is inversely related to perceived value (Holbrook 1994) and, consequently, to added value, which is calculated by subtracting the average service quality perceived from the perceived value (
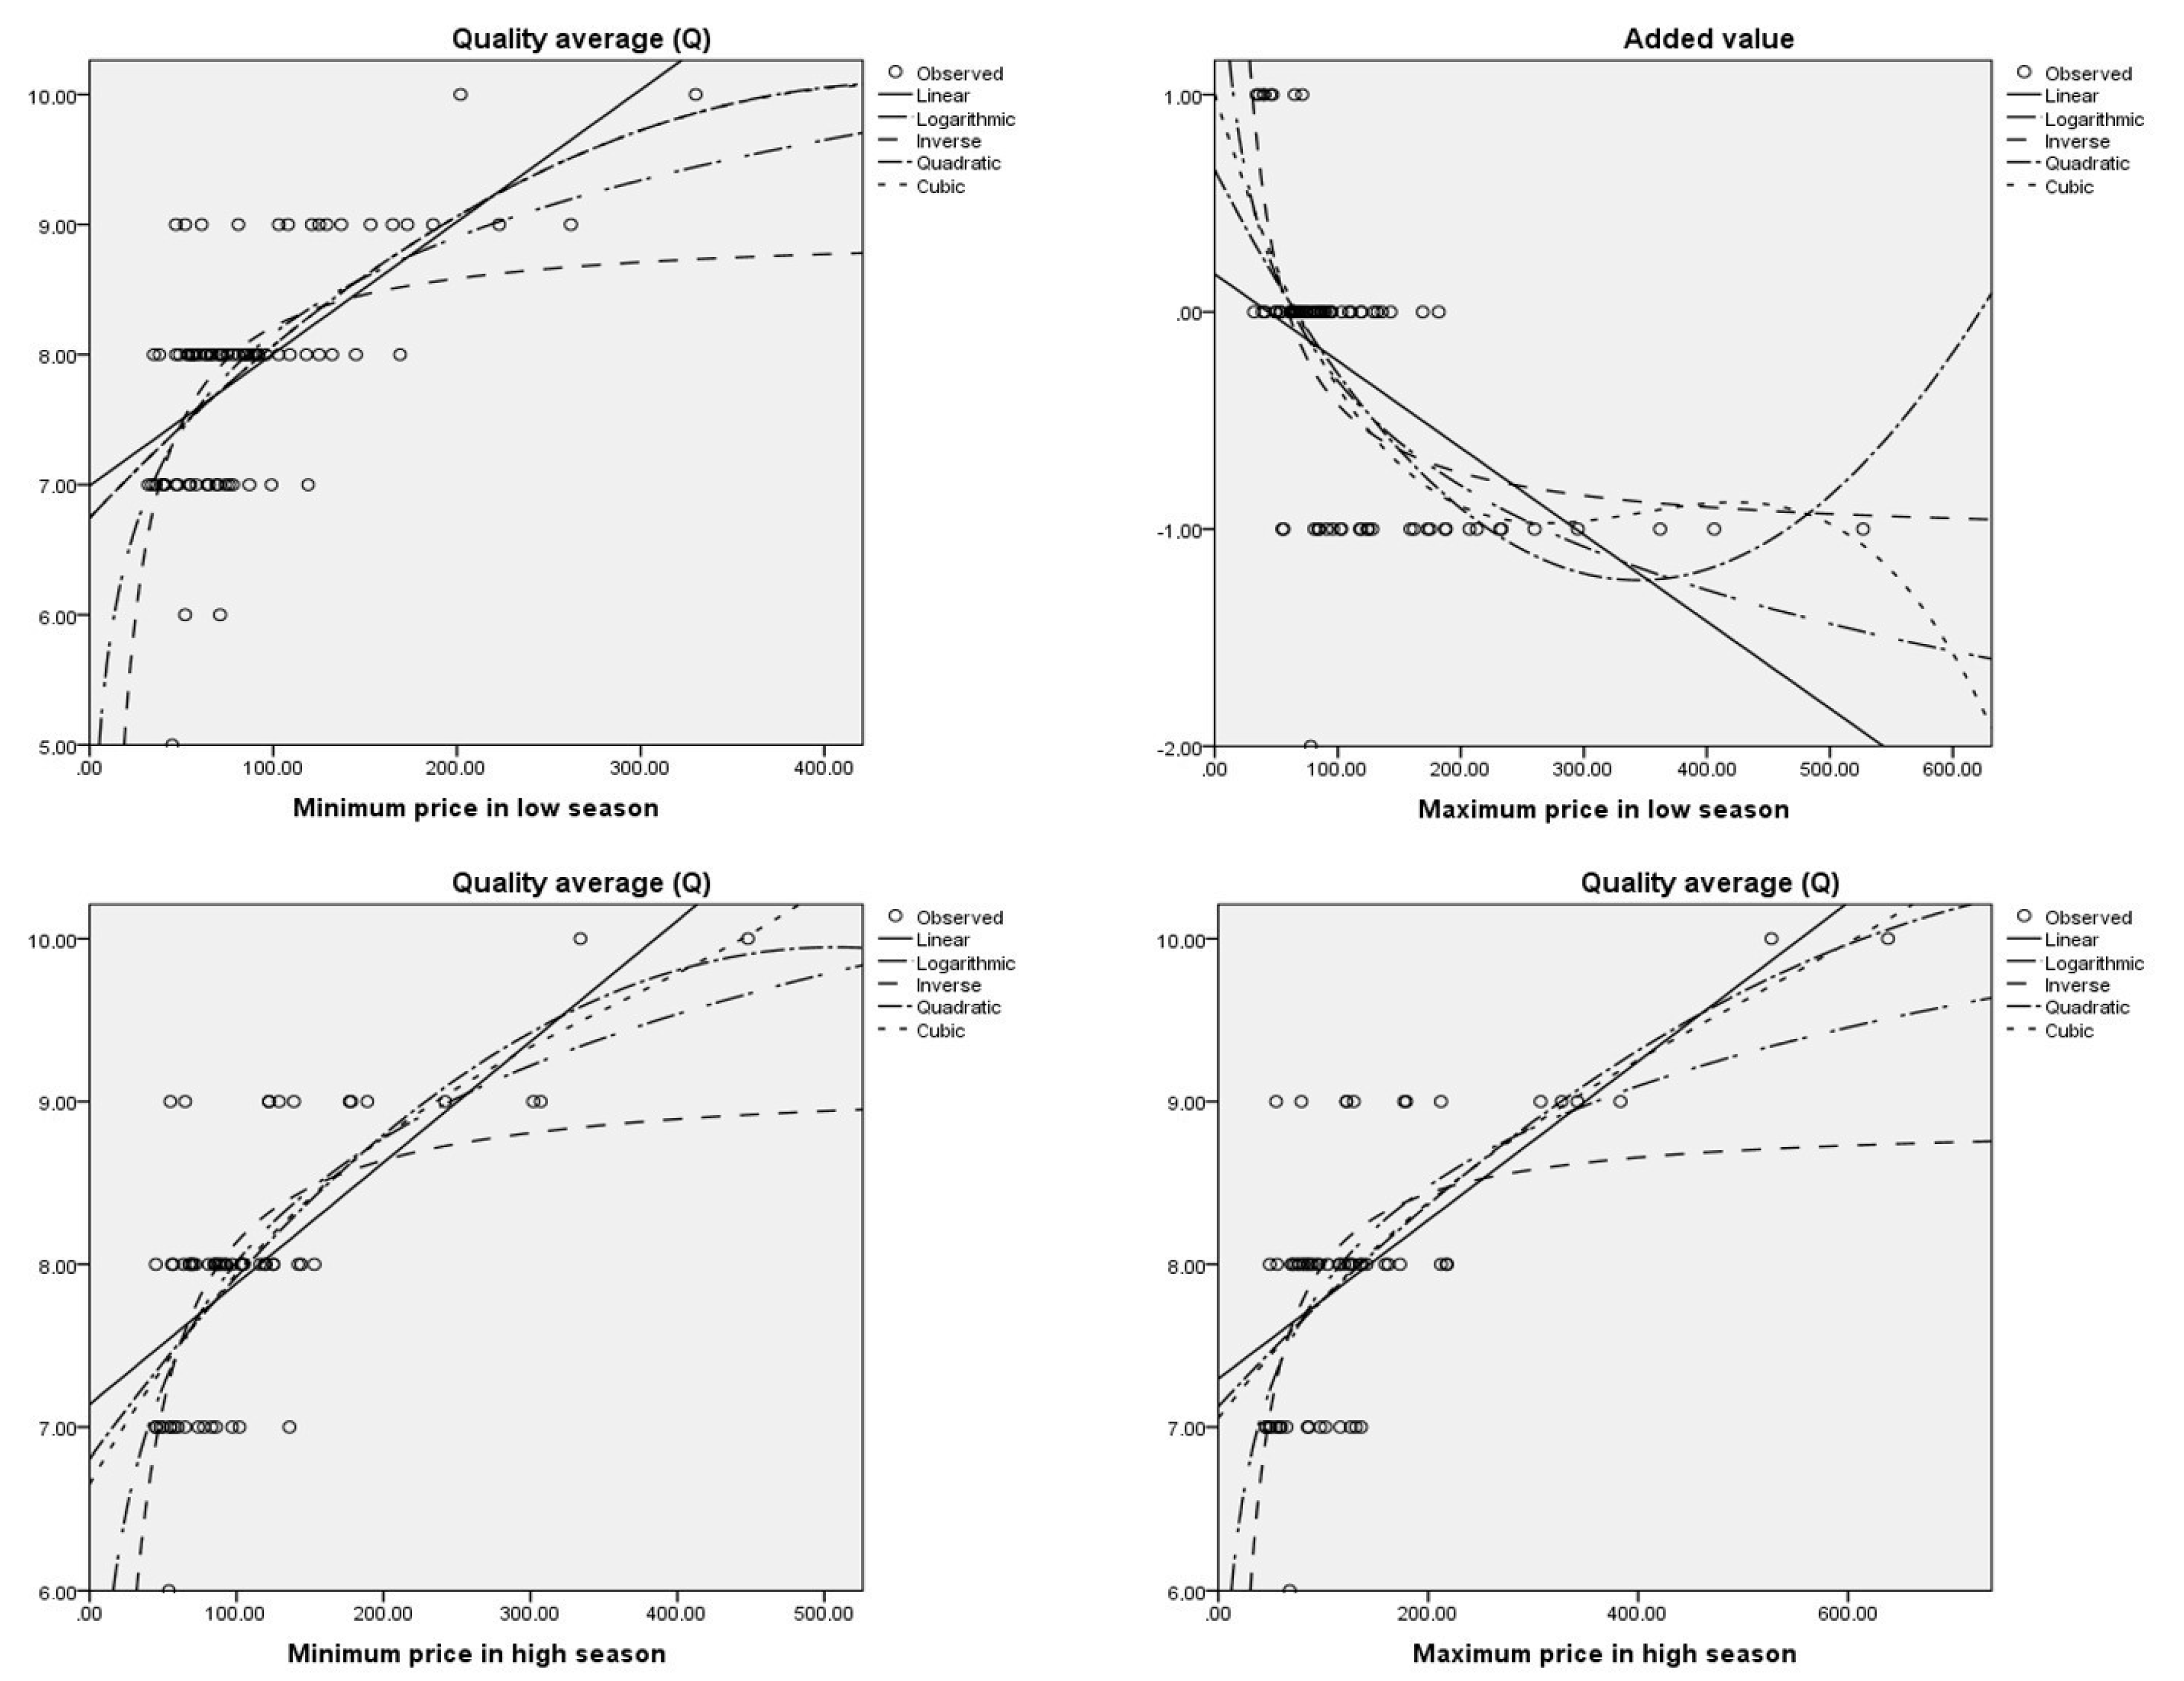
Rodríguez-Díaz et al. 2015). However, price is also directly related to average quality of the service perceived because an increase in quality offered by a lodging normally involves a higher cost, which affects prices. This is the starting point for the study carried out in this article, to try to determine which online reputation variable is most related to price. In the tourism sector, demand tends to fluctuate over different periods of time, which is the reason for obtaining information about maximum and minimum prices in high season and low season.
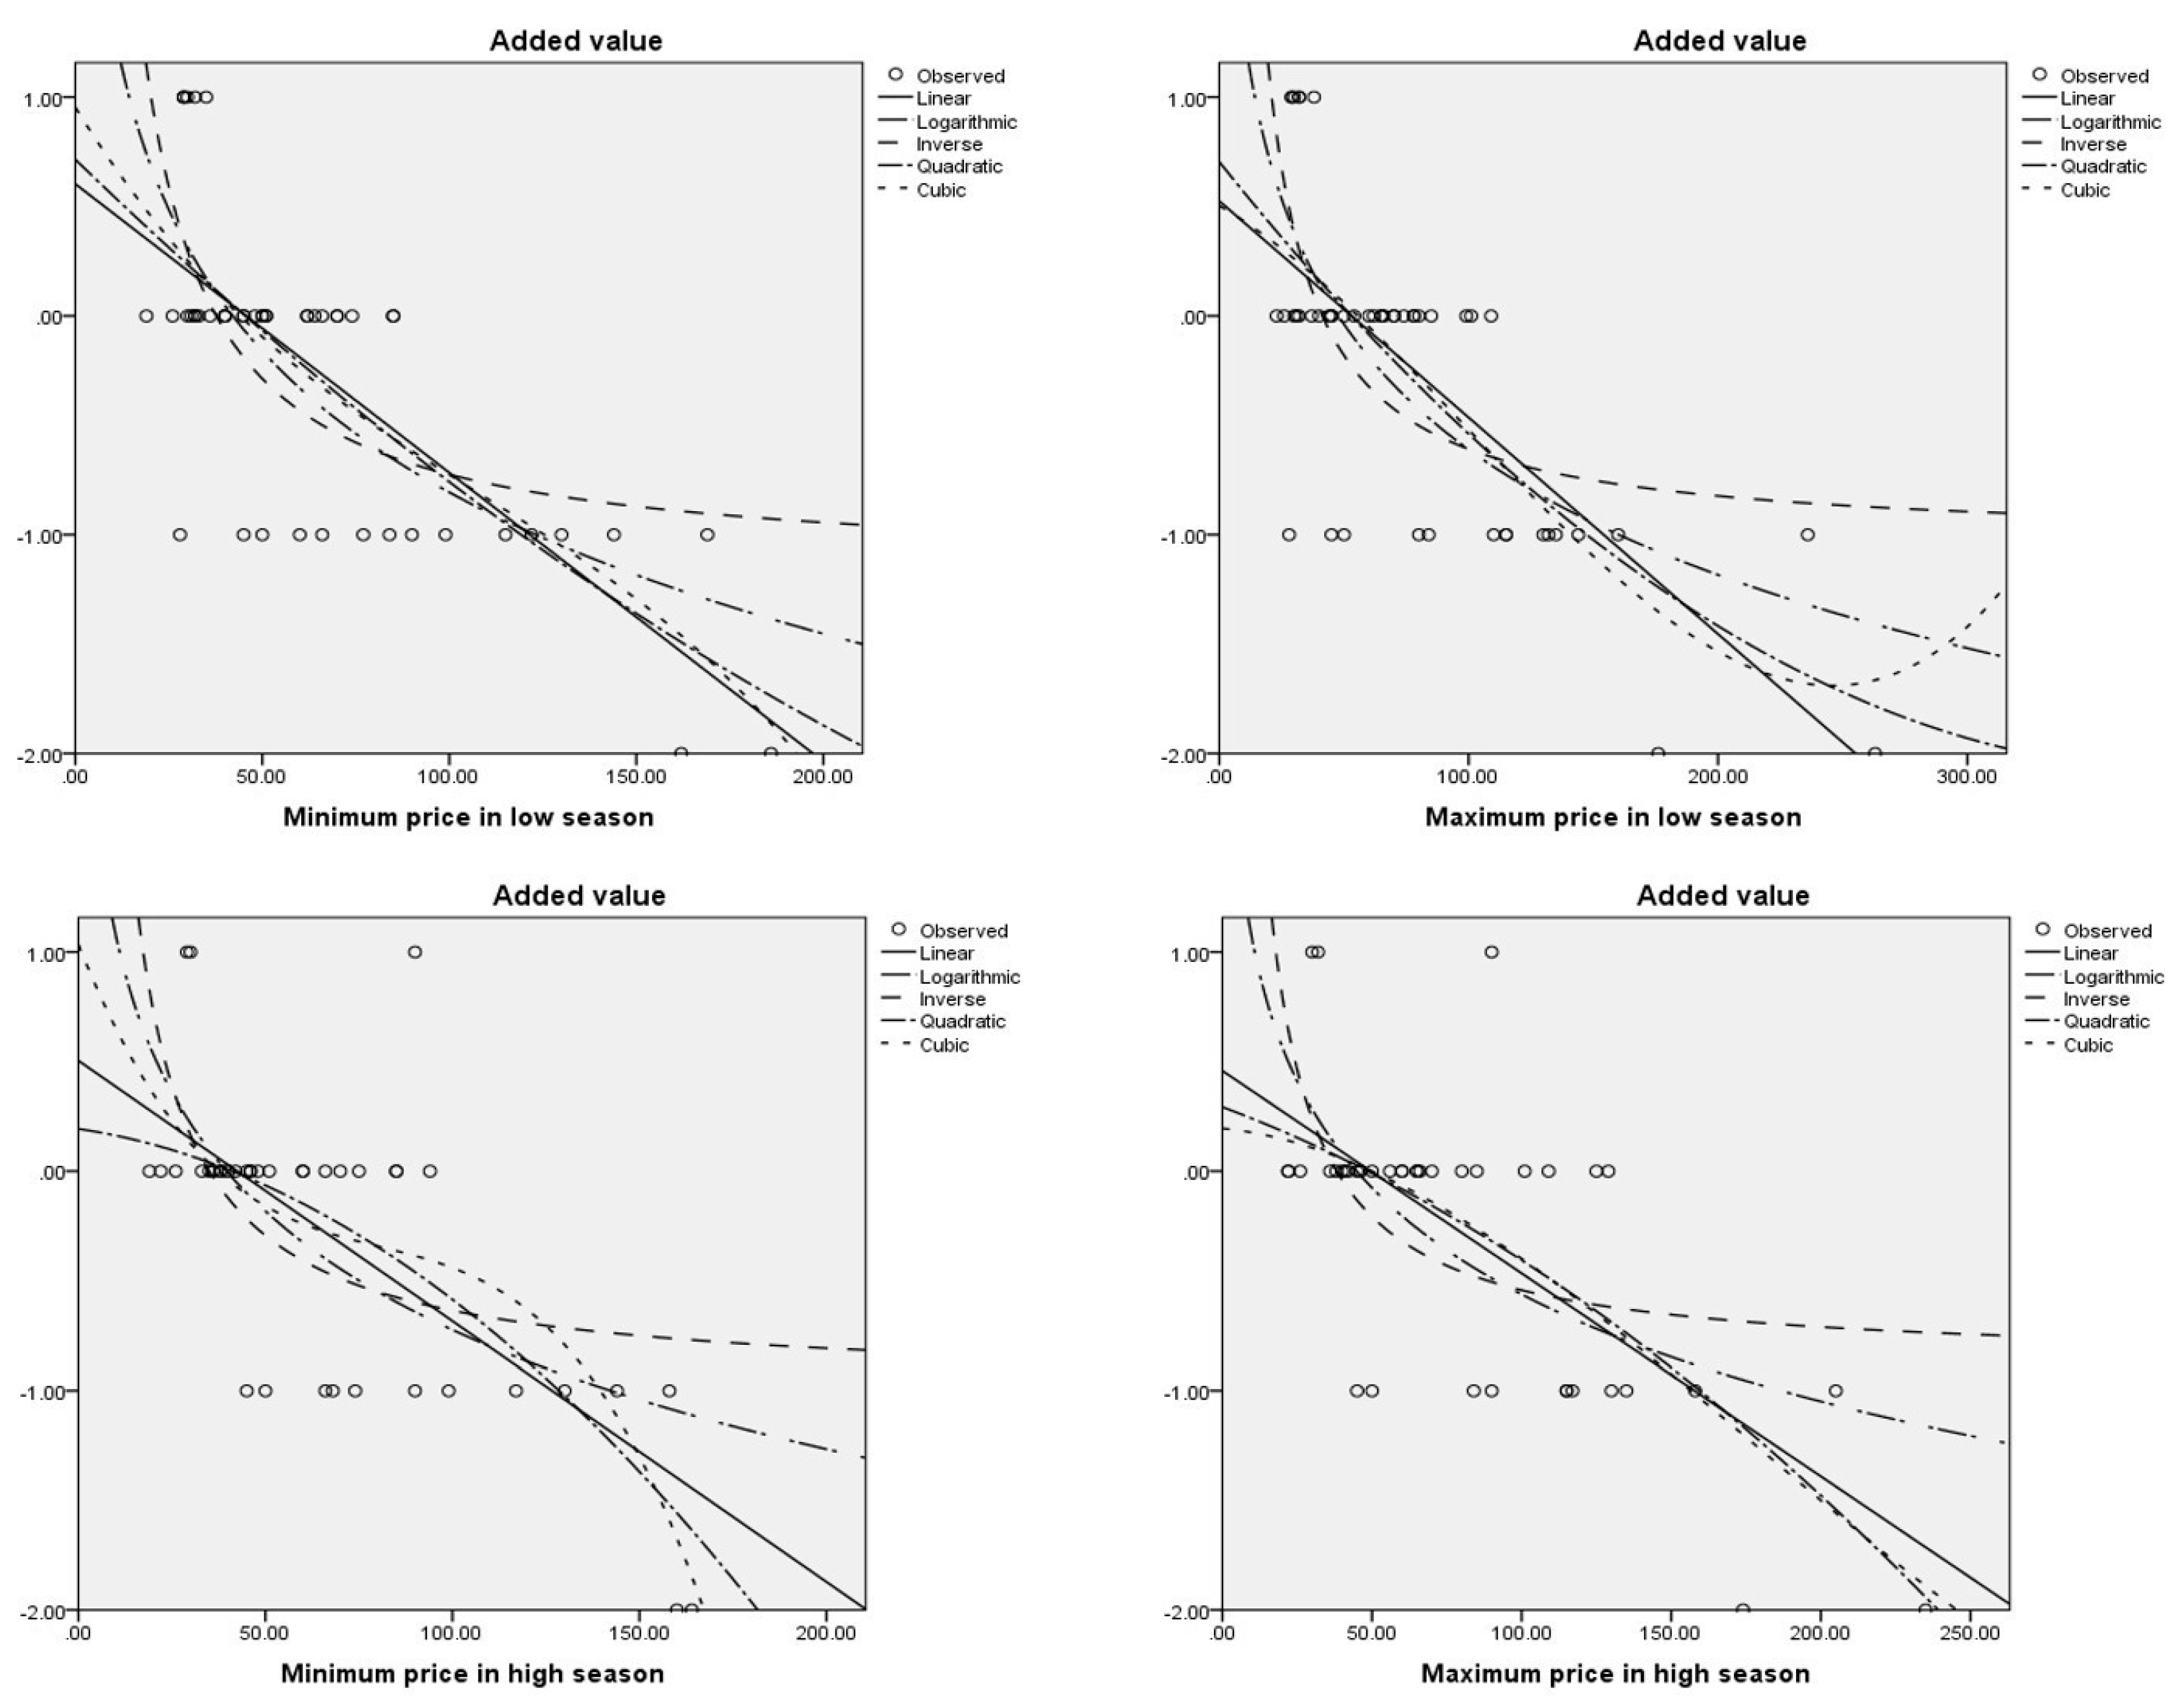
The results demonstrate that added value is the variable with the best fit in the different statistical analyses carried out. The only exception was in the destination of Tenerife, where the average quality of service showed the best fit in three of the four types of prices studied, possibly because the lodgings analyzed in Tenerife may be more focused on similar competitive characteristics. However, this is a hypothesis that should be studied in future research. Another result that must be highlighted is that in the Agadir destination, the added value variable obtained a much higher adjusted R2 than the other variables. The finding that the perceived value variable did not maintain a relationship with price was unexpected. Moreover, all adjustments were close to zero, whereas added value, which is calculated on the basis of perceived value minus perceived service quality, was not only related to price but was also higher than average quality of service. Future research should contrast these results, because perceived value should also be related to lodging prices.
The functions that obtained the best results are cubic and quadratic. However, the results of logarithmic and inverse functions also achieved significant adjustments. The linear function obtained disparate results, whereas in all destinations and Gran Canaria it did not obtain satisfactory results, and in the destinations of Tenerife and Agadir it achieved high fits for the variables of average perceived quality of service and added value. Therefore, it can be concluded that the added value variable is the one most closely related to the different types of prices and tourist destinations, with cubic and quadratic functions being the most suitable. However, logarithmic and inverse functions can also be used to determine the relationship between prices and value added and average quality of service of lodgings in the tourist destinations analyzed.
This study makes a contribution from the competitive perspective of lodging, trying to determine the relationship and possible functions that best represent the relationships between prices and online reputation. In this context, it is of great interest the results obtained insofar as the methodology can be used in order to develop an artificial intelligence that determines the competitive prices at every moment of the accommodations. However, it has limitations that should be taken into account in future research. First, four types of prices were considered, differentiating between the high season and low season. However, prices may have more modifications than those studied, and so future research could analyze this aspect in more detail. Second, three competing tourist destinations in the sun and beach segment were examined. In this context, it would be interesting to carry out investigations in destinations with other characteristics, in order to determine whether there are significant relationships between price and online reputation. Third, the study did not differentiate the lodgings by category, which is also a highly price-related variable. It is possible that differentiating lodgings by category would produce different results where the average perceived service quality achieved the best fit, as occurred in the destination of Tenerife. Finally, value added is a new variable that has shown a strong relationship with price. It would be very interesting if this close relationship could be verified in other destinations and price levels.

Author Contributions

The authors have contributed equally in the research design and development, the data analysis, and the writing of the paper. The authors have read and approved the final manuscript.

Funding

This research received no external funding.

Conflicts of Interest

The authors declare no conflicts of interest.

References

  1. Abrate, Graziano, Giovanni Fraquelli, and Giampaolo Viglia. 2012. Dynamic pricing strategies: Evidence from European hotels. International Journal of Hospitality Management 31: 160–68. [Google Scholar] [CrossRef]
  2. Anderson, Chris. 2012. The Impact of Social Media on Lodging Performance. Available online: http://scholarship.sha.cornell.edu/cgi/viewcontent.cgi?article=1004&context=chrpubs (accessed on 20 August 2017).
  3. Anderson, James C., and James A. Narus. 1998. Business marketing understand what customer value’. Harvard Business Review 76: 53–65. [Google Scholar] [PubMed]
  4. Blal, Inès, and Nicolas S. Graf. 2013. The discount effect of non-normative physical characteristics on the price of lodging properties. International Journal of Hospitality Management 34: 413–22. [Google Scholar] [CrossRef]
  5. Chen, Chiang-Ming, and Kuo-Liang Chang. 2012. Effect of price instability on hotel profitability. Tourism Economics 18: 1351–60. [Google Scholar] [CrossRef]
  6. Chen, Chiang-Ming, Chia-Yu Yeh, and Jin-Li Hu. 2011. Influence of uncertain demand on product variety: evidence from the international tourist hotel industry in Taiwan. Tourism Economics 17: 1275–85. [Google Scholar] [CrossRef]
  7. Chen, Chiang-Ming, Yu-Chen Lin, and Yi-Chun Tsai. 2015. How does advertising affect the price elasticity of lodging demand? Evidence from Taiwan. Tourism Economics 21: 1035–45. [Google Scholar] [CrossRef]
  8. Chun, Rosa. 2005. Corporate reputation: meaning and measurement. International Journal of Management Review 7: 91–109. [Google Scholar] [CrossRef]
  9. Conti, Tito. 2013. Planning for competitive customer value. The TQM Journal 25: 224–43. [Google Scholar] [CrossRef]
  10. Croes, Robertico, and Kelly J. Semrad. 2012. Does discounting work in the lodging industry? Journal of Travel Research 51: 617–31. [Google Scholar] [CrossRef]
  11. Cross, Robert G., Jon A. Higbie, and David Q. Cross. 2009. Revenue management’s renaissance: A rebirth of the art and science of profitable revenue generation. Cornell Hospitality Quarterly 50: 56–81. [Google Scholar] [CrossRef]
  12. Crouch, Geoffrey I. 1992. Effect of income and price on international tourism. Annals of Tourism Research 19: 643–64. [Google Scholar] [CrossRef]
  13. Einwiller, Sabine. 2003. Vertrauen durch reputation im elektronishech handel. Ph.D. thesis, University of St. Gallen, St. Gallen, Switzerland. [Google Scholar]
  14. Enz, Cathy, Linda Canina, and Mark Lomanno. 2009. Competitive pricing decisions in uncertain times. Cornell Hospitality Quarterly 50: 325–41. [Google Scholar] [CrossRef]
  15. Espinet, Josep M., Marc Saez, Germa Coenders, and Modest Fluiva. 2003. Effect on prices of the attributes of holiday hotels: a hedonic price approach. Tourism Economics 9: 165–77. [Google Scholar] [CrossRef]
  16. Gallarza, Martina G., and Irene G. Saura. 2006. Value dimensions, perceived value, satisfaction and loyalty: An investigation of university students’ travel behaviour. Tourism Management 27: 437–52. [Google Scholar] [CrossRef]
  17. Gallarza, Martina G., Irene Gil-Saura, and Holbrook Morris B. 2011. The value of value: Further excursions on the meaning and role of customer value. Journal of Consumer Behaviour 10: 179–91. [Google Scholar] [CrossRef]
  18. Gössling Stefan, Colin M. Hall, and Ann C. Anderson. 2016. The manager’s dilemma: A conceptualization of online review manipulation strategies. Current Issues in Tourism. March 24. Available online: http://www.tandfonline.com/doi/full/10.1080/13683500. 2015.1127337 (accessed on 27 September 2017).
  19. Govers, Robert, Frank M. Go, and Kuldeep Kumar. 2007. Promoting Tourism Destination Image. Journal of Travel Research 46: 15–23. [Google Scholar] [CrossRef]
  20. Grönroos, Christian. 2007. Service Management and Marketing: Customer Management in Service Competition. Hoboken: Willey & Sons. [Google Scholar]
  21. Hernández Estárico, Estefanía, M. Lilibeth Fuentes Medina, and Sandra Morini Marrero. 2012. Una aproximación a la reputación en línea de los establecimientos hoteleros españoles. Papers de Turisme 52: 63–88. [Google Scholar]
  22. Holbrook, Morris B. 1994. The nature of customer value: An axiology of services in the consumption experience. In R.T. Rust and R.L. Oliver, Service Quality: New Directions in Theory and Practice. Thousand Oaks: Sage Publications. [Google Scholar]
  23. Hooley, Graham, Amanda Broderick, and Kristian Möller. 1998. Competitive positioning and the resource-based view of the firm. Journal of Strategic Marketing 6: 97–116. [Google Scholar] [CrossRef]
  24. Hu, Nan, Ling Liu, and Jie Zhang. 2008. Do online reviews affect product sales? The role of reviewer characteristics and temporal effects. Information Technology and Mangement 9: 201–14. [Google Scholar] [CrossRef]
  25. Hung, Wei-Ting, Jui-Kou Shang, and Fei-Ching Wang. 2010. Pricing determinants in the hotel industry: Quantile regression analysis. International Journal of Hospitality Management 29: 378–84. [Google Scholar] [CrossRef]
  26. ICEX. 2011. El sector del turismo en Marruecos. Available online: http://www.think-med.es/wp-content/uploads/group-documents/5/1357554892-ICEX2011TurismoMarruecos.pdf (accessed on 16 September 2017).
  27. Israeli, Aviad A. 2012. Star rating and corporate affiliation: their influence on room price and performance of hotels in Israel. International Journal of Hospitality Managament 21: 405–24. [Google Scholar] [CrossRef]
  28. ISTAC. 2015. Demanda Turística: Turistas y Pasajeros. Available online: http://www.gobiernodecanarias.org/istac/temas_estadisticos/sectorservicios/hosteleriayturismo/demanda/ (accessed on 16 September 2017).
  29. Jena, Sarat K., and Deepti Jog. 2017. Price competition in a tourism supply chain. Tourism Economics 23: 1235–54. [Google Scholar] [CrossRef]
  30. Jeong, Miyoung. 2002. Evaluating value-added lodging web sites from customers’ perspectives. International Journal of Hospitality & Tourism Administration 3: 49–60. [Google Scholar]
  31. Kim, Woo G., and Seo A. Park. 2017. Social media review rating versus traditional customer satisfaction: Which one has more incremental predictive power in explaining hotel performance? International Journal of Contemporary Hospitality Management 29: 784–802. [Google Scholar] [CrossRef]
  32. Kleinsasser, Sabine, and Udo Wagner. 2011. Price ending and tourism consumers’ price perceptions. Journal of Retailing and Consumer Services 18: 58–63. [Google Scholar] [CrossRef]
  33. Lai, Kun, and Xiang Li. 2016. Tourism destination image: conceptual problems and definitional solutions. Journal of Travel Research 55: 1065–80. [Google Scholar] [CrossRef]
  34. Lee, Chew G. 2011. The determinants of hotel room rates: Another visit with Singapore’s data. International Journal of Hospitality Management 30: 756–58. [Google Scholar] [CrossRef]
  35. Lee, Seul K., and SooCheong Jang. 2013. Asymmetry of price competition in the lodging market. Journal of Travel Research 52: 56–67. [Google Scholar] [CrossRef]
  36. Lennox, James. 2012. Impacts of high oil prices on tourism in New Zealand. Tourism Economics 18: 781–800. [Google Scholar] [CrossRef]
  37. Li, Huiying, Qiang Ye, and Rob Law. 2013. Determinants of customer satisfaction in the hotel industry: An application of online review analysis. Asia Pacific Journal of Tourism Research 18: 784–802. [Google Scholar] [CrossRef]
  38. Lockyer, Tim. 2005. The perceived importance of price as one hotel selection dimension. Tourism Management 26: 529–37. [Google Scholar] [CrossRef]
  39. López Fernández, M. Concepción, and Ana M. Serrano Bedia. 2004. Is the hotel classification system a good indicator of hotel quality? An application in Spain. Tourism Management 25: 771–75. [Google Scholar] [CrossRef]
  40. Lovelock, Christopher. 1991. Services Marketing. Prentice Hall: Englewood Cliffs. [Google Scholar]
  41. Martens, Tobias Von, and Andreas Hilbert. 2011. Customer-value-based revenue management. Journal of Revenue and Pricing Management 10: 87–98. [Google Scholar] [CrossRef]
  42. Masiero, Lorenzo, and Juan Nicolau. 2012a. Tourism market segmentation based on Price sensitivity: Finding similar price preferences on tourism activities. Journal of Travel Research 51: 426–35. [Google Scholar] [CrossRef]
  43. Masiero, Lorenzo, and Juan Nicolau. 2012b. Price sensitivity to tourism activities: Looking for determinant factors. Tourism Economics 18: 675–89. [Google Scholar] [CrossRef]
  44. Mattila, Anna, and John O’Neill. 2003. Relationship between hotel room pricing, occupancy and guest satisfaction: a longitudinal case of a midscale hotel. Journal of Tourism and Hospitality Research 27: 328–41. [Google Scholar] [CrossRef]
  45. Mauri, Aurelio G., and Roberta Minazzi. 2013. Web reviews influence on expectations and purchasing intentions of hotel potential customers. International Journal of Hospitality Management 34: 99–107. [Google Scholar] [CrossRef]
  46. Mellinas, Juan P., Soledad M. Martínez María-Dolores, and Juan J. Bernal García. 2015. Booking.com: The unexpected scoring system. Tourism Management 49: 72–74. [Google Scholar] [CrossRef]
  47. Mudambi, Susan M., and David Schuff. 2010. What makes a helpful online review? A study of customer reviews on Amazon.com. MIS Quarterly 34: 185–200. [Google Scholar] [CrossRef]
  48. Nasution, Hanny N., and Felix T. Mavondo. 2008. Customer value in the hotel industry: What managers believe they deliver and what customer experience. International Journal of Hospitality Management 27: 204–13. [Google Scholar] [CrossRef]
  49. Noone, Breffni M., Kelly A. McGuire, and Kristin V. Rohlfs. 2011. Social media meets hotel revenue management: opportunities, issues and unanswered questions. Journal of Revenues & Pricing Management 10: 293–305. [Google Scholar]
  50. Núñez-Serrano, Juan A., Jaime Turrion, and Francisco J. Velázquez. 2014. Are stars a good indicator of hotel quality? Assymetric information and regulatory heterogeneity in Spain. Tourism Management 42: 77–87. [Google Scholar] [CrossRef]
  51. O’Connor, Peter. 2010. Managing a hotel’s image on TripAdvisor. Journal of Hospitality Marketing & Management 19: 754–72. [Google Scholar]
  52. Oh, Haemoon. 1999. Service quality, customer satisfaction, and customer value: A holistic perspective. International Journal of Hospitality Management 18: 67–82. [Google Scholar] [CrossRef]
  53. Oh, Haemoon. 2000. The effect of brand class, brand awareness, and price on customer value and behavioral intentions. Journal of Hospitality & Tourism Research 24: 136–62. [Google Scholar]
  54. Oh, Haemmon, and Kawon Kim. 2017. Customer satisfaction, service quality, and customer value: years 2000–2015. International Journal of Contemporary Hospitality Management 29: 2–29. [Google Scholar] [CrossRef]
  55. Oliver, Richard L. 1997. Satisfaction: A Behavioural Perspective on the Consumer. New York: McGraw-Hill. [Google Scholar]
  56. Pantelidis, Ioannis S. 2010. Electronic meal experience: A content analysis of online restaurant comments. Cornell Hospitality Quarterly 51: 483–91. [Google Scholar] [CrossRef]
  57. Parasuraman, Ananthanarayanan, Valarie Zeithaml, and Leonard L. Berry. 1988. SERVQUAL: A multiple-item scale for measuring customer perceptions of service quality. Journal of Retailing 64: 12–40. [Google Scholar]
  58. Payne, Adrian, and Pennie Frow. 2005. A strategic framework for customer relationship management. Journal of Marketing 69: 167–76. [Google Scholar] [CrossRef]
  59. Payne, Adrian, and Sue Holt. 2001. Diagnosing customer value: integrating the value process and relationship marketing. British Journal of Management 12: 159–82. [Google Scholar] [CrossRef]
  60. Porter, Michael E. 1980. Competitive Strategy. New York: Free Press. [Google Scholar]
  61. Prebensen, Nina K., Eunju Woo, Joseph S. Chen, and Muzaffer Uysal. 2012. Motivation and involvement as antecedents of the perceived value of the destination experience. Journal of Travel Research 52: 253–64. [Google Scholar] [CrossRef]
  62. Qu, Hailin, Peng Xu, and Amy Tan. 2002. A simultaneous equations model of the hotel room supply and demand in Hong Kong. International Journal of Hospitality Management 21: 455–62. [Google Scholar] [CrossRef]
  63. Rodríguez-Díaz, Manuel, and Tomás F. Espino-Rodríguez. 2017a. A methodology for a comparative analysis of the loging tourism destinations based on online customer review. Journal of Destination Marketing and Management 8: 147–60. [Google Scholar] [CrossRef]
  64. Rodríguez-Díaz, Manuel, and Tomás F. Espino-Rodríguez. 2017b. Determining the reliability and validity of online reputation databases for lodging: Booking.com, TripAdvisror, and HolidayCheck. Journal of Vacation Marketing 24: 261–74. [Google Scholar] [CrossRef]
  65. Rodríguez-Díaz, Manuel, Tomás F. Espino Rodríguez, and Rosa Rodríguez Díaz. 2015. A model of market positioning based on value creation and service quality in the lodging industry: An empirical application of online customer reviews. Tourism Economics 21: 1273–94. [Google Scholar] [CrossRef]
  66. Rodríguez-Díaz, Manuel, Rosa Rodríguez-Díaz, Ana C. Rodríguez-Voltes, and Crina I. Rodríguez-Voltes. 2018. A model of market positioning of destination based on online customer reviews of lodgings. Sustainability 10: 78. [Google Scholar] [CrossRef]
  67. Rust, Roland T., and Richard L. Oliver. 1994. Service quality: Insights and managerial implications from the frontier’. In Service Quality: New Directions in Theory and Practice. Thousand Oaks: Sage Publications. [Google Scholar]
  68. Ryu, Kisang, and Heesup Han. 2010. Influence of the quality of food, service, and physical environment on customer satisfaction and behavioural intention in quick-casual restaurants: Moderating role of perceived price. Journal of Hospitality & Tourism Research 34: 310–29. [Google Scholar]
  69. Sancho Esper, Franco, and JorgeÁlvarez Rateike. 2010. Tourism destination image and motivations: The Spanish perspective of Mexico. Journal of Travel & Tourism Marketing 27: 349–60. [Google Scholar]
  70. Sparks, Beverley, Ken Butcher, and Graham Bradley. 2008. Dimensions and correlates of consumer value: An application to the timeshare industry. International Journal of Hospitality Management 27: 98–108. [Google Scholar] [CrossRef]
  71. Sweeney, Julian C., Geoffrey N. Soutar, and Lester W. Johnson. 1999. The role of perceived risk in the quality-value relationship: A study in a retail environment. Journal of Retailing 75: 77–105. [Google Scholar] [CrossRef]
  72. Tanford, Sarah, Baloglu Seyhmus, and Erdem Mehmet. 2012. Travel packaging on the Internet: The impact of pricing information and perceived value on consumer choice. Journal of Travel Research 5: 68–80. [Google Scholar] [CrossRef]
  73. Therkelsen, Anette. 2003. Imagining places: image formation of tourists and its consequences for destination promotion. Scandinavian Journal of Hospitality and Tourism 3: 134–50. [Google Scholar] [CrossRef]
  74. Torres, Edwin N. 2014. Deconstructing service quality and customer satisfaction: Challenges and directions for future research. Journal of Hospitality Marketing & Management 23: 652–77. [Google Scholar]
  75. Varini, Kate, and Pavan Sirsi. 2012. Social Media and Revenue Management: Where Should the Two Meet? Available online: https://www.researchgate.net/publication/264928889_Social_media_and_revenue_management_Where_should_the_two_meet (accessed on 23 August 2017).
  76. Vermeulen, Ivan E., and Daphne Seegers. 2009. Tried and tested: The impact of online hotel reviews on consumer consideration. Tourism Management 30: 123–27. [Google Scholar] [CrossRef]
  77. Xie, Karen L., Zili Zhang, and Ziqiong Zhang. 2014. The business value of online consumer reviews and management response to hotel performance. International Journal of Hospitality Management 43: 1–12. [Google Scholar] [CrossRef]
  78. Yacouel, Nira, and Aliza Fleischer. 2012. The role of cybermediaries in reputation building and price premiums in the online hotel market. Journal of Travel Research 51: 219–26. [Google Scholar] [CrossRef]
  79. Ye, Qiang, Rob Law, and Bin Gu. 2009. The impact of online e user reviews on hotel room sales. Journal of Hospitality Management 28: 180–82. [Google Scholar] [CrossRef]
  80. Ye, Qiang, Huiying Li, Zhisheng Wang, and Rob Law. 2014. The influence of hotel price on perceived service quality and value in e-tourism: An empirical investigation based on online traveller reviews. Journal of Hospitality & Tourism Research 38: 23–39. [Google Scholar]
  81. Zeithaml, Valarie A. 1988. Consumer perceptions of price, quality, and value: A means-end model and synthesis of evidence. Journal of Marketing 52: 2–22. [Google Scholar] [CrossRef]
  82. Zhang, Ziqiong, Qiang Ye, Rob Law, and Yijun Li. 2010. The impact of e-word-of-mouth on the online popularity of restaurant: A comparison of consumer reviews and editor reviews. International Journal of Hospitality Management 29: 694–700. [Google Scholar] [CrossRef]
  83. Zhang, Honglei, Jie Zhang, Lu Shaojing, Shaowen Cheng, and Jinhe Zhang. 2011. Modeling hotel room price with geographically weighted regression. International Journal of Hospitality Management 30: 1036–43. [Google Scholar] [CrossRef]
Figure 1. Functions of the regression analysis with the best fit in all destinations.
Admsci 09 00053 g001
Figure 2. Functions of the regression analysis with the best fit in the Gran Canaria destination.
Admsci 09 00053 g002
Figure 3. Functions of the regression analysis with the best fit in the Tenerife destination.
Admsci 09 00053 g003
Figure 4. Functions of the regression analysis with the best fit in the Agadir destination.
Admsci 09 00053 g004
Table 1. Description of variables.
VariablesDescription
Hotel’s average score (HAS)Reviewer’s overall rating of the lodging
Hotel staff (S)Reviewer’s overall rating of the lodging staff
Service/facilities (F)Reviewer’s overall rating of the lodging service and facilities
Cleanliness (Cl)Reviewer’s overall rating of the cleanliness of the lodging
Comfort (Co)Reviewer’s overall rating of the comfort of the lodging
Location (L)Reviewer’s overall rating of the location of the lodging
Value for money (V)Reviewer’s overall rating of the perceived value of the lodging
Wifi (W)Reviewer’s overall rating of the wifi connection
Minimum price in low seasonMinimum price per night in low season
Maximum price in low seasonMaximum price per night in low season
Minimum price in high seasonMinimum price per night in high season
Maximum price in high seasonMaximum price per night in high season
CategoryStar rating of the lodging
Quality average (Q)Average of quality service variables (S, F, Cl, Co, and L)
Added value (AV)Difference between value (V) and quality average (Q)
Table 2. Model summary and parameter estimates of regression analysis in all destinations, with value as dependent variable.
Independent Variable: Minimum Price in Low Season
EquationModel SummaryParameter Estimates
R SquareFdf1df2Sig.Constantb1b2b3
Linear0.00361.382113760.24047.56230.0007
Logarithmic0.00281.064113760.30297.30750.0749
Inverse0.00220.843813760.35887.6894−3.9329
Quadratic0.00400.761223750.46787.54040.0011−5.6958E−07
Cubic0.00570.727133740.53637.6228−0.00101.074E−05−9.3635E−09
Independent Variable: Maximum Price in Low Season
EquationModel SummaryParameter Estimates
R SquareFdf1df2Sig.Constantb1b2b3
Linear0.00271.028213760.31127.55830.0006
Logarithmic0.00090.340613760.55977.44980.0388
Inverse0.00090.345113760.55727.6561−2.4417
Quadratic0.00701.323723750.26737.6507−0.00115.4956E−06
Cubic0.00801.007733740.38937.7182−0.00301.808E−05−1.9231E−08
Independent Variable: Minimum Price in High Season
EquationModel SummaryParameter Estimates
R SquareFdf1df2Sig.Constantb1b2b3
Linear0.01674.623712710.03247.45490.0012
Logarithmic0.02697.507012710.00656.56050.2290
Inverse0.03409.559212710.00217.8539−20.5299
Quadratic0.02333.222422700.04137.32720.0030−3.7714E−06
Cubic0.02482.288132690.07887.23680.0049−1.245E−059.6741E−09
Independent variable: Maximum price in high season
EquationModel SummaryParameter Estimates
R SquareFdf1df2Sig.Constantb1b2b3
Linear0.01554.274412710.03967.46340.0010
Logarithmic0.01825.051512710.02546.78360.1745
Inverse0.02366.561212710.01097.7946−17.6062
Quadratic0.01572.164122700.11687.43880.0013−6.3579E−07
Cubic0.01581.447332690.22937.41370.0018−2.8195E−062.3948E−09
Table 3. Model summary and parameter estimates of regression analysis in all destinations with quality average (Q) as dependent variable.
Independent Variable: Minimum Price in Low Season
EquationModel SummaryParameter Estimates
R SquareFdf1df2Sig.Constantb1b2b3
Linear0.109046.005113764.5914E−117.47120.0043
Logarithmic0.201995.138913763.4700E−204.88640.7095
Inverse0.195091.093613761.7855E−198.5754−41.0781
Quadratic0.180041.159723756.9132E−177.13570.0102−8.6992E−06
Cubic0.197130.614533741.0171E−176.84740.0178−4.825E−053.2759E−08
Independent Variable: Maximum Price in Low Season
EquationModel SummaryParameter Estimates
R SquareFdf1df2Sig.Constantb1b2b3
Linear0.172378.307013763.5001E−177.29140.0059
Logarithmic0.188587.376613768.1509E−195.13680.6276
Inverse0.169876.932213766.2321E−178.4312−37.1929
Quadratic0.179741.079923757.3805E−177.15590.0086−8.058E−06
Cubic0.187028.686533741.0254E−166.95190.0144−4.609E−055.8106E−08
Independent variable: Minimum price in high season
EquationModel SummaryParameter Estimates
R SquareFdf1df2Sig.Constantb1b2b3
Linear0.158350.974412718.6048E−127.33810.0043
Logarithmic0.254992.726212714.5675E−194.24490.7918
Inverse0.238184.711512719.6659E−188.5873−61.0279
Quadratic0.264048.447222701.0496E−186.76070.0126−1.7056E−05
Cubic0.275134.041932691.1043E−186.49070.0181−4.2984E−052.8905E−08
Independent Variable: Maximum Price in High Season
EquationModel SummaryParameter Estimates
R SquareFdf1df2Sig.Constantb1b2b3
Linear0.188562.983512715.5373E−147.31080.0039
Logarithmic0.241586.313112715.2225E−184.51310.7129
Inverse0.212072.935612719.7899E−168.4935−59.2934
Quadratic0.233041.015422702.7906E−166.94050.0088−9.5376E−06
Cubic0.237327.900232699.6887E−166.76280.0123−2.5049E−051.7011E−08
Table 4. Model summary and parameter estimates of regression analysis in all destinations with added value as dependent variable.
Independent Variable: Minimum Price in Low Season
EquationModel SummaryParameter Estimates
R SquareFdf1df2Sig.Constantb1b2b3
Linear0.146364.465213761.2729E−140.0557−0.0034
Logarithmic0.3071166.700613768.0496E−322.2425−0.5959
Inverse0.2992160.543913766.9652E−31−0.858534.6494
Quadratic0.265267.698523757.9084E−260.3514−0.00867.6674E−06
Cubic0.326460.410133747.2272E−320.7220−0.01845.852E−05−4.2115E−08
Independent Variable: Maximum Price in Low Season
EquationModel SummaryParameter Estimates
R SquareFdf1df2Sig.Constantb1b2b3
Linear0.2542128.196213769.0093E−260.2163−0.0049
Logarithmic0.3186175.870713763.3872E−332.1525−0.5556
Inverse0.2836148.892113764.4354E−29−0.760532.7308
Quadratic0.318787.714323755.6158E−320.4895−0.01031.625E−05
Cubic0.324859.980733741.1132E−310.6164−0.01393.990E−05−3.6140E−08
Independent Variable: Minimum Price in High Season
EquationModel SummaryParameter Estimates
R SquareFdf1df2Sig.Constantb1b2b3
Linear0.139643.981812711.7902E−100.0809−0.0027
Logarithmic0.252491.510912717.2228E−192.1941−0.5365
Inverse0.216274.787712714.6838E−16−0.725439.6025
Quadratic0.303158.730422706.6579E−220.5698−0.00981.444E−05
Cubic0.320842.352432691.8954E−220.8017−0.01453.672E−05−2.4837E−08
Independent Variable: Maximum Price in High Season
EquationModel SummaryParameter Estimates
R SquareFdf1df2Sig.Constantb1b2b3
Linear0.180559.696812712.1597E−130.1112−0.0026
Logarithmic0.2732101.881612711.5209E−202.1651−0.5163
Inverse0.222877.726512711.4664E−16−0.699041.3926
Quadratic0.310360.739722701.6533E−220.5421−0.00831.1099E−05
Cubic0.317141.643432693.8888E−220.6947−0.01132.44232E−05−1.4611E−08
Table 5. Model summary and parameter estimates of regression analysis in Gran Canaria destination with value as dependent variable.
Independent Variable: Minimum Price in Low Season
EquationModel SummaryParameter Estimates
R SquareFdf1df2Sig.Constantb1b2b3
Linear0.00350.869512470.35207.70040.0005
Logarithmic0.00621.551012470.21417.33040.1018
Inverse0.00611.539412470.21587.8588−5.8409
Quadratic0.00540.669222460.51307.65310.0014−1.1079E−06
Cubic0.00540.449332450.71797.63980.0018−3.0232E−061.5857E−09
Independent Variable: Maximum Price in Low Season
EquationModel SummaryParameter Estimates
R SquareFdf1df2Sig.Constantb1b2b3
Linear0.00270.675012470.41217.68360.0007
Logarithmic0.00350.890712470.34627.43460.0738
Inverse0.00491.216612470.27107.8330−4.9993
Quadratic0.00270.338022460.71347.68930.00065.2965E−07
Cubic0.00420.350432450.78887.57710.0044−3.1134E−056.4340E−08
Independent variable: Minimum price in high season
EquationModel SummaryParameter Estimates
R SquareFdf1df2Sig.Constantb1b2b3
Linear0.00460.788111680.37597.62810.0005
Logarithmic0.01171.997511680.15947.04560.1412
Inverse0.01913.285811680.07167.9040−18.1871
Quadratic0.00940.795921670.45287.52420.0019−2.5973E−06
Cubic0.01791.011631660.38907.31070.0059−2.0666E−051.9315E−08
Independent Variable: Maximum Price in High Season
EquationModel SummaryParameter Estimates
R SquareFdf1df2Sig.Constantb1b2b3
Linear0.00390.670811680.41397.63190.0004
Logarithmic0.00851.450411680.23017.17100.1113
Inverse0.01552.647811680.10557.8650−16.0088
Quadratic0.00560.476521670.62177.57300.0012−1.4562E−06
Cubic0.01140.639731660.59047.39140.0045−1.5730E−051.5117E−08
Table 6. Model summary and parameter estimates of regression analysis in Gran Canaria destination with Q as dependent variable.
Independent Variable: Minimum Price in Low Season
EquationModel SummaryParameter Estimates
R SquareFdf1df2Sig.Constantb1b2b3
Linear0.073719.672612471.3844E−057.65390.0031
Logarithmic0.192158.752012474.0854E−135.19160.6657
Inverse0.208565.081412473.1271E−148.6815−39.9275
Quadratic0.147021.212722463.1687E−097.30810.0094−8.1015E−06
Cubic0.202420.729732455.2888E−126.83760.0223−7.5886E−055.6123E−08
Independent Variable: Maximum Price in Low Season
EquationModel SummaryParameter Estimates
R SquareFdf1df2Sig.Constantb1b2b3
Linear0.136439.036712471.8079E−097.40100.0063
Logarithmic0.178953.844812473.1178E−125.33180.6140
Inverse0.181354.699112472.1831E−128.5365−35.8205
Quadratic0.171825.524622468.4552E−117.07780.0138−2.9948E−05
Cubic0.177817.667432452.0498E−106.81610.0228−0.00011.5005E−07
Independent Variable: Minimum Price in High Season
EquationModel SummaryParameter Estimates
R SquareFdf1df2Sig.Constantb1b2b3
Linear0.088816.377611687.9019E−057.53240.0028
Logarithmic0.194740.632111681.7055E−094.65400.7031
Inverse0.245654.719611686.3123E−128.7971−79.5819
Quadratic0.206221.693721674.2136E−096.90270.0113−1.5750E−05
Cubic0.250718.516631662.0697E−106.30570.0226−6.6269E−055.4002E−08
Independent Variable: Maximum Price in High Season
EquationModel SummaryParameter Estimates
R SquareFdf1df2Sig.Constantb1b2b3
Linear0.115021.851911686.0173E−067.48290.0029
Logarithmic0.190739.600711682.6116E−094.86750.6429
Inverse0.217446.671311681.4729E−108.6620−73.2698
Quadratic0.193320.017321671.6115E−086.99390.0092−1.2090E−05
Cubic0.209714.687431661.5786E−086.61910.0161−4.1543E−053.1191E−08
Table 7. Model summary and parameter estimates of regression analysis in Gran Canaria destination with added value as dependent variable.
Independent variable: Minimum Price in Low Season
EquationModel SummaryParameter Estimates
R SquareFdf1df2Sig.Constantb1b2b3
Linear0.098927.136612473.9981E−070.0074−0.0023
Logarithmic0.259786.651912477.3178E−181.8825−0.5068
Inverse0.280796.412012472.0021E−19−0.773030.3368
Quadratic0.200830.913722461.0548E−120.2743−0.00726.253E−06
Cubic0.283932.384832451.1467E−170.6518−0.01756.0639E−05−4.5030E−08
Independent Variable: Maximum Price in Low Season
EquationModel SummaryParameter Estimates
R SquareFdf1df2Sig.Constantb1b2b3
Linear0.205363.844712475.1439E−140.2199−0.0050
Logarithmic0.261887.605912475.1231E−181.8535−0.4863
Inverse0.254484.302012471.7691E−17−0.673627.7887
Quadratic0.268245.090122462.0731E−170.5020−0.01162.6140E−05
Cubic0.269230.089032451.3491E−160.5716−0.01404.5770E−05−3.9887E−08
Independent Variable: Minimum Price in High Season
EquationModel SummaryParameter Estimates
R SquareFdf1df2Sig.Constantb1b2b3
Linear0.108020.345411681.2095E−050.0692−0.0020
Logarithmic0.242353.739911689.2012E−122.1969−0.5191
Inverse0.280565.511911681.1125E−13−0.832456.2817
Quadratic0.303736.430321677.4170E−140.6073−0.00931.346E−05
Cubic0.341028.638231665.6257E−150.9689−0.01614.4061E−05−3.2712E−08
Independent Variable: Maximum Price in High Season
EquationModel SummaryParameter Estimates
R SquareFdf1df2Sig.Constantb1b2b3
Linear0.148429.277911682.1315E−070.1133−0.0022
Logarithmic0.251156.340211683.3973E−122.1023−0.4882
Inverse0.255057.521411682.1694E−12−0.744752.5227
Quadratic0.304036.478921677.1706E−140.5696−0.00811.1283E−05
Cubic0.315225.476831661.3093E−130.7749−0.01182.7414E−05−1.7083E−08
Table 8. Model summary and parameter estimates of regression analysis in Tenerife destination with value as dependent variable.
Independent Variable: Minimum Price in Low Season
EquationModel SummaryParameter Estimates
R SquareFdf1df2Sig.Constantb1b2b3
Linear0.05514.55641780.03597.31910.0032
Logarithmic0.03903.17231780.07876.32400.2953
Inverse0.01781.42071780.23687.8319−15.4348
Quadratic0.05522.25152770.11217.30190.0036−1.1524E−06
Cubic0.09442.64233760.05538.1653−0.02080.0001−3.7422E−07
Independent Variable: Maximum Price in Low Season
EquationModel SummaryParameter Estimates
R SquareFdf1df2Sig.Constantb1b2b3
Linear0.04643.80361780.05477.39600.0018
Logarithmic0.02411.93081780.16866.72100.1954
Inverse0.00650.51571780.47487.7236−9.1209
Quadratic0.04801.94202770.15037.46130.00092.1727E−06
Cubic0.08302.29493760.08457.9809−0.01046.2391E−05−8.0814E−08
Independent Variable: Minimum Price in High Season
EquationModel SummaryParameter Estimates
R SquareFdf1df2Sig.Constantb1b2b3
Linear0.04983.14801600.08107.47480.0021
Logarithmic0.03932.46081600.12196.45750.2743
Inverse0.02041.25011600.26797.9419−19.9153
Quadratic0.05041.56572590.21747.42530.0028−1.8146E−06
Cubic0.06511.34803580.26777.8466−0.00635.0819E−05−7.9687E−08
Independent Variable: Maximum Price in High Season
EquationModel SummaryParameter Estimates
R SquareFdf1df2Sig.Constantb1b2b3
Linear0.039172.44601600.12307.53380.0012
Logarithmic0.01941.18881600.27996.92250.1666
Inverse0.00430.26501600.60857.8026−9.0007
Quadratic0.04221.30292590.27947.62510.00011.9679E−06
Cubic0.06911.43633580.24148.0664−0.00773.6305E−05−3.7547E−08
Table 9. Model summary and parameter estimates of regression analysis in Tenerife destination with Q as dependent variable.
Independent Variable: Minimum Price in Low Season
EquationModel SummaryParameter Estimates
R SquareFdf1df2Sig.Constantb1b2b3
Linear0.371346.06781781.9945E−096.99220.0101
Logarithmic0.363544.54521783.2608E−093.21141.0746
Inverse0.291932.16771782.2965E−078.9580−74.403
Quadratic0.379723.57162771.0324E−086.74450.0149−1.6596E−05
Cubic0.379715.51033765.7908E−086.74620.0148−1.6224E−05−7.5378E−10
Independent Variable: Maximum Price in Low Season
EquationModel SummaryParameter Estimates
R SquareFdf1df2Sig.Constantb1b2b3
Linear0.373446.48411781.7456E−097.16800.0063
Logarithmic0.363344.50941783.299E−093.77480.9045
Inverse0.275029.59491785.9330E−078.7583−70.4231
Quadratic0.382523.85682778.6535E−096.97680.0091−6.3599E−06
Cubic0.382715.70753764.8399E−086.93720.0099−1.0954E−056.1659E−09
Independent Variable: Minimum Price in High Season
EquationModel SummaryParameter Estimates
R SquareFdf1df2Sig.Constantb1b2b3
Linear0.477654.86511605.0470E−107.13960.0074
Logarithmic0.487257.01431602.8671E−102.95171.0990
Inverse0.402240.38171603.1175E−089.1423−100.719
Quadratic0.496629.11292591.5993E−096.80760.0123−1.2185E−05
Cubic0.498219.19753589.1091E−096.65270.0157−3.1538E−052.9300E−08
Independent Variable: Maximum Price in High Season
EquationModel SummaryParameter Estimates
R SquareFdf1df2Sig.Constantb1b2b3
Linear0.439046.96041604.4576E−097.29730.0048
Logarithmic0.425044.35331609.4877E−093.77390.8880
Inverse0.323128.65001601.4350E−068.8753−87.8931
Quadratic0.447423.89032592.5095E−087.12660.0069−3.6785E−06
Cubic0.448015.69113581.3791E−077.05540.0082−9.2231E−066.0629E−09
Table 10. Model summary and parameter estimates of regression analysis in Tenerife destination with added value as dependent variable.
Independent Variable: Minimum Price in Low Season
EquationModel SummaryParameter Estimates
R SquareFdf1df2Sig.Constantb1b2b3
Linear0.257126.99461781.5889E−060.2787−0.0063
Logarithmic0.342640.64941781.1818E−083.1244−0.7820
Inverse0.363244.50231783.3066E−09−1.172162.2094
Quadratic0.334919.38862771.5149E−070.8426−0.01713.7783E−05
Cubic0.357414.09093762.1585E−071.4275−0.03370.0001−2.5349E−07
Independent Variable: Maximum Price in Low Season
EquationModel SummaryParameter Estimates
R SquareFdf1df2Sig.Constantb1b2b3
Linear0.264127.99401781.0847E−060.1739−0.0039
Logarithmic0.381048.01121781.0748E−092.8790−0.6943
Inverse0.392450.38261785.1228E−10−1.056063.0542
Quadratic0.367022.33102772.2460E−080.6541−0.01091.5975E−05
Cubic0.386915.99183763.7423E−081.0041−0.01865.6537E−05−5.4435E−08
Independent Variable: Minimum Price in High Season
EquationModel SummaryParameter Estimates
R SquareFdf1df2Sig.Constantb1b2b3
Linear0.295625.18731604.9383E−060.2344−0.0045
Logarithmic0.415442.63681601.5771E−083.3415−0.7922
Inverse0.453149.71931602.0458E−09−1.247483.4526
Quadratic0.417821.17232591.1722E−070.8907−0.01432.4089E−05
Cubic0.437815.05543582.3208E−071.3262−0.02387.8503E−05−8.2382E−08
Independent Variable: Maximum Price in High Season
EquationModel SummaryParameter Estimates
R SquareFdf1df2Sig.Constantb1b2b3
Linear0.279423.27251601.0019E−050.1433−0.0030
Logarithmic0.414642.49711601.6444E−082.9593−0.6847
Inverse0.441147.35891603.9782E−09−1.101980.1646
Quadratic0.406520.20552592.0691E−070.6607−0.00921.1153E−05
Cubic0.431414.67233583.1903E−071.0391−0.01604.0592E−05−3.2191E−08
Table 11. Model summary and parameter estimates of regression analysis in Agadir destination with value as dependent variable.
Independent Variable: Minimum Price in Low Season
EquationModel SummaryParameter Estimates
R SquareFdf1df2Sig.Constantb1b2b3
Linear0.04602.26721470.13887.2969−0.0049
Logarithmic0.03721.81791470.18408.2652−0.3211
Inverse0.01730.83131470.36656.736311.6060
Quadratic0.04621.11582460.33637.3460−0.00647.9187E−06
Cubic0.05740.91413450.44176.70450.0231−0.00031.2748E−06
Independent Variable: Maximum Price in Low Season
EquationModel SummaryParameter Estimates
R SquareFdf1df2Sig.Constantb1b2b3
Linear0.03241.57861470.21517.2255−0.0031
Logarithmic0.02781.34791470.25158.0222−0.2504
Inverse0.01310.62591470.43286.792310.1275
Quadratic0.03760.89882460.41407.3865−0.00701.6384E−05
Cubic0.07681.24803450.30356.50850.0265−0.00038.1339E−07
Independent Variable: Minimum Price in High Season
EquationModel SummaryParameter Estimates
R SquareFdf1df2Sig.Constantb1b2b3
Linear0.05562.29711390.13767.3517−0.0056
Logarithmic0.04471.82591390.18438.4196−0.3562
Inverse0.01610.64111390.42816.753911.0641
Quadratic0.05811.17392380.32017.5266−0.01082.9510E−05
Cubic0.09581.30673370.28676.09710.0577−0.00083,3711E−06
Independent Variable: Maximum Price in High Season
EquationModel SummaryParameter Estimates
R SquareFdf1df2Sig.Constantb1b2b3
Linear0.03201.29111390.26277.2459−0.0033
Logarithmic0.02801.12491390.29538.0673−0.2586
Inverse0.01010.39921390.53116.81898.9723
Quadratic0.03860.76332380.47317.4564−0.00852.3749E−05
Cubic0.05680.74403370.53266.76250.0182−0.00027.3379E−07
Table 12. Model summary and parameter estimates of regression analysis in Agadir destination with Q as dependent variable.
Independent Variable: Minimum Price in Low Season
EquationModel SummaryParameter Estimates
R SquareFdf1df2Sig.Constantb1b2b3
Linear0.11966.39051470.01486.71140.0076
Logarithmic0.13727.47811470.00874.82830.5935
Inverse0.14447.93251470.00707.8788−32.1967
Quadratic0.12613.31962460.04506.47220.0148−3.85953E−05
Cubic0.15112.67073450.05875.54840.0573−0.0005681311.83582E−06
Independent Variable: Maximum Price in Low Season
EquationModel SummaryParameter Estimates
R SquareFdf1df2Sig.Constantb1b2b3
Linear0.12126.48501470.01426.74680.0058
Logarithmic0.13327.22291470.00995.01050.5269
Inverse0.13767.50421470.00867.7873−31.5490
Quadratic0.12153.18222460.05076.70970.0067−3.7774E−06
Cubic0.19993.74913450.01735.51460.0525−0.00041.1072E−06
Independent Variable: Minimum Price in High Season
EquationModel SummaryParameter Estimates
R SquareFdf1df2Sig.Constantb1b2b3
Linear0.06362.65161390.11146.87120.0059
Logarithmic0.06012.49541390.12225.61610.4076
Inverse0.06512.71861390.10727.7073−21.9129
Quadratic0.07121.45682380.24567.1674−0.00294.9962E−05
Cubic0.10261.41123370.25485.87730.0589−0.00073.0422E−06
Independent Variable: Maximum Price in High Season
EquationModel SummaryParameter Estimates
R SquareFdf1df2Sig.Constantb1b2b3
Linear0.08103.44141390.07116.84400.0052
Logarithmic0.06372.65481390.11125.64420.3847
Inverse0.05772.39091390.13017.6374−21.1370
Quadratic0.10122.14132380.13147.2081−0.00384.1054E−05
Cubic0.11471.59813370.20636.62110.0188−0.00016.2069E−07
Table 13. Model summary and parameter estimates of regression analysis in Agadir destination with added value as dependent variable.
Independent Variable: Minimum Price in Low Season
EquationModel SummaryParameter Estimates
R SquareFdf1df2Sig.Constantb1b2b3
Linear0.537254.56991472.1206E−090.6031−0.0131
Logarithmic0.512949.50621477.2063E−093.4867−0.9322
Inverse0.405031.99541478.8775E−07−1.163043.8132
Quadratic0.539326.93452461.8051E−080.7149−0.01651.8054E−05
Cubic0.541917.74583459.5782E−080.9537−0.02750.0001−4.7446E−07
Independent Variable: Maximum Price in Low Season
EquationModel SummaryParameter Estimates
R SquareFdf1df2Sig.Constantb1b2b3
Linear0.520651.05161474.9270E−090.5250−0.0098
Logarithmic0.496346.31731471.6117E−083.1954−0.8265
Inverse0.384929.41801471.9809E−06−1.037342.8646
Quadratic0.531026.04592462.7282E−080.7044−0.01421.8262E−05
Cubic0.534417.21703451.3727E−070.5035−0.0065−5.5315E−051.8612E−07
Independent Variable: Minimum Price in High Season
EquationModel SummaryParameter Estimates
R SquareFdf1df2Sig.Constantb1b2b3
Linear0.472434.93181396.8996E−070.5043−0.0118
Logarithmic0.407426.81261397.1292E−062.8760−0.7818
Inverse0.293416.19751390.0002−0.979134.2648
Quadratic0.487818.10052383.0067E−060.1927−0.0025−5.2558E−05
Cubic0.512512.96843376.1163E−061.0345−0.04290.0004−1.9850E−06
Independent Variable: Maximum Price in High Season
EquationModel SummaryParameter Estimates
R SquareFdf1df2Sig.Constantb1b2b3
Linear0.467634.25711398.2890E−070.4580−0.0092
Logarithmic0.390324.96591391.2659E−052.6687−0.7016
Inverse0.268314.30171390.0005−0.878933.5680
Quadratic0.475317.21242384.7645E−060.2925−0.0051−1.8664E−05
Cubic0.476011.20363372.2535E−050.1948−0.0013−5.6289E−051.0326E−07

