1. Introduction
In order to foster this alignment, in public sectors, New Public Management (NPM) has guided many reforms in the last 30 years. One of the key ideas of NPM is that public sector organizations need to introduce performance management based on targets, monitoring, and incentives. In other words, in the public sector, a performance improvement requires a transition from a “bureaucratic culture” to a results-based one that emphasizes outcomes rather than inputs or processes. It is well known that a firm’s performance is modified by the use of economic motivation (
Bannò and Sgobbi 2010).
Focusing on incentives and, in particular, on monetary incentives, the balance reached by operating on their architecture has been enriched with all those conceptual tools that research into Human Resource Management (HRM) has developed over time. The ability to identify the consequences of the incentives scheme design to be adopted is highly dependent on how services are defined and measured (
Zehavit 2019).
This paper studies the actual and potential impact of economic incentives on performances, both at the individual and organizational level (
Barnard and Simon 1947) in Public Administration (PA). In particular, this study investigates the relationship between the introduction of a meritocratic-based system of monetary incentives to evaluate individual, group and overall performance. The main research questions are designed to test whether the introduction of a competitive system, structured as a “closed-rank tournament”, encourages employees (non-managers) to improve their performance and whether it induces virtuous behavior in employees.
The results show that a well-suited design scheme of economic incentives has positive effects on individual performance, whereas too high a pay-difference within the working group undermines solidarity and collaboration.
Section 2 of this paper presents a literary review defining the main research questions,
Section 3 presents the empirical data used,
Section 4 provides the methodology,
Section 5 the results and discussion. Finally,
Section 6 provides the conclusions of the study.
2. Literature and Main Research Questions
In the literature, many studies have been presented in order to evaluate the performance of employees and organizations and the role of incentives (
Andersen 2007). Agency theory is one of the main ideas developed in this field. According to this thory, a dilemma exists when employees are motivated to act in their own best interests, which are contrary to those of the organization, and this is an example of a moral hazard (
Eisenhardt 1989). It is worth noting that the effectiveness and efficiency of an organization are associated with commonality of purposes, and alignment between the objectives and the values shared between employees and the organization.
Focusing on monetary incentives, one of the most important theories is PRP, which unlike a mechanism that pays a bonus based on seniority, is a tool that is capable of boosting work motivation, and increasing the performance of employees (
Chang 2011;
Lah and Perry 2008;
Salzman 1999). It is worth remembering that PRP is not an invention of NPM, but is connected to principles of Weberian bureaucracy, see (
Dahlström and Lapuente 2017) for further details.
Other theories help us to understand the causal link between incentives and motivation (
Berumen et al. 2016). The first of these is expectancy theory, which is the analytical framework most frequently called on to understand how a pay system could prove to be motivating. This approach, in terms of rational choice, makes it possible to demonstrate how pay that is linked to individual performance can motivate employees to provide a high level of effort. It is worth remembering that there are three conditions that must be fulfilled. The individual must believe that s/he is able to perform at the desired level of performance; her/his performance will lead to the outcomes, and the value of the reward is positive (
Van Eerde and Thierry 1996).
Second, reinforcement theory, which is based on the principle and techniques of organizational behavior modification, focuses on the relationship between the target behavior (e.g., performance) and the motivational tool (e.g., pay for performance) (
Luthans 1973;
Skinner 1984;
Stajkovic and Luthans 1997). Third, equity theory, according to which, each individual compares his/her contribution made to the organization with the advantages gained from their job (
Adams 1963). Individuals also compare their advantage/contribution ratio with those of other colleagues taken as points of reference. The concept of distributive justice is linked to that of procedural justice. According to procedural justice, individuals assess the procedures that the organization introduces to distribute rewards. Performance appraisal and the promotion scheme represent central determinants of the feeling of procedural justice (
Greenberg 1990). The most critical aspects of a theory aiming to tie the contribution of individuals to organizational performance can be traced to the measurability of individual effort when the result is closely linked to the contribution of others and, consequently, to the relationship between the individual and the organization (
Booth and Frank 1999).
In the context of PA, an economic incentive takes on the characteristics of a paradox, faced with its re-statement by policy makers (especially in the USA) for over thirty years, the evidence offered by the literature is negative or at least ambiguous (
Perry et al. 2009). In particular,
Belle and Cantarelli (
2015) studying the effects of financial incentives on the effort made by public managers and how different types of work motivation (i.e., intrinsic, extrinsic, and public service motivation) can moderate these effects, and using experiments, found that monetary rewards had no significant effect on the managers’ effort. Furthermore, the relationship between financial incentives and managers’ effort, which was insignificant overall, was negatively moderated by the intrinsic motivation of the participants, positively moderated by extrinsic motivation, and unaffected by public service motivation. Only in some contexts, such as the medical one for example, is their effect largely positive (
see Heneman et al. 1988;
Krasnik et al. 1990;
Davidson et al. 1992;
Hutchison et al. 1996;
Dowling and Richardson 1997;
Kouides et al. 1998;
Shaw et al. 2002;
Andersen 2009). Partially positive results were also obtained in the education and public safety sectors.
The aspects that contribute to a more complex relationship between incentive and performance in PA can be grouped into: specificity of cultural dimension, market relations, bonus size, and non-expandable business constraints. In Anglo-Saxon countries, the executive has the choice of hiring or firing employees directly, taking on the responsibilities of building an efficient team. In Italy, the recruitment of civil servants is carried out through competitions, so a manager finds people he did not choose in his team and that he can scarcely fire. Bonus sizes are influenced by public expectations regarding the responsible stewardship of resources (
Miller and Whitford 2007). Non-expandable business constrains the “creation” of funds for incentives (recent boosts to spending reviews in the public budget setting). Reinforcement theory suggests that the total incentives should increase by 10-15 per cent a year (
Perry et al. 2009).
In the remaining part of this section, two main themes are discussed to define our research hypotheses:
Difficulty in identifying objectives measurable and comparable for all task outputs. When criteria able to pick out a different “proactivity” of employees were used, difficulty in sharing and legitimizing the evaluation criteria were found.
The organizational division of work implies a relationship between the individual and the working group: the individual works in cooperation in any case. We can wonder whether the individual monetary incentive, when promoting ambition, might undermine the solidarity inside groups.
2.1. Measurability and Performance
The contribution of employees must be objectively identified. Whereas this is easier in private firms where the results of operations or financial activity (increased productivity) are clear, it is more difficult in the public sector, where the primary goal is not profit, but the level of user (the citizen) satisfaction. Although you cannot locate certain criteria and uniform evaluation for employees, you can adopt the evaluation schemes designed to capture the different levels of competence and predisposition of individuals to make greater effort in the workplace. Credibility and acceptance of the evaluation criteria are related to the ability of organizations to be transparent.
The difficulty in detecting individual comparable performances was overcome by the researchers (in particular scholars of organizational behavior) observing intermediate variables (e.g., attitude, such as the level of employee satisfaction or sense of justice of the appraisal system) that appear to be in a positive relationship with performance.
The network analysis approach allows us to use the centrality in the advice network as a proxy of individual performance (
Boissevain and Mitchell 2018). The exchange of task advice and information is likely to be positively related to job performance. Individuals share information, advice and assistance, in connection with their work. Centrality in the advice network means the involvement of each individual in the exchange of assistance with other colleagues and availability to put effort into problem solving. Central individuals are less dependent on others (
Cook et al. 1983). A central individual can accumulate knowledge about many problems over the years (
Baldwin et al. 1997). As others become dependent on a central individual for some important advice, he/she gains power and authority (
Cook et al. 1983).
Thus, the first research question is the following:
Hypothesis 1 (H1). Is the monetary incentive also positively related to individual performance in PAs?
In other words, H1 investigates whether critical issues, associated with the use of incentives as a motivational tool in the public sector, emerge by analyzing the behavior of the employees of companies that use contingent pay systems.
Legislative Decree no.150/2009 states that PAs in Italy must promote merit and performance improvement using selective reward systems. Employees who achieve the best performance should be rewarded through the selective allocation of economic and career incentives.
The introduction by decree of a “closed-rank” tournament system could be an efficient method for determining labor compensation when measuring the performance of individual employees is more difficult than organizing them through ranking. Little research has been developed, however, regarding the use of rank-order tournaments in the public sector. Rank order tournaments solve managers’ difficulty in the identification of synthetic indicators of performance that allow the glimpsing of cardinal differences (typical of the PRP systems) between employees. According to this theory (
Lazear and Rosen 1979), wage differences are based not on marginal productivity but instead upon relative differences between individuals. Furthermore, this system could overcome the problem of budget constraint, since the ability of employees to increase their bonus (earning it at the expense of someone else) is not limited. Rank-order tournaments represent a system of non-linear bonus given because each additional unit of performance does not necessarily translate into an additional unit of reward (
Whitford 2006). The intention of those who apply this incentivizing system is to produce positive results continuously, discouraging people from taking opportunistic attitudes. Managers who create the tournament rules seek to discourage risk-aversion, affirmation of which would lead instead to a crystallization of the system. This would cause a double negative effect: the less efficient employees will not be stimulated to improve, considering the required results out of reach, while the most deserving ones will consider a performance just enough to be rewarded sufficient, beating their colleagues of the lower classes. After the first year, the distribution of the bonuses will form an incentive for the performance of the following year. Thus, the second research question reads as follows.
Hypothesis 2 (H2). Does a monetary incentive induce virtuous behavior at an individual level in PAs?
In other words, H2 investigates whether introduction of monetary incentives gives impetus to competition that pushes all employees to achieve better positions through higher performance.
2.2. Incentives to Individual and Organizational Performance
The most critical considerations about the coexistence of individual rewards and positive overall performance are those expressed by scholars of game theory. In particular,
Ladley et al. (
2015) examined the effect of individual versus group evaluation, reward systems, and performance. They found that in order to enable the group members and all the group to perform better, one person of the group has to sacrifice him/herself.
Rank-order tournaments lead employees into competition, promoting individualism. For this reason, a higher pay dispersion “can undermine feelings of internal equity and damage cooperation and any sense of common purpose across the workforce as a whole” (
Beaumont and Harris 2003).
Many studies have been conducted in sports contexts, in which individual and team achievement are easily identified (football, hockey), whereas few experiments have been conducted in enterprises, especially because it is not easy to obtain the data of real salary and monetary incentives. A study (
Bloom 1999) performed in a sports context (baseball), where the level of interdependence between the players was high, which showed that a high dispersion of payment was negatively related to individual and organizational performance.
Lazear (
1989) has shown that in a highly competitive environment, there is a compression of wage range. You must distinguish when the difference in payment is due to salaries, and therefore is durable, and when the difference in payment is temporary, due to a distribution of bonuses. The literature clearly distinguishes between vertical and horizontal dispersion of pay. While the former is about wage differences between managers and non-managers, the latter concerns the differences between siblings. Positive results have been obtained from the application of PRP systems when non-manager employees, whose job responsibilities are fairly concrete and measurable (
Mavor and Broderick 1991), were involved.
Explicit in the foundation of tournament theory is that pay differentials are performance based, that performance can be effectively evaluated, and that the workforce is homogeneous in terms of ability (
Knoeber and Thurman 1994;
Rosen 1985).
It is fundamental for a positive use of monetary incentives to have employees recognize the legitimacy of the appraisal of their superiors and the objectivity of the criteria used. Employees should feel that they have the same chance to achieve their initial goals at each repetition of the tournament. A study of the various public firms in Britain (
Marsden and French 2002) has shown that employees’ motivation will be reduced where performance-based pay is not operating fairly, unless it is seen to be internally equitable and externally competitive. An exploratory case study, using the situation in a manufacturing company in Ghana (
Boachie-Mensah and Dogbe 2011), revealed that the use of performance-based pay was fair and motivating, and there were no adverse effects of the system on teamwork (
Ouchi 1977,
1979).
Shaw et al. (
2002) argued that the relationship between pay dispersion and organizational performance rested on two contingencies: whether the dispersion could be explained by legitimate or normative accepted sources (e.g., individual incentives) and whether work was interdependent.
Individual incentives would therefore seem to adapt better to companies in which the occurrence of group work is low. As one’s position inside the network structure should be related to individual performance, so the social network structure of the entire group should be associated with the performance of the same. Network density describes the overall level of interaction of various kinds reported by network members. In particular, the higher the density of the exchange of communication between members of the group is, the greater cooperation, information sharing, and sense of responsibility with a reduced inclination to laziness should be. According to
Molm (
1994), interdependence supports cooperation and this improves group performance. High network density in the advice network promotes the fluidity of information. The more information is shared, the higher the quality of group decisions is (
Larson et al. 1998). Conversely, groups with low network density may not be able or willing to exchange information, ideas or implicit knowledge related to their work (
Hansen 1999). The introduction of individual incentives may have weakened the spontaneity in the exchange of advice between the groups. Thus, the third research question is the following.
Hypothesis 3 (H3). Within business units, is the dispersion of incentive levels inversely related to the density of trade advisory?
If H3 is empirically verified, the existence of a particular threshold level of the Gini coefficient (
Gini 1921) when an employee experiences a negative effect on the density of trade advisory (network density <0.30) will be demonstrated.
3. Data
We conducted a study in a public independent institute, i.e., an Italian chamber of commerce, to investigate the effect of the introduction of a new incentive system on the performance of civil servants. We focus on Italy, because in the PA a new incentive system has been implemented starting from 2011, and it was possible to observe the effect of the transition.
Prior to 2011, in the Italian PA, monetary incentives were distributed equally among the employees of the same level, without considering individual performance. In particular, monetary incentives were distributed equally among the business unit, and then divided among the single employees according to a hierarchical logic, i.e. with a fraction proportional to the tenure, predetermined according to the role in the organization. With L.D. 150/09, a new incentive system has been introduced and according to it PAs should promote merit and performance improvement using selective reward systems.
In particular, with a second decree of August 2011, it was decided that only companies with more than fifteen employees and with added resources can use these criteria. This is the result of fierce trade union opposition.
It is worth noting that in Italy the changes in PA have to be enacted by law. According to the new mechanism, employees must be ranked according to their performance and employees who achieve the best performance should be rewarded through the selective allocation of economic and career incentives. In particular, employees ranked according to their performance are divided into three different sets, each related to the different levels of performance, so we have:
Set 1: high performance level, in which 25% of the employees is placed, which accounts for 50% of the resources allocated for the optional pay related to individual performance;
Set 2: intermediate performance level, in which 50% of the employees is placed, which accounts for 50% of the resources allocated for the optional pay related to individual performance;
Set 3: low performance level, in which the remaining 25% of the employees is placed, which does not collect the assignment of any optional pay related to individual performance.
Table 1 summarizes the new incentive system. In particular, it is important to notice that only employees belonging to set 1 and 2 receive a reward. This is a great change. Indeed, it is worth remembering that before the reform organizations had a certain heterogeneity of criteria in the evaluation systems that, in the absence of guidelines, also allowed an “indiscriminate donation”, purely hierarchical-based and not related to any selective criteria. In order to have a smooth transition, in the years after the introduction of L.D. 150/09, to avoid employees being placed in the low level not receiving any optional pay, in the public institution considered, it was decided to divide the total resources in two parts in order to combine the new optional pay system with the previous one. The two monetary incentives combined represent just over a quarter of the total amount received by employees (average value: 26%). Management, constantly negotiating with the labor unions, intends to increase the percentage quota of the new incentive mechanism (which we will call “new”) compared with the old indiscriminative incentive mechanism (which we will call “old”). In the first year, the new incentive represents 53% of the resources allocated to the optional pay; this percentage rises to 64% in the second year.
A double data analysis was performed: the first in February 2011, the second in January 2013. Data was collected through a questionnaire administered directly by the research team to the employees to minimize misunderstandings and highlighting its anonymity, the private use of the data and the agreement with the trade unions. In the first analysis, the total number of employees was 131 and 126 questionnaires were collected because four employees were absent, and one was politically appointed as temporary secretary. At the second analysis, there were 123 interviewees out of 126. It is worth noting that the total number decreased because there were some retirees and, confirming the financial crisis, the employment rate was lower than the retirement rate.
The questionnaire given to the workers was composed of the following parts: personal data of the interviewees (age, gender), position occupied (tenure, organizational area), skills (problem solving, team working, determination, customer oriented, self-organizing), and intra-organization relationships.
The indication about intra-organizational relationships was used for the construction of “task advice centrality”, a proxy for individual performance. “Task advice centrality” means the relations between an employee and other employees and, in particular, indicates how an employee is involved in the activities of other employees. Task advice centrality for each employee is the centrality of the individual in the social consulting network. The intra-organizational relationship reflects the recognition given to a single employee by her/his colleagues for both her/his skills and her/his opportunity of participating in working life. In particular, it indicates how an employee is necessary to perform the other employees’ activities. Thus, it is a proxy of the employee’s performance.
The same data was used to build the “density of working groups”. Employees were divided into 15 working groups; only 11 of them were used for analysis of network density variation in three years; 4 were too small to be considered.
The “density of working groups” represents a proxy for the performance of the working groups.
Moreover, data was collected from the questionnaires in the human resources department of the authority, which provided all the data on optional pay for the years 2010–2012 and information on salary levels of employees.
Accounting information led to the individuation of four predictive factors:
Old monetary incentive, which is the part of the bonus (expressed in euros) granted to employees of the organization based on criteria that were used until the current change.
New monetary incentive, which is the quota of incentives (expressed in euros) which was allocated based on the evaluation of the department managers, according to new criteria of merit.
Salary level, divided into 12 levels, 8 of which are reserved for employees with a non-executive work position.
Value index, an indicator of the effort made by each employee.
4. Methodology
The task advice centrality indicator was constructed from the intra-organizational section of the questionnaire. Employees were asked to declare which 10 members of the organization they need to relate to more directly and more frequently, in order to improve or facilitate the conduct of their activities. The Likert scale used ranged from 1 (contacts infrequent, some once a month) to 7 (several times a day). Through the information collected, it was possible to build an adjacency matrix, squared and not symmetrical (oriented curves). We consider only the relationships between employees belonging to the same level, to detect only those that can be defined “horizontal”. The centrality index for each node is the sum of all incoming curves (
are the incoming branches of employee
i) multiplied by their weight (
and it represents the centrality of the individual in the social consulting network, as defined in Equation (1).
Employees were ordered cardinally using the Task Advice Centrality. To construct the density of the working groups and the density of the entire institution, we refer to the graph G = (N, A), where N is the number of nodes and A the number of arcs, defined by the results of the interviews. The density of an oriented graph (Δ) was defined as Δ = L/n (n − 1), where n is the cardinality of N (the number of nodes) and where L is the cardinality of A (the number of arcs). The density value goes from 0 (completely isolated nodes) to 1 (maximum interconnection between the nodes). To calculate the density of each working group, we consider only the graph with horizontal connections among members belonging to each group (excluding managers and executives).
For the evaluation of skills, interviewees were asked to indicate how often they smartly achieve some organizational behavior. Each behavior is measured on a Likert scale from 1 to 7, which refers to a frequency that goes from “rarely” to “nearly always”. These organizational behaviors contribute to constituting various dimensions of competence (
Ashton et al. 1999). We have chosen the following five skills as they effectively synthesize the qualities required to perform the kind of work that takes place within the institution (problem solving, team working, self-organizing, technology knowledge and customer oriented).
The “value index” is an indicator of the effort made by each employee. To realize it, a number from 1 to 10 was given together with the management of the organization; this number corresponds to the added value of each of the 140 activities represented in the job description of the institution and recorded daily by the management control. The indicator represents the average benefit of the activities carried out daily by each employee. In formulas;
where V is the value (from 1 to 10) assigned to the activity i and T is the time devoted to the same activity by the employee.
In order to verify the hypothesis H1 defined in
Section 2, a linear regression was performed. In this regression, the dependent variable is the task advice centrality for the year 2011 (first detection) and the independent variables are the two monetary incentives (referred to 2010), the tenure (in years of service), the salary level (in eight levels), the five skills.
Among the control variables, we can mention four different areas inside the PA considered.
Table 2 summarizes the activity of each area. It is worth noting that we do not consider Area 5 in the analysis because it is only devoted to the proper functioning of the institution.
A preliminary regression analysis between predictors to test the independence of the factors was conducted and the significance of the model was verified with ANOVA test.
Then, to test hypothesis H2 another linear regression was performed using the same model with data of the second detection (year 2013, 2012 for the two monetary incentives).
To verify H3, we analyzed the horizontal pay dispersion calculating an estimated linear regression curve using the density in network consulting within the working groups and the Gini coefficient as variables.
Gini coefficient is defined as in Equation (4), see (
Deaton 1997) for more details:
where
is mean income of the population
is the income rank P of person i, with income X, such that the richest person has rank 1 and the poorest N. To better interpret the data, a non-parametric Loess strategy was also conducted to fit smooth curves to the empirical data (
Jacoby 2000).
5. Results and Discussions
Table 3 shows the bivariate correlation between the variables used as predictive factors in the first hypothesis test (year 2011). Overlooking some intuitive correlations between the skills, the correlation between the two incentives “old” and “new” stands out (0.514**). That is because a part of their determinants is the same for the two incentive mechanisms, in particular the total working time. For the same reason the value index is significantly related to the two incentives (0.495** with the “old” one and 0.625** with the “new” one) and with the salary level (0.376**): it represents how individual employees occupy their time usefully for the institution. Moreover, observing the correlations between the areas with the other variables, there is a negative correlation (−0.2*) between area 3 and technical skills, because employees who belong to that area only work with their computers. It is worth noting that the value index and salary are positively correlated to one skill for two reasons. The first reason for this could be survey bias, since employees had to evaluate themselves and second, because the employees’ answers related to their skills were merged in summary indicators.
Table 4 shows the results of the regression test between the task advice centrality, i.e. employees’ performance, (dependent variable) and the predictors used. The adjusted R-square for this test was 0.245, and this is in line with the results obtained in the field of social sciences involving aspects related to human behavior (
Achen 1982). The part of the variance explained by the predictors is slightly less than 40 percent (R
2 = 34.2%), thus, the significance of the model is verified. Looking at the coefficients of the regressors, H1 is verified: one percentage point increasing in the task of advice centrality corresponds to 0.31 percentage points of new monetary incentive (
p < 0.006). The negative coefficient (−0.19) of the old monetary incentive (
p ≤ 0.069) is interesting, while the positive one (0.19) of the team working skills (
p ≤ 0.067) is expected, because intuitively correlated with the ability to be central in the task advice network. The predictor “value index” is significant (
p ≤ 0.046): there is a positive relationship between being central in the network and to carrying out intensive activities with high added value. The correlation with a negative beta value (−0.24) that links the centrality to area 4 is due to the fact that in this area employees are included who are frequently in contact with external institutions and some of them are technicians who work offsite. The fifth area, about internal services, was excluded from the predictive variables, and the other four areas are compared to this one.
Table 5 shows the bivariate correlations between the predictor variables of the second analysis (year 2013). Comparing with the first one (
Table 3), the correlation between the new and the old incentive (0.633 **) becomes stronger. It also strengthens the positive relationship between salary level and the two incentives (0.246 * with the old and 0.368 with the new).
Table 6 shows the results of the regression between task advice centrality (the dependent variable) and the predictors used for the second analysis (year 2013). The adjusted R-square for this test was 0.264, a value similar to that obtained in the first test. The same applies to the explained variance (R
2 = 36.5%). Looking at the individual predictors, there is a renewed significance of the new monetary incentive (
p < 0.02); the coefficient (β) is 0.30; similar to the one of the first analysis (0.31). It highlights an inverse relationship that is stronger (−0.40) and more significant (
p < 0.001) for the old incentive. The relationship between the task advice centrality and skills: team working loses significance while customer oriented gains (
p < 0.082). We can observe a more significant convergence on the individual belonging areas, even though the angular coefficients are all negative. The highest coefficient (−0.43) is significantly related to the area 3 (
p < 0.001): members belonging to this area are the least central, actually they are employees who work in open space in direct contact with external customers. The actual data shows that 14.8% of the employees considered (108, non-executives and managers) changed its performance rank. Specifically, nine people lost one, while seven gained one. These results support hypothesis H2.
A detailed analysis of the variation of cardinal task advice centrality in the network can be more precisely observed from the employees’ rank changes.
Table 7 underlines how people who received a lower incentive are the same who obtained the best performances (compared to the average). Those who saw their high level of incentive being confirmed also saw (on the average) their centrality in the network decreasing more.
This would seem to cause effects in opposition to those desired by the institution. The closed-rank distribution system does not encourage people who have already been rewarded during the previous year to improve their performance, even only with a slight increase, because it will be sufficient to be better performing than their colleagues.
The second aspect, positive for the objectives of the institution, is a consequence of the choice of the lower-class employees of accepting the competitive system. Employees were asked if monetary incentives were distributed based on the effectiveness of performance, i.e., if they consider them fair (“Fair Incentives”). This variable regresses positively (beta = 0.245) with the differential between the task advice centrality of year 2011 and the one of year 2013. This differential represents the performance variation (∆ performance). The other control variables (age, gender, tenure, area, skills) used in the regression model were not significant.
Figure 1 shows the non-parametric Loess curve. It is possible to observe that it indicates a decline in a straight linear relationship with those employees who, to the question in the questionnaire “how fair are the incentives that you received?” indicated the answer “incentives are very fair” (7 on Likert scale). It is worth noting that it is possible that some employees hid their thinking behind this highest rating.
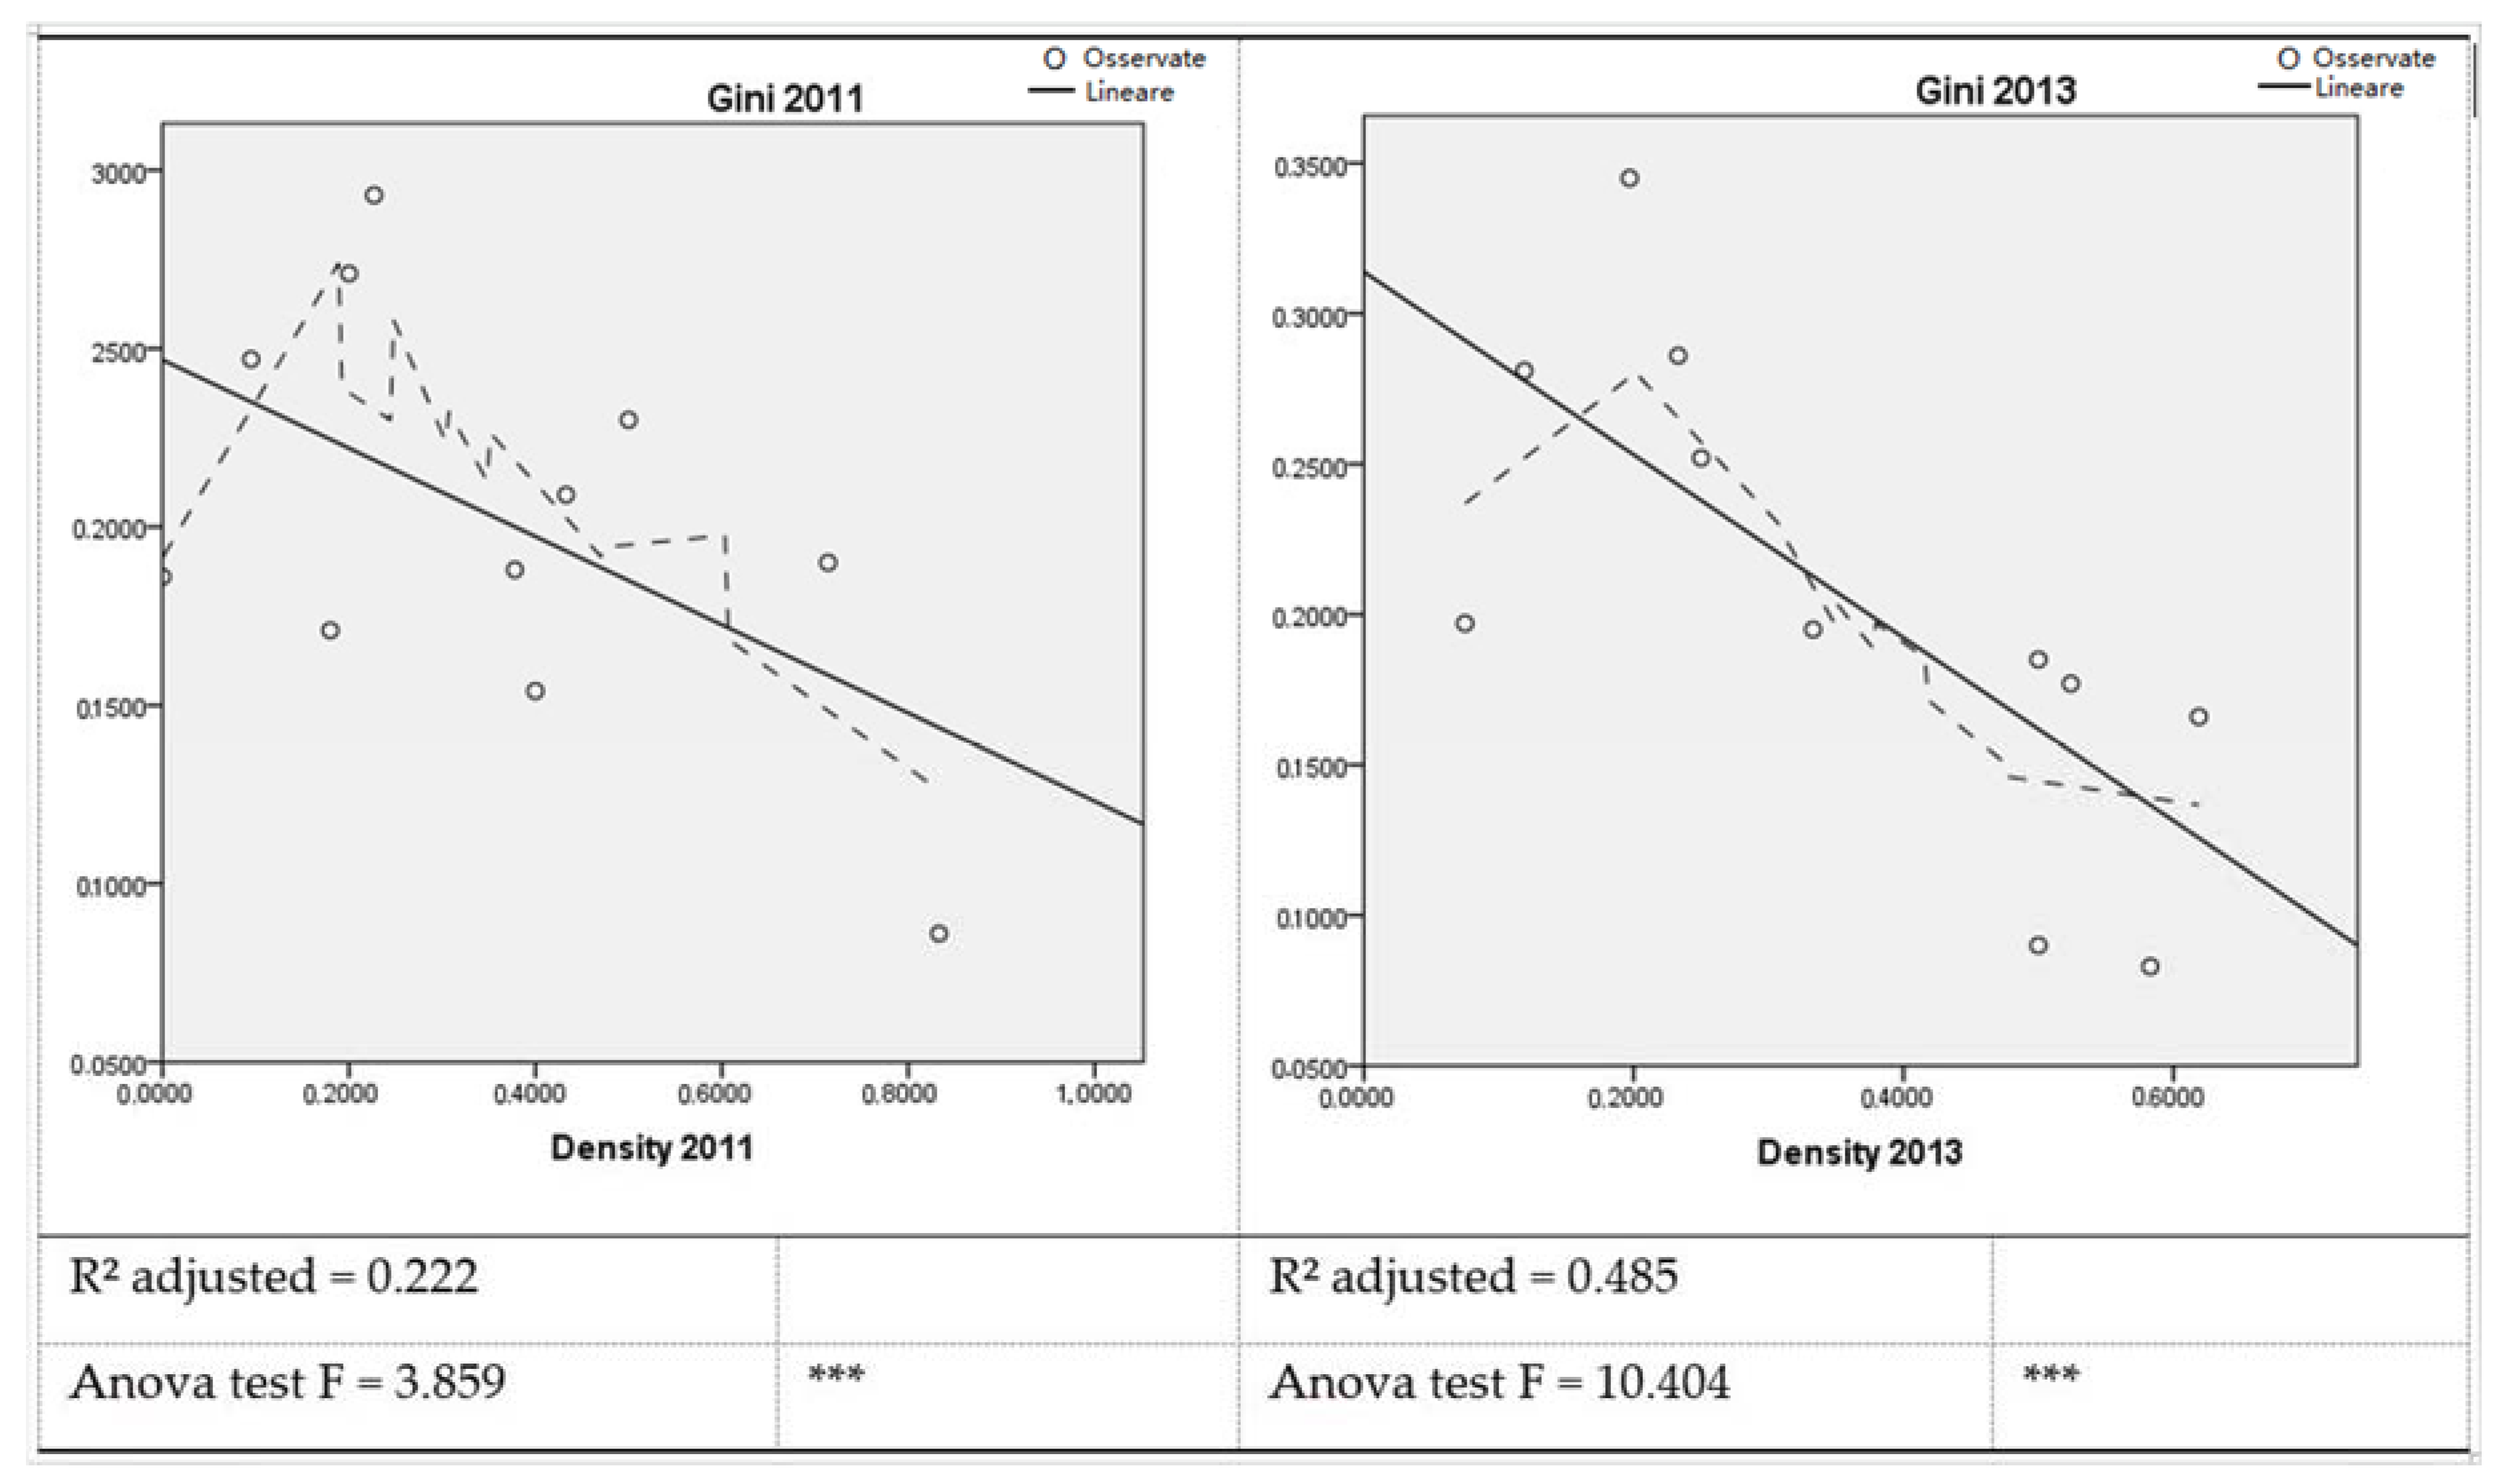
To observe the extent of the inequality of the distribution of monetary incentives within individual business units, the Gini coefficient was used. It is worth remembering that it is a measure of concentration and ranges between 0 (pure equal distribution) and 1 (maximum inequality) (
Bloom 1999;
Donaldson and Weymark 1980). We compared this indicator with the density of trade consulting within the working groups for each survey year (see
Figure 2). We used the program UCINET 6 (
Borgatti et al. 2002) to calculate the density of the working groups. The regression test was significant, and the angular coefficient β was negative in both investigations. β was equal to −0.548 in the first survey and β equal to −0.732 for the second one. Therefore, hypothesis H3 is verified. Usually, according to social network analysis, low levels of interaction correspond to a density lower than 0.30 and to a Gini coefficient larger than 0.25. Observing
Figure 2, the Gini coefficient is less than 0.20 and 0.23 in the first and second case, respectively. In the literature, the total wage is used to calculate the Gini coefficient, and we normally study the national coefficients that have a range of between 0.25 and 0.40 for developed countries. Levels around 0.20 are therefore considered already very low, even if they are related to a single public-sector entity characterized by a very competitive environment.
Summarizing the results, first the introduction of a competitive system, structured as a “closed-rank tournament rank”, encourages employees (non-managers) to improve their performance (H1 hypothesis is verified). Second, the angular coefficient of the new monetary incentive predictor is analogous to that of the previous test and there are 14.8% of employees that changed their rank (H2 hypothesis is verified). Moreover, it is worth noting that in the literature there is a great debate about whether monetary incentives are a bonus for the good performance or a stimulus to do a better job in the next period of observation. In this paper, we also implicitly investigate this issue. With H1 and H2 we investigate whether monetary incentives are a stimulus for good behavior and the answer is positive. It is worth noting that when we study the performance of year 2011, we consider the monetary incentives of 2010, and when we consider the performance of 2013, we consider the monetary incentives of 2012.
Comparing the results of the investigation of H1 and H2, in some way we also answer the reverse causality because if the monetary incentives induce a virtuous employees’ behavior, it also means that the monetary incentives are distributed according the employees’ performance, which means that the monetary incentives represent a bonus for the employees’ performance.
Finally, the density of the overall network decreases, but we cannot prove that this is due to the new system of incentives. The inverse relationship between the Gini coefficient and the density of trade consultancy within individual working groups corroborated the H3 hypothesis. A high dispersion of pay levels appears to inhibit relationships within the organization.


