
Activity Characteristic of the Two Buried Faults in Zhongwei Basin along the Northeastern Margins of Tibetan Plateau, China, by Means of Shallow Seismic and Composite Drilling Section Exploration

Abstract
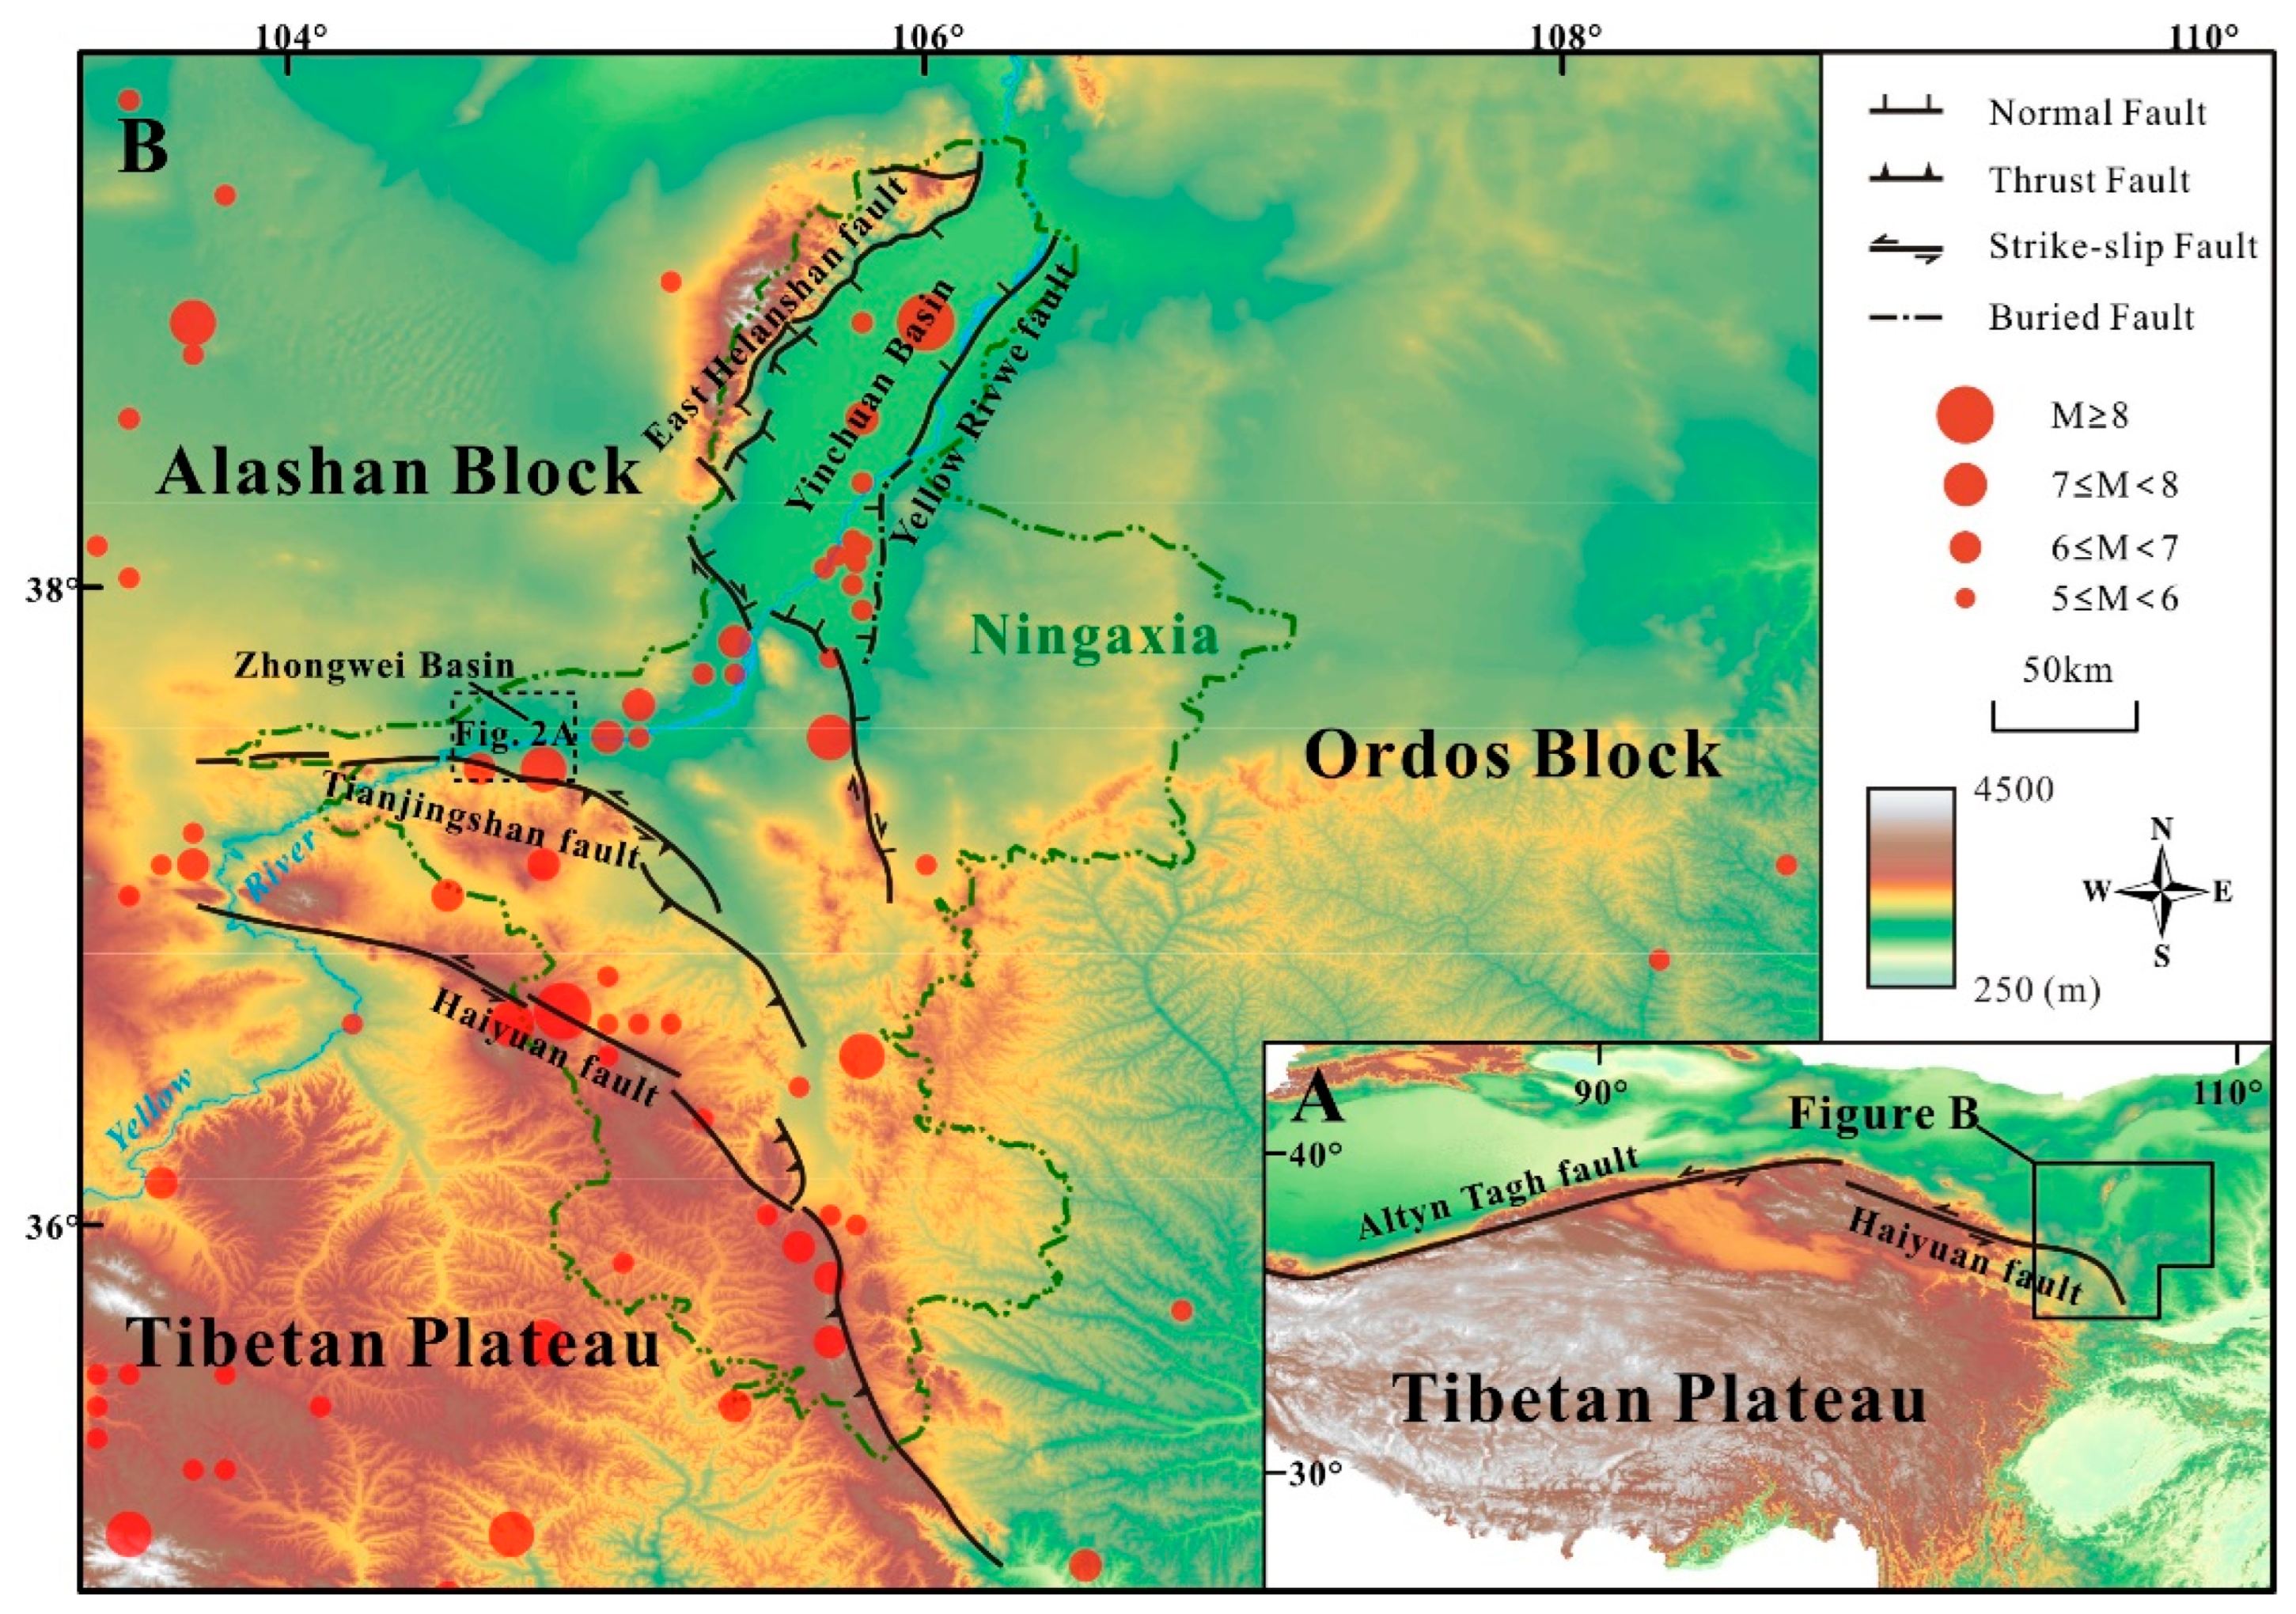
:1. Introduction
2. Methods
2.1. Shallow Seismic Exploration
2.2. Composite Drilling Section Exploration
2.3. Sample Dating Test
3. Activity Characteristic of Hetan-Guotan Buried Fault
3.1. Shallow Seismic Exploration of Xietan Village’s Survey Line
3.2. Composite Drilling Section Exploration in Xietan Village
3.2.1. Layout of Boreholes
3.2.2. Comparison of Stratigraphic Lithology
- (1)
- The upper part of the Stratum ① is filled with earthy yellow plain fill, which contains plant roots and is moist and loose. The middle part consists of black-red and gray-white sandy clay, the bottom part has much sandy and is filled with light yellow clayey sand. This stratum is distributed 0~5 m below the Earth’s surface and the sediment thickness is 4~5 m.
- (2)
- The Stratum ② is a layer of variegated pebble and gravel, which is mainly gray-green and blue-green, followed by maroon and milky white. The pebble and gravel have fine psephicity. The maximum gravel diameter exceeds the drill core diameter by 10.8 cm. This stratum is distributed 5~30 m below the Earth’s surface, its thickness decreases from north to south.
- (3)
- The upper part of the Stratum ③ is light yellow with gravel-bearing coarse sand and gravelly sand. Some area is dark yellow or dark red. However, the upper parts of Z1-7, Z1-9 and Z1-2 have 1~3 m of dark red cohesive soil, silt and fine sand, its thickness decreases from north to south and finally thins out. The bottom parts of Z1-7, Z1-9, Z1-2 and Z1-10 gradually turn light red. The lower part is filled with light-red or dark-red cohesive soil and some areas have light red medium-fine sand. The bottom boundary of this stratum is different from the upper part of Stratum ④ in terms of gravelly sand’s color and lithology. There is a dip of around 30° at the bottom boundary of Z1-2. This stratum is distributed 30~43 m below the Earth’s surface; its thickness decreases from south to north.
- (4)
- The upper part of Stratum ④ mainly consists of light-yellow gravelly sand, interbedded with medium-fine sand, medium-coarse sand or gravel-bearing coarse sand. The bottoms of Z1-8, Z1-4, Z1-3 and Z1-1 are black. The lower part of this stratum is light-red or dark-red cohesive soil sandwiched with thin layers of fine (silty) sand. The bottom boundary of Stratum ④ is obviously different from the light-yellow gravelly sand or light-yellow medium-fine sand in the upper part of Stratum ⑤ in color and lithology. The sandy clay interbedded with clay has a dip angle of about 20°. This stratum is distributed 43~50 m below the Earth’s surface, thick in the middle and thin in the south and north sides.
- (5)
- Stratum ⑤ mainly consists of light-yellow gravelly sand, with dark yellow mud in some areas. Its gravel content is between 25% and 50%, with poor sorting and psephicity. The maximum gravel diameter is about 8 cm. It has medium-fine sand, (medium) coarse sand and gravel-bearing coarse sand interbed. Its bottom boundary is significantly different from the light red/dark red clay soil in Stratum ⑥ in terms of color and lithology, making it easy to distinguish them. Z1-7, Z1-9, Z1-2 and Z1-10 are distributed 50~63 m below the Earth’s surface and Z1-8, Z1-6, Z1-4, Z1-3 and Z1-1 are distributed 50~55 m below the Earth’s surface. The thickness difference between the south and north of the stratum is large, which can be used as an obvious marker bed of fault dislocation.
- (6)
- In Stratum ⑥, the light-red or dark-red cohesive soil layer, clay, clayey sand and sandy clay appear alternately. Some areas have black-red medium-coarse sand, gravel-bearing coarse sand or gravelly sand interbeds. The interbed is unstable in transverse contrast. Z1-7, Z1-9, Z1-2 and Z1-10 are distributed 63 m below the Earth’s surface and Z1-8, Z1-6, Z1-4, Z1-3 and Z1-1 are distributed 55 m below the Earth’s surface.
3.2.3. Marker Bed and Fault Location
3.3. Sample Dating Test
4. Activity Characteristic of Zhenjing-Zhenbei Buried Fault
4.1. Shallow Seismic Exploration of Lizui Village’s Survey Line
4.2. Composite Drilling Section Exploration in Lizui Village
4.2.1. Layout of Boreholes
4.2.2. Comparison of Stratigraphic Lithology
- (1)
- The surface layer of Stratum ① is filled with earthy yellow plain fill and the top boundary is the reconstruction surface of the farmland without height difference. The lower part is filled with greyish-yellow clayey sand and sandy clay with a greyish-black base due to the small amount of humus. This stratum is distributed 0~5 m below the Earth’s surface and the sedimentary thickness varies slightly. It is 4.85 m thick in the south and gradually decreases to about 2.0 m in the north.
- (2)
- Stratum ② is filled with variegated pebbles and gravels, which are mainly milky white, light red and greyish green, followed by dark gray and greyish black, with poor sorting and fine psephicity. The minimum gravel is 0.3~0.5 cm in diameter and the maximum gravel is 6.0~9.0 cm in diameter, with a complex composition and a thin layer of coarse sand of about 0.3 m. This stratum is distributed between 5 and 37 m below the Earth’s surface. Its thickness decreases from south to north.
- (3)
- In Stratum ③, the light red fine sand is interbedded with earthy yellow sandy clay, clayey sand and clay. It follows the sedimentary rhythm of fine sand-cohesive soil-fine sand-cohesive soil-fine sand-cohesive soil, with the exception that the light red fine sand at the top of Z2-1 thins out. This stratum is distributed between 37~48 m below the Earth’s surface. It is slightly thin in the south and its thickness gradually increases from south to north. Its bottom boundary is 46~48 m below the Earth’s surface.
- (4)
- In Stratum ④, the light red fine sand is interbedded with earthy yellow (light red) sandy clay, clayey sand and clay. The upper part is a thick layer of light red fine sand interbedded with cohesive soil and the lower part is a cohesive soil layer interceded with light red fine sand. It follows the sedimentary rhythm of fine sand–cohesive soil–fine sand–cohesive soil–fine sand–cohesive soil. This stratum is distributed between about 48~60 m below the Earth’s surface. It is slightly thick in the south and middle and slightly thin in the north.
- (5)
- Stratum ⑤ is filled with light red sandy clay, clayey sand, clay, fine sand or lenticular body. Z2-1, Z2-3 and Z2-4 have fine sand sandwiched with cohesive soil in the upper part and cohesive soil interbedded with fine sand in the lower part, following the sedimentary rhythm of fine sand-cohesive soil-fine sand-cohesive soil. The upper part of Z2-5, Z2-2, Z2-6 and Z2-7 is the same as that of Z2-1, Z2-3 and Z2-4, but Z2-5, Z2-2, Z2-6 and Z2-7 have a fine sand lenticular body and sand agglomerates in the lower part. This stratum is distributed between about 60~68 m below the Earth’s surface It is slightly thick in the south and its thickness gradually increases from south to north.
- (6)
- In Stratum ⑥, the light red fine sand is interbedded with sandy clay, clayey sand and clay. It is mainly filled with light red fine sand. There are many sandy agglomerates. This stratum is distributed between about 68~73 m below the Earth’s surface. The thickness of the stratum is stable. The middle is slightly thick and the sides are thin.
- (7)
- Stratum ⑦ is a layer composed of light red fine sand interbedded with earthy yellow (light red) cohesive soil. Part of Z2-6, Z2-7 and B have pebbles and gray-black gravel-bearing coarse sand. This stratum is distributed 73 m below the Earth’s surface.
4.2.3. Marker Bed and Fault Location
4.3. Sample Dating Test
5. Discussion
5.1. Relationship between Two Buried Faults and Tianjingshan Fault
5.2. Seismic Hazard Assessment of Two Buried Faults in the Zhongwei Basin
6. Conclusions
- (1)
- Based on the survey line of shallow seismic exploration in Xietan Village, the composite drilling section in Xietan Village revealed that the exact location of the Hetan-Guotan buried fault is approximately 35 m to the south of the position identified by the shallow seismic exploration of Xietan Village’s survey line, with an apparent dip of 78°. Moreover, the burial depth of the uppermost point is 35 m. According to the dating test results of the samples, we found that its latest activity period was the mid-late Middle Pleistocene and it was inactive at the end of Middle Pleistocene and since the Late Pleistocene; thus, it is not an active fault.
- (2)
- According to the survey line of shallow seismic exploration in Lizui Village, the composite drilling section in Lizui Village revealed that the exact location of the Zhenjing-Zhenbei buried fault is about 50 m to the north of the position identified by the shallow seismic exploration of Lizui Village’s survey line, with an apparent dip of 67°. Moreover, the burial depth of the uppermost point is 71 m. According to the dating test results of the samples, we found that its latest activity period was the Early and Middle Pleistocene, and it was inactive at the end Middle Pleistocene and since the Late Pleistocene; thus, it too is not an active fault.
- (3)
- Influenced by the activity of Tianjingshan Fault, the Hetan-Guotan buried fault and the Zhenjing-Zhenbei buried fault were weakly active in the Early and Middle Pleistocene until they ceased to be active in the Late Pleistocene. Due to the large scale and strong activity of Tianjingshan Fault, the regional strike-slip deformation is mainly concentrated in the south of Zhongwei Basin. The two buried faults are small in scale, measuring 12.5 km and 8.8 km, respectively. It is concluded that the two buried faults do not present the conditions for destructive earthquakes in the future. Presumably, the two buried faults will be dominated by small earthquake activity in the future. It is highly unlikely that they would have threatened the urban security of Zhongwei City.
Author Contributions
Funding
Institutional Review Board Statement
Informed Consent Statement
Data Availability Statement
Conflicts of Interest
References
- Middleton, T.A.; Walker, R.T.; Parsons, B.; Lei, Q.Y.; Zhou, Y.; Ren, Z.K. A major, intraplate, normal-faulting earthquake: The 1739 Yinchuan event in northern China. J. Geophys. Res. Solid Earth 2016, 121, 293–320. [Google Scholar] [CrossRef]
- Butler, R.; Stewart, G.S.; Kanamori, H. The 27 July 1976 Tangshan, China earthquake—A complex sequence of intraplate events. Bull. Seismol. Soc. Am. 1979, 69, 207–220. [Google Scholar] [CrossRef]
- Hearn, E.; Mcclusky, S.; Ergintav, S.; Reilinger, R.E. Izmit earthquake postseismic deformation and dynamics of the North Anatolian Fault Zone. J. Geophys. Res. Solid Earth 2009, 114, 1621–1643. [Google Scholar] [CrossRef] [Green Version]
- Deng, Q.D. Exploration of active faults and their seismic hazard assessments. Seismol. Geol. 2002, 24, 601–605. [Google Scholar]
- Zhang, P.Z.; Deng, Q.D.; Zhang, Z.Q.; Li, H.B. Active fault, earthquake disaster in China and its dynamic process. Sci. China Ser. D Earth Sci. 2013, 43, 1607–1620. [Google Scholar]
- King, C. Radon emanation on San Andreas Fault. Nature 1978, 271, 516–518. [Google Scholar] [CrossRef]
- Ciotoli, G.; Etiope, G.; Guerra, M.; Lombardi, S. The detection of concealed faults in the Ofanto Basin using the correlation between soil-gas fracture surveys. Tectonophysics 1999, 301, 321–332. [Google Scholar] [CrossRef]
- Etiope, G.; Guerra, M.; Raschi, A. Carbon dioxide and radon geohazards over a gas-bearing fault in the Siena Graben (Central Italy). Terrestrial Atmospheric and Oceanic. Sciences 2005, 16, 885–896. [Google Scholar]
- Fuis, G.; Ryberg, T.; Lutter, W.; Ehlig, P. Seismic mapping of shallow fault zones in the San Gabriel Mountains from the Los Angeles Region Seismic Experiment, southern California. J. Geophys. Res. Solid Earth 2001, 106, 6549–6568. [Google Scholar] [CrossRef]
- Wyatt, D.; Waddell, M.; Sexton, G. Geophysics and shallow faults in unconsolidated sediments. Groundwater 2010, 34, 326–334. [Google Scholar] [CrossRef]
- Chai, C.Z.; Meng, G.K.; Du, P.; Wang, Y.; Liu, B.J.; Shen, W.H.; Lei, Q.Y.; Liao, Y.H.; Zhao, C.B.; Feng, S.Y.; et al. Comprehensive multi-level exploration of buried active fault: An example of Yinchuan buried active fault. Seismol. Geol. 2006, 28, 536–544. [Google Scholar]
- Pratt, T.L.; Shaw, J.H.; Dolan, J.F.; Christofferson, S.A.; Williams, R.A.; Odum, J.K.; Plesch, A. Shallow seismic imaging of folds above the Puente Hills blind-thrust fault, Los Angeles, California. Geophys. Res. Lett. 2002, 29, 18-1–18-4. [Google Scholar] [CrossRef]
- Liu, B.J.; Chai, C.Z.; Feng, S.Y.; Zhao, C.B.; Yuan, H.K. Seismic exploration method for buried fault and its up-breakpoint in Quaternary sediment area—An example of Yinchuan buried active fault. Chin. J. Geophys. 2008, 51, 1475–1483. [Google Scholar] [CrossRef]
- Pugin, A.J.M.; Pullan, S.E.; Hunter, J.A.; Oldenborger, G.A. Hydrogeological prospecting using P- and S-wave landstreamer seismic reflection methods. Near Surf. Geophys. 2009, 7, 315–327. [Google Scholar] [CrossRef]
- Malehmir, A.; Dahlin, P.; Lundberg, E.; Juhlin, C.; Sjöström, H.; Högdahl, K. Reflection seismic investigations in the Dannemora area, central Sweden: Insights into the geometry of polyphaser deformation zones and magnetite-skarn deposits. J. Geophys. Res. 2011, 116, B11307. [Google Scholar] [CrossRef]
- Brodic, B.; Malehmir, A.; Junlin, C.; Dynesius, L.; Bastani, M.; Palm, H. Multicomponent broadband digital-based seismic landstreamer for near-surface applications. J. Appl. Geophys. 2015, 123, 227–241. [Google Scholar] [CrossRef]
- Lei, Q.Y.; Chai, C.Z.; Meng, G.K.; Du, P.; Wang, Y.; Xie, X.F.; Zhang, X.H. Composite drilling section exploration of Yinchuan buried fault. Seismol. Geol. 2008, 30, 250–262. [Google Scholar]
- Zhang, S.M.; Wang, D.D.; Liu, X.D.; Zhang, G.H.; Zhao, J.X.; Luo, M.H.; Ren, J.J.; Wang, R.; Zhang, Y.L. Using borehole core analysis to reveal late Quaternary paleoearthquakes along the Nankou-Sunhe Fault, Beijing. Sci. China Ser. D Earth Sci. 2008, 38, 881–895. [Google Scholar] [CrossRef]
- Liang, K.; Sun, C.B.; Ma, B.Q.; Tian, Q.J.; Li, D.W.; Li, D.W.; He, Z.T. Investigation of the Yellow River buried fault in the Wuhai basin, northwestern Ordos Block, China, using deep/shallow seismic reflection and drilling techniques. J. Asian Earth Sci. 2018, 163, 54–69. [Google Scholar] [CrossRef]
- Tapponnier, P.; Molnar, P. Active faulting and Cenozoic tectonics of China. J. Geophys. Res. 1977, 82, 2905–2930. [Google Scholar] [CrossRef]
- Zhang, P.Z.; Burchfiel, B.C.; Molnar, P.; Zhang, W.Q.; Jiao, D.C.; Deng, Q.D.; Wang, Y.P.; Royden, L.; Song, F.M. Late Cenozoic tectonic evolution of the Ningxia-Hui autonomous region, China. Geol. Soc. Am. Bull. 1990, 102, 1484–1498. [Google Scholar]
- Li, X.N.; Li, C.Y.; Wesnousky, S.G.; Zhang, P.Z.; Zheng, W.J.; Pierce, I.K.D.; Wang, X.G. Paleoseismology and slip rate of the western Tianjingshan fault of NE Tibet, China. J. Asian Earth Sci. 2017, 146, 304–316. [Google Scholar] [CrossRef]
- Lei, Q.Y.; Chai, C.Z.; Meng, G.K.; Du, P.; Wang, Y.; Xie, X.F. Method of locating buried active fault by composite drilling section doubling exploration. Seismol. Geol. 2011, 33, 45–55. [Google Scholar]
- Zhang, K.; Liu, K.Y.; Wu, J.M.; Yang, J.C.; Cai, J.B. Depositional features of the Zhongwei Basin, Ningxia, and its implications for Neotectonic movements. Acta Sedimentol. Sin. 2004, 22, 465–473. [Google Scholar]
- Zhang, W.Q.; Jiao, D.C.; Chai, C.Z. The Tianjingshan Active Fault Zone; Seismological Press: Beijing, China, 2015; pp. 140–153. [Google Scholar]
- Li, X.N.; Li, C.Y.; Zhang, P.Z.; Wang, X.G.; Zhang, L.S. Changes in fault movement property and genetic machanism on the western segment of the Xiangshan-Tianjingshan fault zone. Seismol. Geol. 2016, 38, 732–746. [Google Scholar]
- Dong, J.Y.; Luo, Q.X.; Li, X.N.; Li, C.Y.; Yang, H.L.; Ren, G.H. Determination and Spatial Pattern of the Late Quaternary Left-lateral Slip Rate of the Tianjingshan Fault. Acta Geosci. Sin. 2021, 42, 527–536. [Google Scholar]
- Wang, W.T.; Zhang, P.Z.; Kirby, E.; Wang, L.H.; Zhang, G.L.; Zheng, D.W.; Chai, C.Z. A revised chronology for Tertiary sedimentation in the Sikouzi Basin: Implications for the tectonic evolution of the northeastern corner of the Tibetan plateau. Tectonophysics 2011, 505, 100–114. [Google Scholar] [CrossRef]
- Lei, Q.Y.; Zhang, P.Z.; Zheng, W.J.; Chai, C.Z.; Wang, W.T.; Du, P.; Yu, J.X. Dextral strike-slip of Sanguankou-Niushoushan fault zone and extension of arc tectonic belt in the northeastern margin of the Tibet Plateau. Sci. China Ser. D Earth Sci. 2016, 46, 691–705. [Google Scholar] [CrossRef]


| Survey Line | Observational System | Geophone Frequency/Hz | Acquisition Parameters | Length/m | ||||
|---|---|---|---|---|---|---|---|---|
| Geophone Interval/m | Minimum Offset/m | Receiving Channels | Fold Number | Sampling Interval/ms | Record Length/s | |||
| Xietan Village | 2 | 0 | 300 | 30 | 60 | 0.5 | 2 | 4220 |
| Lizui Village | 3 | 0 | 341 | 34 | 60 | 0.5 | 2 | 3000 |
| Borehole Number | Z1-7 | Z1-9 | Z1-2 | Z1-10 | Z1-8 | Z1-6 | Z1-4 | Z1-3 | Z1-1 | ||
|---|---|---|---|---|---|---|---|---|---|---|---|
| Buried Depth and Thickness | |||||||||||
| Marker Bed | |||||||||||
| B1 | top boundary/m | 27.50 | 26.83 | 25.35 | 24.15 | 26.29 | 26.93 | 26.63 | 25.29 | 29.31 | |
| bottom boundary/m | 38.06 | 37.86 | 36.54 | 36.48 | 35.51 | 34.92 | 35.28 | 33.50 | 35.27 | ||
| thickness/m | 10.56 | 11.03 | 11.19 | 12.33 | 9.22 | 7.99 | 8.65 | 8.21 | 5.96 | ||
| B2 | top boundary/m | 38.06 | 37.86 | 36.54 | 36.48 | 35.51 | 34.92 | 35.28 | 33.50 | 35.27 | |
| bottom boundary/m | 42.05 | 42.75 | 42.24 | 39.43 | 39.44 | 38.59 | 36.46 | 36.73 | 39.49 | ||
| thickness/m | 3.99 | 4.89 | 5.70 | 2.95 | 3.93 | 3.67 | 1.18 | 3.23 | 4.22 | ||
| B3 | top boundary/m | 42.05 | 42.75 | 42.24 | 39.43 | 39.44 | 38.59 | 36.46 | 36.73 | 39.49 | |
| bottom boundary/m | 48.81 | 48.95 | 48.72 | 47.62 | 47.41 | 46.42 | 45.77 | 46.41 | 45.66 | ||
| thickness/m | 6.76 | 6.20 | 6.48 | 8.19 | 7.97 | 7.83 | 9.31 | 9.68 | 6.17 | ||
| B4 | top boundary/m | 48.81 | 48.95 | 48.72 | 47.62 | 47.41 | 46.42 | 45.77 | 46.41 | 45.66 | |
| bottom boundary/m | 63.16 | 62.37 | 61.44 | — | — | 52.65 | 51.10 | 50.92 | 52.30 | ||
| thickness/m | 14.35 | 13.42 | 12.72 | — | — | 6.23 | 5.33 | 4.51 | 6.64 | ||
| ID | Borehole Number | Lithology | Buried Depth/m | Age/ka |
|---|---|---|---|---|
| 1 | Z1-6 | medium-fine sand | 28.43 | 156.96 ± 7.22 |
| 2 | Z1-6 | clayey sand | 35.15 | 155.22 ± 9.98 |
| 3 | Z1-6 | medium-fine sand | 44.00 | 174.91 ± 8.18 |
| 4 | Z1-6 | clay | 45.75 | 174.32 ± 5.65 |
| 5 | Z1-6 | clayey sand | 53.00 | 227.87 ± 11.00 |
| Borehole Number | Z2-1 | Z2-3 | Z2-4 | Z2-5 | Z2-2 | Z2-6 | Z2-7 | B | ||
|---|---|---|---|---|---|---|---|---|---|---|
| Buried Depth and Thickness | ||||||||||
| Marker Bed | ||||||||||
| Stratum ⑥ | top boundary/m | 68.10 | 66.75 | 67.41 | 67.53 | 67.61 | 68.22 | 67.66 | 69.22 | |
| bottom boundary/m | 71.50 | 72.05 | 72.83 | 72.91 | 72.56 | 72.65 | 71.01 | 73.17 | ||
| thickness/m | 3.40 | 5.30 | 5.42 | 5.38 | 4.95 | 4.43 | 3.35 | 3.95 | ||
| B1 | top boundary/m | 71.84 | 73.18 | 75.21 | 74.79 | 77.30 | 75.14 | — | — | |
| bottom boundary/m | 76.14 | 77.70 | 76.40 | 76.09 | 79.24 | 76.75 | — | — | ||
| thickness/m | 4.30 | 4.52 | 1.19 | 1.30 | 1.94 | 1.61 | — | — | ||
| B2 | top boundary/m | 79.38 | 79.89 | 79.16 | 78.71 | 82.07 | 80.17 | — | — | |
| bottom boundary/m | 81.54 | 81.82 | 79.87 | 80.13 | 84.47 | 82.44 | — | — | ||
| thickness/m | 2.16 | 1.93 | 0.71 | 1.42 | 2.40 | 2.27 | — | — | ||
| ID | Borehole Number | Lithology | Buried Depth/m | Age/ka |
|---|---|---|---|---|
| 1 | Z2-4 | clayey sand | 2.26 | 0.44 ± 0.03 |
| 2 | Z2-4 | fine sand | 29.79 | 119.09 ± 4.47 |
| 3 | Z2-4 | clay | 47.11 | 126.81 ± 8.10 |
| 4 | Z2-4 | clay | 56.86 | 109.73 ± 7.19 |
| 5 | Z2-4 | clay | 64.15 | 131.46 ± 7.30 |
| 6 | Z2-4 | sandy clay | 70.04 | 146.49 ± 5.81 |
| 7 | Z2-4 | clayey sand | 76.15 | 149.41 ± 6.63 |
| 8 | Z2-6 | fine sand | 28.68 | 212.65 ± 12.61 |
| 9 | Z2-6 | fine sand | 71.84 | 218.49 ± 15.67 |
| 10 | Z2-6 | clay | 75.29 | 204.98 ± 11.14 |
Publisher’s Note: MDPI stays neutral with regard to jurisdictional claims in published maps and institutional affiliations. |
© 2022 by the authors. Licensee MDPI, Basel, Switzerland. This article is an open access article distributed under the terms and conditions of the Creative Commons Attribution (CC BY) license (https://creativecommons.org/licenses/by/4.0/).
Share and Cite
Liu, C.; Lei, Q.; Du, P.; Wu, Z.; Li, Z.; Yu, S.; Yang, S.; Wang, Y. Activity Characteristic of the Two Buried Faults in Zhongwei Basin along the Northeastern Margins of Tibetan Plateau, China, by Means of Shallow Seismic and Composite Drilling Section Exploration. Appl. Sci. 2022, 12, 12074. https://doi.org/10.3390/app122312074
Liu C, Lei Q, Du P, Wu Z, Li Z, Yu S, Yang S, Wang Y. Activity Characteristic of the Two Buried Faults in Zhongwei Basin along the Northeastern Margins of Tibetan Plateau, China, by Means of Shallow Seismic and Composite Drilling Section Exploration. Applied Sciences. 2022; 12(23):12074. https://doi.org/10.3390/app122312074
Chicago/Turabian StyleLiu, Chao, Qiyun Lei, Peng Du, Zhiqun Wu, Zeshan Li, Sihan Yu, Shun Yang, and Yin Wang. 2022. "Activity Characteristic of the Two Buried Faults in Zhongwei Basin along the Northeastern Margins of Tibetan Plateau, China, by Means of Shallow Seismic and Composite Drilling Section Exploration" Applied Sciences 12, no. 23: 12074. https://doi.org/10.3390/app122312074