Article

The Influence of the Frequency of Ultrasound on the Exhaust Gas Purification Process in a Diesel Car Muffler

by
Adil Kadyrov
1,
Michał Bembenek
2,
Bauyrzhan Sarsembekov
1,*,
Aliya Kukesheva
1 and
Saltanat Nurkusheva
3
1
Department of Transport Technology and Logistics Systems, Karaganda Technical University, Karaganda 100027, Kazakhstan
2
Faculty of Mechanical Engineering and Robotics, AGH University of Krakow, A. Mickiewicza 30, 30-059 Krakow, Poland
3
Department of Transport Equipment and Technologies, S. Seifullin Kazakh Agro Technical Research University, Zhenis 62B, Astana 010011, Kazakhstan
*
Author to whom correspondence should be addressed.
Appl. Sci. 2024, 14(12), 5027; https://doi.org/10.3390/app14125027
Submission received: 30 April 2024 / Revised: 30 May 2024 / Accepted: 5 June 2024 / Published: 9 June 2024
(This article belongs to the Special Issue Novel Advances of Combustion and Its Emissions)

Abstract

:
This research aimed to analyze the possibility of installing an ultrasonic emitter in an already manufactured car and to prove the possibility of cleaning the exhaust gases of an internal combustion engine through the action of an ultrasonic wave due to coagulation and examining the optimal regimes of its work. The existing theoretical solution to describe the proposed process was analyzed. A Mercedes-Benz M-Class ML 270 CDI MT car with the OM 612 DE 27 LA Diesel engine was used for the experiment. An ultrasound generator and an ultrasound emitter were connected to the muffler. The stand was connected to the car via the inlet with a rubber hose that directs the exhaust gases out of the car. The crankshaft speed of the engine was changed in the range of 750 to 1250 rpm, which corresponds to urban conditions when cars are moving in heavy traffic jams. The content of CH, CO, CO2, and O2 in the exhaust gas of the vehicle was determined as a function of the crankshaft speed without ultrasonic exposure and with ultrasonic exposure at an ultrasound frequency of 25, 28, and 40 kHz. The results of the experiment showed that the introduction of an ultrasonic emitter into the muffler reduced the smoke content of the gas, increased the oxygen content, and reduced the amount of carbon dioxide in the exhaust gases. With an increase in the ratio between the ultrasonic frequency and the angular velocity of the engine crankshaft (f/ω), the smoke content of the gas also decreased. At the maximum values of ultrasonic frequency and angular velocity of the engine crankshaft selected in the experimental studies, the minimum value of the ratio of gas smoke indicators was achieved, and the degree of purification was 10–13%. Such results correspond to the condition of optimal operation of the ultrasonic muffler, where the ratio of gas to smoke values should tend to a minimum. These results confirm the potential of using ultrasound as a method for cleaning exhaust gases and underline the need for further research in this area.

1. Introduction

Initially, the basic function of exhaust systems was removal of exhaust gases from the engine [1,2], noise reduction [3,4], and ensuring appropriate exhaust gas pressure to ensure proper combustion in the cylinder chamber [5]. Currently, the additional function of exhaust systems is to control the mixture composition and check the correctness of the combustion process in the engine combustion chambers [6], e.g., by installing the lambda sensor, exhaust gas catalysis, usually in the catalyzer [7] (including the use of various types of catalysts, e.g., Ad-Blue), and exhaust gas filtering from particulate matter (DPF filters). Development work on exhaust systems is currently primarily focused on the following:
  • Noise reduction [8,9], with passive [10,11] and active [12] solutions;
  • Reducing exhaust emissions [4,13];
  • Improving manufacturing [14] and the technology of producing exhaust system components [14,15].
This is primarily due to the need to ensure exhaust and noise emissions at a level limited by regulations and standards [16,17]. United Nations Regulation 83 and UN Regulation 154 set emission limits for particle number methodology in light-duty vehicles, while UN Regulation 49 does so for heavy-duty engines. GTR 15 includes the particle number methodology for light-duty vehicles without emission limits, making it the sole Global Technical Regulation to do so [18]. The main toxic components of gases are carbon oxides (CO) [4], hydrocarbons (CH), nitrogen oxides (NOx) [19], soot (heavy metals) [20], carbon black, soot, etc. The requirements for the toxicity of exhaust emissions from new cars were set by law and modeled from the “Euro” regulations to solve the problem of air pollution from exhaust gases in most countries. Due to the need to meet requirements set by law, car manufacturers have been given a clear mandate to improve the environmental performance of their vehicles [21]. According to the literature review, this work is carried out for various types of vehicles, from motorcycles [22] to passenger cars [23], trucks, and racing cars [24].
Highway vehicles release about 1.5 billion tons of greenhouse gases (GHGs) into the atmosphere each year—mostly in the form of carbon dioxide (CO2)—contributing to global climate change. Each gallon of gasoline you burn creates 20 pounds of GHG. That is roughly 5 to 9 tons of GHG each year for a typical vehicle [25]. In 2023, global CO2 emissions from the transport sector increased by 4.0% [26]. Net global radiative effects of short-lived climate forcers (including aerosols, ozone, and methane) from the gasoline and diesel sectors are +13.6 and +9.4 mW m−2, respectively. The annual mean net aerosol contributions to the net radiative effects of gasoline and diesel are −9.6 ± 2.0 and +8.8 ± 5.8 mW m−2. Aerosol’s indirect effects from the gasoline and diesel road vehicle sectors are −16.6 ± 2.1 and −40.6 ± 4.0 mW m−2. Renewable fuels achieve better efficiency and lower CO2, CO, HC, and smoke emissions. Smoke emission reduced by a factor of three with 100% Octanol fuel. In the Tank-to-Wheel (TtW) analysis, all of the renewable fuels have a GHG reduction potential of around 2.5% to 5.5% [27].
In operating conditions, vehicle movement includes acceleration, movement at a constant or close speed, deceleration, which can be carried out with the gear engaged or the engine disconnected from the transmission, as well as using the brakes. For economical fuel consumption and reduction of total harmful emissions when driving in populated areas when approaching a traffic light, the driver should make the most of driving with the engine disconnected (free rolling) and avoid heavy braking [28].
The acceleration performance of a car with a diesel engine largely depends on the type of regulator used on the high-pressure fuel pump. Currently, all-mode and dual-mode regulators are used in transport diesel engines. In the first case, the driver, by moving the fuel supply control lever, sets the diesel speed mode at which the regulator reduces the fuel supply. Acceleration of the car at any position of the control lever occurs when the diesel engine operates according to the external characteristic, which significantly reduces the driver’s ability, depending on the environment, to choose the optimal acceleration intensity in order to save fuel and reduce emissions of harmful substances. In diesel trucks with all-mode control during acceleration, it is advisable to set the fuel control lever to a position close to 80% full and change gears when the speed in the engaged gear stops increasing [29].
Other parameters controlled by the driver affect the amount of harmful emissions and fuel consumption much less compared to the position of the fuel control lever and the rotation speed at the moment of gear shifting [30].
Exhaust gases from cars in covered parking areas pose a danger to human health and life. Sources of exhaust gases are any vehicles with a running engine. The more cars there are, the higher the concentration of harmful substances released in the air. This effect is also noticeable on busy highways or during rush hour traffic jams. However, even one car with an open engine creates discomfort for people around and causes irreparable harm to human health. Having summarized the experience of the listed works, the authors came to the conclusion that the greatest harm to human health and nature is caused by vehicles in cramped conditions operating at low engine speeds [31].
Currently, ensuring appropriate indicators of emission standards in exhaust gases is carried out using active and passive methods. Of course, exhaust emissions depend primarily on the type of fuel feeding the engine [22,32]. Passive methods play a crucial role in ensuring appropriate emission indicators. One such method involves the manufacturing of car mufflers (tailpipes) with various purposes and shapes using deep-drawing steel [33]. Another approach focuses on optimizing the noise reduction performance and efficiency of the muffler. This is achieved by employing an optimization design method based on acoustic transfer matrix and genetic algorithms [34]. Additionally, the design of an optimized muffler in accordance with standard specifications and FSAE rules is undertaken to achieve optimal muffler and engine performance [35]. Addressing the issue of low-frequency noise generated by internal combustion engines, several existing muffler design methods, such as the quarter-wavelength tube theory and the Helmholtz muffler, are examined and compared [36].
Passive exhaust gas reduction methods include the shaped solution, e.g., KZ Pat. 3194 [37] or RU Pat. No. 2 364 736 C2 [38], and primarily catalysts [39]. Precious metals, such as platinum, palladium, which contributes to the oxidation of CO and CH, and rhodium, which neutralizes NOx, are used as catalysts [40]. However, the presence of such valuable metals in the composition increases the cost considerably, even if their total weight is only 2–3 g of the total weight of the device’s body. Moreover, catalytic converters have a limited life span, and their replacement is necessary every 100–150 thousand km. This is because the cells of the catalytic converter are made of ceramic, a fragile structure that has the property of being quickly destroyed depending on the exhaust gas flow, temperature difference, and type of fuel. When ceramic honeycombs are destroyed, they turn into small particles, which, when they get into the engine block, leave scratch marks on the walls and lead to considerable wear of the entire block [41].
In the pursuit of enhancing the efficiency and performance of automotive exhaust systems, the utilization of active ultrasonic technology has emerged as a promising avenue for innovation [42,43]. The ultrasound method differs from most other methods in that it is designed to clean large gas particles and cannot completely rid them of more harmful, small particles. Strong ultrasonic vibrations, in turn, act on small gas particles, accelerate the process of particle enlargement (coagulation), and can significantly increase the efficiency of their deposition. The use of ultrasound is particularly effective for particles smaller than 5 μm, as the degree of gas release from the particles is 99–99.5% [44]. Furthermore, the installation of an ultrasonic transmitter does not complicate the exhaust system, as the compact design of the transmitters allows them to be installed anywhere in the system, even in the muffler itself, making catalytic converters unnecessary. Some such solutions are subject to patents.
Ultrasonic cleaning is used in industry, as it allows, as practice has shown, for cleaning finely dispersed fractions. This experience must be transferred to ultrasonic cleaning. Ultrasonic cleaning is widely used for the following:
-
Cleaning dust from thermal power plant ash in an ash collection unit;
-
Dust from industrial premises.
There are solutions for cleaning the exhaust gases of internal combustion engines with ultrasound using a special design outside of the muffler. This is not possible when the car is modernized. We propose to install an ultrasonic transmitter inside of the muffler itself. Therefore, the aim of this research is to analyze the possibility of installing ultrasonic sensors in an already manufactured car and to prove the possibility of cleaning the exhaust gases of an internal combustion engine through the action of an ultrasonic wave due to coagulation and examining the optimal regimes of its work.

2. Materials and Methods

2.1. Modeling of Purification of Waste Gases Using the Ultrasonic Method

According to the proposed hypothesis, exhaust gas cleaning should take place through acoustic coagulation of the particles directly in the muffler. The schematic diagram is shown in Figure 1.
The existing theoretical solution to describe the proposed process was analyzed. The kinetics of coagulation of small spherical particles that fuse upon collision was developed by Smoluchowski [45]. He suggested that in a large volume, compared to the volume of the particles, the particles diffuse (adhere) to each other. In this case, each particle is surrounded by a sphere with a diffusion radius S to which the other particle adheres, and the diffusion coefficient is equal to D. If two particles act as centers of absorption of particles, i.e., coagulation takes place, then the rate of disappearance of particles per unit volume is determined using the formula
d n d t = 2 π D S n 2
where n is the number of particles per unit volume.
The diffusion process was described by A. Einstein [46], and it showed that the value of D is equal to
D = R T 6 π μ r N
where R is the gas constant; T is the absolute temperature; N is the Avogadro number; µ is the viscosity of the medium; and r is the radius of the particles.
Assuming that diffusion is the same for all particles, the radii of the particles are the same, and the ratio S between the radius of the sphere and the radius of the particle is the same [39]:
1 n 1 n 0 = 2 3 R T s μ N t
where n0 is the initial number of particles
or
σ σ 0 = 2 3 R T s μ N t
where σ and σ0 are, accordingly, the volumes of particles.
It follows from Equation (4) that there is a linear relationship between the volume produced per particle fraction and the coagulation time. The results obtained, despite their great importance, are not suitable to describe the process we propose. First, these results are obtained for Brownian motion; in our case, the ultrasonic pressure acts from the engine wall. Secondly, Smoluchowski’s theory applies to a much larger volume of coagulation space compared to the total volume of particles [45]. The linear velocity of the particles is not affected by the pressure of the active force. In our case, the so-called acoustic coagulation takes place under the influence of a sound field [46]. Gas particles of different sizes have a certain frequency of oscillation. In the beginning, the particle follows the motion of the gas as it sticks together and increases in size. Afterward, the particle increases in size due to chaotic oscillations. This process takes place at low oscillation frequencies. As the oscillation frequency increases, there is an optimal frequency range where particles of different sizes have different amplitudes, collide with each other, and coagulate. This type of coagulation is called orthokinetic. As the frequency increases, the coagulation becomes hydrodynamic and occurs through friction. This process is described using the Bjerkness equation [47].
The equation describing acoustic coagulation was established by Kening [47]. A gas with viscosity µ, oscillating with amplitude Xg and frequency f, and in which there is a particle with radius r and density ρ, was considered. According to Stokes’ law, the frictional force acts on a particle:
F s = 6 π μ r ϑ
where ϑ is the difference between the velocities of a particle and a gas.
The rate of oscillation of the gas particles is
ϑ = 2 π f X g cos 2 π f t
where f is the gas frequency and Xg is the movement of the gas particles.
The motion of the particle was described by the equation
m d 2 A g d t 2 = 6 π μ r 2 π f A cos ( 2 π f t ) d A g d t
where A is the amplitude of particle motion and Ag is the amplitude of the gas motion.
The solution is obtained in the form of
A g = A / 4 π ρ r 2 f 9 μ 2 + 1
where ρ is the density of the gas.
It is important to note that the solution of Equation (7) does not take into account the non-periodic term that determines the effect of inertia, as coagulation occurs after a time when the transient process no longer has an effect. The model studied proves the importance of considering the Stokes force on the movement and takes into account the possibility of analyzing only the uniform movement. An important result of these studies is the determination (dependence (8)) of the most significant parameters for the process: f, µ, ρ, and r. However, the model cannot be accepted because of the case where the gas moves densely with the speed ϑ in a closed tube with turns and the possibility of turbulence and a considerable gas density. After reviewing the research results, we believe that the dependencies identified cannot be used directly to describe the process. Mathematical modeling, taking all factors into account, can only determine the direction of the experiment, not specific numerical data. To prepare the experiment properly, we will look at the physical picture of the particle movement in the muffler (Figure 2).
The m1 and m2 pressure force P acts on the particles from the side of the collector of the engine and forces them to move at a certain speed ϑ. On the opposite side, the pressure force of the ultrasonic muffler Fs causes the particles to vibrate with a frequency f. When they interact, the force FS arises—the Stokes force of hydrodynamic friction. As a result of this friction, coagulation occurs, an enlargement of the particles, some of which settle in the muffler. Taking into account the fact that the speed of movement ϑ significantly exceeds the speed of vibration under the influence of ultrasound, it is correct to take this force into account as directly proportional to its magnitude.
The process of coagulation of gas particles is difficult to describe mathematically. Therefore, let us consider the equation of motion of a gas particle in a muffler to determine the necessary parameters measured in the experiment.
The equation of the motion of a particle has the form
P ¯ + F ¯ S + F ¯ a = 0
or, revealing the values of forces,
P = π r 2 ρ υ 2
F S = 6 π μ r Δ ϑ
F a = π r 2 ρ f A c
where c is the speed of the wave in the exhaust gas.
Depending on (9), we take the cos value as an average value of 0.5, which is generally accepted in calculations and does not affect the analysis result in any way. The mathematical model as such does not consider the quality of gas purification through ultrasound. As a result of the movement of the Stokes force, the particles coagulate, enlarge, and settle on the bottom of the muffler. At the same time, the amount of smoke in the exhaust gases decreases. The amount of smoke is an important environmental factor, which is determined by the standards. In this context, we propose as optimality criterion K, the ratio between the smoke content of the gas after cleaning D2 and the smoke content before gas cleaning through ultrasound D1:
K = D 2 D 1 m i n ,
Coagulation only takes place when the Stokes force acts on the particles, i.e., in the proposed equation, this force must be reduced by the optimality criterion. Taking into account the above and dependence (9), we obtain
π r 2 ρ ϑ 2 π r 2 ρ f A c = K 6 π μ r Δ ϑ
Dividing all of the terms by the Stokes force, we obtain
r ρ 6 μ ϑ r ρ A c 6 μ f ϑ = K = D 2 D 1
The criterion of optimality K in its statistical significance is the probability of coagulation. This is the novelty of the research.
Let us take the constant terms out of brackets and obtain
r ρ 6 μ ϑ r ρ A c 6 μ f ϑ = K = D 2 D 1
Obviously, the amount of smoke is affected by the expression in parentheses. The “−” sign before the subtraction reflects the decrease in smoke when exposed to ultrasound.
Let us first calculate the value of the expression in parentheses. According to the literature sources, we take A = 10−5, f = 20, 30, 40 kHz, c is the speed of ultrasonic wave movement in the exhaust gas 100 m/s, and ϑ is the speed of the exhaust gas movement from the collector = 10 m/s [47]. We will obtain
ϑ A c f ϑ = 10 10 5 10 2 2 10 4 10 = 8
As the value of f increases, the expression in parentheses decreases to 7, 6, and 8, which is a 20–40% decrease in the smoke ratio.
Due to the use of averaged values A and ϑ in calculations, the results are averaged. However, they show the significance of the change in the parameters f/ϑ on the optimality criteria.
The speed of movement ϑ depends on the angular velocity of rotation of the crankshaft of the engine ω:
ϑ = Q ω 2 π R 2
where Q is the capacity of the combustion chamber and R is the average radius of the muffler.
By replacing ϑ in Equation (15) with expression (19), we obtain
r ρ P Q 12 μ R 2 ω A c f ω = D 2 D 1
The values of f and ω are adjustable. By changing the f/ω ratio, it is possible and necessary to adjust the operating mode of the ultrasonic muffler. Thus, the analysis of the mathematical model justifies the need for an experimental ratio of parameters D2, D1, f, and ω.
A preliminary calculation of the expression in parentheses of Equation (18) showed a significant effect of the f/ω ratio on the smokiness. With the previously accepted parameters c, A, and f and values ω = 101/s, the expression is
ω A c f ω = 10 10 5 10 2 2 10 4 10 = 8
It has numerical values of 8, 7, and 6, that is, it decreases by 20, 30, and 40%. This shows the need for experimental confirmation of the data obtained.
From the analytical review and mathematical analysis, we draw the following conclusion: it is necessary to establish a pattern of changes in the optimality criterion from the ratio f/ω. In addition, evidence of the effectiveness of gas purification is needed.

2.2. Materials

For the experiment, the summer diesel fuel from the Pavlodar Petrochemical Plant (Kazakhstan) was used, which has a density of no more than 860 kg/m3, a flash point of 62 °C, and a pour point of −10 °C.

2.3. Methods

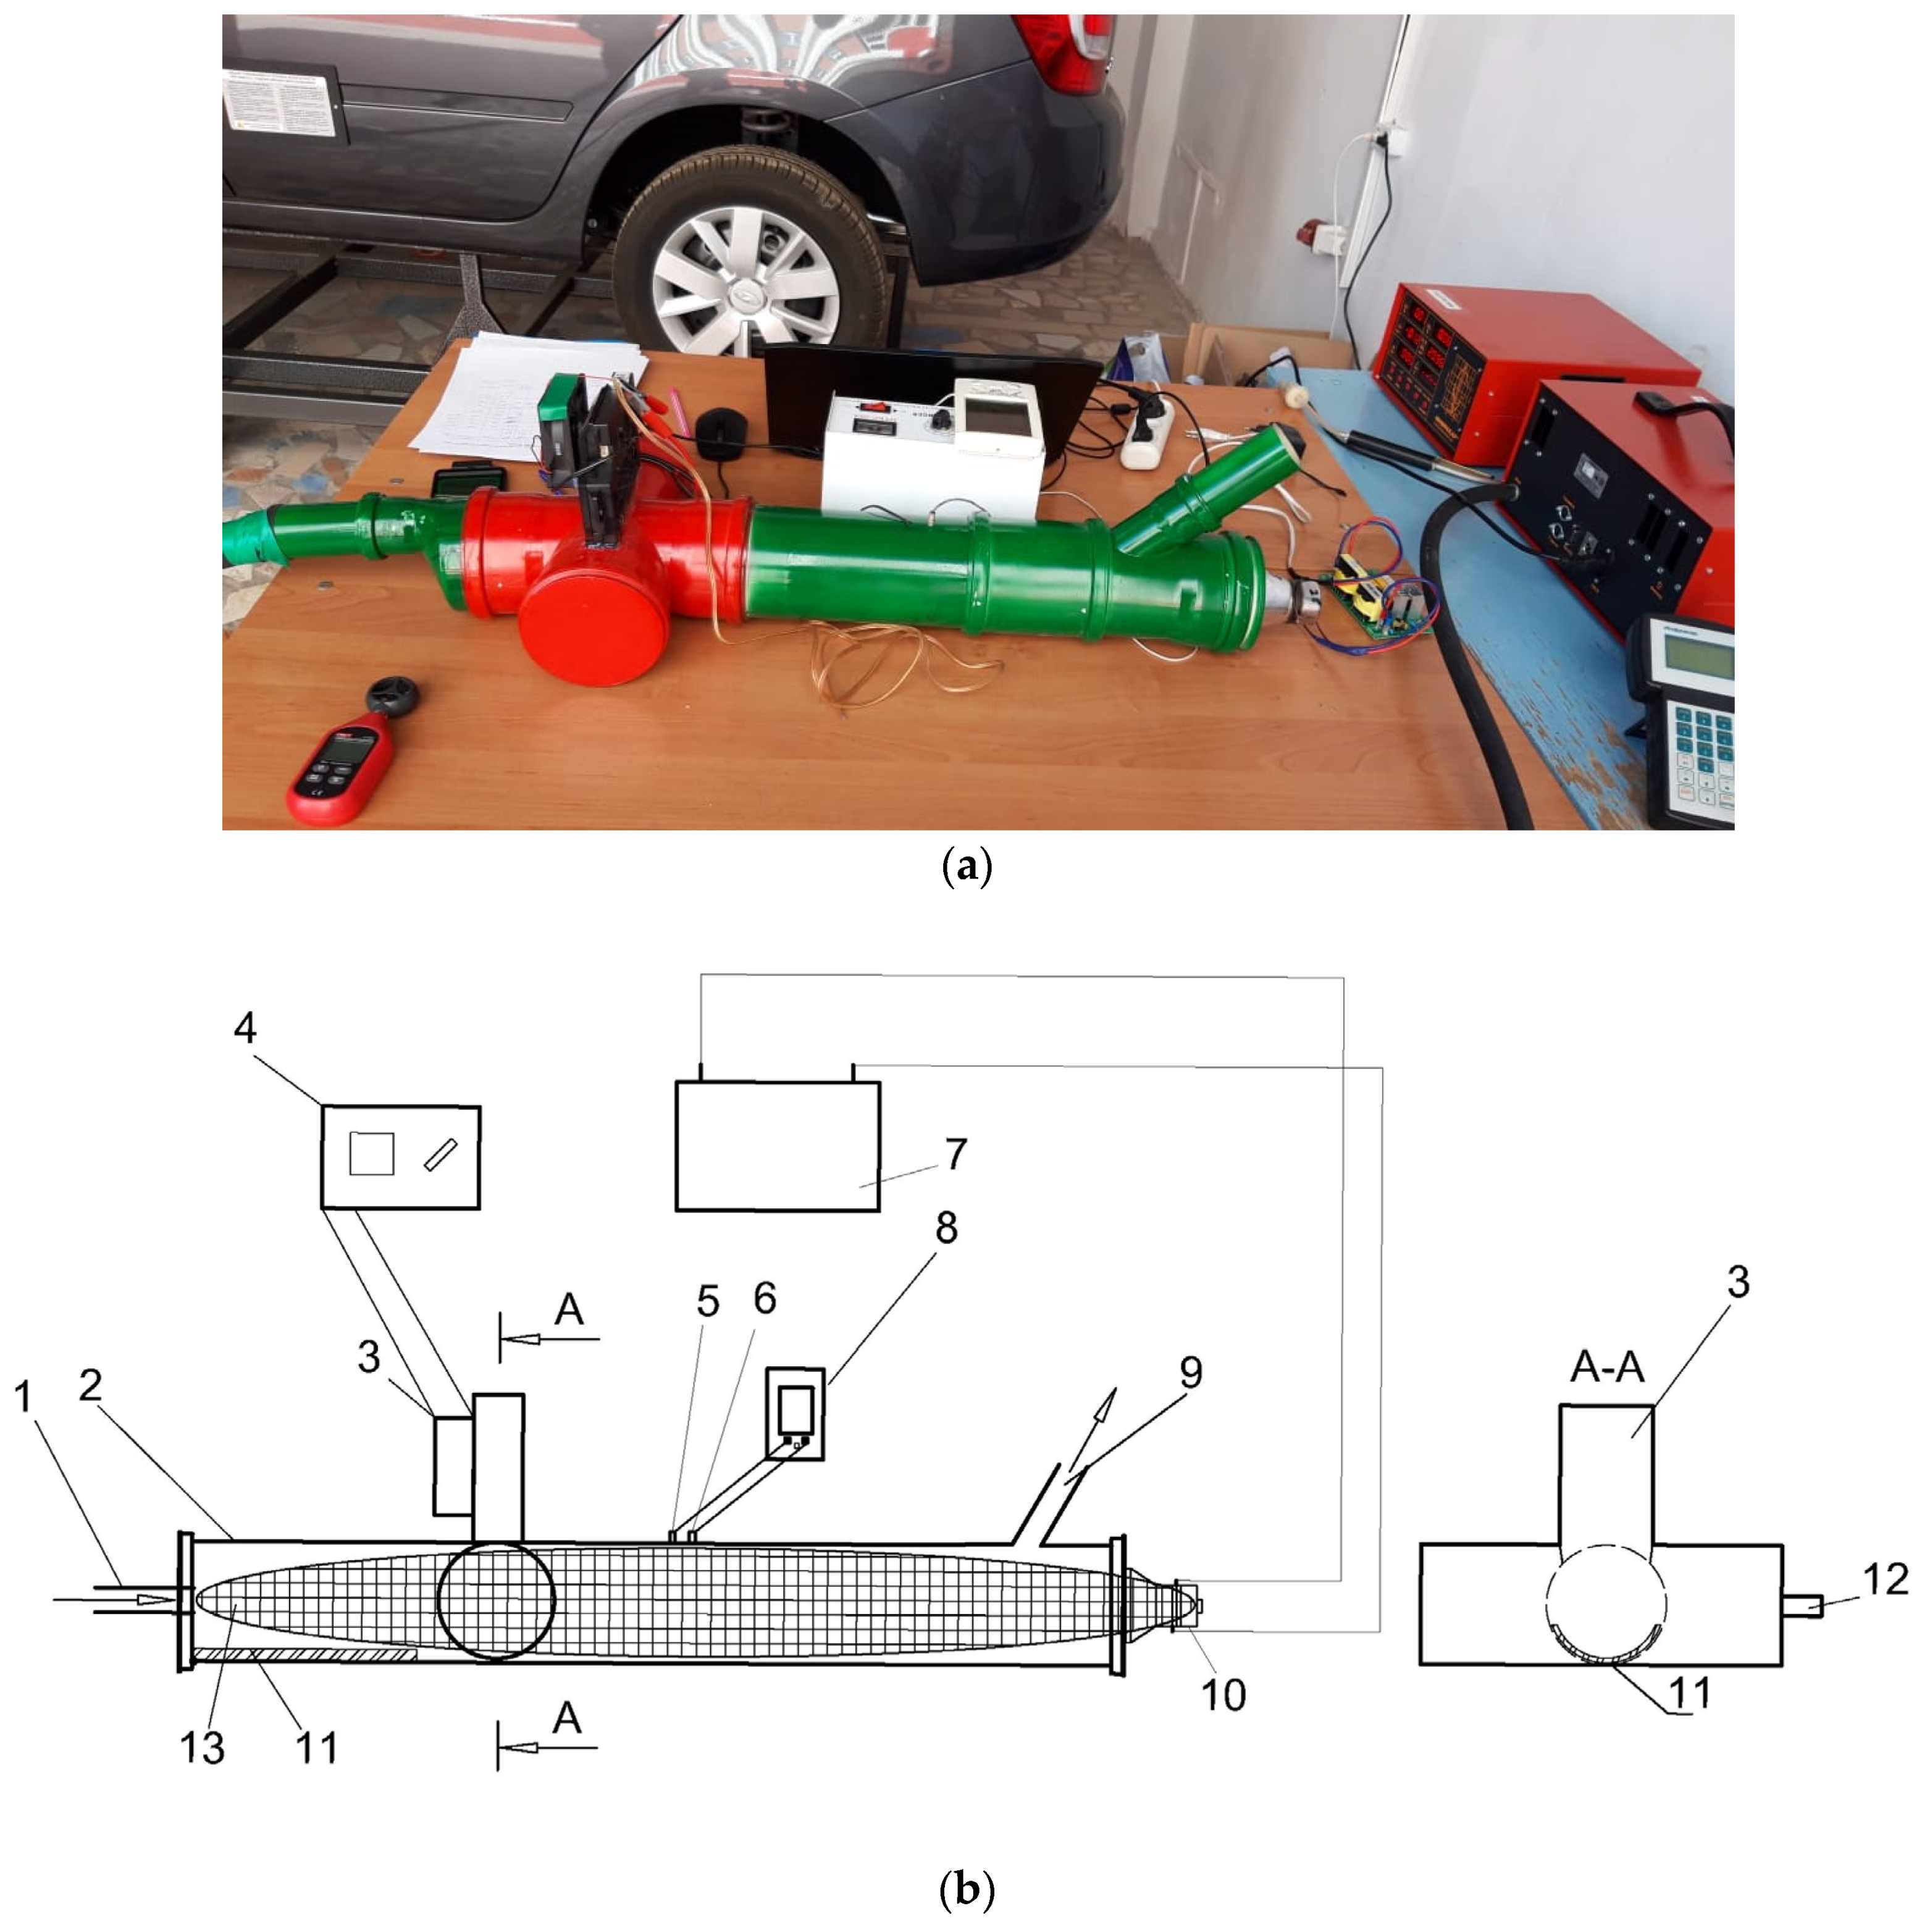
Experimental studies were conducted to determine the regularity of the change in the optimality criterion K as a function of the values of f and ω and the ratio f/ω. The percentage of composition of the gases before and after purification was also determined. To conduct experimental studies to determine the parameters of the composition and opacity of the gas as a function of the change in ultrasonic frequency and the frequency of the revolutions of the engine crankshaft in an ultrasonic muffler, a full-size ultrasonic muffler stand was used, which was developed in the scientific laboratory of the Department of Transport Engineering and Logistics Systems (Figure 3a).
The diagram of a full-size muffler stand is shown in Figure 3b. The stand consists of the following:
  • Inlet pipe 32 mm in diameter (1);
  • Muffler body 1000 mm in length and 110 mm in diameter (2);
  • Laser for determining gas density, DC240 (Xerox, New York, NY, USA) (3);
  • DC 12 V power supply AO-777 (Huan Qi, Renqiu, China) (4);
  • Temperature sensor TA-298 (D-TEC, Beijing, China) (5);
  • Humidity meter TA-298 (D-TEC, Beijing, China) (6);
  • Ultrasonic generator X-DG1 (FanYingSonic, Beijing, China) (7);
  • Outlet pipe with a diameter of 32 mm (8);
  • Longitudinal ultrasonic emitter Transducer (Ultrasonic Cleaning Trans, Guangzhou, China) (9);
  • Hygrometer thermometer TA-298 (D-TEC, Beijing, China) (10);
  • Removable tray (11);
  • Microscope Micmed 2.0 (Micromed, Saint Petersburg, Russia) (12);
  • Longitudinal ultrasonic waves (13).
An optical smoke meter of the BOSCH BEA 070 (Robert Bosch GmbH, Stuttgart, Germany, accuracy class 1 and class 0 according to OIML R99 Ed. 1998) was used as a measuring device for the smoke indicators. The experimental studies on a stand were conducted as follows. A Mercedes-Benz M-Class ML 270 CDI MT car with the OM 612 DE 27 LA Diesel engine was used for the experiment (Table 1). The car engine was started and warmed up to operating temperature. A full-size ultrasonic muffler stand was connected to the car (Figure 3). An ultrasound generator and an ultrasound transmitter were connected to the muffler. The stand was connected to the car via the inlet with a rubber hose that directs the exhaust gases out of the car. The crankshaft speed of the engine was adjusted. The range of rotation speed changes was 750, 950, and 1250 rpm. The selected range allows you to determine the efficiency of the car at idle and in driving mode in urban conditions, when cars are moving in heavy traffic and in traffic jams. At each value of the engine crankshaft speed, the composition of the gas and the smoke content of the gas were measured with an optical smoke meter. After the smoke values had been determined without ultrasonic exposure, the next phase of the experimental study was to sonicate the gas stream with an ultrasonic transmitter at a specific frequency value of 25 kHz. Then, at each value of the crankshaft speed (750, 950, and 1250 rpm) and taking into account the effect of the ultrasonic frequency, the optical smoke meter measured the composition of the gas and the smoke content of the gas. The total exposure time of the ultrasound was 60 s. The experimental trials were carried out in a similar way, but with the substitution of an ultrasound transmitter with frequency indicators of 28 kHz and 40 kHz. The methodology of the experimental studies consisted of two phases of experiments. In the first stage, the content of CH, CO, CO2, and O2 in the exhaust gas of the vehicle was determined as a function of the crankshaft speed without ultrasonic exposure and with ultrasonic exposure at an ultrasound frequency of 25, 28, and 40 kHz. In the second phase of the experiment, the parameters of the smoke content of the gas were determined without exposure and with the influence of ultrasound, depending on the change in the crankshaft speed of the engine with the set value of the ultrasound frequency. Smokiness is a visible dispersion of liquid and (or) solid particles in the exhaust gas, formed as a result of incomplete combustion of fuel and evaporated oil in the engine cylinders, affecting the transmission of light. Smoke affects the light attenuation coefficient N(%), which is recorded by the smoke meter. Repeated experiments were conducted 5 times. This article shows the average data for five experiments.

3. Results and Discussion

The results of the experimental studies are shown in Table 2, Table 3, Table 4 and Table 5.
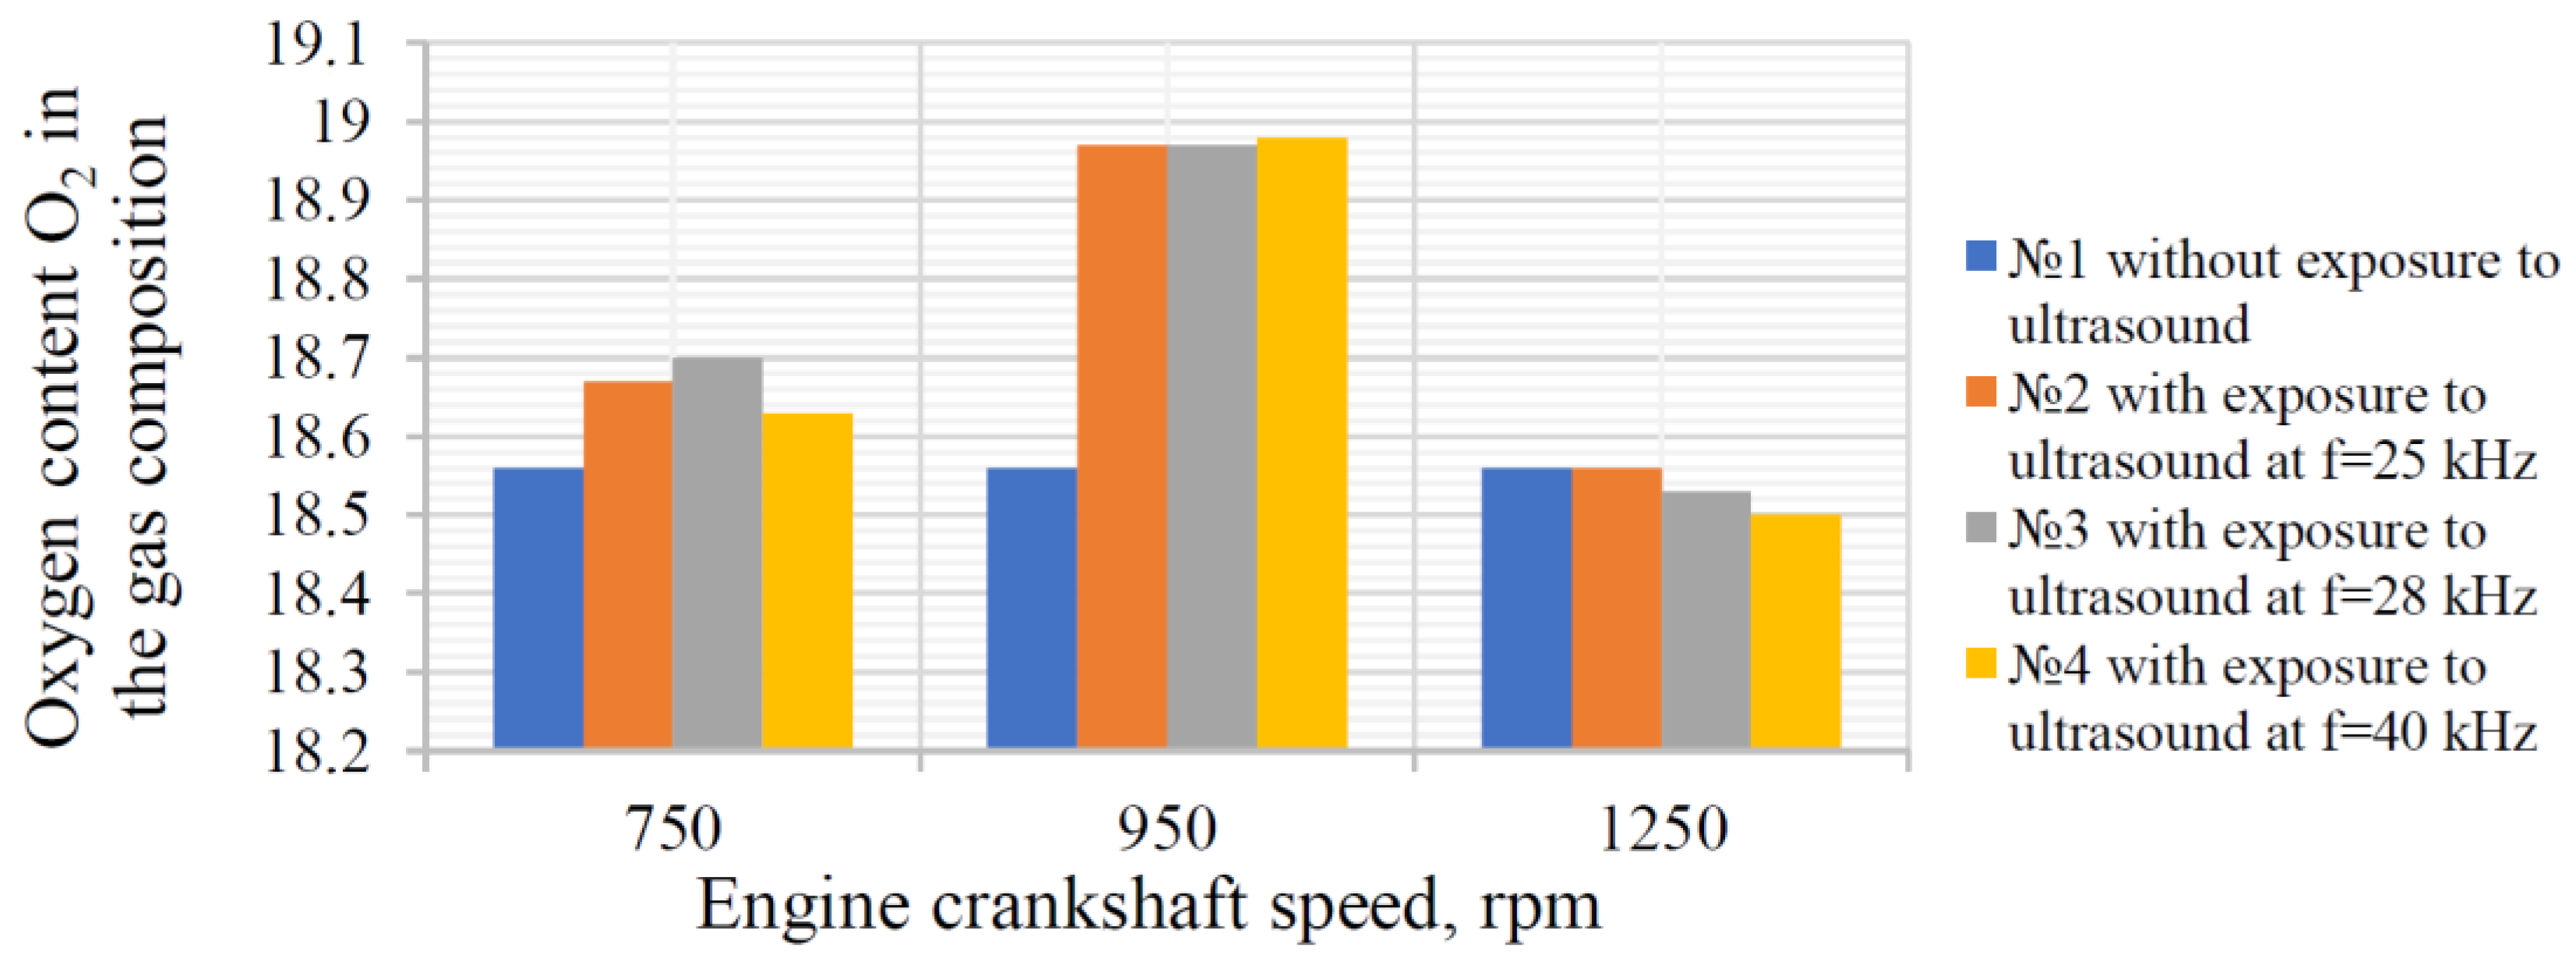
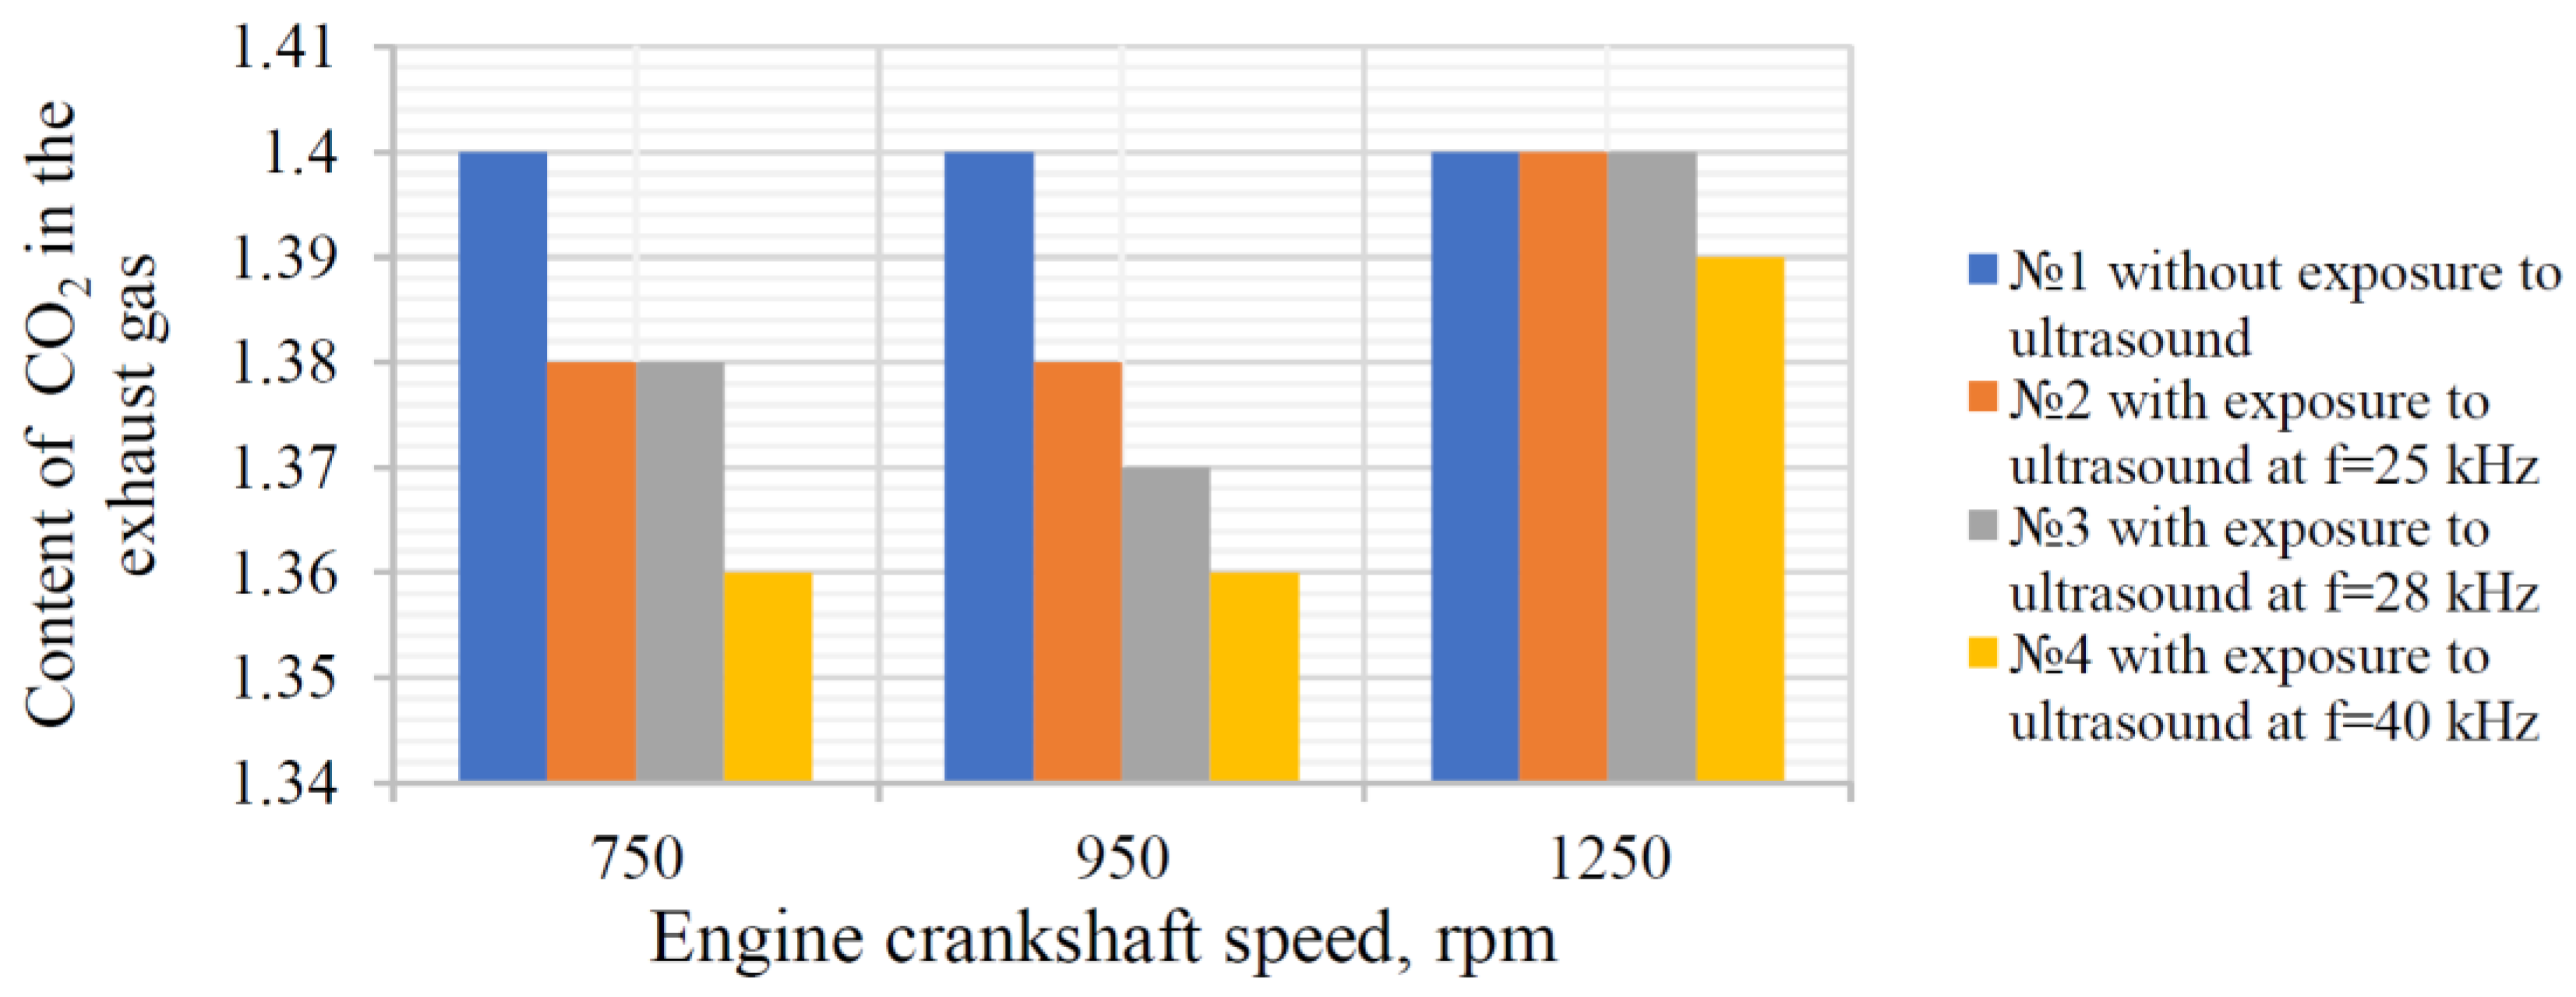
Based on the results of the experimental tests on the composition of the exhaust gases, diagrams of the changes in oxygen (O2) and carbon dioxide content (CO2) as a function of the engine crankshaft speed and considering non-exposure and exposure to ultrasound at specific frequencies of 25, 28, and 40 kHz were drawn up (Figure 4 and Figure 5). The content of the remaining gases was insignificant. Elevated temperature, humidity, and gas–chemical composition do not affect the operation of the ultrasound, as it is used even in hazardous industries for gas purification.
Increasing the speed of gas movement and increasing the frequency of the crankshaft reduces the volume of gas from which the oxygen concentration is determined by the device. And, also, the operation of the engine is controlled by the ECU, which in turn controls the fuel–air mixture supplied to the combustion chamber in different modes.
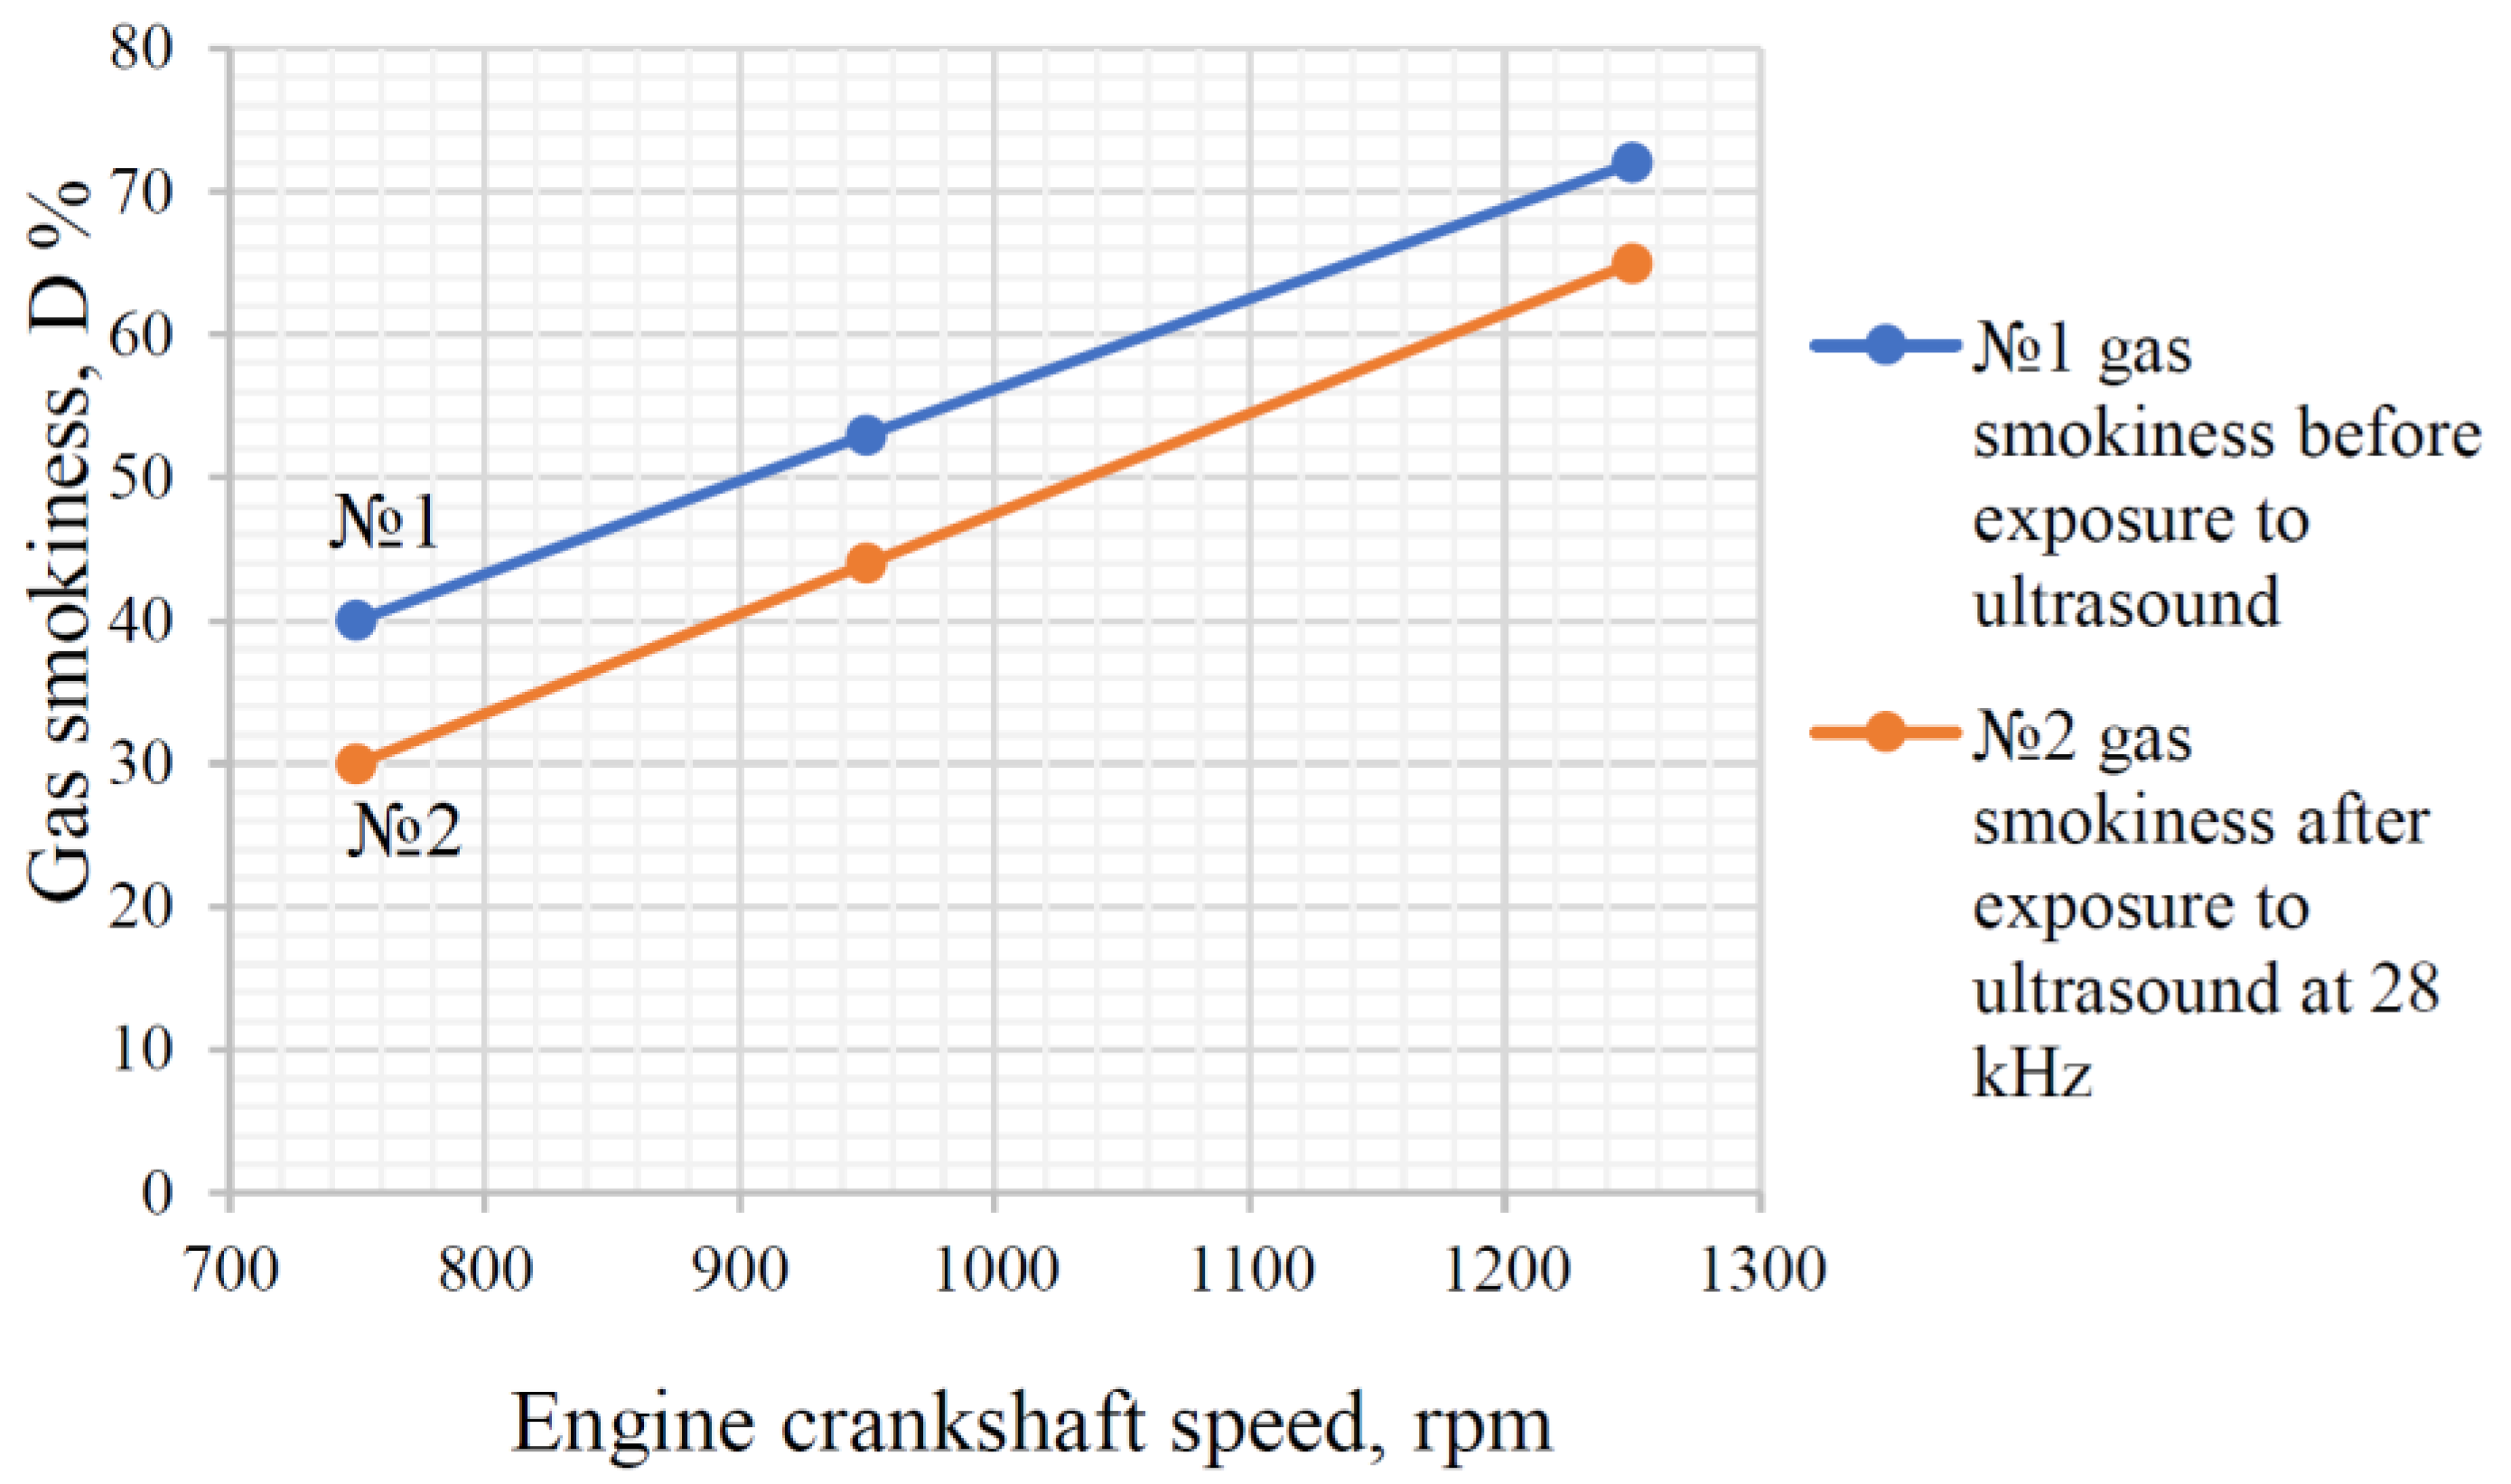
The diagrams obtained (Figure 4 and Figure 5) show the effective effect of ultrasound on the change in composition and the degree of gas cleaning, i.e., at an engine speed in the range of 750 rpm to 950 rpm and at all ultrasonic frequencies of 25, 28, and 40 kHz, an increase in the oxygen content of the exhaust gases and a reduction in carbon dioxide were observed. However, at a crankshaft speed of 1250 rpm, an increase in gas composition was observed. This is because when the engine crankshaft speed is increased, more fuel is consumed, resulting in an immediate increase in carbon dioxide and a decrease in oxygen. It should be noted, however, that at the highest ultrasonic frequency of 40 kHz, the lowest indicators for CO2 and the highest indicators for O2 at 950 rpm were recorded, leading us to conclude that the higher the value of the ultrasonic frequency, the higher the degree of gas purification. Based on the results of the experimental studies to determine the indicators of smoke development, diagrams of the changes in the smoke development index were then prepared depending on the engine crankshaft speed and considering non-exposure and exposure to ultrasound at specific frequencies of 25, 28, and 40 kHz (Figure 6, Figure 7 and Figure 8).
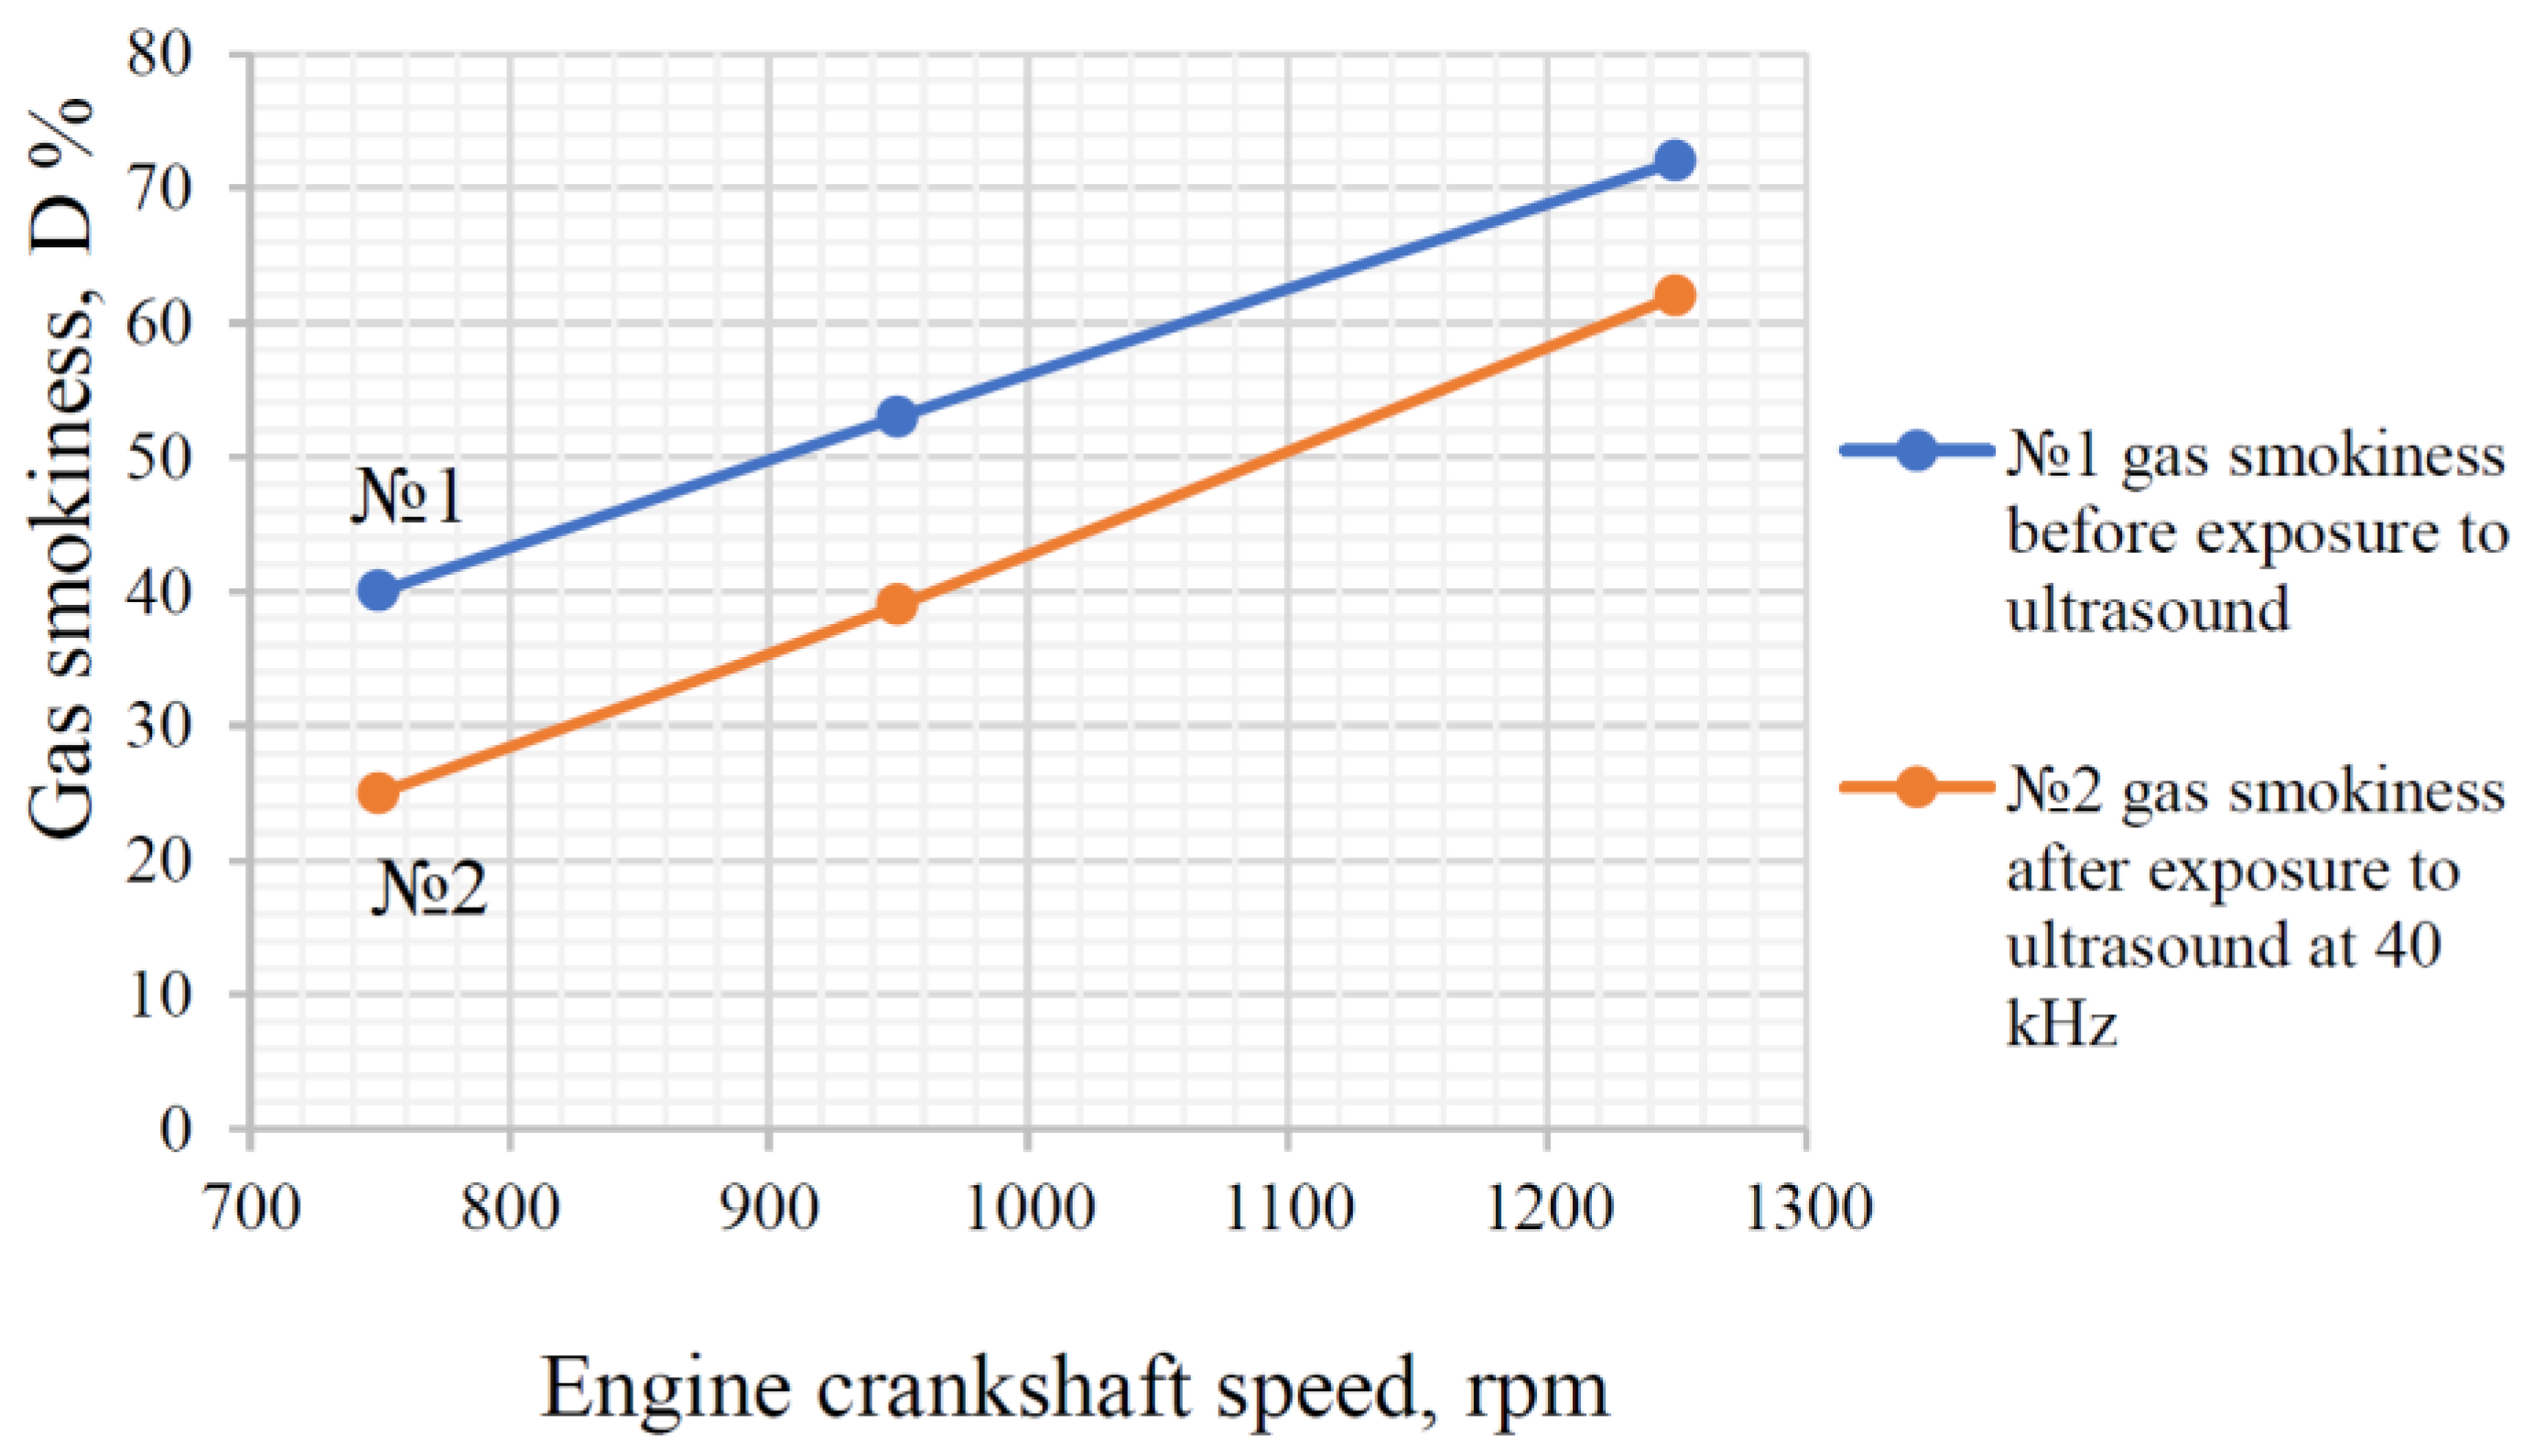
Overall, the results of the experimental studies have shown the success of the experiments conducted, because according to the graphs (Figure 6, Figure 7 and Figure 8), the indicators of smokiness of the gas after exposure to ultrasound have lower values than the indicators of smokiness of the gas that was not exposed to ultrasound. In general, smoke indicators decreased by about 20–40% after exposure to the gas with ultrasound. In general, the results of the experimental studies have shown the success of the experiments carried out, since, as, according to the graphs (Figure 6, Figure 7 and Figure 8), the smoke values of the gas after exposure to ultrasound have lower values than the smoke values of the gas that was not exposed to ultrasound. In general, the smoke content decreased by about 20–40% after exposure to gas by ultrasound. There are other ways to clean the exhaust gas. Their disadvantages include high abrasive wear of the internal parts of the device with the dry cleaning method, and the fact that the percentage of cleaning from solid particles is up to 40%; however, the smokiness of the exhaust gas does not decrease. With the electric method, dust with low electrical conductivity is not filtered, and it is necessary to clean the precipitation and corona electrodes. The devices are costly and complex, they require high energy consumption, they represent a fire hazard, and the percentage of exhaust gas purification is about 40%. Furthermore, catalytic converters with the catalytic method of cleaning car exhaust gases have a short service life (100–120 thousand km). The degree of purification is up to 80% when installing a new catalyst, but the degree of purification decreases depending on the mileage of the car. The ultrasonic method has a number of advantages, such as ease of manufacturing and installation and the long service life of the equipment, and it does not interfere with the movement of exhaust gas. It also has a short payback period.
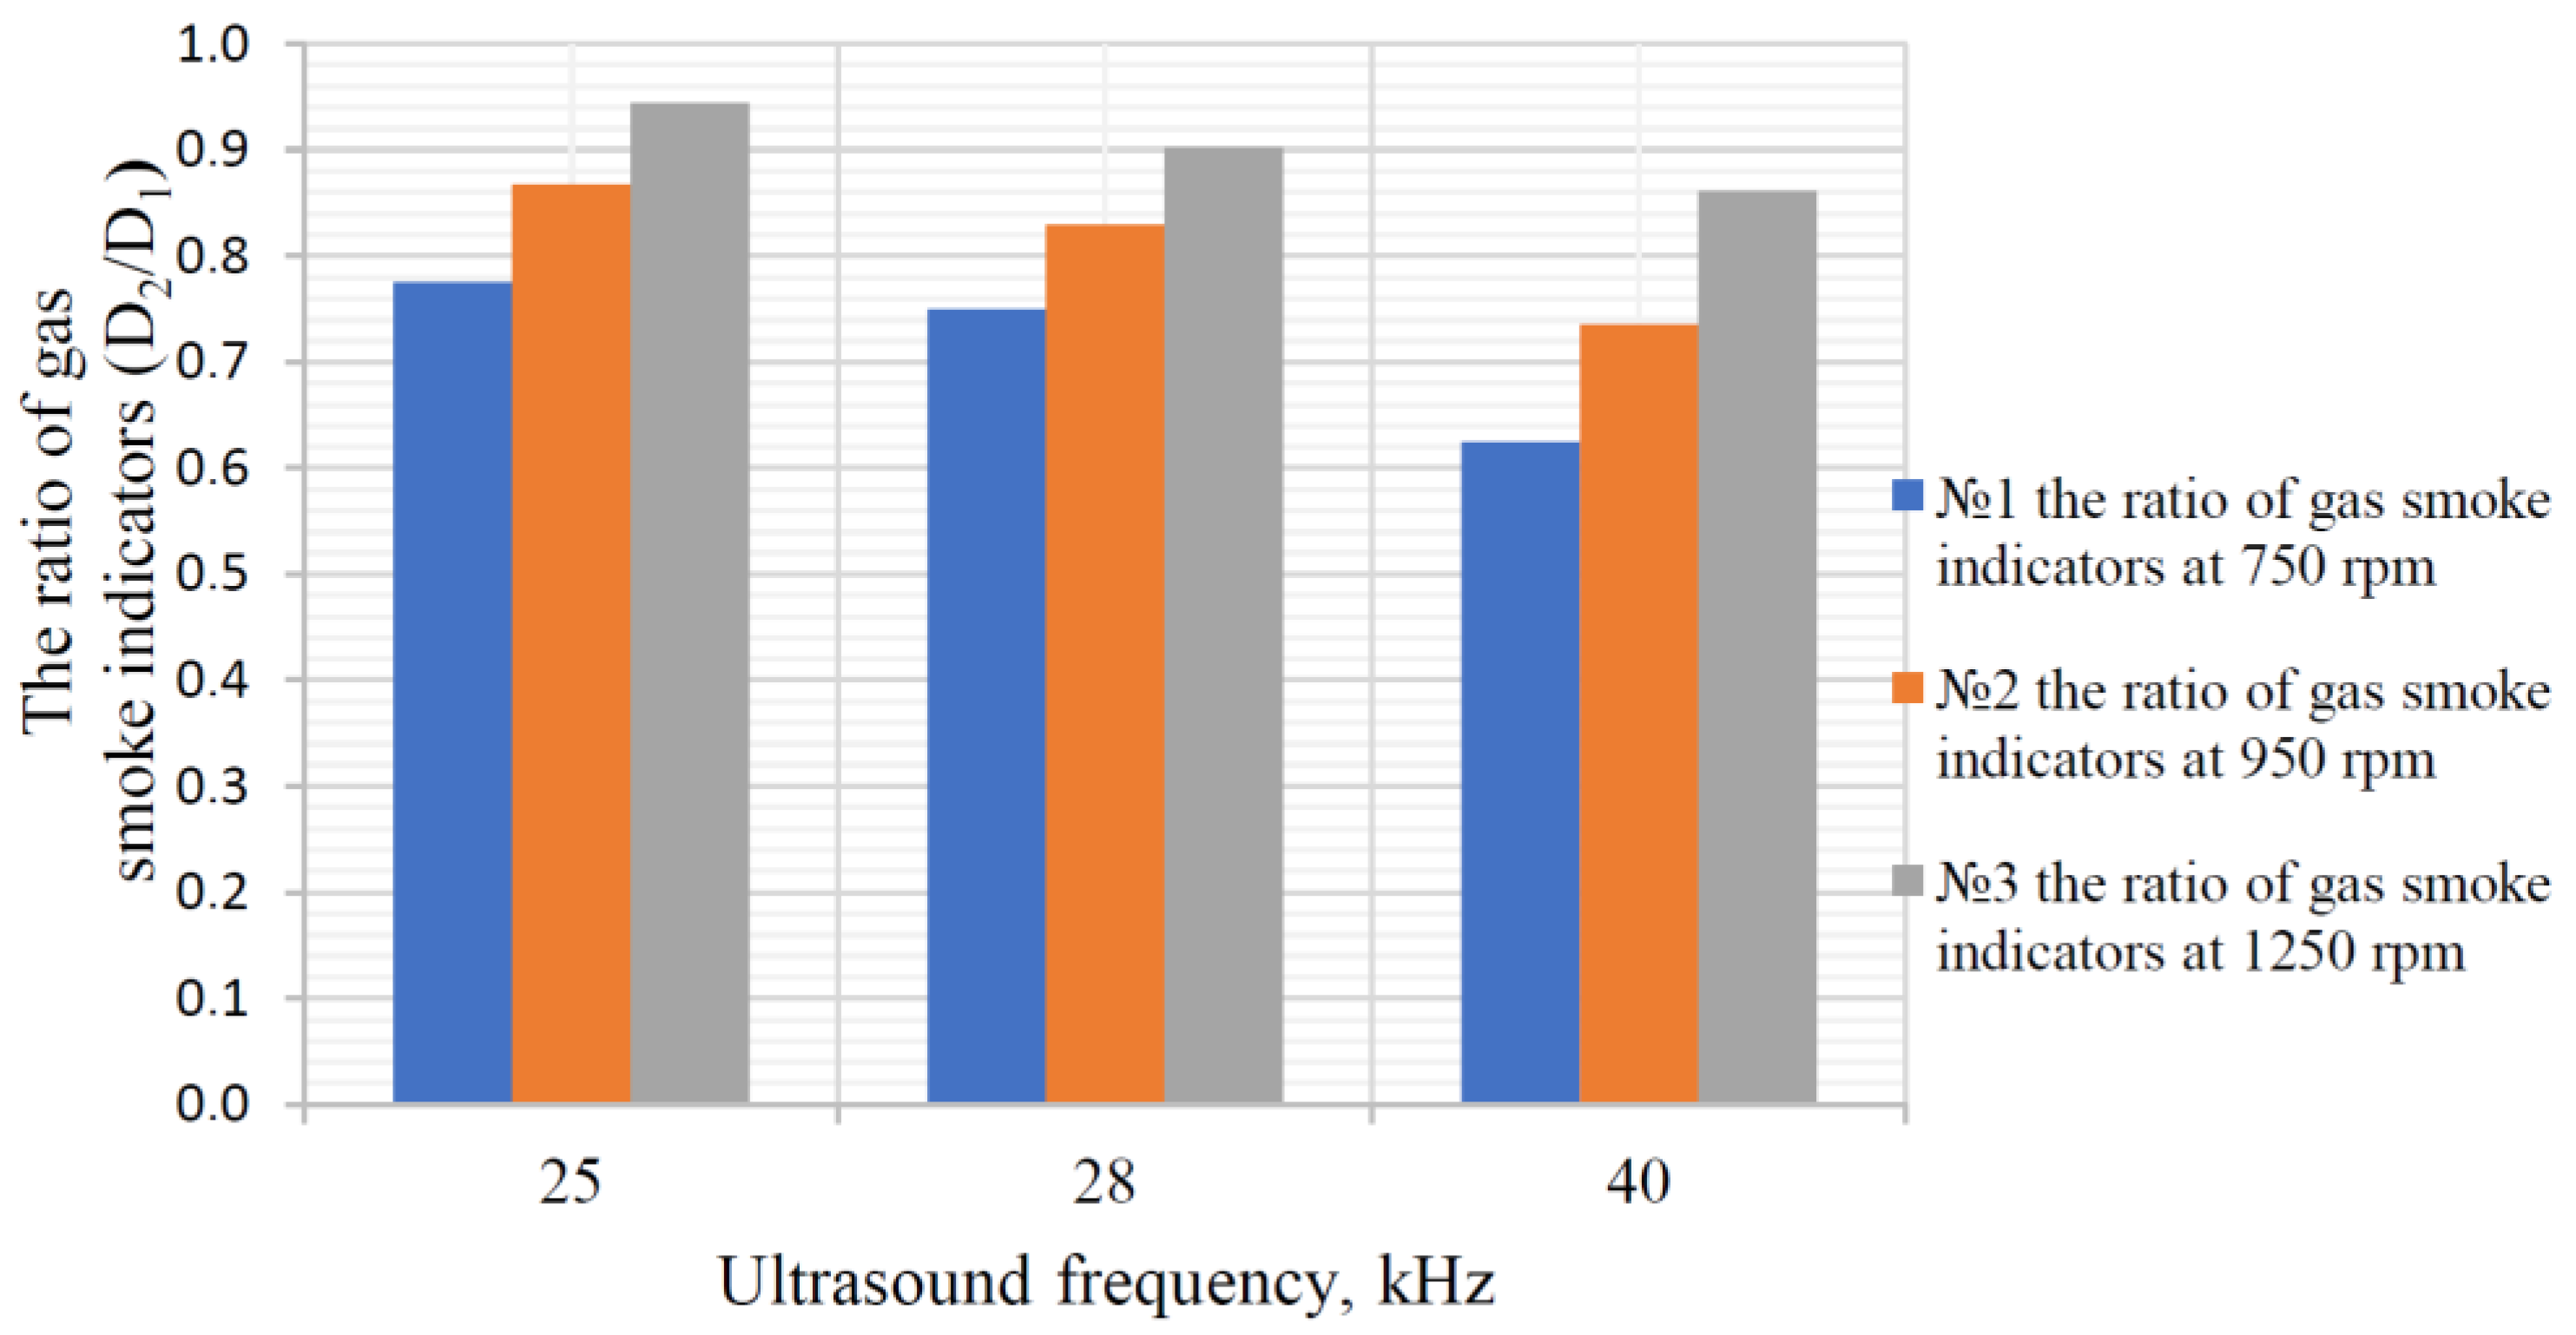
Based on the obtained experimental values of opacity, their ratio was determined, namely, the ratio of the opacity of the gas under the influence of ultrasound (D2) to the smokiness of the gas not influenced by ultrasound (D1). This ratio corresponds to the criterion of optimal operation of the ultrasonic muffler K, which characterizes the degree of gas purification. The results of the calculations to determine the ratio of the indicators for the smokiness of the gas are shown in Table 6.
Using the calculated indicators for the ratio of the smoke content of the gas, a graph of the dependence of their values on the ultrasound frequency was created (Figure 9).
The diagram in Figure 9 shows that the values for the gas-to-smoke ratio tend to decrease as the ultrasound frequency increases. For example, some of the lowest gas-to-smoke ratio indicators were recorded at the highest ultrasonic frequency of 40 kHz, regardless of the increase in engine crankshaft speed, and gas cleaning efficiency was increased by about 19%. The result obtained is explained by the fact that there is an inverse relationship between the frequency of the ultrasound and the size of the gas particles, with high ultrasound frequencies having a greater effect on small gas particles. At higher ultrasonic frequencies, the small gas particles vibrate with greater intensity and actively participate in the coagulation process, which subsequently leads to more efficient gas purification and a decrease in gas smoke content. A reduction in the smoke content of the gas again fulfills the condition of the optimality criterion, the value of which should tend towards a minimum. Thus, clearer indications of the reduction of the smoke content of the gas can be obtained at a frequency of 40 kHz than at 25 and 28 kHz.
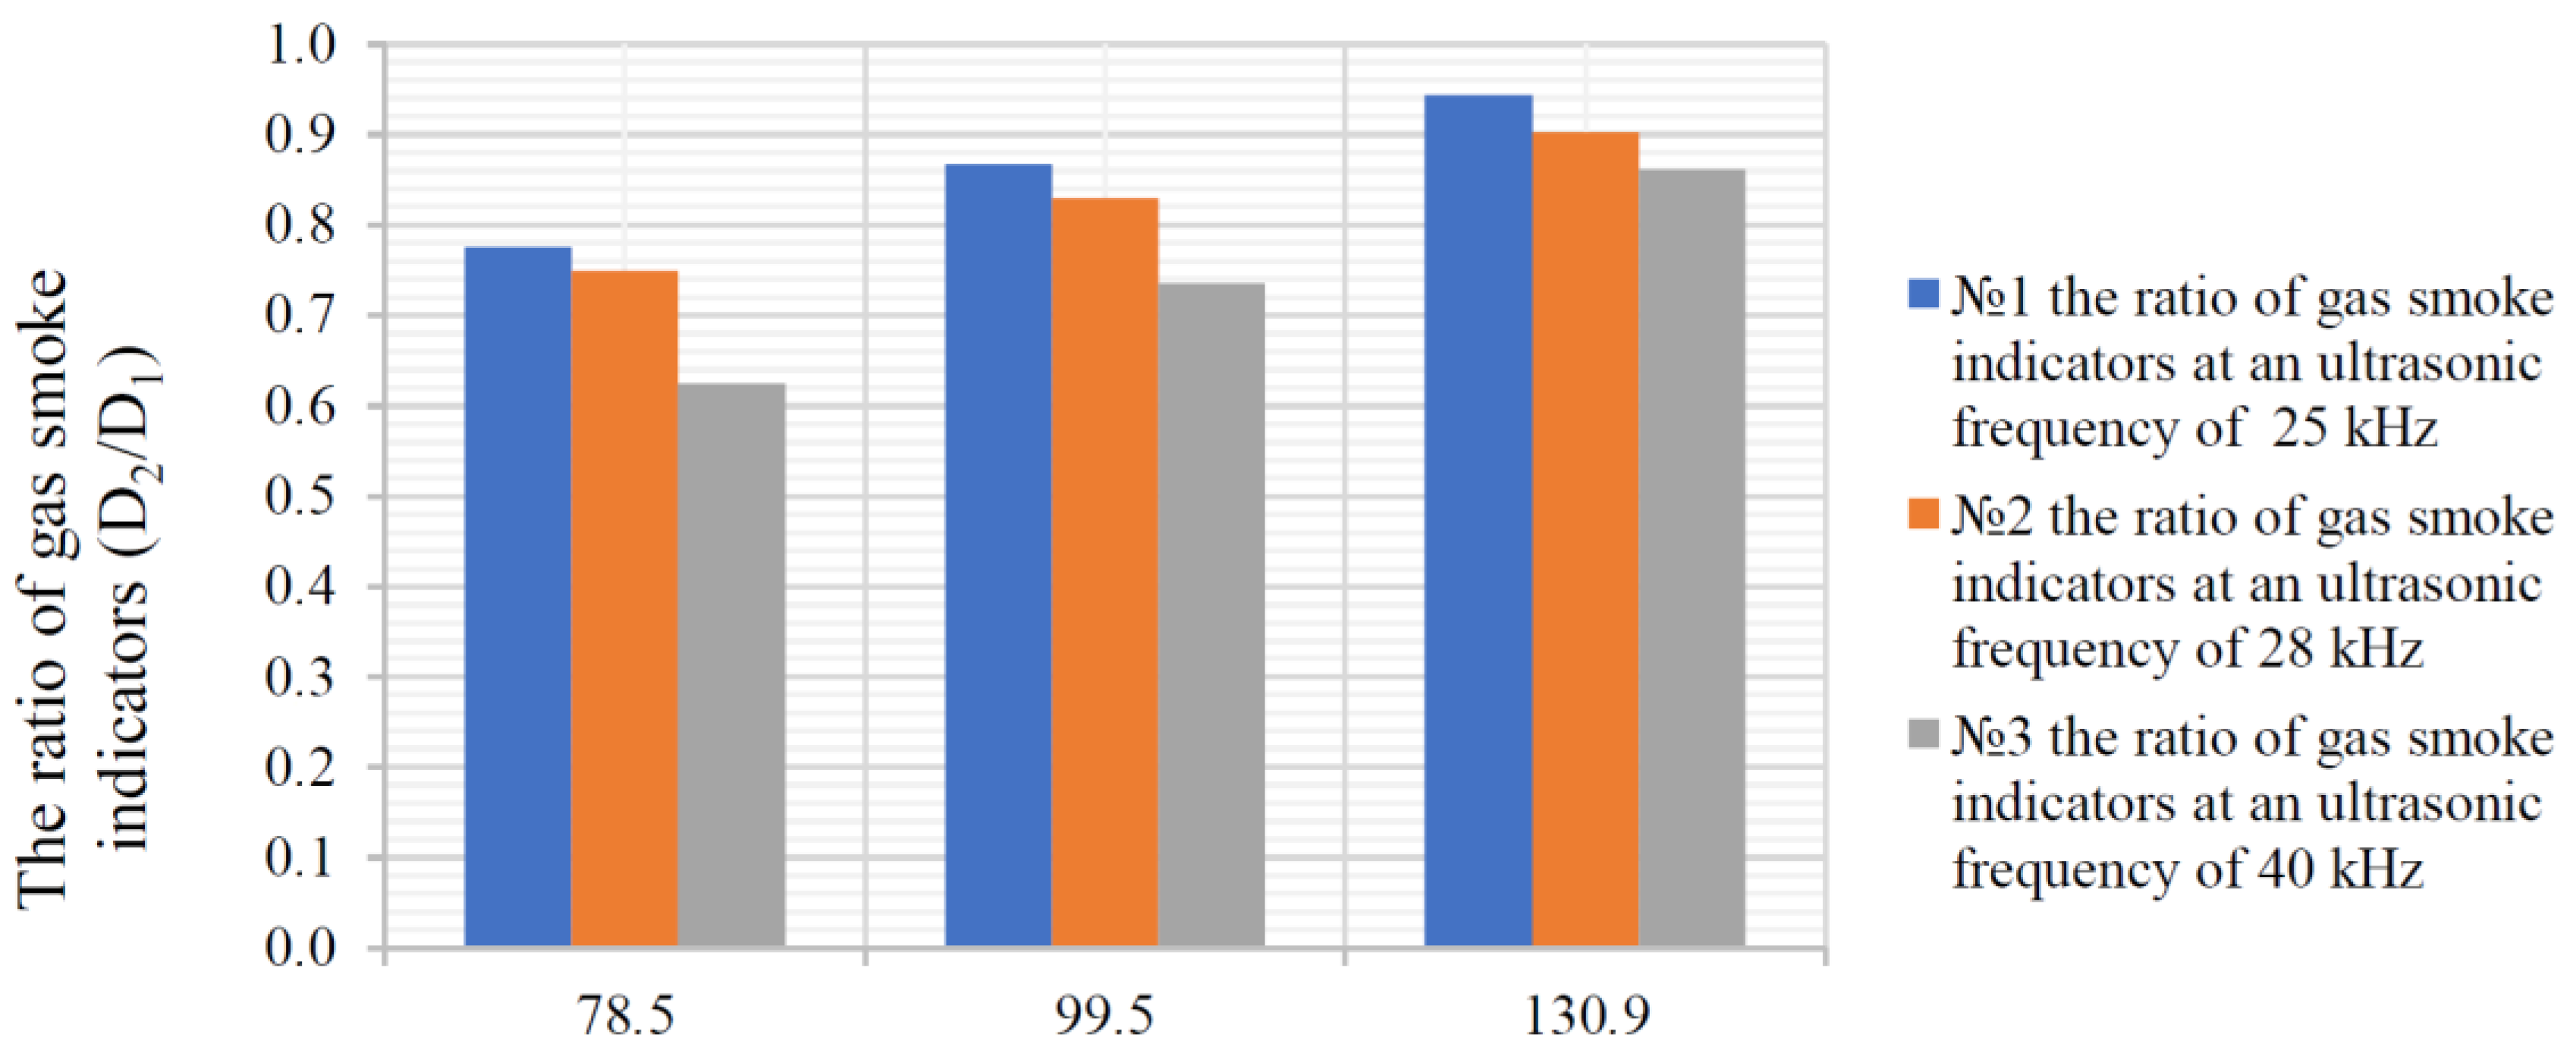
Then, a diagram of the change in the ratio of the gas smoke indicators from the values of the angular velocity of the engine crankshaft at an ultrasonic frequency of 25 kHz, 28 kHz, 40 kHz was recorded. The values of the angular speed of the engine crankshaft were converted from the values of the engine crankshaft speed (Table 7).
From the diagram in Figure 10, the following picture emerges: the lowest values of the ratio of gas smokiness indicators were recorded at 78.5 rad/s. Then, at 99.5 rad/s, there was a significant increase in the values of the ratio of the gas smoke indicators, which reached the maximum points in the diagram at an ultrasound frequency of 25 and 40 kHz. However, a gradual decrease in the values of the ratio of the gas smoke indicators was already observed at 130.9 rad/s and an ultrasound frequency of 25 and 40 kHz. Meanwhile, at an ultrasound frequency of 28 kHz, the ratio of the smoke content of the gas increased further. These results can be explained by the fact that the coagulation process in the gas stream flowing through the muffler does not start immediately, and it takes some time for the particles to stick together and settle, such that particles of different sizes come into contact with each other and form large agglomerates at the same time. Depending on particle size and ultrasound frequency, the duration of the coagulation process may vary. For example, if, at a frequency of 40 kHz, small particles vibrate more intensely and combine more quickly to form large particles, the process of forming large particles is slower at a frequency of 25 kHz. At a frequency of 25 kHz, however, large particles settle more quickly at the bottom of the unit, so that the smoke values of the gas tend to a minimum more quickly than at a frequency of 40 kHz. And, at a frequency of 28 kHz and the angular velocities indicated, the coagulation process is not yet complete and the settling phase of the particles has not yet taken place. Therefore, the coagulation process takes longer at this frequency.
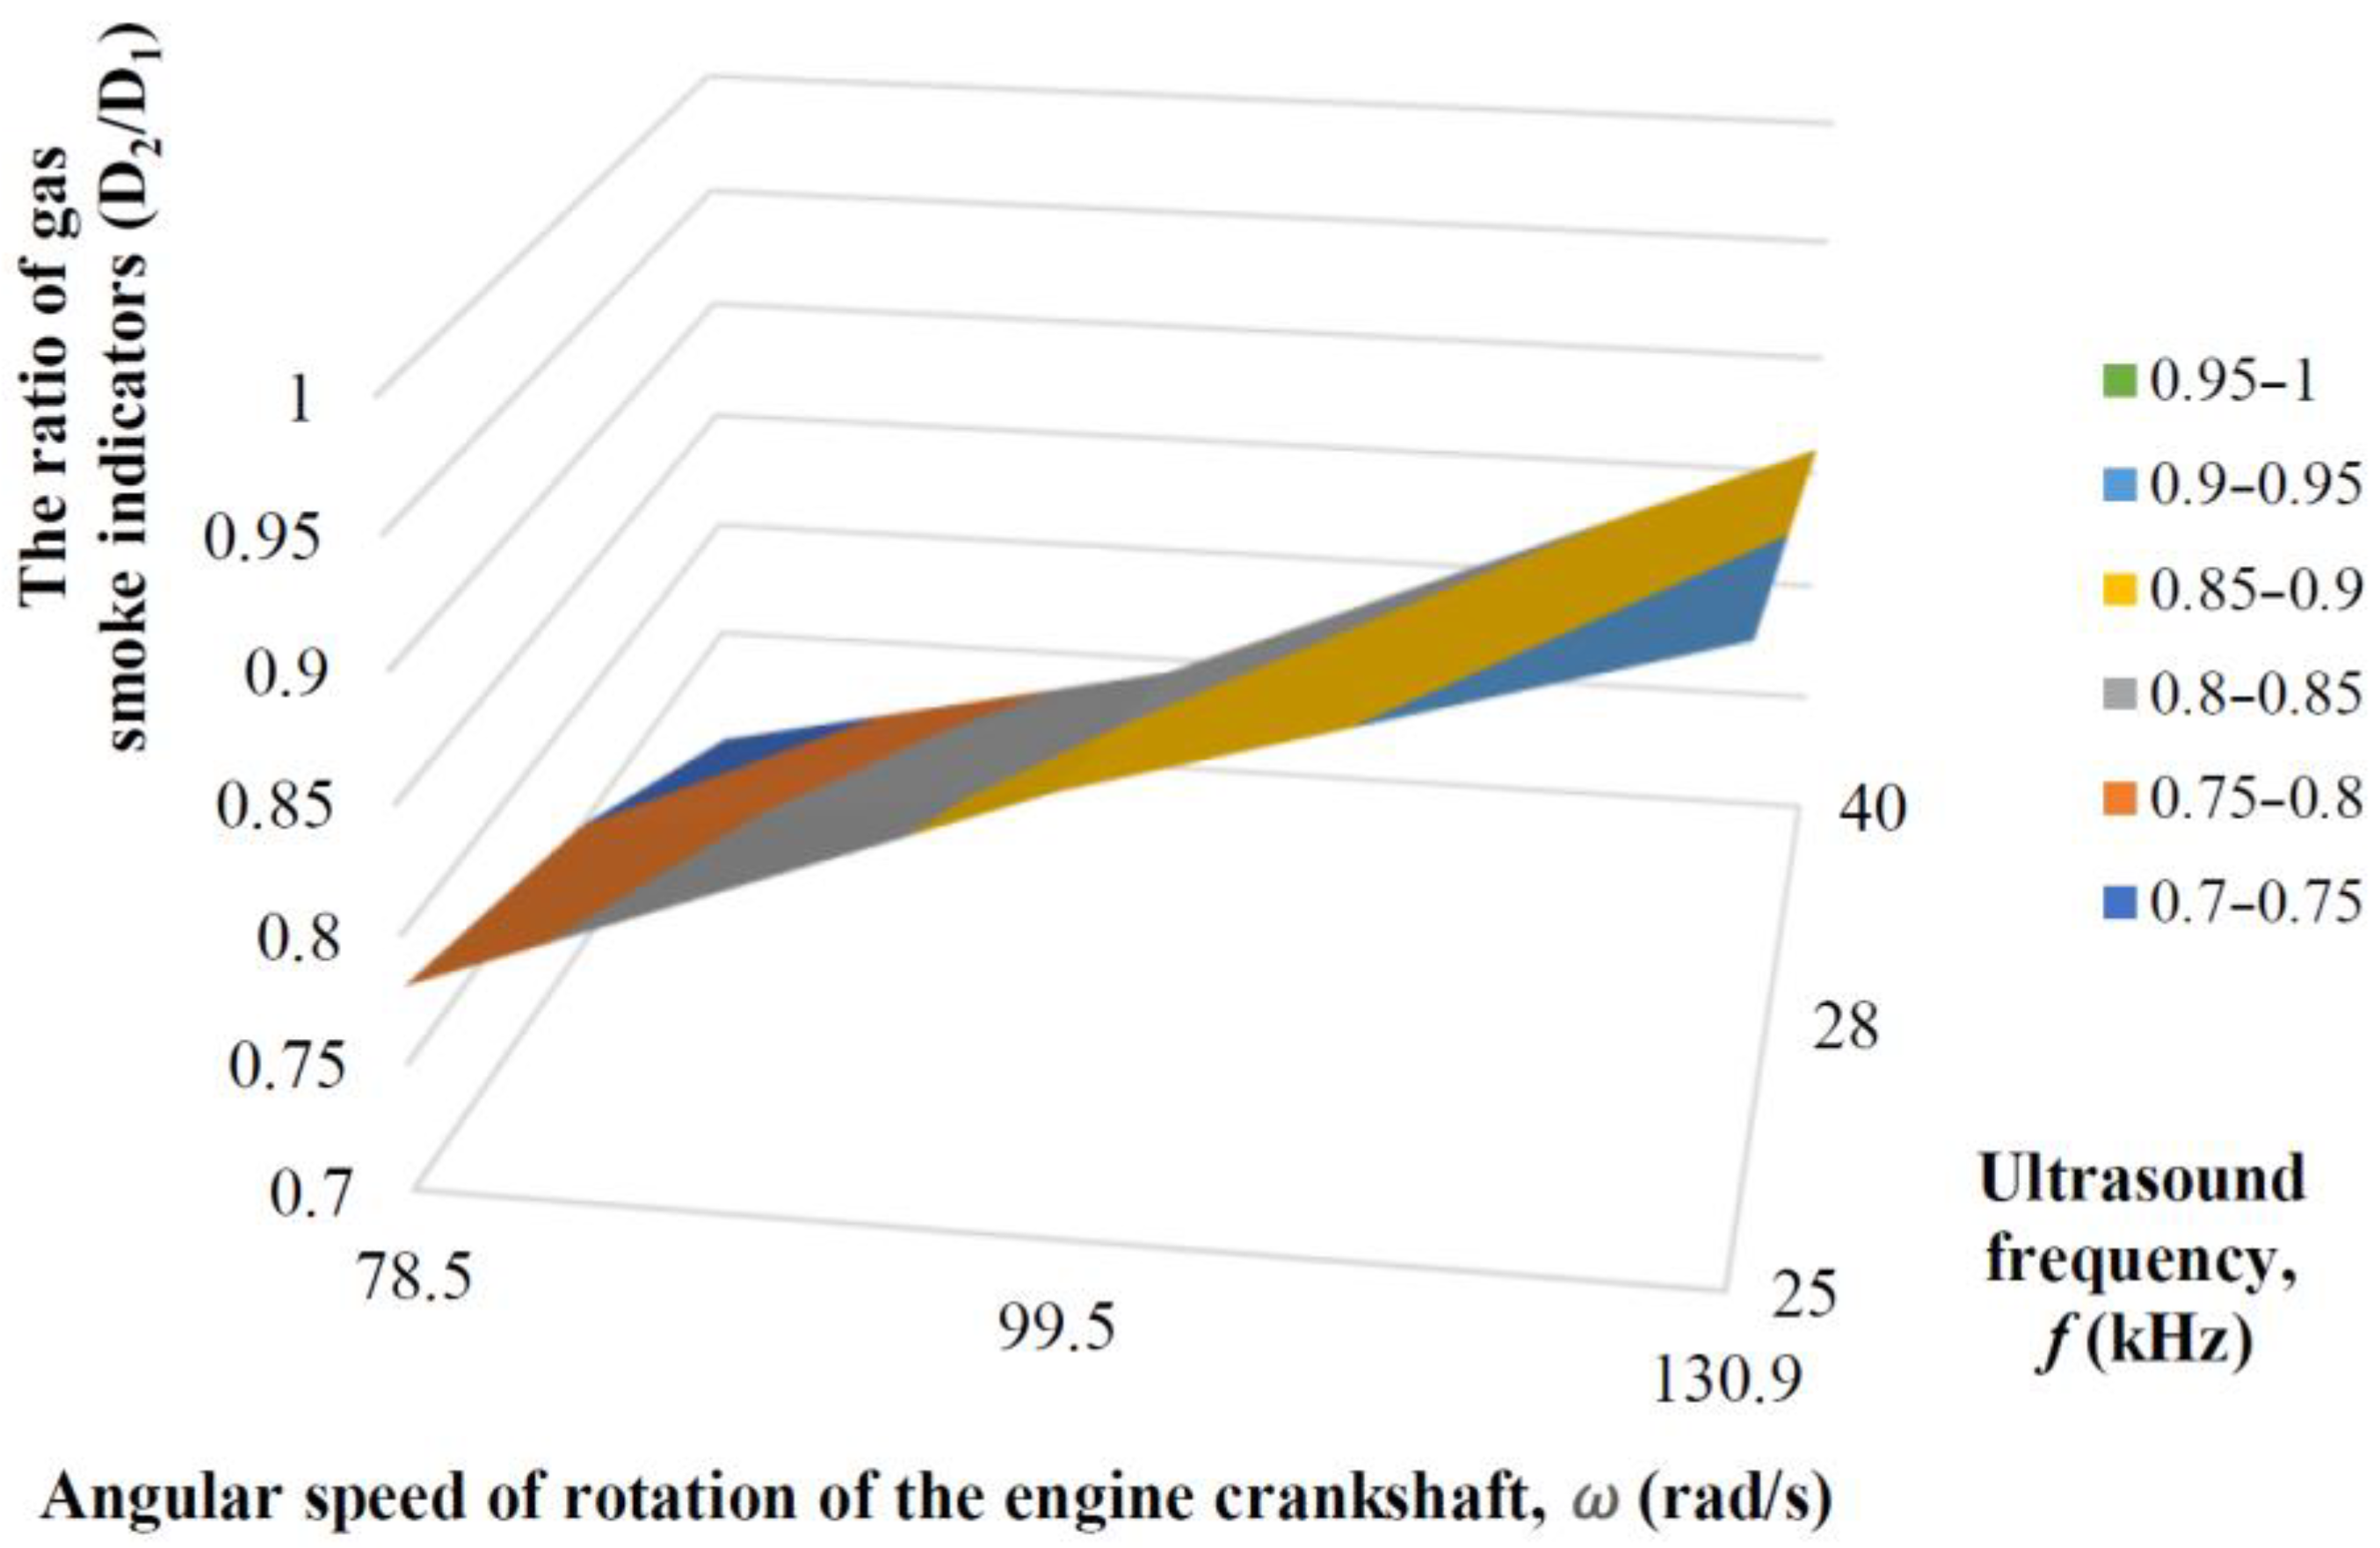
To analyze the complex effect of the ultrasonic frequency parameters and angular velocity of the engine crankshaft on the indicators of the gas–smoke ratio, the following three-dimensional graph was created (Figure 11).
The obtained diagram shows that under the complex influence of the considered parameters, the values of the gas smoke ratio gradually decrease at the ultrasound frequency of 40 kHz. In addition, at this frequency, we recorded relatively minimal values of the gas smoke ratio for various indicators of angular velocity of gas. According to the graph, these values are in the range of 0.87–0.81 at angular velocity 78.5 rad/s, 9.5, and 130.9 rad/s. The data obtained roughly coincide with the results of theoretical calculations.
Furthermore, in order to establish the dependencies between the ratios of the gas smokiness indicators (D2/D1) and the ratios of the ultrasound frequency to the angular rotation speed of the engine crankshaft, f/ω calculations were carried out to determine the values of f/ω. The results of calculations to determine the ratio of f/ω indicators are presented in Table 8.
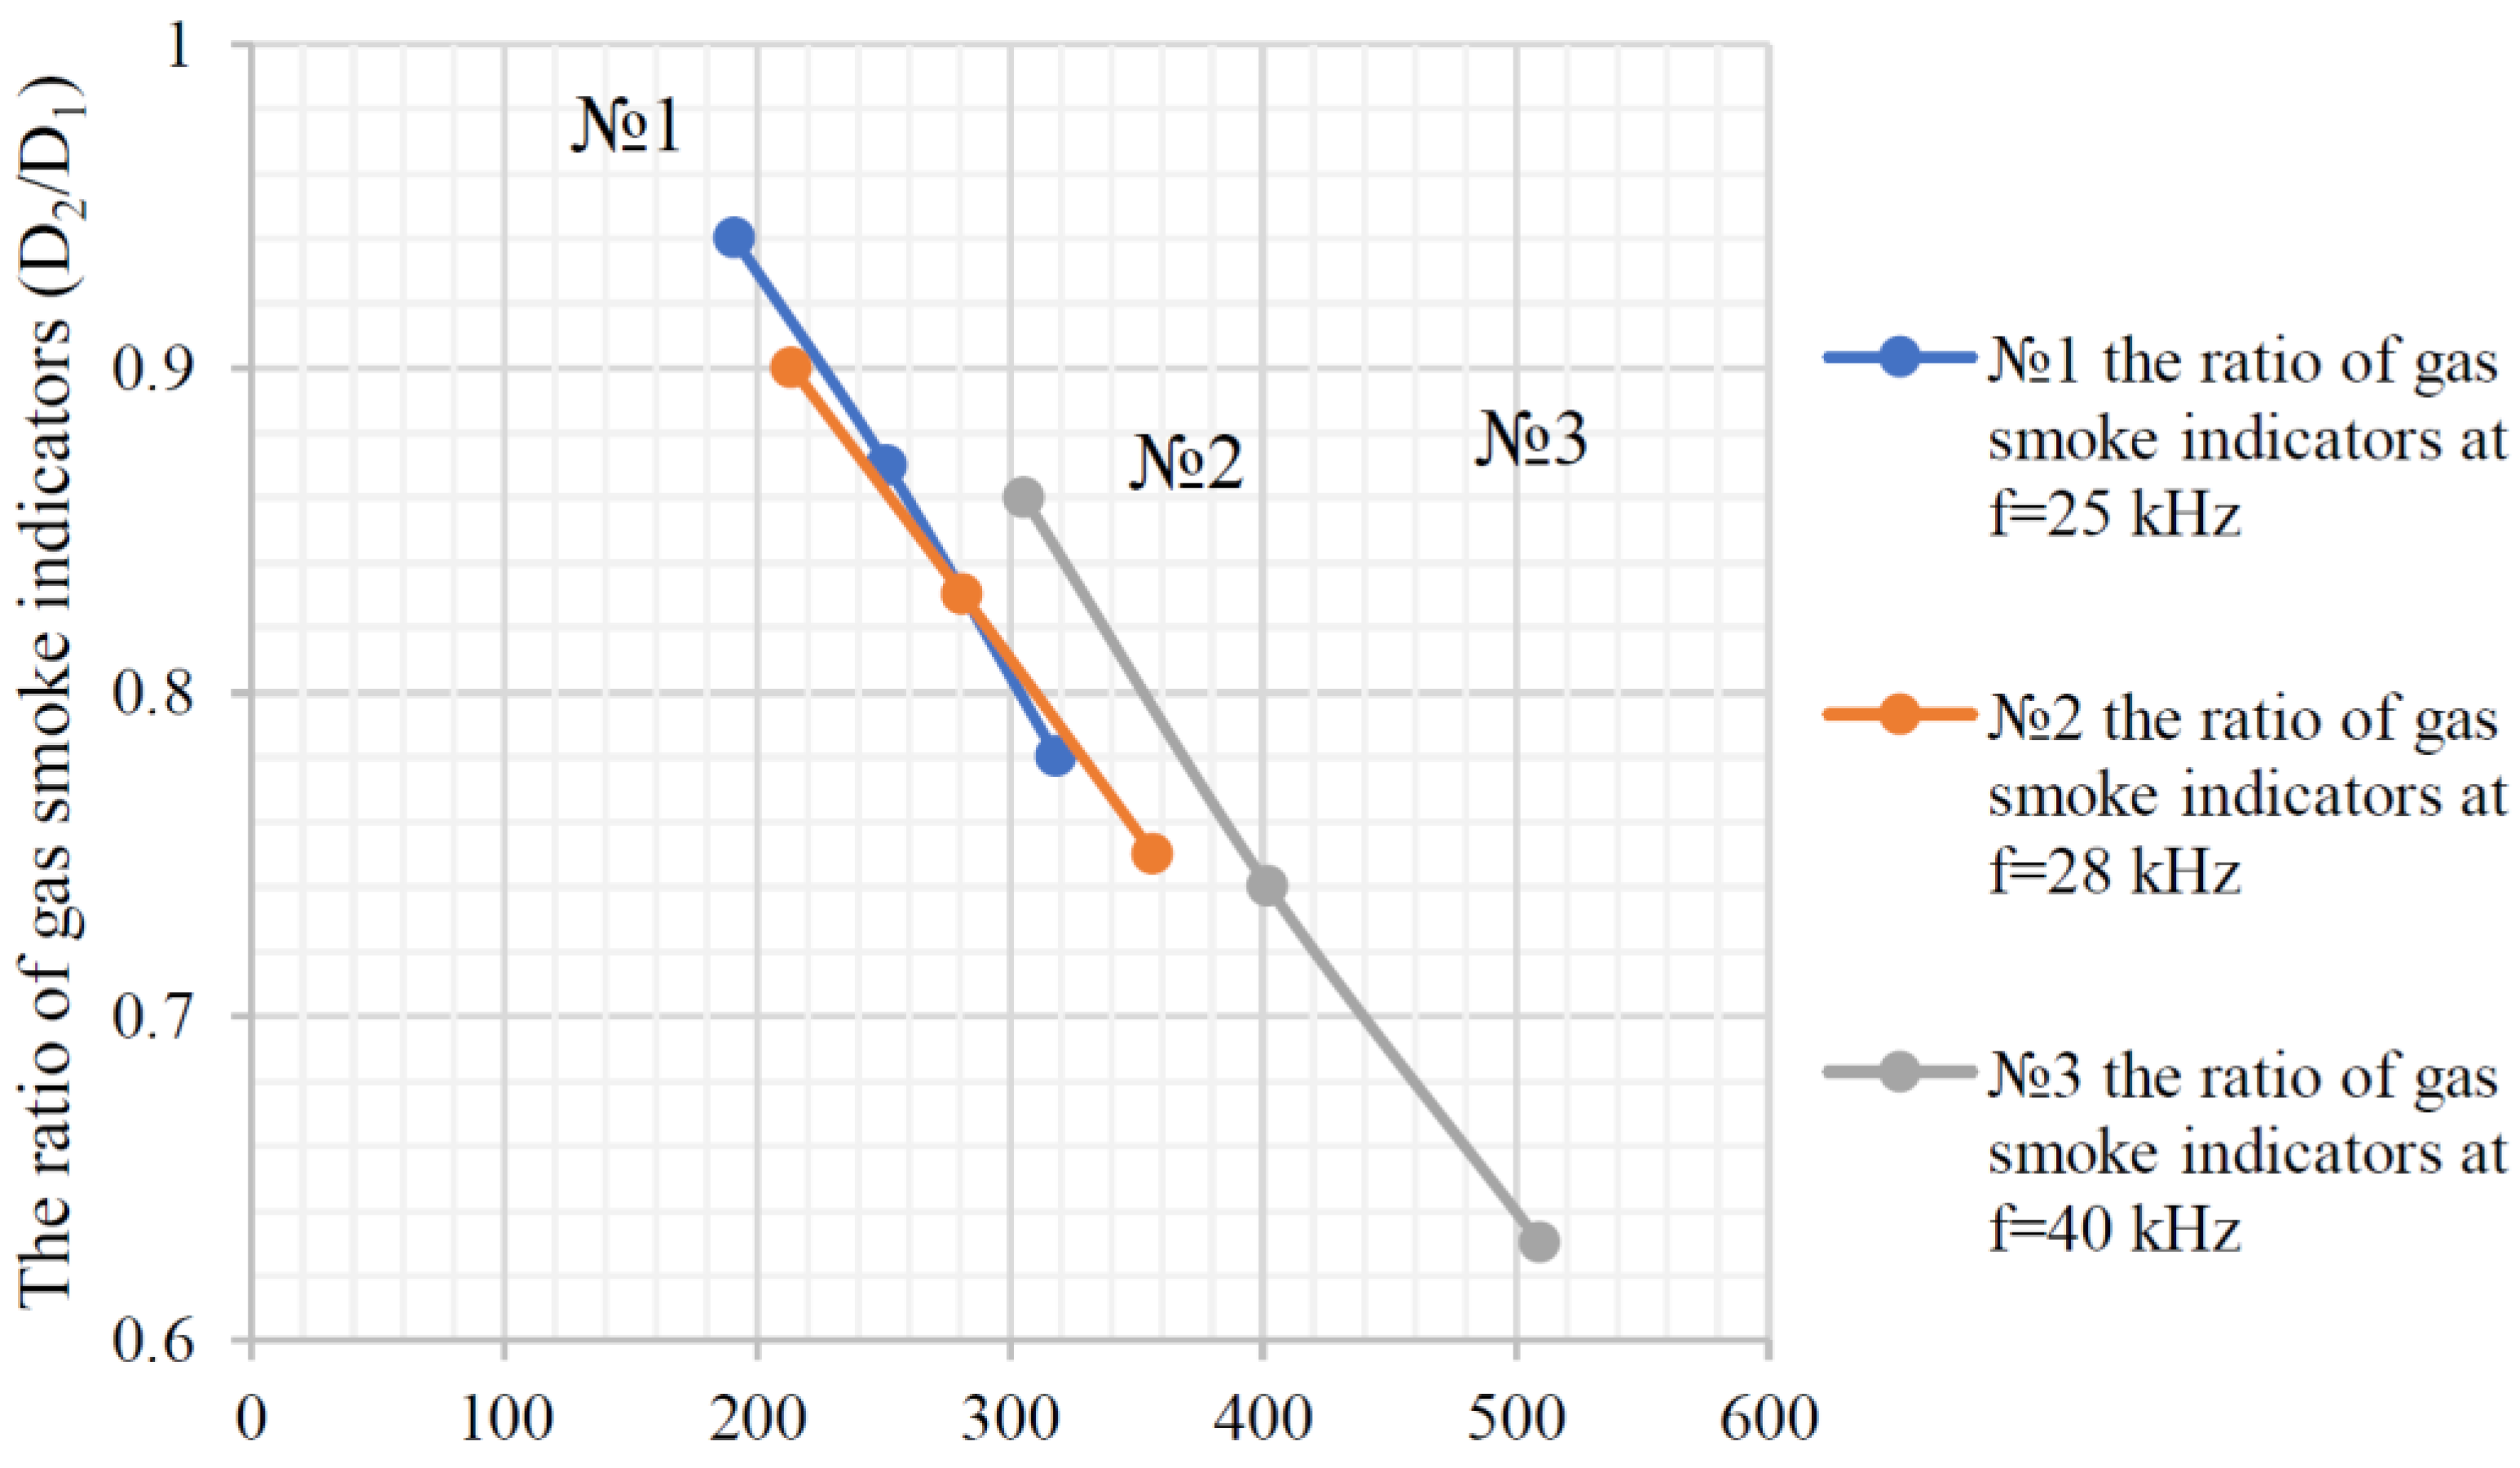
Using the calculated indicators, an f/ω diagram was created showing the dependence of the ratio of the indicators for the smokiness of the gas (D2/D1) on their values (Figure 12).
The diagram in Figure 12 shows that with an increase in the value of f/ω, the ratio of the flue gas indicators decreases. This modification meets the requirements for optimal functioning of the ultrasonic muffler. The lowest value of the smoke ratio, namely, 0.81, was measured at a combination of an ultrasound frequency of 40 kHz and an angular velocity of the engine crankshaft of 130.9 rad/s (at a crankshaft speed of 1250 rpm). The initial value of the gas smoke ratio at 750 rpm and 25 kHz is not taken into account, as these values are related to the engine running-in mode. Under these conditions, the gas purification level was 19%. It can be concluded that the optimal operating parameters of the full-size stand determined during the experiments correspond to the ultrasonic frequency of 40 kHz in all values of the crankshaft speed. These parameter values correspond to the condition of the criterion of optimal operation of the ultrasonic muffler and provide a minimum value for the ratio of the exhaust gas indicators [48,49,50,51,52].
Because it is impossible to maintain the frequency of rotation of the crankshaft, it is necessary to reach the ratio f/ω by changing the frequency of the ultrasonic generator f. This change can be achieved as follows:
-
Changing the frequency ω leads to changing the pressure in the muffler;
-
The pressure change is fixed by the pressure sensor, and the signal from it is transmitted to the ultrasonic generator;
-
The frequency f changes while maintaining a constant ratio f/ω.

4. Conclusions

The results of the studies described in this article present a new approach to cleaning exhaust gases from internal combustion engines based on the use of ultrasonic transmitters in a car muffler. The authors analyzed the theoretical aspects of the effect of ultrasound on gases, taking into account the work of Smoluchowski, Einstein, and other scientists. However, the existing theoretical provisions are limited to the consideration of the Brownian motion of particles in a gas and do not take into account the influence of forces and pressure during ultrasonic exposure on the gas flow in the car muffler. In addition to Brownian motion, hydrodynamic particle motion is also observed in the muffler, and turbulence may occur in the gas flow. As a result, the proposed theories cannot fully capture the physical nature of the processes that take place inside the muffler.
This study involved a mathematical analysis of the passage of gas particles in a muffler through an ultrasonic field, creating a physical picture of the process taking into account the forces acting on the particles during the movement. The results of the analysis of the equation of motion of a particle in an ultrasonic field justified the need for an experimental study and allowed us to identify independent experimental parameters: the angular velocity of rotation of the engine crankshaft and the frequency of oscillation of the ultrasonic wave. To evaluate the efficiency of gas cleaning in an ultrasonic field, the authors proposed an optimality criterion based on the ratio of exhaust smoke before and after ultrasonic exposure.
The results of the experiment showed that the introduction of an ultrasonic transmitter into the muffler reduced the smoke content of the gas, increased the oxygen content, and reduced the amount of carbon dioxide in the exhaust gases. With an increase in the ratio between the ultrasonic frequency and the angular velocity of the engine crankshaft (f/ω), the smoke content of the gas also decreased. In particular, at the maximum values of ultrasonic frequency and angular velocity of the engine crankshaft selected in the experimental studies, the minimum value of the ratio of gas smoke indicators was achieved, and the degree of purification was 10–13%. Such results correspond to the condition of optimal operation of the ultrasonic muffler, where the ratio of gas to smoke values should tend to a minimum. These results confirm the potential of using ultrasound as a method for cleaning exhaust gases and underline the need for further research in this area.
The perspective of this research is focused on the possibility of creating a system for regulating the parameter f/ω while maintaining its necessary parameters. This allows to minimize the values of D2/D1. Thus, this study represents an important contribution to the development of new methods of exhaust gas purification, and its results may contribute to a more efficient and environmentally friendly operation of vehicles.

Author Contributions

Conceptualization, A.K. (Adil Kadyrov), B.S., M.B. and A.K. (Aliya Kukesheva); methodology, A.K. (Adil Kadyrov), M.B., B.S. and A.K. (Aliya Kukesheva); software, S.N.; validation, S.N.; formal analysis, S.N.; investigation, A.K. (Adil Kadyrov), B.S., M.B. and A.K. (Aliya Kukesheva); resources, A.K. (Adil Kadyrov) and B.S.; data curation, A.K. (Adil Kadyrov); writing—original draft preparation, A.K. (Adil Kadyrov), B.S., M.B. and A.K. (Aliya Kukesheva); writing—review and editing, S.N., B.S. and A.K. (Aliya Kukesheva); visualization, A.K. (Aliya Kukesheva); supervision, A.K. (Adil Kadyrov) and M.B.; project administration, B.S.; funding acquisition, B.S. All authors have read and agreed to the published version of the manuscript.

Funding

This research has been funded by the Science Committee of the Ministry of Science and Higher Education of the Republic of Kazakhstan, Grant No. AP15473335, “Development and research of ultrasonic method of exhaust gas purification of internal combustion engines of transport equipment”.

Institutional Review Board Statement

Not applicable.

Informed Consent Statement

Not applicable.

Data Availability Statement

The data are contained within this article.

Acknowledgments

We express our gratitude to the Science Committee of the Ministry of Science and Higher Education of the Republic of Kazakhstan for the grant provided.

Conflicts of Interest

The authors declare no conflicts of interest.

References

  1. Asaduzzaman, M.; Ali, M.H.; Pratik, N.A.; Lubaba, N. Exhaust heat harvesting of automotive engine using thermoelectric generation technology. Energy Convers. Manag. X 2023, 19, 100398. [Google Scholar] [CrossRef]
  2. Bönnen, D.; Bamdad-Soufi, D.; Steinkilberg, H.; Abram, K. Possibilities and Constraints for Lightweight in Exhaust Systems. In Proceedings of the 8th International Styrian Noise, Vibration, Harshness Congress (ISNVH), Graz, Austria, 2–4 July 2014; pp. 81–97. [Google Scholar]
  3. Huang, L.; Simon, T.; Zhang, M.; Yeom, T.; North, M.; Cui, T.H. Noise Measurements and Reduction for High-Frequency Vibrating Devices in the Application of Cooling Electronics. In Proceedings of the ASME International Mechanical Engineering Congress and Exposition, Houston, TX, USA, 9–15 November 2012; pp. 1497–1504. [Google Scholar]
  4. Kang, I.S.; Yang, S.M. Effect of Confluence Geometry of Dual Exhaust System on Quietness and Power. Int. J. Automot. Technol. 2021, 22, 27–36. [Google Scholar] [CrossRef]
  5. Lin, T.-H.; Deng, J.; Chen, Y.-C. Using Response Surface for Searching the Nearly Optimal Parameters Combination of the Foam Concrete Muffler. Materials 2022, 15, 8128. [Google Scholar] [CrossRef] [PubMed]
  6. Pereira, R.L.; Lopes, H.N.; Moura, M.S.; Pavanello, R. Multi-domain acoustic topology optimization based on the BESO approach: Applications on the design of multi-phase material mufflers. Struct. Multidiscip. Optim. 2023, 66, 25. [Google Scholar] [CrossRef]
  7. Singh, A.K.; Gupta, A.; Kannan, C. Design and Optimization of a Performance Muffler for a Formula SAE Vehicle. SAE Int. J. Engines 2021, 14, 235–245. [Google Scholar] [CrossRef]
  8. Yan, T.P. The Research of Vehicle Emissions Control New Technology. In Proceedings of the International Conference on Mechatronics, Robotics and Automation (ICMRA 2013), Guangzhou, China, 13–14 June 2013; pp. 2183–2186. [Google Scholar]
  9. Kim, H.-S. Effect of exhaust manifold geometry and engine parameters on flow pulsations inside the exhaust system with CCC under firing conditions. J. Mech. Sci. Technol. 2021, 35, 805–813. [Google Scholar] [CrossRef]
  10. Kliewe, P.; Laurain, A.; Schmidt, K. Shape optimization in acoustic–structure interaction. Eng. Comput. 2022, 39, 172–200. [Google Scholar] [CrossRef]
  11. Pascale, A.; Mancini, S.; Fernandes, P.; Coelho, M.C.; Guarnaccia, C. Single vehicles’ noise emission curves analysis by means of first and second derivatives. Appl. Acoust. 2023, 211, 14. [Google Scholar] [CrossRef]
  12. Shi, Q.Q.; Yang, Y.Z.; Zhao, Z.; An, B.W.; Tian, P.Y.; Jiang, C.C.; Deng, K.; Jia, H.; Yang, J. Research and design of broadband muffler based on second-order Helmholtz resonators. In Proceedings of the 3rd International Conference on Machinery, Materials Science and Engineering Applications (MMSE 2013), Wuhan, China, 20–21 June 2013; p. 35. [Google Scholar]
  13. Zhang, J.; Luo, J.; Fu, A.; Zhang, G.; Yang, D. Minimization of noise annoyance from exhaust-system tailpipes through acoustic signal analysis. Appl. Acoust. 2023, 214, 9. [Google Scholar] [CrossRef]
  14. Xiao, S.; Cheng, S. Research on noise control of automobile exhaust system under idling condition based on modal analysis. Adv. Mech. Eng. 2023, 15, 17. [Google Scholar] [CrossRef]
  15. Agudelo, A.F.; García-Contreras, R.; Agudelo, J.R.; Armas, O. Potential for exhaust gas energy recovery in a diesel passenger car under European driving cycle. Appl. Energy 2016, 174, 201–212. [Google Scholar] [CrossRef]
  16. Xie, J.L. Research on Integration Design of Automobile Waste Heat Thermoelectric Generation Exchanger and Engine Muffler. Appl. Mech. Mater. 2014, 494–495, 51–54. [Google Scholar] [CrossRef]
  17. Guther, T.; Bönicke, H.; Ament, C.; Augustin, S.; Fröhlich, T. A model-based temperature estimator for improving sensor dynamics in vehicle exhaust systems. In Proceedings of the 39th Annual Conference of the IEEE Industrial-Electronics-Society (IECON), Vienna, Austria, 10–14 November 2013; pp. 3852–3857. [Google Scholar]
  18. Shi, D.; Wang, Y.; Peng, H. Finite element and experimental analysis of pinion bracket-assembly of three gorges project ship lift. J. Cent. South Univ. 2015, 22, 1307–1314. [Google Scholar] [CrossRef]
  19. Shi, Q.; Yang, Y.Z.; Mei, Z.J.; Lin, Y.Y.; Li, X.Y.; Tian, P.Y.; Kong, P.; Jia, H.; Yang, J.; Deng, K. Design and demonstration of composite mufflers based on dissipative and reactive units. Eng. Res. Express 2023, 5, 11. [Google Scholar] [CrossRef]
  20. Giechaskiel, B.; Melas, A.; Martini, G.; Dilara, P. Overview of Vehicle Exhaust Particle Number Regulations. Processes 2021, 9, 2216. [Google Scholar] [CrossRef]
  21. Folkson, R. Alternative Fuels and Advanced Vehicle Technologies for Improved Environmental Performance towards Zero Carbon Transportation Introduction; Woodhead Publishing Series in Energy; Woodhead Publ. Ltd.: Cambridge, UK, 2014; pp. 1–15. [Google Scholar]
  22. Rojan, M.A.; Alias, Z.; Bakar, S.A.; Hashim, S. Enhancement of MODENAS CT115’S motorcycle muffler performance by optimization of backpressure. In Proceedings of the 6th International Conference on Applications and Design in Mechanical Engineering (ICADME), Penang, Malaysia, 26–27 August 2019. [Google Scholar]
  23. Nurkusheva, S.; Bembenek, M.; Berdychowski, M.; Gajdzik, B.; Wolniak, R. An Analysis of the Correct Frequency of the Service Inspections of German Passenger Cars—A Case Study on Kazakhstan and Poland. Vehicles 2024, 6, 553–570. [Google Scholar] [CrossRef]
  24. Donghui, X.; Lin, L.Y.; Jingfeng, D. Experimental Study of Automotive Gasoline Engine Exhaust Gas Recirculation. In Proceedings of the 2013 Fourth International Conference on Digital Manufacturing & Automation, Qingdao, China, 29–30 June 2013; IEEE: Piscataway, NJ, USA, 2013; pp. 575–581. [Google Scholar]
  25. Oak Ridge National Laboratory for the U.S. Department of Energy and the U.S. Environmental Protection Agency. Available online: https://www.fueleconomy.gov/feg/climate.shtml (accessed on 27 May 2024).
  26. EDGAR—2023 Emissions Database for Global Atmospheric Research; European Commission: Ispra, Italy, 2023.
  27. Yadav, J.; Deppenkemper, K.; Pischinger, S. Impact of renewable fuels on heavy-duty engine performance and emissions. Energy Rep. 2023, 9, 1977–1989. [Google Scholar] [CrossRef]
  28. Chlebnikovas, I.; Jasevičius, R. Air Pollution with Fine Particles in Closed Parking and Theoretical Studies of the Interaction of Inhaled Particles in Respiratory Tract. Buildings 2022, 12, 1696. [Google Scholar] [CrossRef]
  29. Kim, S.; Dominici, F.; Buckley, T. Concentrations of vehicle-related air pollutants in an urban parking garage. Environ. Res. 2007, 105, 291–299. [Google Scholar] [CrossRef]
  30. Akgunduz, A.; Kazerooni, A. A non-time segmented modeling for air-traffic flow management problem with speed dependent fuel consumption formulation. Comput. Ind. Eng. 2018, 122, 181–188. [Google Scholar] [CrossRef]
  31. Kilikevičienė, K.; Chlebnikovas, A.; Matijošius, J.; Kilikevičius, A. Investigation of the acoustic agglomeration on ultrafine particles chamber built into the exhaust system of an internal combustion engine from renewable fuel mixture and diesel. Heliyon 2023, 9, 6. [Google Scholar] [CrossRef] [PubMed]
  32. Cocean, I.; Cocean, A.; Iacomi, F.; Gurlui, S. City water pollution by soot-surface-active agents revealed by FTIR spectroscopy. Appl. Surf. Sci. 2020, 499, 7. [Google Scholar] [CrossRef]
  33. Rakhmatov, R.; Galevko, V.; Nadareishvili, G.; Zuzov, V. Improvement of acoustic features of catalytic mufflers. Akustika 2021, 39, 232–236. [Google Scholar] [CrossRef]
  34. Arjunan, A.; Baroutaji, A. Sound pressure level of a Formula 3 car and the influence of detachable muffler-tip. Results Eng. 2021, 11, 8. [Google Scholar] [CrossRef]
  35. Lee, J.H.; Lee, H.J.; Sunwoo, M. Nonlinear sliding mode observer for exhaust manifold pressure estimation in a light-duty diesel engine. Int. J. Automot. Technol. 2014, 15, 377–386. [Google Scholar] [CrossRef]
  36. Liu, F.; Sun, C.H.; Li, Y.K.; Shang, Y. Performance Analysis and Optimization Design of Exhaust System for Turbocharging Diesel Engines. Int. J. Automot. Technol. 2021, 22, 735–745. [Google Scholar] [CrossRef]
  37. Ibatov, M.K.; Kadyrov, A.S.; Balabaev, O.T.; Askarov, B.S.; Pak, I.A. Device for Ultrasonic Cleaning of Exhaust Gases. RK Patent 3194, 2 October 2017. [Google Scholar]
  38. Savinykh, Y.A.; Logachev, V.G.; Logachev, S.V.; Vasilyeva, A.Y. Method of Cleaning Exhaust Gas from Particles. Patent RU 2 364 736 C2, 20 August 2009. [Google Scholar]
  39. Ma, Z.H.; Chen, X.P.; Gao, D.W.; Xu, B. The CFD Analysis of Exhaust Runner for GW15 Gasoline Engine. In Proceedings of the 3rd International Conference on Advances in Materials Manufacturing (ICAMMP 2012), Beihai, China, 22–23 December 2012; p. 326. [Google Scholar]
  40. Bałon, P.; Cieslik, J.; Halama, L.; Kielbasa, B.; Lach, T.; Lesinski, M.; Lajczak, D.; Rejman, E. A method of manufacturing car mufflers by wrapping sheets, using innovative forming device with the use of servo drive. In Proceedings of the 18th International Conference on Metal Forming, Krakow, Poland, 13–16 September 2020; pp. 17–21. [Google Scholar]
  41. Chen, F. Optimization design of muffler based on acoustic transfer matrix and genetic algorithm. J. Vibroeng. 2014, 16, 2216–2223. [Google Scholar]
  42. Kashikar, A.; Suryawanshi, R.; Sonone, N.; Thorat, R.; Savant, S. Development of muffler design and its validation. Appl. Acoust. 2021, 180, 10. [Google Scholar] [CrossRef]
  43. Wu, C.; Chen, L.; Ni, J.; Xu, J. Modeling and experimental verification of a new muffler based on the theory of quarter-wavelength tube and the Helmholtz muffler. Springerplus 2016, 5, 14. [Google Scholar] [CrossRef]
  44. Guhan, C.P.; Arthanareeswaren, G.; Varadarajan, K.N. CFD Study on Pressure Drop and Uniformity Index of Three Cylinder LCV Exhaust System. In Proceedings of the International Conference on Computational Heat and Mass Transfer-2015, Warangal, India, 30 November–2 December 2015; pp. 1211–1218. [Google Scholar]
  45. Shvydkiy, V.S.; Ladygichev, M.G. Gas Purification; Teploenergetik: Moscow, Russian Federation, 2002; 640p. [Google Scholar]
  46. Baldev, R.; Rajendran, V.; Palanichami, P. Applications of Ultrasound; Technosphere: Moscow, Russia, 2006; ISBN 5-94836-088-1. [Google Scholar]
  47. Bergman, L. Ultrasound and Its Application in Science and Technology; Publishing House of Foreign Literature: Moscow, Russia, 1957. [Google Scholar]
  48. Shi, L.M.; Jia, G.H.; Zhang, Z.F.; Xu, Z.M. Analysis and Research of the Combustion Process of YN4100QB Diesel Engine. In Proceedings of the 3rd International Conference on Machinery, Materials Science and Engineering Applications (MMSE 2013), Wuhan, China, 20–21 June 2013; p. 35. [Google Scholar]
  49. Dong, S.; Lipkens, B.; Cameron, T.V. The effects of orthokinetic collision, acoustic wake and gravity on acoustic agglomeration of polydisperse aerosols. J. Aerosol Sci. 2006, 37, 540–553. [Google Scholar] [CrossRef]
  50. Breed, D.S. Vehicular Information and Monitoring System and Method. U.S. Patent US7082359B2, 25 July 2006. [Google Scholar]
  51. Varga, A.J.; Breed, D.S.; Duvall, W.E. Method for Identifying the Presence and Orientation of an Object in a Vehicle. U.S. Patent US5943295A, 25 August 1999. [Google Scholar]
  52. Kadyrov, A.; Sarsembekov, B.; Ganyukov, A.; Suyunbaev, S.; Sinelnikov, K. Ultrasonic unit for reducing the toxicity of diesel vehicle exhaust gases. Commun.-Sci. Lett. Univ. Žilina 2022, 24, 189–198. [Google Scholar] [CrossRef]
Figure 1. Schematic representation of the gas flow in the muffler: 1—the output manifold of the engine; 2—the muffler body; 3—the vector of exhaust gas movement at a speed of ϑ; 4—a single particle of gas mass m; 5—ultrasonic wave; 6—exhaust tube.
Applsci 14 05027 g001
Figure 2. Diagram of the forces acting on gas particles during motion.
Applsci 14 05027 g002
Figure 3. Full-size ultrasonic muffler stand: (a) the image of the stand, (b) the diagram: 1—inlet pipe; 2—muffler body; 3—laser; 4—12 V rectifier; 5—temperature sensor; 6—humidity meter; 7—ultrasonic generator; 8—thermometer-hygrometer; 9—outlet pipe; 10—longitudinal ultrasonic emitter; 11—removable tray; 12—microscope, 13—longitudinal ultrasonic waves.
Applsci 14 05027 g003
Figure 4. Change in oxygen content of O2 in the composition of the gas without exposure and with exposure to ultrasound (at ultrasound frequencies of 25, 28, and 40 kHz).
Applsci 14 05027 g004
Figure 5. Change in carbon dioxide content CO2 without exposure and with exposure to ultrasound (at ultrasound frequencies 25, 28, and 40 kHz).
Applsci 14 05027 g005
Figure 6. Indicators of gas smokiness depending on the change in engine crankshaft speed (ultrasound frequency of 25 kHz).
Applsci 14 05027 g006
Figure 7. Indicators of gas smokiness depending on the change in engine crankshaft speed (ultrasound frequency of 28 kHz).
Applsci 14 05027 g007
Figure 8. Indicators of gas smokiness depending on the change in engine crankshaft speed (ultrasound frequency of 40 kHz).
Applsci 14 05027 g008
Figure 9. Change in the ratio of gas smoke values based on ultrasonic frequency values (at engine crankshaft speeds of 750, 950, and 1250 rpm).
Applsci 14 05027 g009
Figure 10. The change in the relationship between the smoke content of the gas and the values of the angular velocity at the ultrasound frequency of 25 kHz, 28 kHz, and 40 kHz.
Applsci 14 05027 g010
Figure 11. Change in the ratio of the indicators of the flue gas depending on the complex effect of the parameters f and ω.
Applsci 14 05027 g011
Figure 12. Change in the ratio of the gas smoke content from the values of the ratio of the ultrasound frequency to the angular speed of the engine crankshaft, f/ω.
Applsci 14 05027 g012
Table 1. Technical characteristics of the Mercedes-Benz M-Class ML 270 CDI MT engine.
ParametersValue
Year of manufacturing2003
Millage, km153,000
Engine capacity, cm32685
Type of supply fuelDiesel
Engine’s typeIn-line, 5-cylinder
Supercharger typeTurbine
Maximum power, HP (kW) at rpm163 (120)/4200
Maximum torque, N·m (kg·m) at rpm370 (38)/2800
Number of valves per cylinder4
Compression ratio18
Cylinder diameter, mm88
Piston stroke, mm88.3
Additional engine informationDOHC
Ecological engine typeEuro-3
Country of assemblyAustria
Table 2. Results of experimental tests of the content of O2 and CO2 in the gas composition.
Engine Crankshaft Speed, rpmO2, %CO2, %
Ultrasound Frequency, kHz
Without252840Without252840
75018.5618.6718.7018.631.401.381.381.36
95018.5618.9718.9718.981.401.381.371.36
128018.5618.5618.5318.501.401.401.401.39
Table 3. Results of experimental tests of the content of CO and CH in the gas composition.
Engine Crankshaft Speed, rpmCO, %CH, ppm
Ultrasound Frequency, kHz
Without252840Without252840
7500.020.020.020.010.020.000.000.00
9500.020.020.020.020.020.000.000.00
12800.020.010.010.010.020.020.020.02
Table 4. Results of the experimental tests of the indicators for gas fumigation.
Engine Crankshaft Speed, (rpm)
7509501250
Smokiness, %
Ultrasound Frequency (kHz)Without Exposure to UltrasoundWith Exposure to UltrasoundWithout Exposure to UltrasoundWith Exposure to UltrasoundWithout Exposure to UltrasoundWith Exposure to Ultrasound
25403153467268
28403053447265
40402553397262
Table 5. Results for determining temperature, humidity, and exhaust gas velocity in an ultrasonic muffler.
OptionsWithout UltrasoundUltrasound Frequency, kHz
252840
Temperature
(°C)
47.64747.548
Humidity
(%)
15151515
Gas speed
(m/s)
Input 18
Output 10.3
Input 18
Output 10.3
Input 18
Output 10.3
Input 18
Output 10.3
Table 6. Results of the calculations of the ratio of the indicators of gas smokiness.
Engine Crankshaft Speed, rpm7509501250
Ultrasound frequency (kHz)The ratio of the indicators for the smokiness of the gas (D2/D1)The ratio of the indicators for the smokiness of the gas (D2/D1)The ratio of the indicators for the smokiness of the gas (D2/D1)
250.780.870.94
280.750.830.90
400.630.740.86
Table 7. Values for the angular velocity of the engine crankshaft.
Engine crankshaft speed, rpm7509501250
Angular speed of the engine crankshaft ω, rad/s78.599.5130.9
Table 8. Calculation results of the ratio of the ultrasound frequency to the angular speed of the engine crankshaft f/ω.
ParametersValue
Angular speed of the engine crankshaft ω, rad/s78.599.5130.9
The ratio of the indicators for the smokiness of the gas (D2/D1) at the ultrasound frequency, kHz0.89/25 kHz0.95/25 kHz0.94/25 kHz
0.9/28 kHz0.92/28 kHz0.93/28 kHz
0.87/40 kHz0.91/40 kHz0.91/40 kHz
The ratio of the ultrasound frequency to the angular rotation speed of the engine crankshaft, f/ω318.5251.3190.98
356.7281.4213.9
509.6402.01305.57
Disclaimer/Publisher’s Note: The statements, opinions and data contained in all publications are solely those of the individual author(s) and contributor(s) and not of MDPI and/or the editor(s). MDPI and/or the editor(s) disclaim responsibility for any injury to people or property resulting from any ideas, methods, instructions or products referred to in the content.