Article

Antioxidant Properties of Wafers with Added Pumpkin Seed Flour Subjected to In Vitro Digestion

Department of Biochemistry and Food Chemistry, University of Life Sciences, Skromna Str. 8, 20-704 Lublin, Poland
*
Author to whom correspondence should be addressed.
Appl. Sci. 2024, 14(12), 5129; https://doi.org/10.3390/app14125129
Submission received: 16 May 2024 / Revised: 7 June 2024 / Accepted: 10 June 2024 / Published: 12 June 2024

Abstract

:
In this study, our research aim was to assess the influence of pumpkin seed flour addition on the antioxidant properties, consumer acceptability, functional properties, and texture of wafers. The in vitro gastrointestinal digestion process was used to assess the effectiveness of fortification in terms of the potential bioavailability of phenolic compounds and peptides. The antioxidant activity of the obtained hydrolysates and potentially bioavailable fractions (≤3.5 kDa) was tested. The highest antiradical activity and Fe2+ chelation ability (IC50) were noted for the fraction obtained from wafers with the greatest addition of pumpkin seed flour—Pf4 (0.49 mg/mL for ABTS+*, 3.84 mg/mL for DPPH*, and 2.04 mg/mL for Fe2+ chelation). The addition of pumpkin seed flour caused the color of the wafers to change to a darker one (24.46% differences in L* between C and P4), which influenced consumer ratings. This study shows that adding pumpkin seed flour increases the peptide and phenolic contents of wafers (1.13 mg/mL and 1.01 mg/mL of peptides and 0.429 mg/mL and 0.351 mg/mL of phenolics for P4 and C hydrolysates, respectively) and enhances their antioxidant activity, with only minimal effects on taste, aroma, crispness, water and fat adsorption capacity, and foaming ability. Fractions ≤ 3.5 kDa showed greater antioxidative activity than hydrolysates, and the addition of pumpkin seed flour improved these properties. To sum up, pumpkin seeds are a valuable source of antioxidant compounds (phenolic compounds and peptides) and can be used to enrich various products.

1. Introduction

In the modern world, changes in human nutrition are becoming increasingly apparent. This is gaining greater importance because, over the past few years, there has been an increase in the number of diet-related diseases such as obesity, overweight, type II diabetes, cancer, and cardiovascular diseases [1,2]. Therefore, there is growing interest in health-promoting food, where significant importance lies in biologically active compounds. Both the flesh and seeds of pumpkin are sources of valuable nutrients, and seeds are often a byproduct of pumpkin processing that end up in landfills. To reduce landfills, it is necessary to upcycle organic waste. One way to use waste is to transform it into useful substances with a wide array of applications [3].
Therefore, the pumpkin fruit has great potential to enrich many food products. Currently, there are many varieties of pumpkins, which differ in shape, size, and, above all, chemical composition [4]. Pumpkins consist of approximately 3.63% seeds, 17.95% peel, and 78.69% flesh, all of which are edible and can be utilized for food purposes [5]. The edible parts of the pumpkin also include flowers and leaves [6,7]. Pumpkin seeds are a rich source of nutrients such as protein (25.9–35.5%), and fats (38–49%) (including omega-3 and omega-6 fatty acids), along with other important substances such as fiber (2.3%), ash (4.1–5.27%), and micro- and macroelements. Pumpkin seeds contain a healthy combination of omega-3 and omega-6, which have benefits for both the heart and the liver. Research also suggests that omega-3 in pumpkin seeds can decrease the risk of thrombosis and arrhythmias [8]. Pumpkin seeds are also a valuable source of biologically active compounds, such as phenolic acids (vanillic, sinapic, p-hydroxybenzoic, caffeic, ferulic, p-coumaric), carotenoids, tocopherols, glycosides, and sterols [9]. Hussain et al. showed a higher content of total phenols and total flavonoids in pumpkin seeds compared to the peel and pulp, and, consequently, higher antioxidant activity [10].
The pumpkin seed proteins are a source of bioactive peptides, i.e., short amino acid chains with various health benefits. These peptides are known for their potential to exert physiological effects beyond basic nutrition. Some bioactive peptides from pumpkin seeds may have antioxidant, antimicrobial, antihypertensive, anticancer, anti-inflammatory, or other health-promoting properties [10,11,12]. They have various physiological activities based on specific amino acid sequences. Bioactive peptides could be released from proteins during digestion, food processing or enzymatic hydrolysis in vitro, autolysis, and microbial fermentation. Several studies have investigated the bioactive peptides derived from pumpkin seeds and their effects on various health conditions [13,14]. Incorporating pumpkin seeds into the diet can provide these bioactive peptides and other essential and biologically active components, making them a valuable addition to a balanced diet.
Whole pumpkin seed flour is nutrient-dense and contains proteins, fiber, unsaturated fatty acids, phytosterols, vitamins, and minerals [9,10]. Pumpkin seed flour has been incorporated in several baked products by replacing wheat flour in biscuits [15], muffins [16], and cookies [17]. Wafers are one of the most popular and important bakery items because they have a low moisture content and a long shelf life, and they are rich in energy but lack the phytonutrients with health benefits [18,19]. In contexts such as this one, enriching food products with valuable and innovative ingredients is a key strategy for filling nutritional gaps, preventing chronic diseases, and promoting overall health [4].
The aim of our study was to evaluate the influence of pumpkin seed flour addition (1 wt. %, 2 wt. %, 3 wt. %, 4 wt. %) on the antioxidant properties and consumer acceptability of wafers. Particular attention was paid to assessing the effectiveness of fortification in terms of the potential bioavailability of phenolic compounds and peptides using a simulated gastrointestinal digestion process. Additionally, the effect of adding pumpkin seed flour to wafers on their functional properties was investigated. Further research is also needed to determine other pro-health benefits of pumpkin seed flour as an additive to bakery products. An attempt should be made to optimize the composition of wafers with increased addition of pumpkin seed flour, while taking into account the acceptability of the product by potential consumers.

2. Materials and Methods

2.1. Research Material

The research material consisted of wafers without and with 1 wt. %, 2 wt. %, 3 wt. %, or 4 wt. % added pumpkin flour (C, P1, P2, P3, and P4, respectively). The defatted pumpkin seed flour was obtained from NaturAvena Company Sp. z o.o. (Piaseczno, Poland). Wafers were produced at the As-Babuni Company Sp. z o.o. production facility in Niemce, Poland. The preparation of wafers consisted of mixing the following ingredients: 50 kg of flour (type 500: average 14.3 g of protein/100 g; ash 0.5 g/100 g; humidity 13.5%), 65 L of water, 3 L of oil, 2.15 kg of milk powder, 0.4 kg of ammonium carbonate, 0.4 kg of baking powder, 1 kg of whey, and 0.9 L of lecithin. After obtaining a uniform consistency, the wafers were baked at a temperature of 142 °C (diameter 12.0 cm) (Figure 1).

2.2. The Consumer Evaluation

The evaluation was conducted with the participation of semi-trained judges familiar with wafer quality indicators, which included a 34-member group of employees and students from the University of Life Sciences in Lublin. The qualitative indicators subjected to evaluation were overall appearance, surface, color, taste, odor, consistency (crispness), and consistency (hardness). The quality indicators are listed in Table 1. Wafers were assessed for their quality using a five-point hedonic scale:
  • Score 1—poor quality level;
  • Score 2—insufficient quality level;
  • Score 3—sufficient quality level;
  • Score 4—good quality level;
  • Score 5—very good quality level.

2.3. Determination of Physical Properties

2.3.1. Determination of Color Parameters

The color measurement of the wafers was performed using an Envisense NH310 colorimeter (Lublin, Poland) and the CIELab method (Lab*). In this system
  • The L* component indicates the brightness of the product;
  • The a* component determines the color of the product ranging from green to red;
  • The b* component determines the color of the product ranging from blue to yellow.
The total color difference (ΔE) of the tiles was calculated using the following formula:
Δ E = L * L 0 * 2 + a * a 0 * 2 + b * b 0 * 2
where
  • L*, a*, and b* are color parameters of tested wafers;
  • L 0 * , a 0 * , and b 0 * are color parameters of control wafers.
This study was conducted in 3 replications for each wafer without and with the addition of pumpkin flour. The device was calibrated on a white standard before conducting the measurements. Delta E (ΔE) values were calculated using the calculator at http://colormine.org/delta-e-calculator (accessed on 15 May 2024).

2.3.2. Determination of Texture Profile

In the present study, a texture analyzer (TA-XT Plus, Stable Micro Systems Ltd., Surrey, UK) was used to assess the texture profile for wafer samples. The texture profile was analyzed using Exponent Connect Texture Analyser software (version 6,2,4,0). For texture evaluation, namely, the force required to break the wafer, tests were performed using a 2 mm diameter cylindrical stainless-steel probe. Wafers’ hardness and distance (fracturability) were derived from the penetration curve. The textural parameters recorded were hardness and fracturability. Measurements included ten replications per each wafer type.

2.3.3. Functional Properties

Water Absorption Capacity (WAC)

The WAC of the prepared samples was determined according to the method described by Zielińska et al. [20]. In this way, 30 mL of distilled water was added to 1 g of the tested sample. Then, the samples were shaken for 5 min on a multi-function rotator. The prepared mixture was then centrifuged for 15 min at 8000× g (MPW-350R, MPW MED. INSTRUMENTS, Warsaw, Poland). The unbound water was poured off and the test tubes and the sediment were weighed. Determinations were made in three repetitions for each tested sample.
Water absorption was calculated using the following formula:
W A C = c b × 100 W
where
  • WAC—water absorption (%);
  • W—weight (g);
  • b—mass of the empty test tube (g);
  • c—mass of the test tube with wet sediment (g).

Oil Absorption Capacity (OAC)

The OAC was determined according to Zielińska et al.’s approach [20] with modifications. In our method, 12.5 mL of refined rapeseed oil was added to 1 g of the tested sample and shaken for 15 min. Then, it was centrifuged at 15,000× g for 15 min. After centrifugation, the unabsorbed fat was poured off and the tubes were left for 10 min upside down and then weighed. The determination was performed in three repetitions for each tested sample. Fat absorption was calculated using the following formula:
O A C = c b × 100 W
where
  • OAC—oil absorption (%);
  • W—weight (g);
  • b—mass of the empty test tube (g);
  • c—mass of the test tube with absorbed fat (g).

Foaming Efficiency and Foam Stability

Here, 1 g of the sample was mixed with 99 mL of distilled water and homogenized for 1 min at 10,000 rpm. After whipping, the foam was immediately poured into a 250 mL measuring cylinder. The foaming capacity (FC) was determined by comparing the foam volume (mL) with the initial liquid volume of samples, while the foam stability (FS) was measured by comparing the foam volume at 30 min with the initial foam volume of samples. The foam stability (FS %) was calculated using the following formula:
F S = e f × 100 %
where
  • FS—foam stability (%);
  • e—foam volume after 30 min (mL);
  • f—total foam volume (mL).

2.4. In Vitro Hydrolysis

In vitro digestion of the wafers was carried out with the method described by Durak et al. and Karaś et al. [21,22]. Fractions were isolated from the obtained hydrolysates using semi-permeable membranes with a 3.5 kDa cut-off (SERVAPOR 3 dialysis tubing, MWCO 3500) (SERVA Electrophoresis GmbH, Heidelberg, Germany) for 1.5 h at 37 °C. The ≤3.5 kDa fractions were lyophilized and stored at −20 °C until further analysis.

2.5. Peptide Content Determination

The peptide content was determined before and after each digestion stage using the TNBS reagent [23]. L-leucine was used as a standard.

2.6. Total Phenolic Content Determination

The determination of phenolic compounds was carried out using the Folin–Ciocalteu method [24].
A total of 100 μL of the sample was mixed with 200 μL of Folin–Ciocalteu phenol reagent (1:5 in redistilled H2O) and 1 mL of 10% Na2CO3. After incubation for 30 min in the dark, absorbance values against a blank, containing solvent against the sample, were recorded at 735 nm. The amount of total phenolic content was calculated in the gallic acid equivalent (GAE) as the mean ± standard deviation (SD) of three replicates.

2.7. Antioxidant Activity

2.7.1. Antiradical Activity against ABTS+•

The antiradical activity against ABTS+• was determined with the method described by Re et al. [25].

2.7.2. Antiradical Activity against DPPH*

The antiradical activity against DPPH* was determined with the method described by Brand-Wiliams et al. [26].

2.7.3. Fe2+ Chelating Ability

The ability to chelate iron(II) ions was determined according to the Decker and Welch method [27].

2.7.4. Reducing Power

The antioxidant activity was determined by applying a reducing power assay [28]. The reducing power was calculated as the Trolox equivalent.

2.8. Statistical Analysis

All determinations were performed in triplicate. Statistical analysis was carried out using STATISTICA 13.1 for mean comparison (ANOVA), using Tukey’s test at the significance level α = 0.05.

3. Results

3.1. The Consumer Evaluation and Physical Properties of Wafers

Control wafers and those fortified with pumpkin seed flour were subjected to consumer evaluation. The color of wafers is one of the most significant characteristics in their appearance, as it has a decisive impact on the attractiveness of the product.
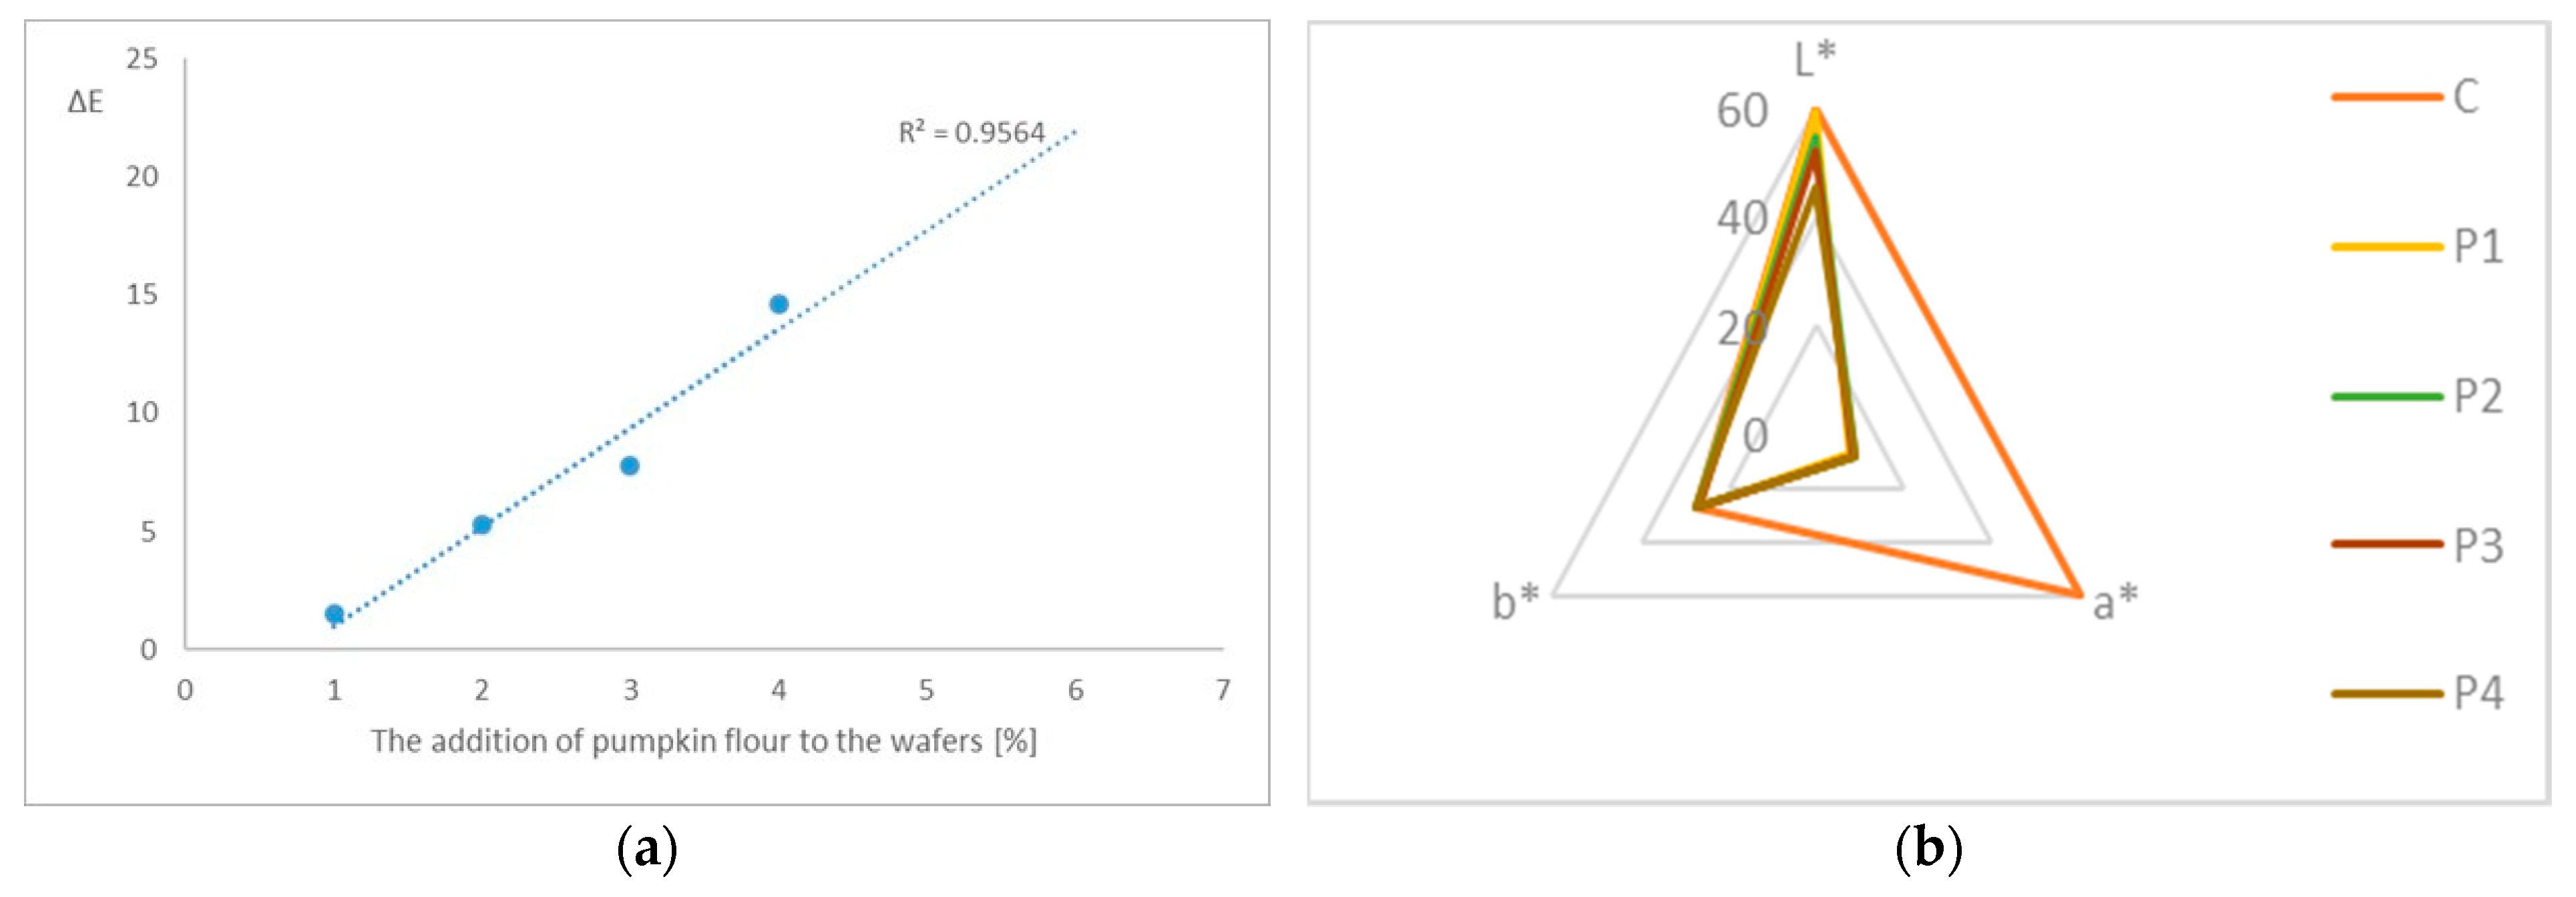
In terms of the “color”, the testers noted that the wafer containing 4 wt. % pumpkin flour had the most pronounced hue, while the control wafer exhibited the least intensity. This result was expected, since pumpkin seeds have a green color, and the finding was corroborated by the results of the instrumental color evaluation (Table 2, Figure 2). When analyzing the graph in Figure 3, it can be seen that the consumer analysis of the wafers (the line connecting all the midpoints of the descriptors of the samples) trended according to the percentage of pumpkin flour added to their formulation. The samples were statistically different in the descriptors “color” and general appearance. Regarding the remaining descriptors, there were no significant statistical differences. The effect of pumpkin seed flour addition on the smell, taste, surface, hardness, and fragility of the wafers was relatively small, indicating that it would not affect the deliciousness of the wafers. Addition of pumpkin flour to the wafers influenced the product’s color, as evidenced by the results obtained during the experiment conducted. The parameter L* corresponds to the brightness of the product. As shown in Table 2 and Figure 3, the brightest-colored wafer was C—without the addition of pumpkin flour (average equal to 59.73 ± 0.31 units). Meanwhile, the darkest-colored wafer was P4—with the highest amount of added pumpkin flour (average equal to 45.12 ± 0.79 units). The greater the addition of pumpkin flour, the darker the color of the wafer. The value of parameter a*, determining the color of the product from green to red, varied considerably for individual wafers, and yet the differences were not statistically significant (Table 2). Parameter b*, corresponding to the color of the product from blue to yellow, behaved similarly to parameter a*. It ranged from 27.24 ± 0.79 units to 26.67 ± 1.17 units, with differences not being statistically significant (Table 2).
Delta E values above 2 may indicate noticeable color differences. In the case of wafers with a 2, 3, or 4 wt. % pumpkin flour addition, the delta E values were greater than 2. However, in the case of wafers with 1 wt. % pumpkin seed flour, the delta E was 1.5, which meant they were still close to C and would commonly be accepted in most color-critical applications.
Another important property affecting product acceptance is hardness, expressed as the maximum force needed to break the wafer in the mouth. When analyzing the data in Table 2, it can be seen that the amount of pumpkin flour in the wafer composition did not significantly affect the hardness and fracturability of the wafers. Control wafers were characterized by the greatest hardness, while this feature for fortified wafers was similar and did not differ statistically significantly (Table 2). Addition of pumpkin seed flour did not significantly affect fragility in the consumer evaluation of the wafers compared to the control (from 4.55 ± 0.57 for C to 4.03 ± 0.95 for P4, with a significance level of p < 0.05) (Figure 2, Table S1).
The significant functional properties include oil and water absorption, emulsification, foaming, and solubility. In this study, the water and oil absorption capacity, foaming properties, and foam stability of wafers with the addition of pumpkin seed flour were investigated (Table 3). Addition of pumpkin flour had a slight effect on water and oil absorption by the wafers. When comparing wafers without pumpkin flour (C) to wafers with different percentages of addition (P1–P4), it can be observed that their water absorption capacity slightly decreased while the ability to absorb oil increased with the increase in pumpkin flour content in the wafers, but these differences were not statistically significant (for p < 0.05) (Table 3). The tested wafers did not exhibit good foaming properties. The lowest value of foaming efficiency was obtained for C, while the highest value was for P4. The higher the addition of pumpkin flour, the greater the foaming efficiency. The foam obtained from the wafer samples was unstable (Table 3).

3.2. Bioactive Compound Content

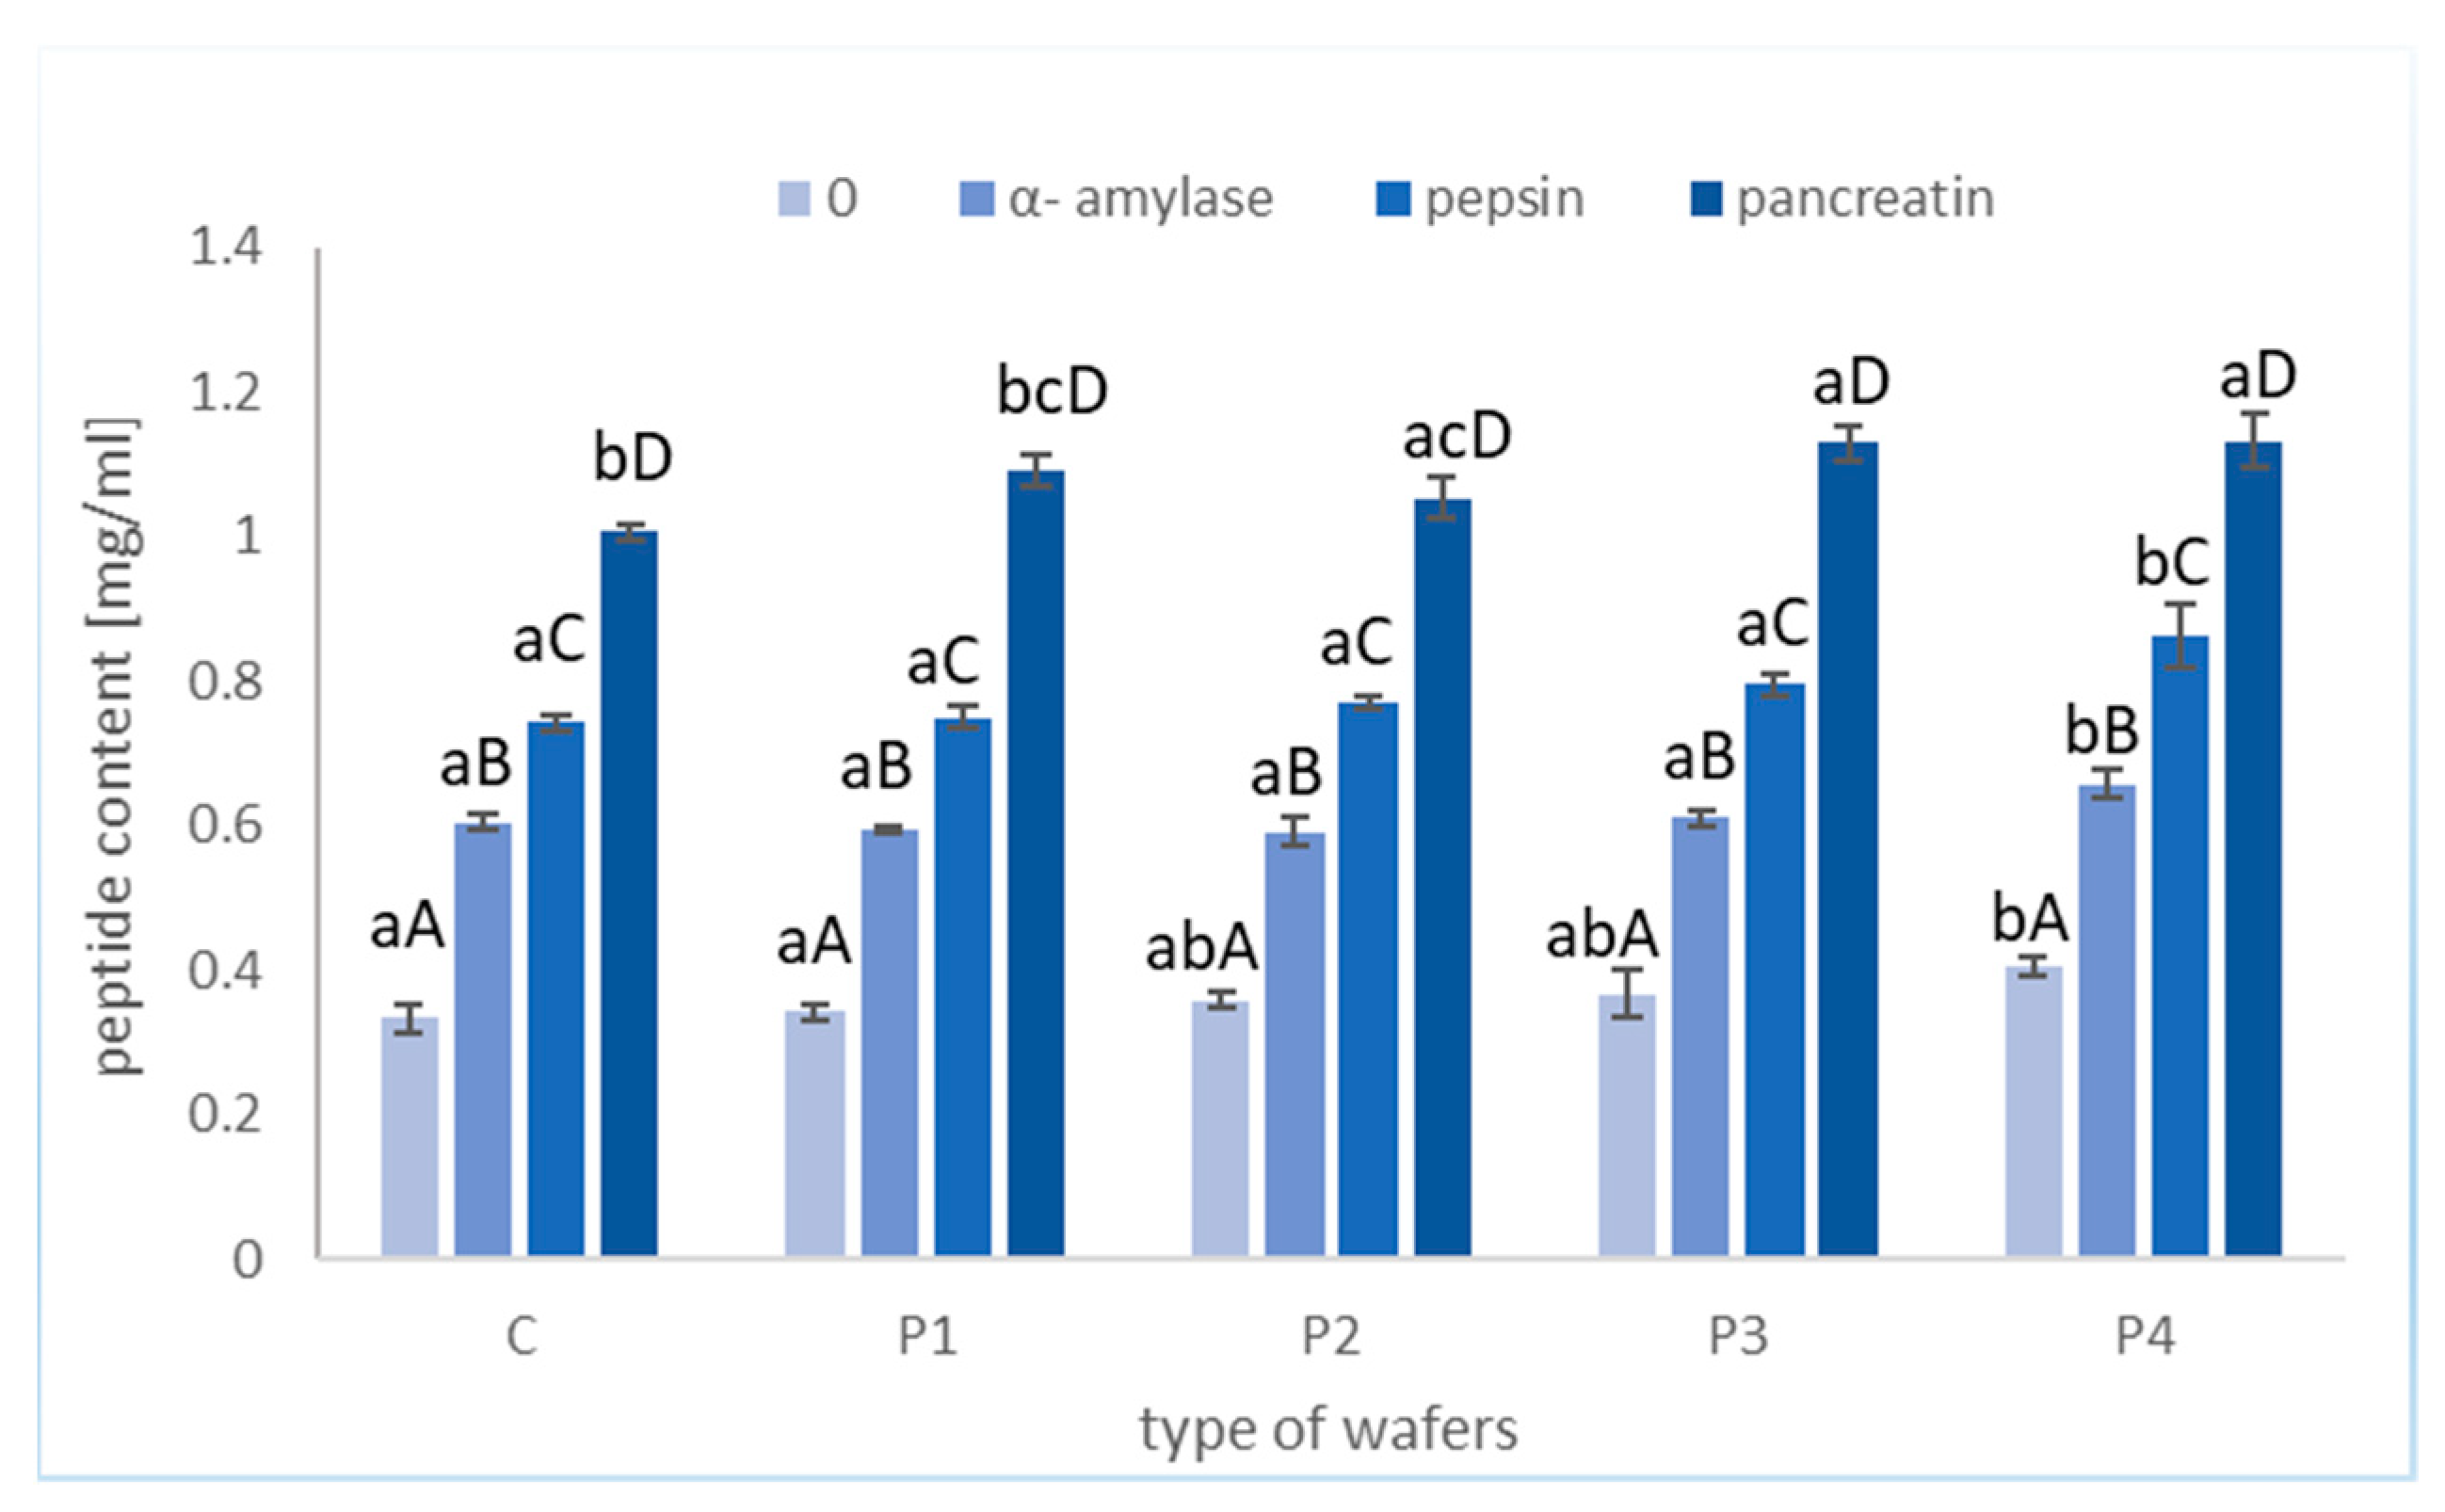
Based on the conducted study, it was observed that the peptide content before digestion was at a similar level (Figure 4). The lowest amount was measured for C and amounted to 0.334 ± 0.02 mg/mL. Addition of pumpkin flour to the wafers minimally affected the increase in peptide content before the digestion process. During enzymatic hydrolysis, the peptide content increased after each stage, with the highest peptide content noted after the third digestion stage of the wafers. Among the analyzed hydrolysates obtained after the in vitro digestion of wafers with the addition of pumpkin flour (P1–P4), wafers 3 and 4 exhibited the highest peptide contents (1.128 ± 0.02 mg/mL and 1.131 ± 0.04 mg/mL, respectively).
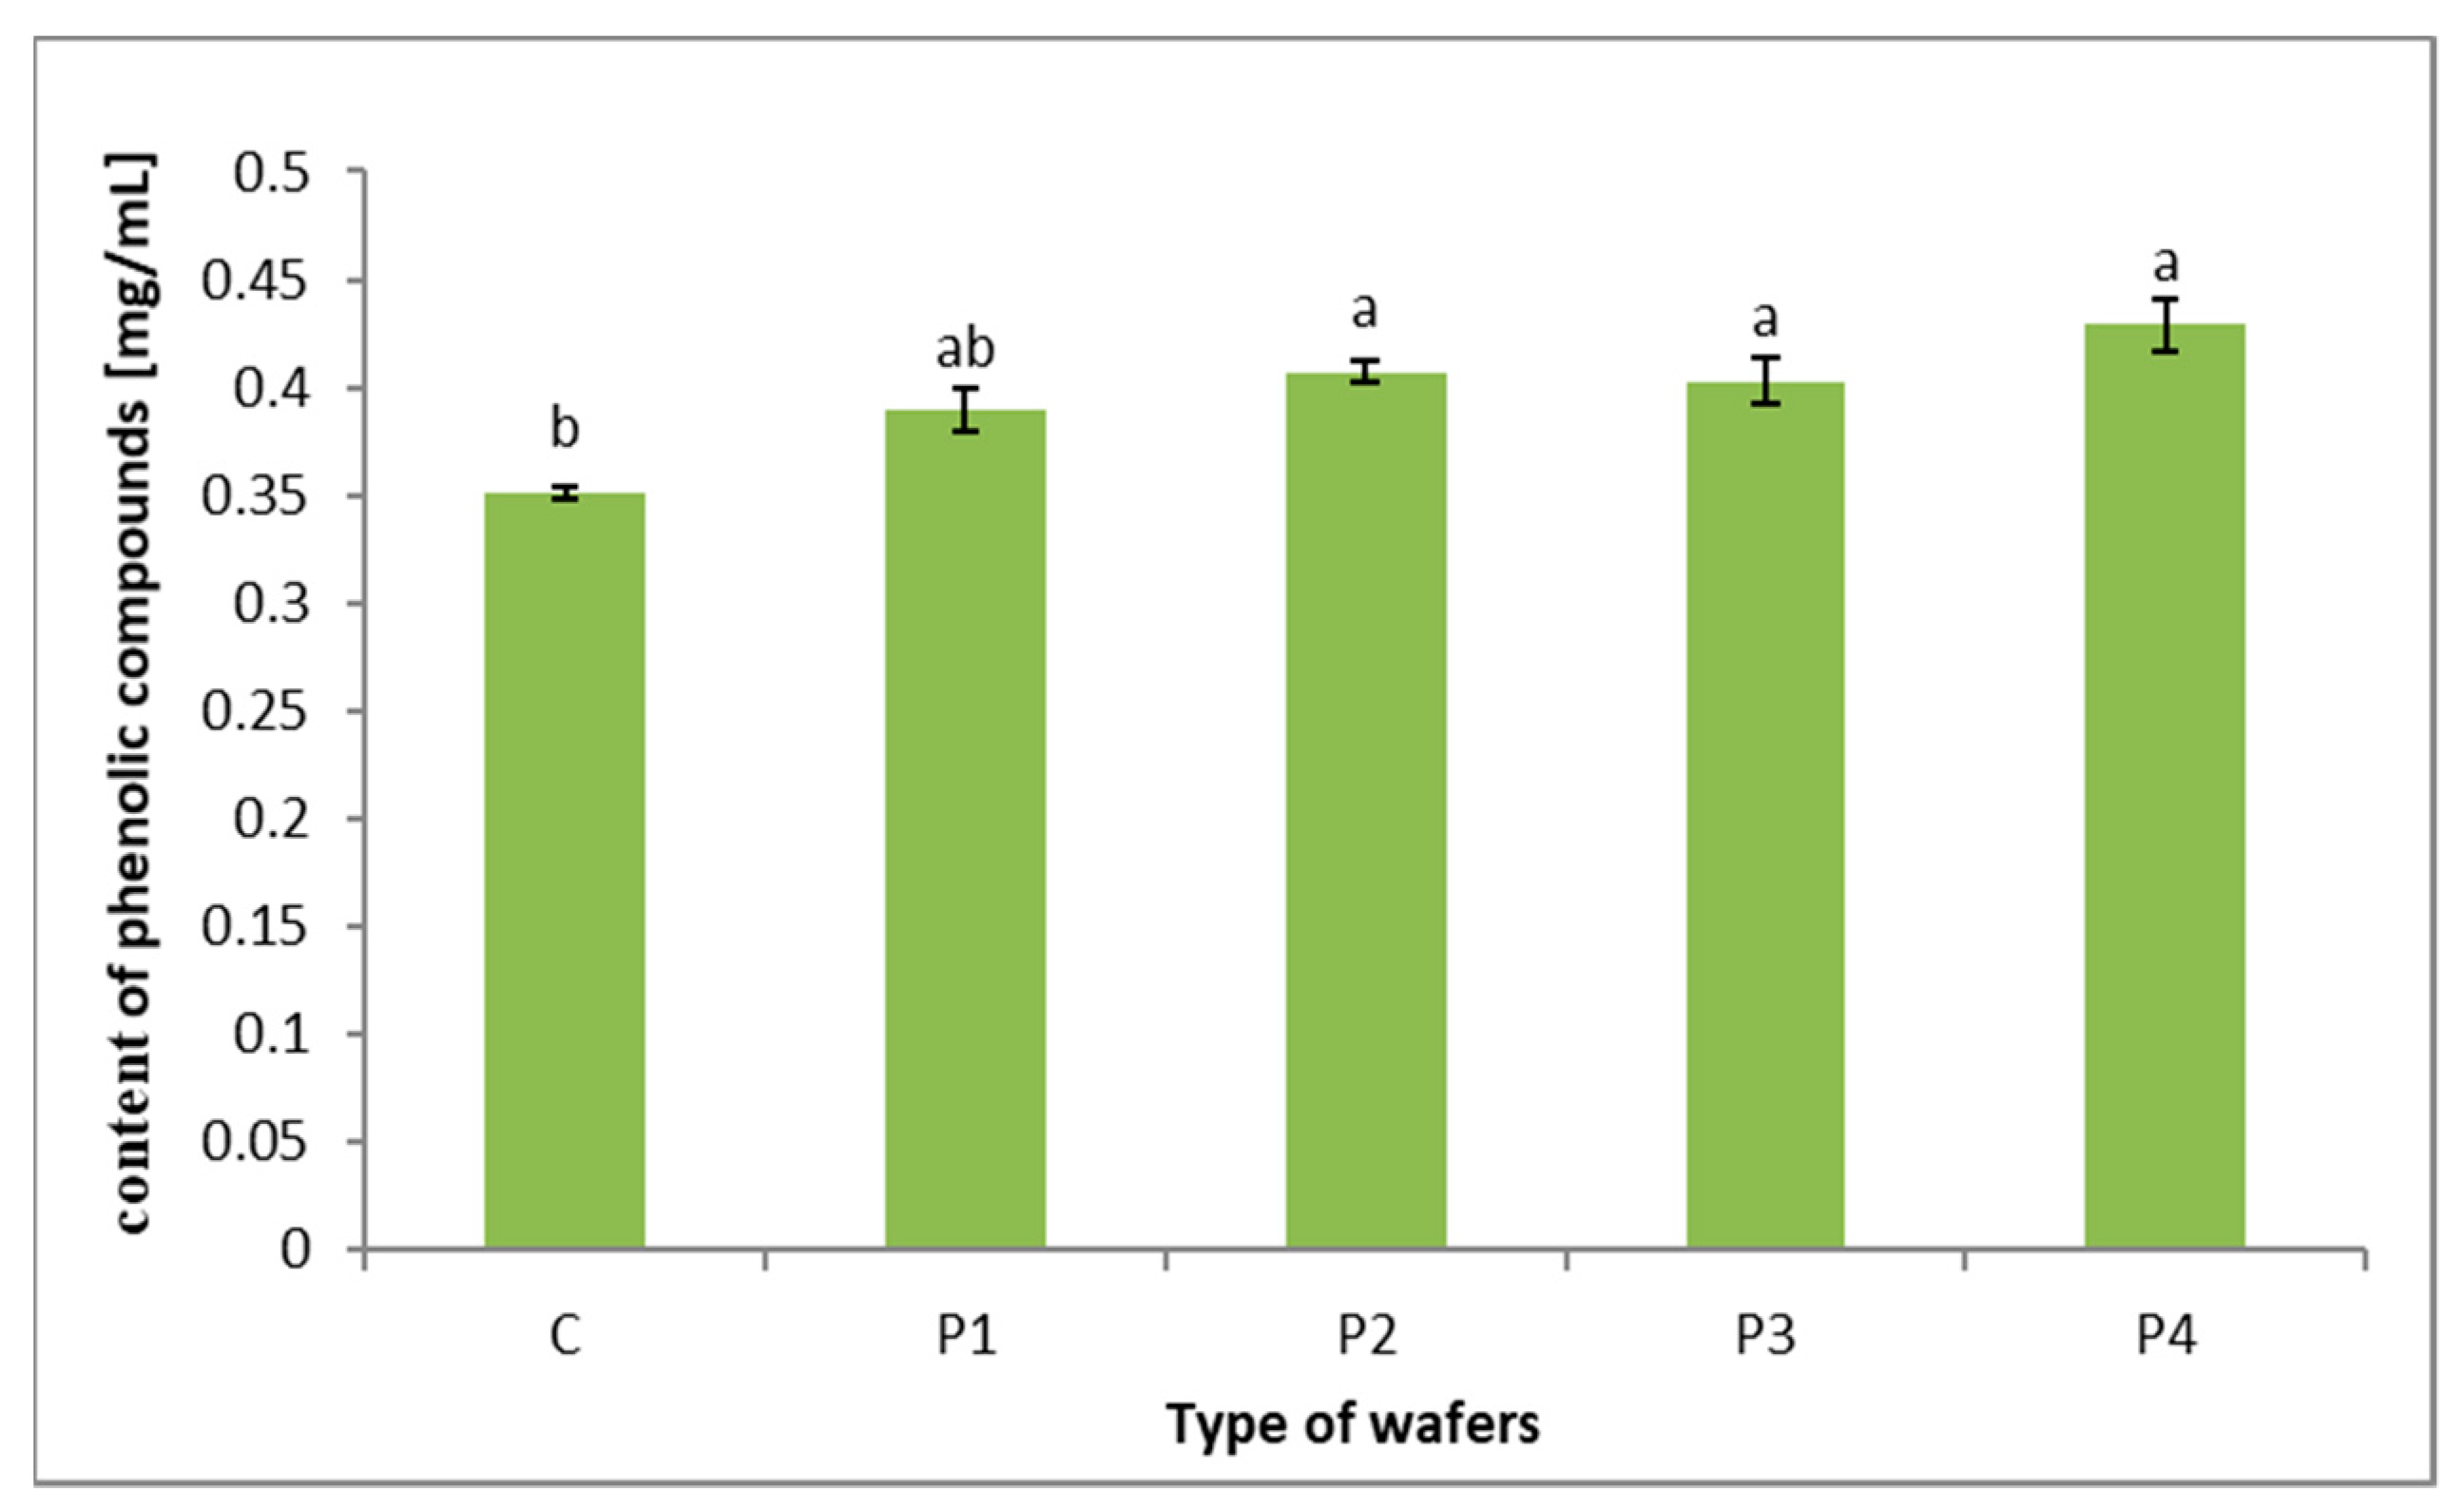
The content of total phenolic compounds in the hydrolysates obtained from wafers without (C) and with the addition of pumpkin flour (P1–P4) was determined using the Folin–Ciocalteu reagent and is shown in Figure 5. Addition of pumpkin flour to wafers (P1–P4) resulted in a slight increase (from 10.83% to 22.22% for P1 and P4, respectively) in the content of the phenolic compounds compared to wafers without this additive (C). Pumpkin seeds contain phenolic compounds, so even a relatively small addition resulted in an increase in their content after in vitro digestion compared to the control.

3.3. Antioxidant Properties

As regards antioxidant capacity, DPPH, ABTS, and Fe2+chelation assays were used, and the results were expressed as IC50, which is the maximum concentration required to obtain a 50% antioxidant effect. The lower the IC50 values, the higher the antioxidant capacity. This study showed that free radicals generated from ABTS and DPPH were scavenged by hydrolysates and ≤3.5 fractions obtained after in vitro digestion of control wafers and wafers with pumpkin seed addition. The best results were obtained for wafers fortified with 3 and 4 wt. % pumpkin seed flour in the context of neutralizing free radicals. The reduction power increased proportionally with the increasing addition of pumpkin seed meal, but statistically significant differences were noted for samples P2 to P4 compared to the control wafers. This may be because some peptides and amino acids with high antioxidant activity are released from pumpkin seed proteins after in vitro digestion, which converts free radicals into more stable products and terminates radical chain reactions. Similarly, some phenolic compounds, known as strong antioxidants, are released from the food matrix after enzymatic hydrolysis. However, the ability to chelate iron ions was similar for all analyzed samples and did not differ statistically (Table 4).
Hydrolysates obtained after in vitro wafer digestion showed a lesser ability to neutralize ABTS, DPPH free radicals, and Fe2+ chelation compared to possible bioaccessible fractions with a molecular weight ≤ 3.5 kDa (Table 4 and Table 5). The highest antiradical activity was noted for the fraction obtained from P4 (0.491 ± 0.037 for ABTS*+ and 3.843 ± 0.291 for DPPH*). All low-molecular-fraction samples from fortified wafers had lower IC50 values than control wafers, but the differences in ABTS values were not statistically significant (Table 5).
Unlike hydrolysates, peptide fractions with a mass ≤ 3.5 kDa obtained from wafers enriched with pumpkin seed flour showed a greater ability to chelate iron ions compared to the control. The increased Fe2+ chelating ability may be due to the presence of low-molecular-weight functional components, such as amino acids, peptides, and phenolic acids from pumpkin seeds, which could block the chain reaction of free radicals by chelating metal ions. Compounds with low molecular weights are more likely to cross the intestinal membranes and exert biological effects.
In hydrolysates, the chelating ability may be influenced by the presence of other components of the food matrix with a molecular weight above 3.5 kDa. They may interact with compounds with high chelating potential and limit their activity. No such relationship was found when determining the reduction power value (Table 5).

4. Discussion

Recently, food enriched with bioactive ingredients has been increasingly available on the food market. This trend is aimed at delivering products with desirable health-promoting properties. Bakery products (e.g., biscuits, muffins, cakes, wafers) are good materials for enrichment with bioactive ingredients [15,16,18,29]. Wafers are low in some bioactive compounds, as they are made only from wheat flour, sugar, and fat. One of the possibilities of increasing their nutritional potential and functional attractiveness is to add other ingredients. Thus, in this study, pumpkin flour was added to wafers in the following amounts: 1 wt. %, 2 wt. %, 3 wt. %, and 4 wt. %. The compounds with antioxidant activity were characterized after the in vitro digestion process. This addition was intended to enhance the health benefits of wafers, because pumpkin flour contains many valuable biologically active compounds.
For such wafers to be attractive to consumers, they should meet certain criteria related to appearance and textural features. The color of wafers is one of the most significant characteristics of their appearance, as it has a decisive impact on the attractiveness of the product. In this study, the total color change increased with the increasing pumpkin seed flour added to the wafers. This may be the result of Maillard reaction products formed during the baking of wafers. These results correspond well with those reported by Oliveira et al. [18], where the L parameter, indicating brightness, was reduced as a result of the increasing percentage of almond peel added to the wafer recipe. Moreover, a darker color of the wafers was more attractive to potential consumers.
Considering the acceptance of wafers as the sum of various quality characteristics (appearance, color, taste, crispiness, and texture) can be used to assess their potential. The overall acceptance score of wafers varied from 3.42 ± 1.06 for P4 to 4.45 ± 0.81 for C. In Gebremariam et al.’s [30] study, the overall acceptance score of cookies with pumpkin flour varied from 6.66 to 8.15 on the nine-point hedonic scale. The authors successfully partially replaced wheat flour to produce wholesome biscuits with an improved nutritional value without disturbing their overall acceptability. The analysis of texture in the study of Alshehry (2020) seemed to reveal a significantly improved hardness, which resulted due to a higher Newton force in cookies prepared from composite pumpkin seed powder when compared with the control cookies [31]. In our study, the hardness and fracturability were investigated. When analyzing the results obtained, it can be noted that the addition of pumpkin seed flour did not influence textural parameters significantly, which is positive from the point of view of potential consumers, because the texture of fortified wafers does not differ from that of traditional, well-known, and accepted wafers. Jakubczyk et al. [32] observed that millet-flour-enriched wafers were characterized by lesser hardness than the control, while the addition of millet flour had no influence on the fracturability of wafers.
Pumpkin seeds contain significant amounts of protein, which is a good source of biologically active peptides. Therefore, the peptide content was determined after each enzymatic hydrolysis step. Not every peptide chain fragment obtained from the protein by simulated digestion can be absorbed from the intestine into the bloodstream. The bioavailability of phytochemicals is determined by their molecular weight [33,34]. Therefore, in this study, we conducted simulated absorption of peptide fractions with a molecular weight of 3.5 kDa. The content of peptides released during in vitro digestion of wafers depended on the percentage of pumpkin flour added. The highest peptides were obtained from wafers with a 3 wt. % or 4 wt. % addition of pumpkin seed flour. Wafers enriched with an appropriate amount of pumpkin seed flour can serve as a source of biologically active peptides released during the hydrolysis process. Similar conclusions were drawn by Różyło et al. (2014), who observed an increase in the peptide content in wheat bread enriched with pumpkin pulp [35].
From the point of view of human nutrition, what is important is not so much the content of bioactive compounds, but their potential bioavailability after consumption. Therefore, in the present study, the concentration of phenolic compounds was determined after hydrolyzing the wafers with enzymes present in the human digestive tract. The highest amount was recorded for wafers with a 4 wt. % pumpkin seed flour addition (0.429 mg GAE/mL). These results demonstrate the potential of pumpkin seed flour as a component rich in phenolic compounds, which may contribute to the improvement of wafers’ healthiness. The total phenolic compounds in pumpkin seed powder were determined by Alshehry et al. (2020) to be 25.62 ± 1.86 mg GAE/100 g [31]. The liberation of dietary phenolics from the food matrix typically happens during intestinal digestion or through metabolism by the colonic microbiota. Additionally, the process of solubilizing released phenolics in the human body can be greatly influenced by interactions with the food matrix. These interactions can aid in facilitating the transportation of phenolics to the absorption site by impeding their degradation in the gastrointestinal tract. Regarding the antioxidant activity, both hydrolysates and ≤3.5 kDa fractions exhibited antiradical activity against DPPH* and ABTS*+. Potentially bioaccessible fractions (≤3.5 kDa) showed stronger antiradical properties and Fe chelation ability (lower IC50 values) than hydrolysates. In the case of hydrolysates, the greatest ability to neutralize free radicals was observed for the P4 sample with the greatest addition of pumpkin seed flour (4 wt. %). These results confirm the beneficial health properties of pumpkin seed flour. Similar studies were conducted by Gebremariam et al. [30]. The optimized cookies fortified with pumpkin flour had a higher total antioxidant activity (43.186%) than the control cookies (38.716%). Moreover, in our study, hydrolysates of wafers with pumpkin seed flour showed a very high capacity to reduce iron (III) ions compared to the control sample. However, fractions obtained after in vitro absorption exhibited a lower value of reduction power evaluated as the Trolox equivalent. Pumpkin seeds, which are usually discarded as a waste material during processing, are a very healthy source of protein and a storehouse of compounds with antioxidant properties, such as phenolic compounds. During the digestion of wafers, peptides from pumpkin seed proteins are liberated and phenolic compounds are released from the food matrix, which was confirmed by our research. Hydrolysates obtained from wafers enriched with pumpkin seed flour were characterized by higher contents of both peptides and phenolic compounds (Figure 4 and Figure 5). Moreover, the peptide content increased after each stage of simulated digestion, indicating that the bioactive peptides from pumpkin seeds have good stability in the gastrointestinal tract. With the increase in the addition of pumpkin seed flour to wafers, the antioxidant activity of hydrolysates also increased, which indicates that, among other factors, the released peptides and phenolic compounds are responsible for wafers’ antioxidant potential. These results are in agreement with other research [7,10,12,32].
The functional characteristics of foods play a crucial role in determining the suitability of food materials for processing, storage, and preparation. These characteristics are essential for establishing the applications and uses of food materials, as they directly impact the overall quality of food products. Accordingly, the functional properties of wafers were investigated, with the addition of pumpkin flour having a minor effect on water and fat adsorption. These findings are consistent with other scientific studies, such as that of Rezig et al. (2016) [36]. Functional properties such as the water absorption capacity (WAC) and fat (oil) absorption capacity (FAC) were found at 175.5 mL/100 g, 185.3 mL/100 g, and 3.04 g/mL in pumpkin seed powder by Alshehry et al. (2014) [31]. According to Jakubczyk et al. (2020), millet-flour-enriched wafers were characterized by higher WAC and FAC values than wafers without this additive (control sample). The highest WAC and FAC were determined for wafers with a 3% addition of millet flour (803.91% and 42.79%, respectively) [32].

5. Conclusions

In conclusion, wafers enriched with pumpkin seed flour represent a promising source of biologically active compounds with potential health-promoting properties. These results suggest that pumpkin flour could make a valuable addition to various food products, contributing to improving their health profile. Pumpkin seeds are a good source of polyphenols and peptides with antioxidant properties; therefore, their use to enrich confectionery products seems advisable and justified. It is worth emphasizing that such fortification did not significantly reduce the consumer quality of the prepared wafers. However, further research into higher incorporation levels is recommended. Nonetheless, it can be concluded that pumpkin-seed-powder-supplemented products should be promoted with consumers due their nutritional and health benefits.

Supplementary Materials

The following supporting information can be downloaded at https://www.mdpi.com/article/10.3390/app14125129/s1, Table S1: Scoring results of the consumer evaluation of wafers (C) with added pumpkin seed meal (1 wt. %, 2 wt. %, 3 wt. %, and 4 wt. %; P1, P2, P3, and P4, respectively).

Author Contributions

Conceptualization, M.K. and U.S.; methodology, M.K., U.S., A.J. and D.K.; formal analysis, M.K., U.S., M.B., A.J. and D.K.; investigation, M.K., U.S., M.B., A.J. and D.K.; writing—original draft preparation, M.K. and U.S.; writing—review and editing, M.K., U.S., M.B., A.J. and D.K.; visualization, M.K. and U.S.; supervision, M.K. and U.S.; project administration, M.K., U.S., M.B., A.J. and D.K. All authors have read and agreed to the published version of the manuscript.

Funding

This research received no external funding.

Institutional Review Board Statement

Not applicable.

Informed Consent Statement

Not applicable.

Data Availability Statement

The original contributions presented in the study are included in the article and Supplementary Materials, further inquiries can be directed to the corresponding author.

Acknowledgments

The authors wish to extend their gratitude to As-Babuni Company Sp. z o.o. (Niemce, Poland).

Conflicts of Interest

The authors declare no conflicts of interest.

References

  1. Żarnowski, A.; Jankowski, M.; Gujski, M. Public Awareness of Diet-Related Diseases and Dietary Risk Factors: A 2022 Nationwide Cross-Sectional Survey among Adults in Poland. Nutrients 2022, 14, 3285. [Google Scholar] [CrossRef]
  2. Available online: https://www.healthdata.org/research-analysis/health-risks-issues/diet (accessed on 15 May 2024).
  3. Whitworth, J. Pumpkin Seeds into Nanoparticles. Mod. Concepts Dev. Agron. 2022, 12, 1175–1177. [Google Scholar] [CrossRef]
  4. Singh, A.; Kumar, V. Pumpkin seeds as nutraceutical and functional food ingredient for future: A review. Grain Oil Sci. Technol. 2024, 7, 12–29. [Google Scholar] [CrossRef]
  5. Singh, A.; Kumar, V. Cultivars Effect on the Physical Characteristics of Pumpkin (Cucurbita moschata Duch.) Seeds and Kernels. J. Inst. Eng. Ser. A 2020, 101, 631–641. [Google Scholar] [CrossRef]
  6. Bieżanowska-Kopeć, R.; Ambroszczyk, A.M.; Piatkowska, E.; Leszczyńska, T. Nutritional Value and Antioxidant Activity of Fresh Pumpkin Flowers (Cucurbita sp.) Grown in Poland. Appl. Sci. 2022, 12, 6673. [Google Scholar] [CrossRef]
  7. Kar, S.; Dutta, S.; Yasmin, R. A comparative study on phytochemicals and antioxidant activity of different parts of pumpkin (Cucurbita maxima). Food Chem. Adv. 2023, 3, 100505. [Google Scholar] [CrossRef]
  8. Djuricic, I.; Calder, P.C. Beneficial outcomes of omega-6 and omega-3 polyunsaturated fatty acids on human health: An update for 2021. Nutrients 2021, 13, 2421. [Google Scholar] [CrossRef]
  9. Krimer-Malešević, V. Pumpkin Seeds: Phenolic Acids in Pumpkin Seed (Cucurbita pepo L.). In Nuts and Seeds in Health and Disease Prevention; Academic Press: Cambridge, MA, USA, 2020; pp. 533–542. [Google Scholar] [CrossRef]
  10. Hussain, A.; Kausar, T.; Din, A.; Murtaza, M.A.; Jamil, M.A.; Noreen, S.; Rehman, H.u.; Shabbir, H.; Ramzan, M.A. Determination of total phenolic, flavonoid, carotenoid, and mineral contents in peel, flesh, and seeds of pumpkin (Cucurbita maxima). J. Food Process. Preserv. 2021, 45, e15542. [Google Scholar] [CrossRef]
  11. Amin, M.Z.; Islam, T.; Uddin, M.R.; Uddin, M.J.; Rahman, M.M.; Satter, M.A. Comparative study on nutrient contents in the different parts of indigenous and hybrid varieties of pumpkin (Cucurbita maxima Linn.). Heliyon 2019, 5, e02462. [Google Scholar] [CrossRef]
  12. Ferreira Vieira, E.M. Bioactive peptides released from Cucurbitaceae seed proteins during gastrointestinal digestion. In Protein Digestion-Derived Peptides; Elsevier: Amsterdam, The Netherlands, 2024; pp. 305–333. [Google Scholar] [CrossRef]
  13. Lin, C.T.; Tejano, L.A.; Panjaitan, F.C.A.; Permata, V.N.S.; Sevi, T.; Chang, Y.W. Protein identification and potential bioactive peptides from pumpkin (Cucurbita maxima) seeds. Food Sci. Nutr. 2024, 1–15. [Google Scholar] [CrossRef]
  14. Dotto, J.M.; Chacha, J.S. The potential of pumpkin seeds as a functional food ingredient: A review: Biofunctional ingredients of pumpkin seeds. Sci. Afr. 2020, 10, e00575. [Google Scholar] [CrossRef]
  15. Sawarsathi, D.; Renu, R.; Maloo, S. Development and quality evaluation of pumpkin seeds and flaxseeds powder incorporated biscuits. Int. J. Food Sci. Nutr. 2018, 3, 78–83. [Google Scholar]
  16. Mdluli, H.; Kidane, S.W.; Nkambule, T.P.; Shelembe, J.S. Valorisation of pumpkin seeds through wheat-sorghum-pumpkin seed composite flour muffins: Optimization using D-optimal mixture design. Cogent Food Agric. 2024, 10, 2303833. [Google Scholar] [CrossRef]
  17. Adelerin, R.O.; Awolu, O.O.; Ifesan, B.O.T.; Nwaogu, M.U. Pumpkin-based cookies formulated from optimized pumpkin flour blends: Nutritional and antidiabetic potentials. Food Humanit. 2024, 2, 100215. [Google Scholar] [CrossRef]
  18. Oliveira, I.; Marinho, B.; Szymanowska, U.; Karas, M.; Vilela, A. Chemical and Sensory Properties of Waffles Supplemented with Almond Skins. Molecules 2023, 28, 5674. [Google Scholar] [CrossRef]
  19. Ekramian, H.; Saedi Asl, M.; Karimi, M.; Sheikholeslami, Z.; Pedram Nia, A. Comparison the effect of fruits extract with fungal protease on waffle quality. J. Food Sci. Technol. 2021, 58, 4766–4774. [Google Scholar] [CrossRef]
  20. Zielińska, E.; Karaś, M.; Baraniak, B. Comparison of functional properties of edible insects and protein preparations thereof. LWT Food Sci. Technol. 2018, 91, 168–174. [Google Scholar] [CrossRef]
  21. Durak, A.; Baraniak, B.; Jakubczyk, A.; Świeca, M. Biologically active peptides obtained by enzymatic hydrolysis of Adzuki bean seeds. Food Chem. 2013, 141, 2177–2183. [Google Scholar] [CrossRef]
  22. Karaś, M.; Baraniak, B.; Rybczy, K.; Jakubczyk, A. The influence of heat treatment of chickpea seeds on antioxidant and fibroblast growth-stimulating activity of peptide fractions obtained from proteins digested under simulated gastrointestinal conditions. Int. J. Food Sci. Technol. 2015, 50, 2097–2103. [Google Scholar] [CrossRef]
  23. Adler-Nissen, J. Determination of the Degree of Hydrolysis of Food Protein Hydrolysates by Trinitrobenzenesulfonic Acid. J. Agric. Food Chem. 1979, 27, 1256–1262. [Google Scholar] [CrossRef] [PubMed]
  24. Singleton, V.L.; Orthofer, R.; Lamuela-Raventós, R.M. [14] Analysis of total phenols and other oxidation substrates and antioxidants by means of folin-ciocalteu reagent. Methods Enzymol. 1999, 299, 152–178. [Google Scholar] [CrossRef]
  25. Re, R.; Pellegrini, N.; Proteggente, A.; Pannala, A.; Yang, M.; Rice-Evans, C. Antioxidant activity applying an improved ABTS radical cation decolorization assay. Free Radic. Biol. Med. 1999, 26, 1231–1237. [Google Scholar] [CrossRef]
  26. Brand-Williams, W.; Cuvelier, M.E.; Berset, C. Use of a free radical method to evaluate antioxidant activity. LWT Food Sci. Technol. 1995, 28, 25–30. [Google Scholar] [CrossRef]
  27. Decker, E.A.; Welch, B. Role of Ferritin as a Lipid Oxidation Catalyst in Muscle Food†. J. Agric. Food Chem. 1990, 38, 674–677. [Google Scholar] [CrossRef]
  28. Pulido, R.; Bravo, L.; Saura-Calixto, F. Antioxidant activity of dietary polyphenols as determined by a modified ferric reducing/antioxidant power assay. J. Agric. Food Chem. 2000, 48, 3396–3402. [Google Scholar] [CrossRef]
  29. Gupta, N.; Agarwal, M.; Bhatia, V.; Jha, S.K.; Dinesh, J. Invitro Antioxidant Activity of Crude Extracts of the Plant. Int. J. Pharm. Sci. Rev. Res. 2011, 6, 159–162. [Google Scholar]
  30. Weldeyohanis Gebremariam, F.; Tadesse Melaku, E.; Sundramurthy, V.P.; Woldemichael Woldemariam, H. Development of functional cookies form wheat-pumpkin seed based composite flour. Heliyon 2024, 10, e24443. [Google Scholar] [CrossRef]
  31. Alshehry, G.A. Preparation and Nutritional Properties of Cookies from the Partial Replacement of Wheat Flour Using Pumpkin Seeds Powder. World J. Environ. Biosci. 2020, 9, 48–56. Available online: www.environmentaljournals.org (accessed on 15 May 2024).
  32. Jakubczyk, A.; Ćwiek, P.; Rybczyńska-Tkaczyk, K.; Gawlik-Dziki, U.; Złotek, U. The influence of millet flour on antioxidant, anti-ACE, and anti-microbial activities of wheat wafers. Foods 2020, 9, 220. [Google Scholar] [CrossRef]
  33. Amigo, L.; Hernández-Ledesma, B. Current evidence on the bioavailability of food bioactive peptides. Molecules 2020, 25, 4479. [Google Scholar] [CrossRef]
  34. Langston, F.M.A.; Nash, G.R.; Bows, J.R. The retention and bioavailability of phytochemicals in the manufacturing of baked snacks. Crit. Rev. Food Sci. Nutr. 2023, 63, 2141–2177. [Google Scholar] [CrossRef] [PubMed]
  35. Rózyło, R.; Gawlik-Dziki, U.; Dziki, D.; Jakubczyk, A.; Karaś, M.; Rózylo, K. Wheat bread with pumpkin (Cucurbita maxima L.) pulp as a functional food product. Food Technol. Biotechnol. 2014, 52, 430–438. [Google Scholar] [CrossRef]
  36. Rezig, L.; Riaublanc, A.; Chouaibi, M.; Guéguen, J.; Hamdi, S. Functional Properties of Protein Fractions Obtained from Pumpkin (Cucurbita maxima) Seed. Int. J. Food Prop. 2016, 19, 172–186. [Google Scholar] [CrossRef]
Figure 1. Wafers without or with a 1 wt. %, 2 wt. %, 3 wt. %, or 4 wt. % addition of pumpkin seed flour.
Applsci 14 05129 g001
Figure 2. Delta E (ΔE) values, calculated by comparing the colors of the wafers, plotted against the % of addition (a); the graphical presentation of average color parameter values in the CIELAB system (b).
Applsci 14 05129 g002
Figure 3. The consumer evaluation of wafers (C) with added pumpkin seed meal (1 wt. %, 2 wt. %, 3 wt. %, and 4 wt. %; P1, P2, P3, and P4, respectively).
Applsci 14 05129 g003
Figure 4. The peptide contents before and during the in vitro digestion process of wafers without (C) and with the addition of pumpkin flour (P1–P4). Different letters a, b indicate significant differences for samples with the same hydrolysis step (p < 0.05). Different capital letters A, B, C, and D indicate significant differences in the hydrolysis step for the same sample (p < 0.05).
Applsci 14 05129 g004
Figure 5. The phenolic contents in hydrolysates obtained after in vitro digestion of wafers without (C) and with the addition of pumpkin flour (P1–P4). a, b—the means labeled with different letters differ significantly, with a significance level of p < 0.05.
Applsci 14 05129 g005
Table 1. Quality indicators for wafers.
Overall AppearanceCharacteristic, Highly Desirable Appearance of the Product
SurfaceUniform, smooth, clear pattern imprint
ColorUniform, intense, clean
TasteDistinctive, tasty
SmellDistinctive, intense
Consistency (crispness, fragility)Very crisp
Consistency (hardness)Very hard
Table 2. The average color parameter values in the CIELAB system and textural parameters for wafers without (C) and with the addition of pumpkin flour (P1–P4).
L*a*b*ΔEHardness
[g × sec]
Fracturability
[g × sec]
C59.73 ± 0.3 a8.93 ± 0.49 a27.24 ± 0.79 a-1241 ± 248 a3570 ± 307 a
P159.27 ± 0.49 a7.55 ± 0.3 a26.87 ± 0.12 a1.50962 ± 267 ab3190 ± 712 a
P254.46 ± 0.38 b8.79 ± 0.68 a27.19 ± 1.39 a5.27954 ± 262 ab3687 ± 566 a
P352.03 ± 1.58 c8.19 ± 0.5 a26.67 ± 1.17 a7.76968 ± 158 ab3505 ± 539 a
P445.12 ± 0.79 d8.56 ± 0.88 a27.14 ± 1.50 a14.621070 ± 349 ab4155 ± 634 a
a, b, c, d—the means labeled in columns with different letters differ significantly, with a significance level of p < 0.05.
Table 3. Functional properties of control wafers (C) and wafers with different percentages of added pumpkin flour (P1–P4).
CP1P2P3P4
FS [%]-----
FC [mL]1.01.21.61.72.0
WAC [%]586.3 ± 9.192 a566.5 ± 2.121 a561 ± 46.67 a552.5 ± 4.949 a549.5 ± 47.38 a
OAC [%]397.6 ± 4.04 a398 ± 5.66 a407 ± 15.56 a411 ± 5.66 a403 ± 4.24 a
a—the means labeled in columns with different letters differ significantly, with a significance level of p < 0.05. “-” the tested samples were not characterized by foam stability.
Table 4. Antioxidant properties of hydrolysates obtained after in vitro digestion of wafers.
Hydrolysate SamplesAntioxidant Properties
ABTS*+
[IC50 mg/mL]
DPPH*
[IC50 mg/mL]
Fe2+ Chelation [IC50 mg/mL]Reducing Power [µmol Trolox/mL]
C4.452 ± 0.080 c83.08 ± 9.968 c2.222 ± 0.133 a2.493 ± 0.086 c
P14.449 ± 0.099 b90.39 ± 7.382 bc2.105 ± 0.105 a2.591 ± 0.067 bc
P23.240 ± 0.100 b90.21 ± 3.475 c2.083 ± 0.115 a2.811 ± 0.059 ab
P32.983 ± 0.073 b69.59 ± 6.727 b2.062 ± 0.113 a2.855 ± 0.206 ab
P42.653 ± 0.026 a53.86 ± 2.603 a2.041 ± 0.100 a3.033 ± 0.081 a
Different letters indicate statistically significant differences between samples (p ≤ 0.05, Tukey’s test).
Table 5. Antioxidant properties of fractions with ≤3.5 kDa molecules.
≤3.5 kDa Fraction SamplesAntioxidant Properties
ABTS*+
[IC50 mg/mL]
DPPH*
[IC50 mg/mL]
Fe2+ Chelation [IC50 mg/mL]Reducing Power [µmol Trolox/mL]
Cf0.523 ± 0.018 a5.583 ± 0.846 b0.245 ± 0.041 c0.030 ± 0.002 a
Pf10.513 ± 0.021 a5.986 ± 0.907 b0.157 ± 0.028 ab0.029 ± 0.001 a
Pf20.512 ± 0.056 a5.123 ± 0.388 b0.192 ± 0.037 b0.028 ± 0.002 a
Pf30.507 ± 0.036 a4.118 ± 0.281 ab0.190 ± 0.028 b0.028 ± 0.002 a
Pf40.491 ± 0.037 a3.843 ± 0.291 a0.114 ± 0.015 ab0.028 ± 0.001 a
Cf, Pf1 to Pf4—fractions ≤ 3.5 kDa after hydrolysis of control wafers and wafers with the addition of pumpkin flour. Different letters indicate statistically significant differences between samples (p ≤ 0.05, Tukey’s test).
Disclaimer/Publisher’s Note: The statements, opinions and data contained in all publications are solely those of the individual author(s) and contributor(s) and not of MDPI and/or the editor(s). MDPI and/or the editor(s) disclaim responsibility for any injury to people or property resulting from any ideas, methods, instructions or products referred to in the content.