Article

A bi-Gamma Distribution Model for a Broadband Non-Gaussian Random Stress Rainflow Range Based on a Neural Network

National Key Laboratory of Helicopter Aeromechanics, College of Aerospace Engineering, Nanjing University of Aeronautics and Astronautics, Nanjing 210016, China
*
Author to whom correspondence should be addressed.
Appl. Sci. 2024, 14(18), 8376; https://doi.org/10.3390/app14188376
Submission received: 1 September 2024 / Revised: 13 September 2024 / Accepted: 16 September 2024 / Published: 18 September 2024

Abstract

:
A bi-Gamma distribution model is proposed to determine the probability density function (PDF) of broadband non-Gaussian random stress rainflow ranges during vibration fatigue. A series of stress Power Spectral Densities (PSD) are provided, and the corresponding Gaussian random stress time histories are generated using the inverse Fourier transform and time-domain randomization methods. These Gaussian random stress time histories are then transformed into non-Gaussian random stress time histories. The probability density values of the stress ranges are obtained using the rainflow counting method, and then the bi-Gamma distribution PDF model is fitted to these values to determine the model’s parameters. The PSD parameters and the kurtosis, along with their corresponding model parameters, constitute the neural network input–output dataset. The neural network model established after training can directly provide the parameter values of the bi-Gamma model based on the input PSD parameters and kurtosis, thereby obtaining the PDF of the stress rainflow ranges. The predictive capability of the neural network model is verified and the effects of non-Gaussian random stress with different kurtosis on the structural fatigue life are compared for the same stress PSD. And all life predicted results were within the second scatter band.

1. Introduction

Vibration fatigue is a phenomenon in which a structure undergoes reciprocating vibrations under external dynamic loads and accumulated damage occurs to the structure [1,2,3]. Usually, in the case of random vibration, the induced stress in the structure is assumed to follow Gaussian distribution, based on which a vibration fatigue analysis is conducted. However, in practice, structures often experience non-stationary, non-Gaussian loads during operation, which result in non-Gaussian stress responses [4,5,6]. In this case, it is essential to consider the non-Gaussian characteristics of stress, such as kurtosis and skewness, and their impact on fatigue life.
High-cycle vibration fatigue analysis methods are primarily divided into time-domain methods and frequency-domain methods. In the time-domain method, rainflow cycle counting is used to calculate the number of stress cycles at critical points in the structure, and then the Miner linear cumulative damage method is employed to estimate fatigue damage and life [7]. The frequency-domain method, on the other hand, calculates fatigue damage and life based on the stress PSD. Several researchers have developed frequency-domain analysis methods for Gaussian vibration fatigue. Among these, the empirical formula for the stress rainflow range PDF proposed by Dirlik is widely used [1], as well as the counting method proposed by Benasciutti and Tovo, which extracts the PDF from the stress PSD [8,9].
With further research into vibration fatigue, it has been found that vibration fatigue analysis methods based on the Gaussian assumption are not suitable for non-Gaussian and non-stationary conditions. Many scholars have begun to explore methods for analyzing and predicting the fatigue life of a non-Gaussian case. Banvillet et al. conducted fatigue tests on 10HNAP steel under broadband non-Gaussian uniaxial loading and compared various fatigue prediction models. They found that both the time-domain and frequency-domain strain energy density methods provided the best and most consistent life predictions [10]. Benasciutti et al. proposed a nonlinear transformation method to convert Gaussian processes into non-Gaussian processes while maintaining the signal RMS constant under specified kurtosis conditions [11]. Janko et al. analyzed the non-Gaussian and non-stationary response characteristics of structures and studied the bimodal fatigue issues under broadband excitation [5,6]. They discovered that, when the magnitude of the load PSD remains unchanged, simply altering the kurtosis of the load does not significantly affect the structure’s fatigue life. However, when the load is non-stationary, the response exhibits significant non-Gaussian characteristics, significantly reducing the structure’s fatigue life. In other words, stationary non-Gaussian excitation does not cause the structural response to exhibit significant non-Gaussian characteristics, whereas non-stationary, non-Gaussian excitation leads to significant non-Gaussian responses in the structure, resulting in a noticeable decrease in fatigue life.
It is generally accepted that time-domain methods can yield accurate results for both Gaussian and non-Gaussian fatigue analyses. However, due to computational convenience, frequency-domain methods are also widely used, especially in the early stages of structural design. Braccesi et al. hypothesized that non-Gaussian damage can be estimated by multiplying the Gaussian damage under the same stress PSD by a correction factor, which is a function of the kurtosis and skewness of the non-Gaussian stress, as well as the slope of the S-N curve. This correction method involves calculating Gaussian fatigue damage using frequency-domain methods, and then introducing a correction factor to obtain non-Gaussian fatigue damage. The correction parameter is related to the mean, variance, kurtosis, and skewness of the non-Gaussian stress, as well as the slope of the S-N curve [12]. The expression for this correction parameter is
λ ng = f ( μ , σ , S k , K u , m )
Existing non-Gaussian fatigue calculation methods are mostly based on Gaussian stress frequency-domain damage models, followed by non-Gaussian corrections. However, the accuracy of these correction methods is often unsatisfactory. Inspired by the Dirlik method for Gaussian stress, this paper proposes a method to obtain the rainflow range PDF for non-Gaussian stress.
With the advancement of computer science, AI and machine learning methods have been widely applied in engineering. Many scholars have introduced machine learning into fatigue calculations, such as predicting fatigue life through neural network models [13,14,15], predicting solder joint fatigue [16], predicting notch fatigue [17], and predicting crack propagation [18,19]. These methods offer new approaches to solving fatigue problems. In this paper, a neural network is also used to establish a model for prediction of the rainflow range PDF of non-Gaussian stress.
The focus of this study is on how to obtain the corresponding rainflow range PDF from assigned non-Gaussian stress PSD and kurtosis. This paper proposes a method to establish the relationship between stress PSD spectral parameters and kurtosis with a rainflow range PDF bi-Gamma model using a neural network. The proposed bi-Gamma model for the rainflow range PDF of non-Gaussian distributions will have significant value for theoretical analyses and calculations related to structural fatigue and reliability.
This paper is organized as follows. Section 2 focuses on the definition of kurtosis, the definition of non-Gaussian stress, the simulation of the stress PSD, and the generation of time-domain stress signals based on the specified stress PSD and kurtosis values. Section 3 presents the frequency-domain method for calculating stress fatigue, as well as the non-Gaussian fatigue calculation method based on coefficient correction. It also introduces the bi-Gamma model for the non-Gaussian stress rainflow range PDF used in this paper. Section 4 provides a detailed explanation of the development of the stress PDF model and the neural network training process. Section 5 presents the neural network’s prediction results, as well as the sensitivity coefficient test and robustness test for the neural network. Section 6 present the conclusion of this paper.

2. Non-Gaussian Stress

2.1. Definition of Kurtosis

For a zero-mean stationary random signal z(t), the normalized kurtosis is defined as the fourth-order moment of z(t) divided by the square of the second-order moment. Denoted as
K u = E [ z 4 ( t ) ] E 2 [ z 2 ( t ) ]
When the kurtosis Ku = 3, the random signal is called Gaussian. When the kurtosis 0 < Ku < 3, the signal is called sub-Gaussian. When the kurtosis Ku > 3, the signal is called super-Gaussian. Sub-Gaussian and super-Gaussian signals are collectively referred to as non-Gaussian signals. Figure 1 shows the probability density distribution of random signals with different kurtosis values. It can be observed that leptokurtic signals have an increased distribution at large amplitudes.
Generally speaking, if the kurtosis of a non-Gaussian stress process is greater than 3, its fatigue damage will be greater than that of Gaussian stress with the same PSD. This is because the non-Gaussian stress distribution has a longer tail, meaning larger stress amplitudes will lead to a greater accumulation of damage. Since leptokurtic stress can significantly reduce the fatigue life of a structure, this article focuses on discussing structural fatigue under leptokurtic stress conditions.

2.2. Stress PSD

Under broadband random vibration excitation, the stress response at critical points of the structure is mainly contributed by the superposition of stresses from the first few modes. This paper considers a case where the stress PSD curve has double peaks. According to vibration theory and Dirlik’s double-peak stress model, a new double-peak stress model with Fourier amplitude spectrum is put forward as
S S ( f ) = A 1 ( 1 η 1 2 ) 2 + ( 2 η 1 ζ 1 ) 2 + A 2 ( 1 η 2 2 ) 2 + ( 2 η 2 ζ 2 ) 2
where SS(f) is expressed as MPa, and SS(0) = 0. A1 and A2 are two peak values in the tress spectrum, η1 = f/f1, and η2 = f/f2, where f1 and f2 are the frequencies at which the two peaks are located, ζ1 and ζ2 are the damping ratios, and Δf is the frequency resolution.
The corresponding PSD is
G S ( f ) = S S 2 ( f ) Δ f
By varying the parameters in Equation (3), a series of double-peak stress PSD can be obtained.

2.3. Generating of Non-Gaussian Stresses

The idea behind generating non-Gaussian random signals is to use a monotonic nonlinear transformation function g(·) to convert Gaussian random signals into non-Gaussian signals, which can be described as
y ( t ) = g ( x ( t ) )
where x(t) represents a Gaussian random signal with a given PSD. Emphasizing the monotonic transformation means ensuring that the value of y(t) at any time t depends solely on the value of x(t) at that time t.
The nonlinear transformation function used in this paper is in the form of a hyperbolic sine function and its inverse [19,20]:
g ( x ) = e θ 1 x e θ 2 x K u > 3 ln θ 1 x + ( θ 2 x ) 2 + 1 0 < K u < 3
When the parameters θ1 and θ2 in Equation (6) are equal, it indicates that the skewness of the signal y(t) is zero. In this paper, non-Gaussian signals with both a mean and skewness equal to zero are considered. In this case, the approximate closed-form solution for kurtosis control in Equation (6) is
θ 1 = θ 2 = 3.48 ( K u 3 ) 0.171 2 K u > 3 2.36 e 3 K u 2 0 < K u < 3

3. Fatigue Life Calculation in Frequency Domain

3.1. Fatigue Life Calculation

The random vibration stress studied in this paper is a stationary non-Gaussian random process, represented by X(t). In the frequency domain, the PSD of the random stress X(t) is denoted as GXX (f), which is a one-sided spectrum. The i-th order spectral moment mi of GXX (f) is defined as
m i = 0 + f i G X X ( f ) d f
where the unit of frequency f is Hz. The variance in the stochastic process X(t) can be represented as σ X 2 = m 0 . The spectral width parameter is denoted as
α i = m i m 0 m 2 i
The peak frequency vp is defined as
v p = m 4 m 2
The S-N curve of a material is
N · S k = C
where k and C are material parameters, S is the stress amplitude, and N is the corresponding number of cycles to failure or life. According to the Miner cumulative damage rule, fatigue damage can be defined as
D = i = 1 q n i N ( S i )
where ni is the number of rainflow cycles in the i-th block of stress amplitude Si, q is the total number of stress blocks, and N(Si) is the life corresponding to stress amplitude Si, which can be calculated from the S-N curve in Equation (11). Assuming that the total number of peak occurrences in the stochastic process X(t) is equal to the total number of cycles i = 1 q n i , then the probability of stress amplitude S = Si is given by
f i = n i i = 1 q n i
Therefore, the PDF of the stress amplitude S is fi. Then, the fatigue damage in Equation (12) can be written as
D = i = 1 q n i N ( S i ) = i = 1 q f i i = 1 q n i N ( S i )
Combining the expression of the S-N curve in Equation (11), the fatigue damage can be written as
D = i = 1 q f i i = 1 q n i C / S k = C 1 i = 1 q n i i = 1 q f i S k
The number of peak i = 1 q n i occurrences in the time unit corresponds to the peak frequency vp. If the PDF of the stress amplitude S is represented with a continuous function p(S), then the fatigue damage in the time unit time can be written as
D g = v p C 1 0 + S k p ( S ) d S
where the function p(S) represents the PDF of stress amplitude in the rainflow cycles. Determining p(S) is crucial for frequency domain random fatigue analysis, because Equation (15) is applicable to both Gaussian and non-Gaussian situations. But so far, there is no analytical expression for p(S) under non-Gaussian conditions. So, this article is dedicated to studying the PDF of stationary non-Gaussian stress amplitudes.
For the computation of non-Gaussian fatigue using the correction method, the damage Dg caused by Gaussian fatigue under the same PSD can be multiplied by a correction factor λ ng to obtain damage caused by non-Gaussian fatigue, which is represented as
D ng = λ ng D g
The non-Gaussian correction factor [12] is defined as
λ ng = e m 3 / 2 π K u 3 5 S k 2 4
where Ku and Sk, respectively, represent the kurtosis and skewness of the signal, while m = −1/k denotes the slope of the S-N curve as described in Equation (11)

3.2. Stress Rainflow Range PDF Model

(1)
Dirlik model for Gaussian case
Dirlik approximated the rainflow cycle PDF of wideband random stresses using one exponential distribution and two Rayleigh distributions. The expression for the rainflow cycle PDF of Gaussian wideband random processes is [1]
p DK ( Z ) = D 1 Q e Z Q + D 2 R 2 Z e Z 2 2 R 2 + D 3 Z e Z 2 2
where
  Z = S 2 m 0       γ = m 2 m 0 m 4       X m = m 1 m 0 m 2 m 4 R = γ X m D 1 2 1 γ D 1 + D 1 2       Q = 1.25 ( γ D 3 D 2 R ) D 1 D 1 = 2 ( X m γ 2 ) 1 + γ 2       D 2 = 1 γ D 1 + D 1 2 1 R       D 3 = 1 D 1 D 2
(2)
Tovo–Benasciutti model for Gaussian case
The Tovo–Benasciutti PDF model is a combination of the Narrow-Band and the Range-Count counting PDF methods, as shown in the following formula [9]
p TB ( S ) = b p LCC ( S ) + ( 1 b ) p RC ( S )
where, p LCC ( S ) is a Rayleigh-type PDF of the Narrow-Band process
p LCC ( S ) = α 2 S σ X 2 exp 1 2 S σ X
p RC ( S ) is the Range-Count counting PDF
p RC ( S ) = S σ X 2 α 2 2 exp 1 2 S σ X α 2 2
And the weight b depends on the spectral density of the process.
b = ( α 1 α 2 ) [ 1.112 ( 1 + α 1 α 2 ( α 1 + α 2 ) ) e 2.11 α 2 + ( α 1 α 2 ) ] ( α 2 1 ) 2
In Equation (23), α1 and α2 are spectral width parameters described in Equation (10).
(3)
Bi-Gamma model for non-Gaussian case
The rainflow range PDFs of the wideband non-Gaussian stress processes proposed in this paper follow a bi-Gamma distribution; the expression is
p B G ( Z ) = c λ 1 β 1 Z β 1 1 e λ 1 Z Γ ( β 1 ) + ( 1 c ) λ 2 β 2 Z β 2 1 e λ 2 Z Γ ( β 2 )
where Γ(·) is the Gamma function, and β 1 , β 2 , λ 1 , λ 2 , c are parameters of the bi-Gamma distribution, which can be optimized through fitting to the stress rainflow cycle PDF values. The optimization object is expressed as
min i = 1 M ( p i R p i Z ) 2
where p i R represents the PDF sequence values of rainflow counts, and p i Z is the sequence values calculated from Equation (24). By initializing β 1 , β 2 , λ 1 , λ 2 , c and utilizing a nonlinear optimization algorithm to minimize Equation (25), the optimal solution obtained corresponds to the parameters of the bi-Gamma distribution in Equation (24).

4. Neural Network Prediction Model

4.1. PDF bi-Gamma Model

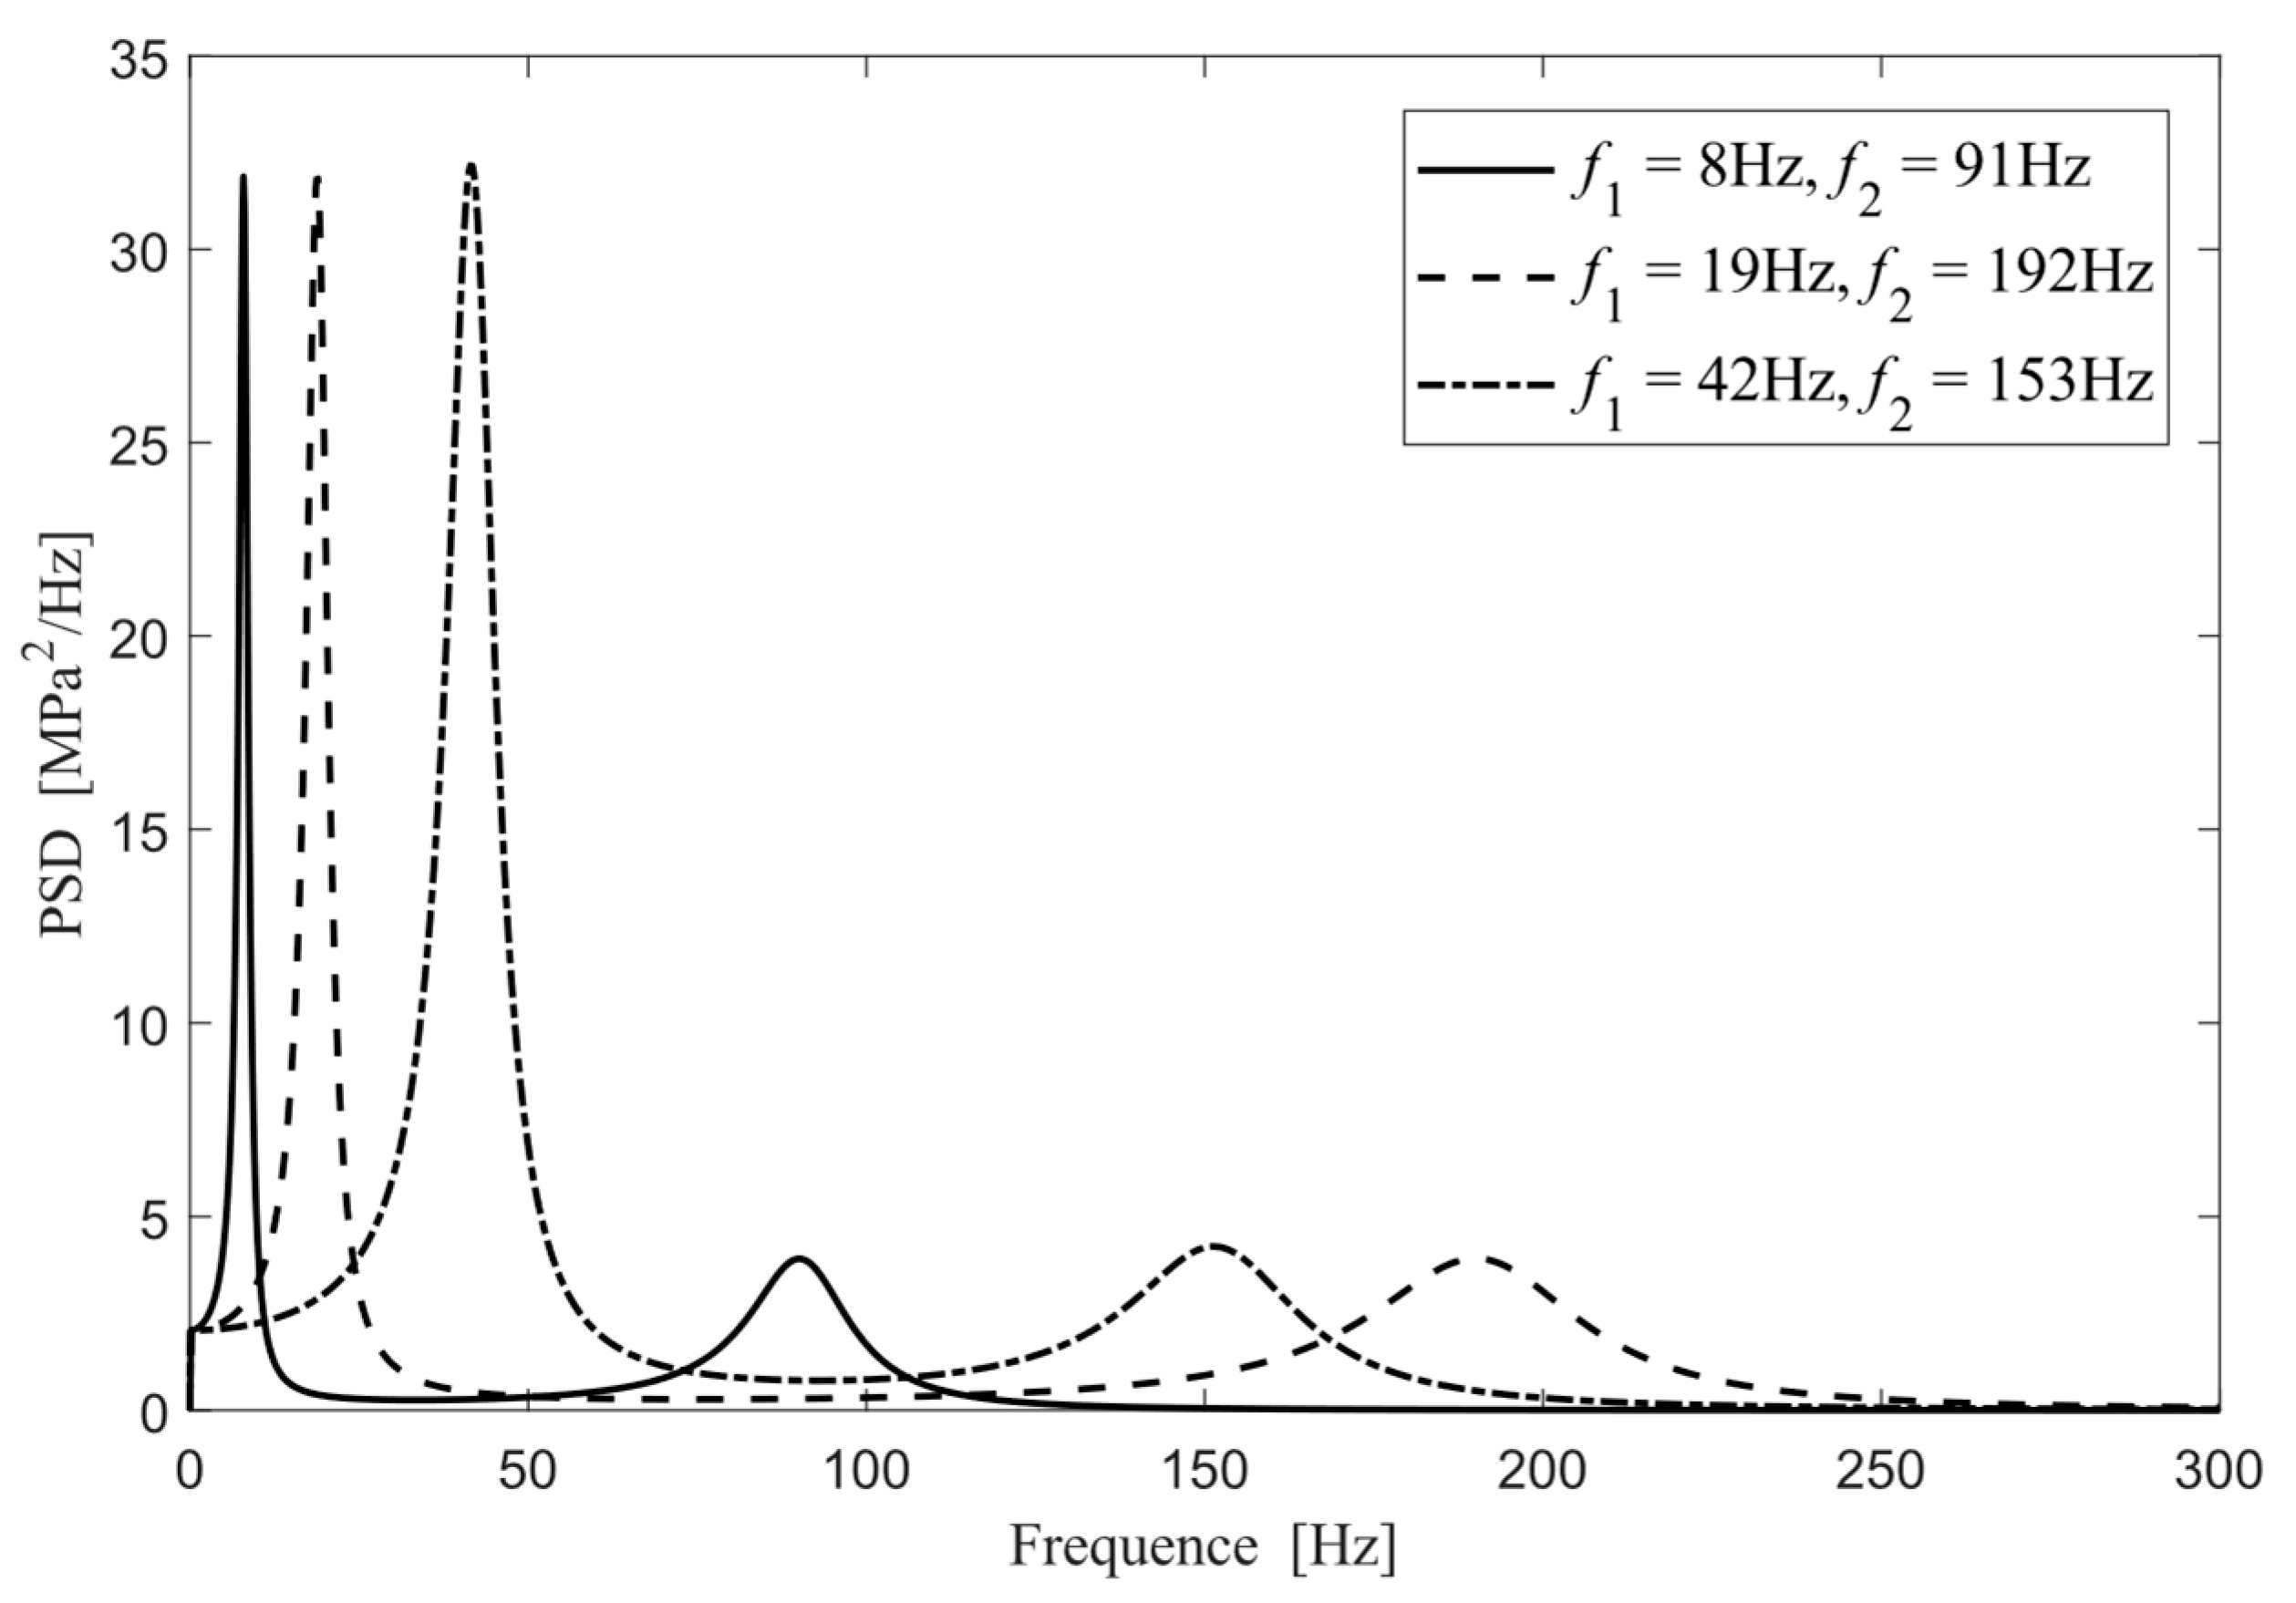
For the stress PSD described in Equations (3) and (4), the amplitudes are set as A1 = 0.4 MPa and A2 = 0.15 MPa, to ensure that the stress levels are within an appropriate range. Based on the actual frequency band and damping characteristics of the engineering structure, let f1 = 5~55 Hz, f2 = 60~200 Hz, ζ1 = ζ2 = 0.1, and Δf = 300/2048 = 0.1456 Hz. By varying the values of f1 and f2, multiple sets of stress PSDs can be obtained. Figure 2 shows three stress PSDs with different parameters.
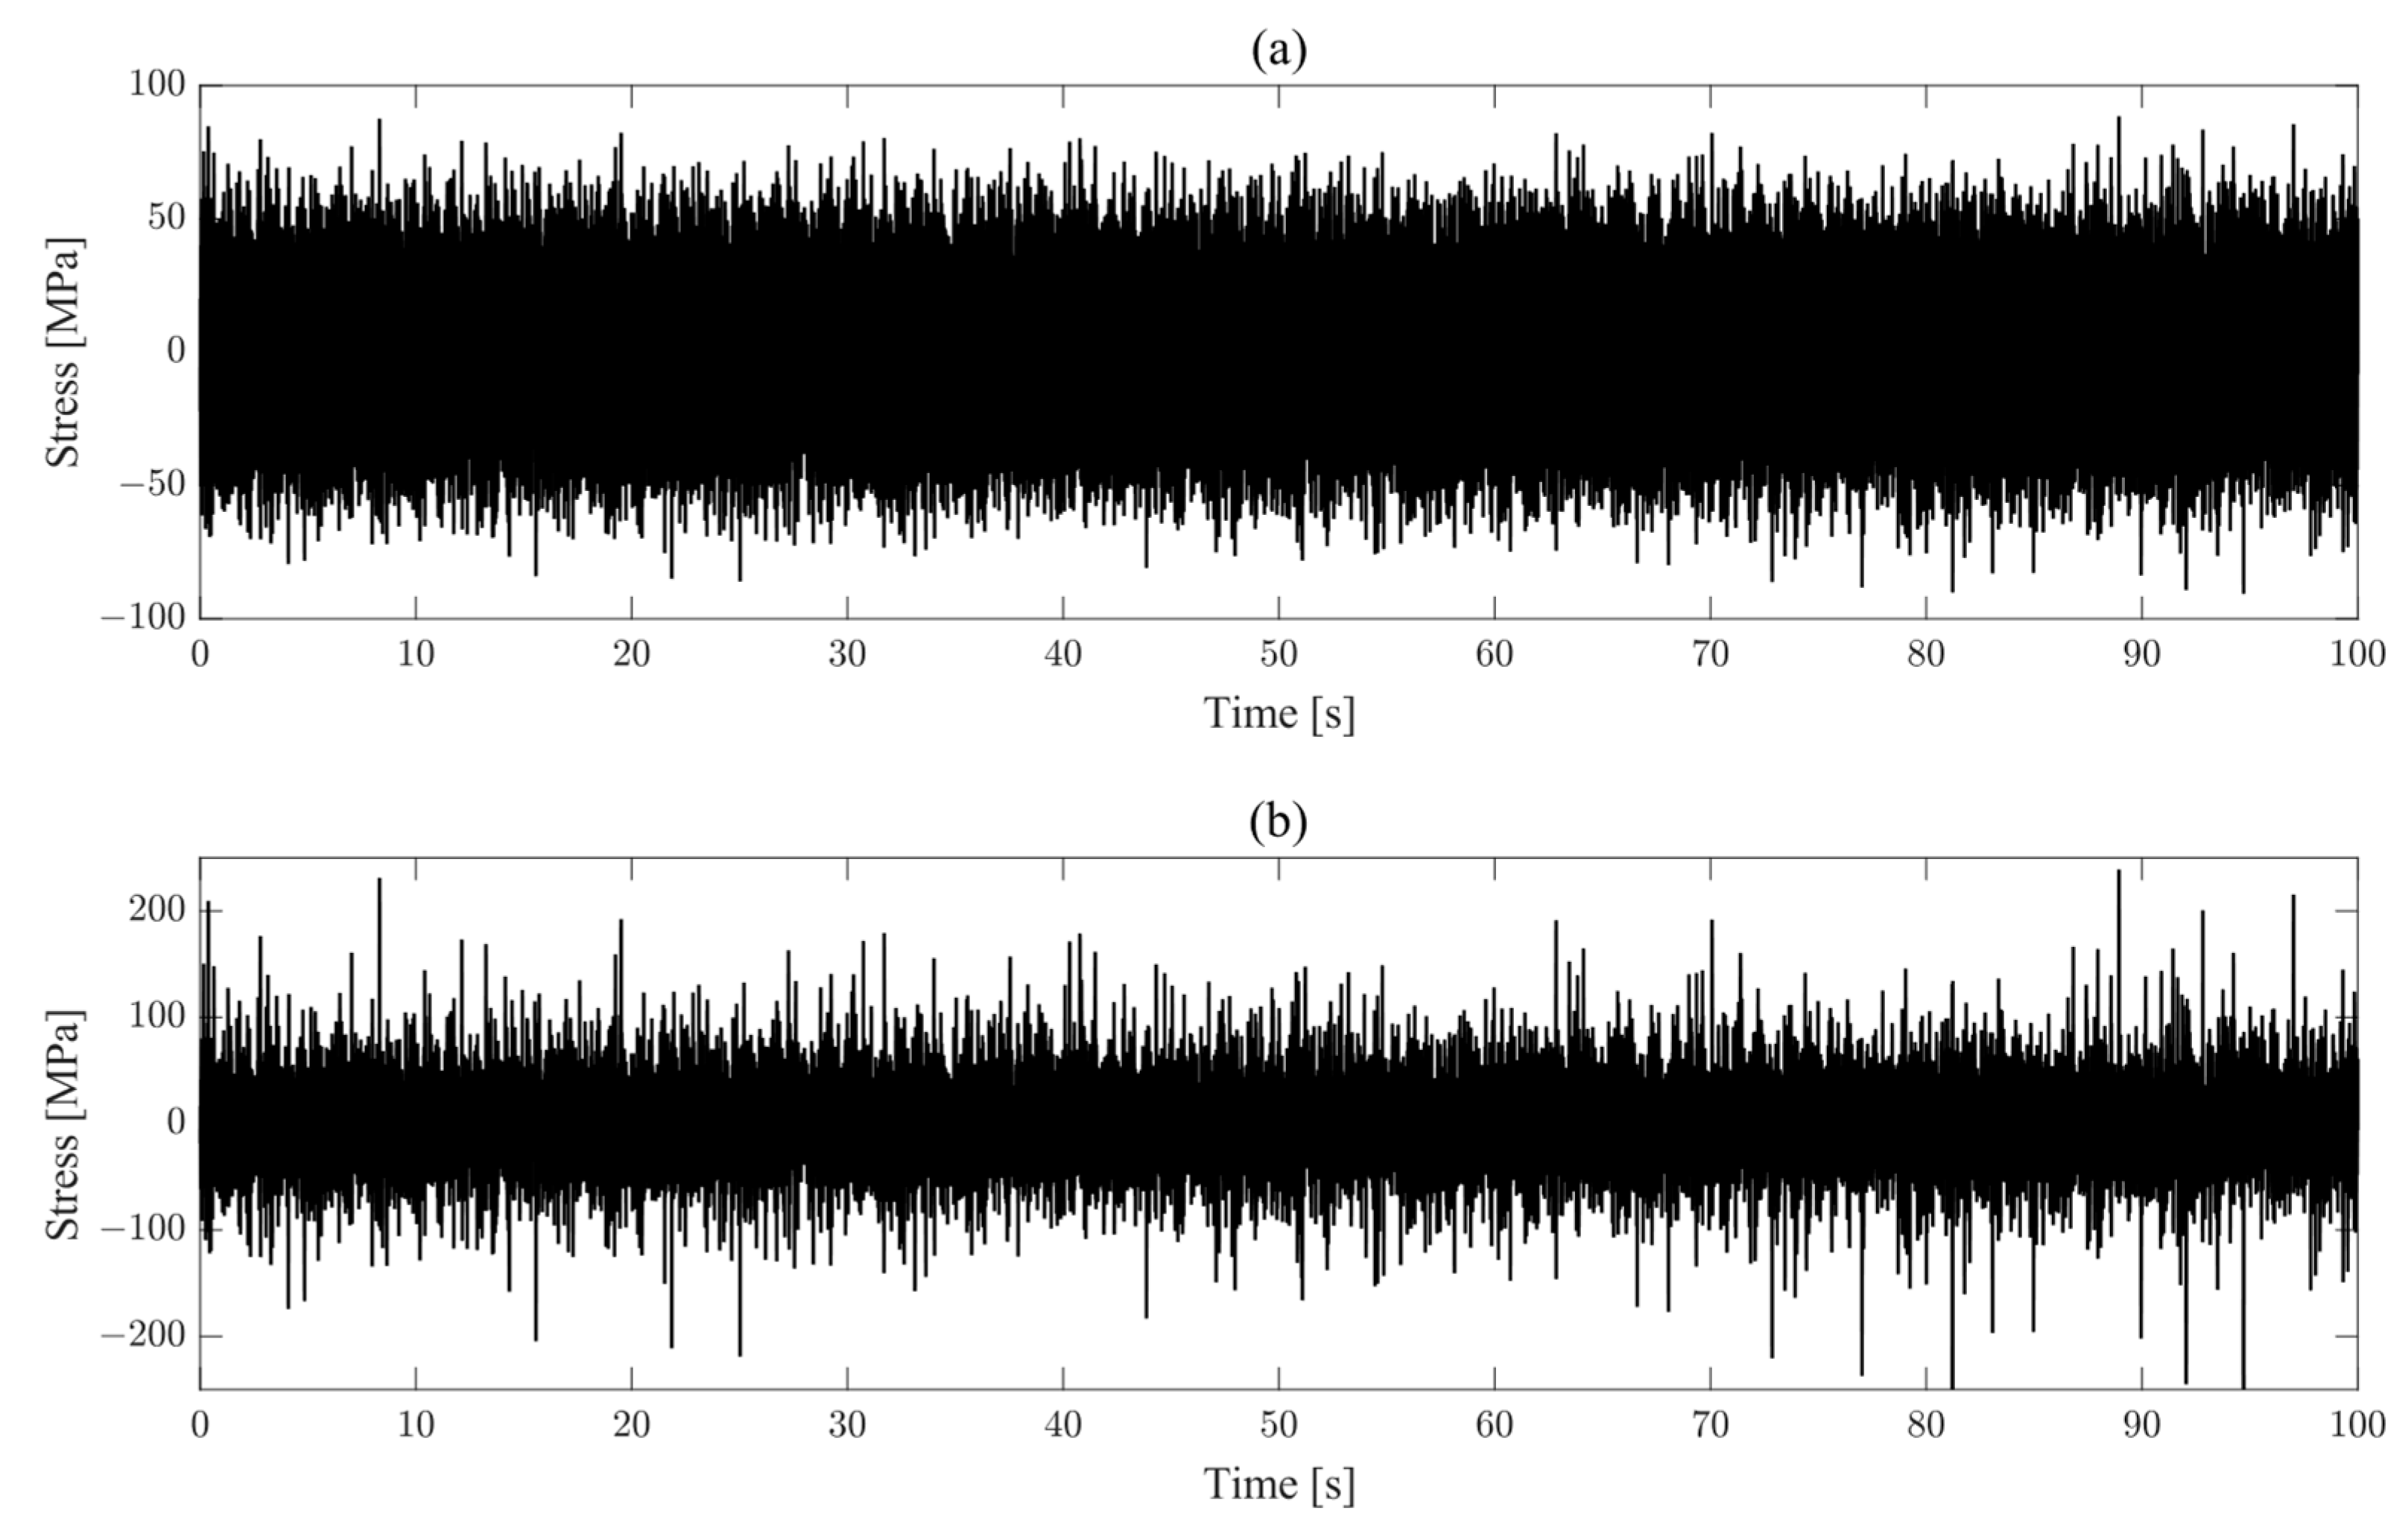
For every stress PSD described in Figure 2, the corresponding Gaussian stress time-domain data are obtained by inverse Fourier transform and time-domain randomization method. Further, specified kurtosis non-Gaussian transformations are applied to these signals to create non-Gaussian signals. This study focuses solely on non-Gaussian signals with mean and skewness values of 0. Figure 3 illustrates the stress time-domain plots for f1 = 8 Hz and f2 = 91 Hz, along with their respective time-domain plots after transforming with a kurtosis value of Ku = 7.5. Parameters such as kurtosis and root mean square values before and after the transformation are presented in Table 1.
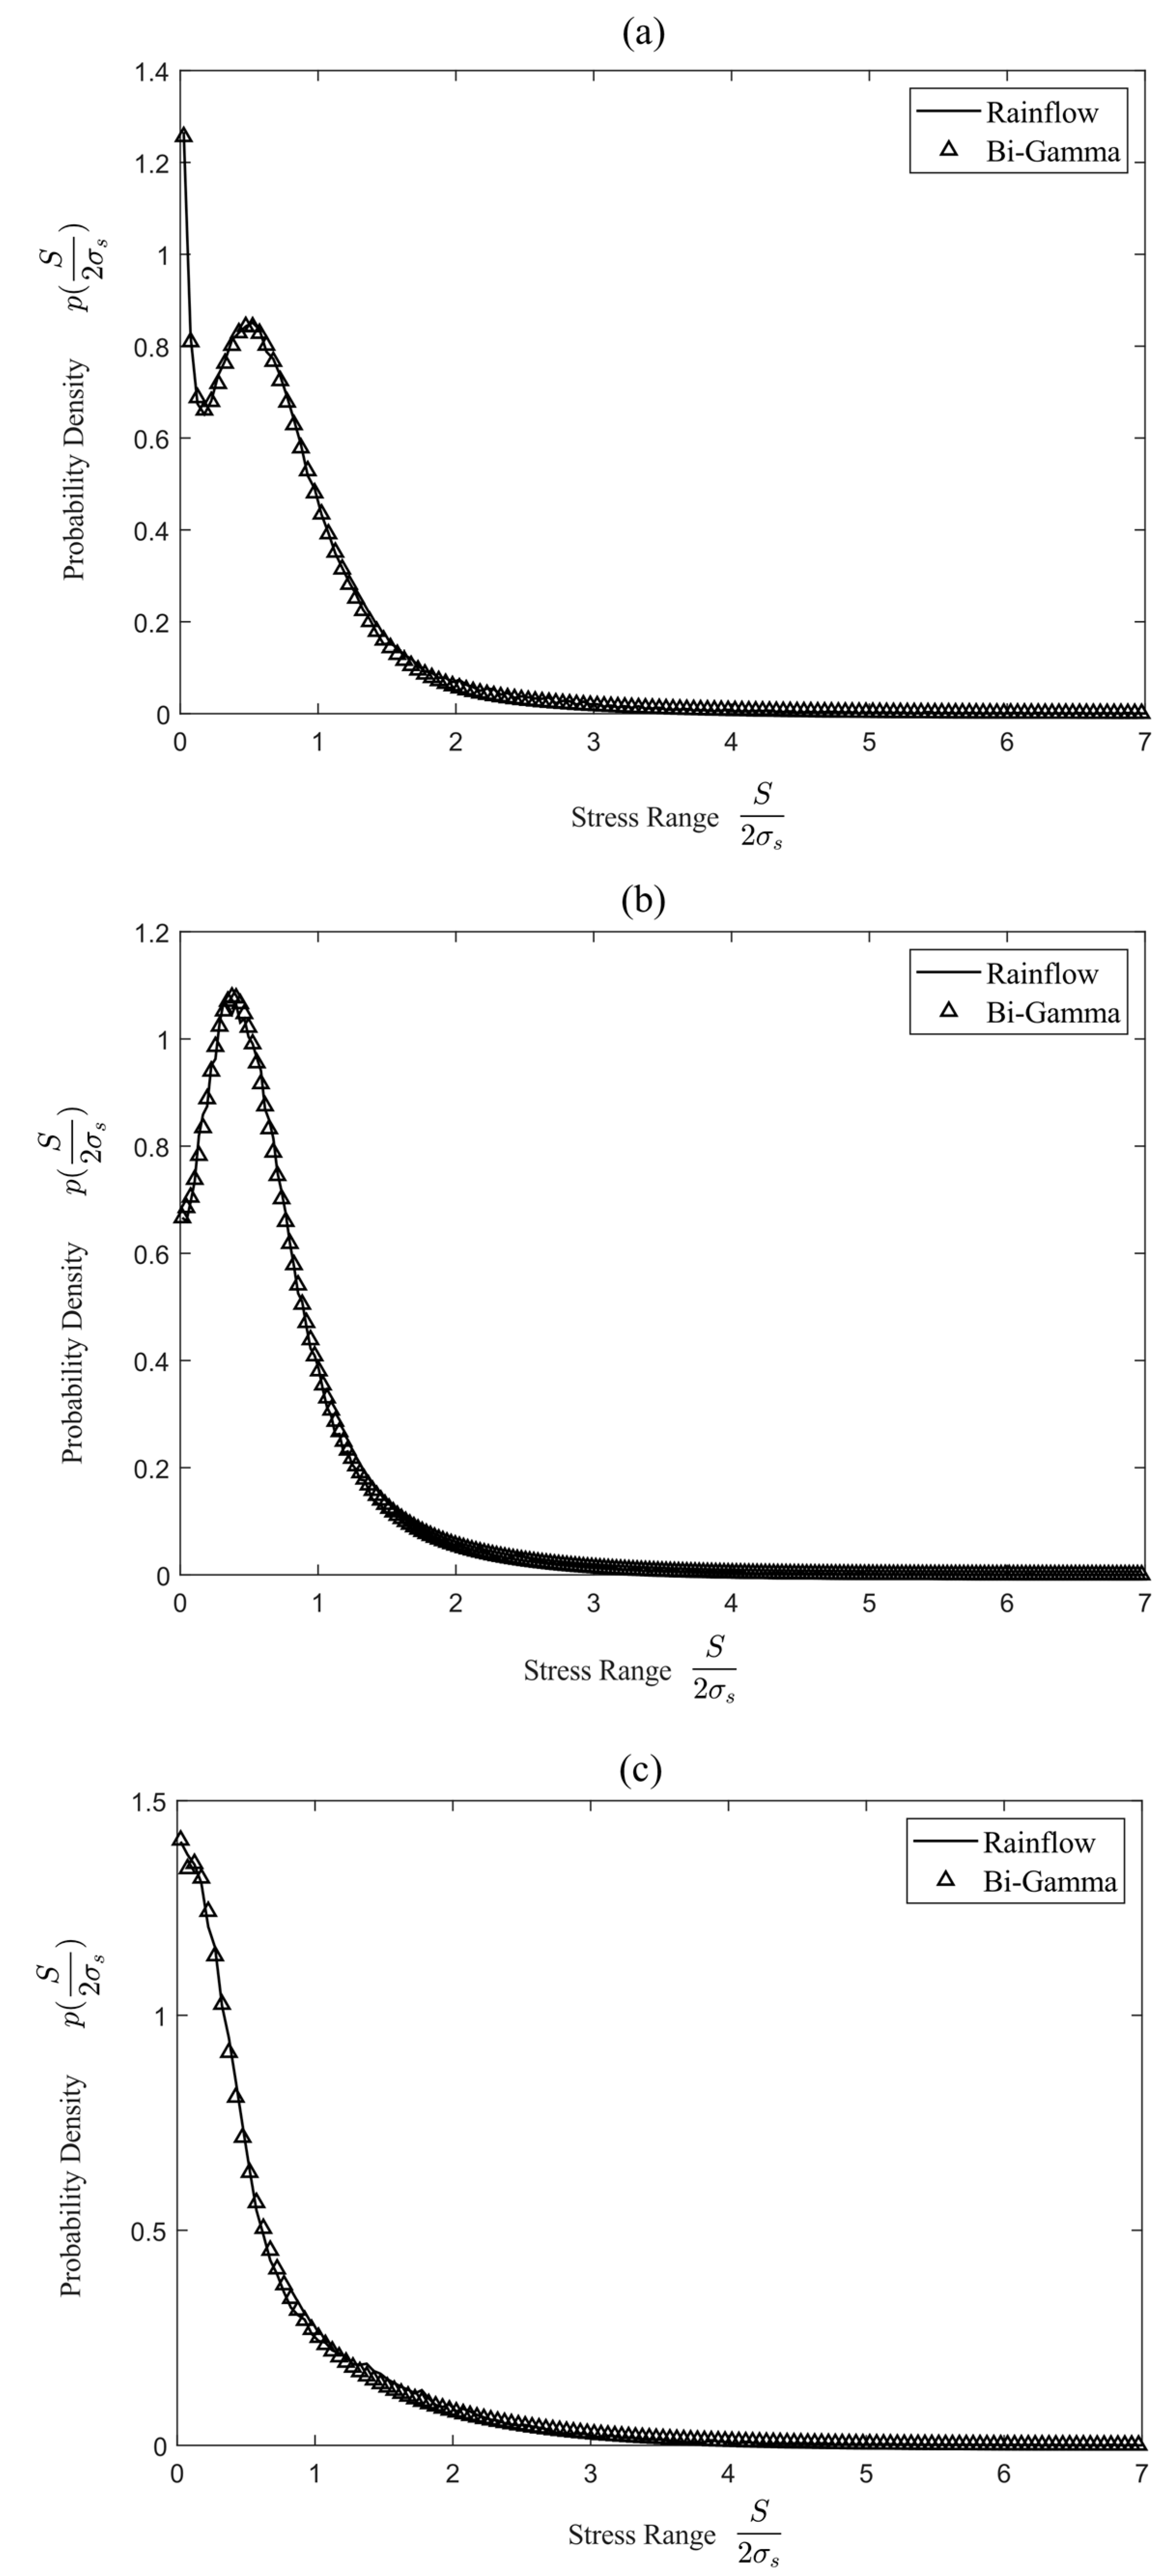
These non-Gaussian signals are then subjected to rainflow counting to obtain their rainflow range PDF. Subsequently, the parameters of the rainflow statistical PDFs are fitted by the bi-Gamma model, and the fitting results of the three PSDs in Figure 2 are presented in Table 2. A comparison of the results for the PDFs are illustrated in Figure 4.

4.2. Dataset Generation and Establishment of Neural Network Model

The neural network utilized in this paper is the Bayesian regularized neural network [20], as depicted in Figure 5. Where, wi,j represents the weighting function of the neural network, I1,…, I7 are the parameters of the input layer and O1,…, O5 are the parameters of the output layer.
To account for the influence of higher-order moments in the stress spectrum, seven input parameters are used, which are τ 1 = m 1 / m 0 , τ 2 = m 2 / m 1 , τ 3 = m 3 / m 2 , τ 4 = m 4 / m 3 , τ 5 = m 5 / m 4 , τ 6 = m 6 / m 5 , and the kurtosis Ku of the stress. The output parameters consist of the five parameters of the bi-Gamma model β 1 , β 2 , λ 1 , λ 2 , c . The reason for using the ratios of spectral moments as input parameters is that the magnitudes of spectral moments vary significantly, but the ratios are on the same scale.
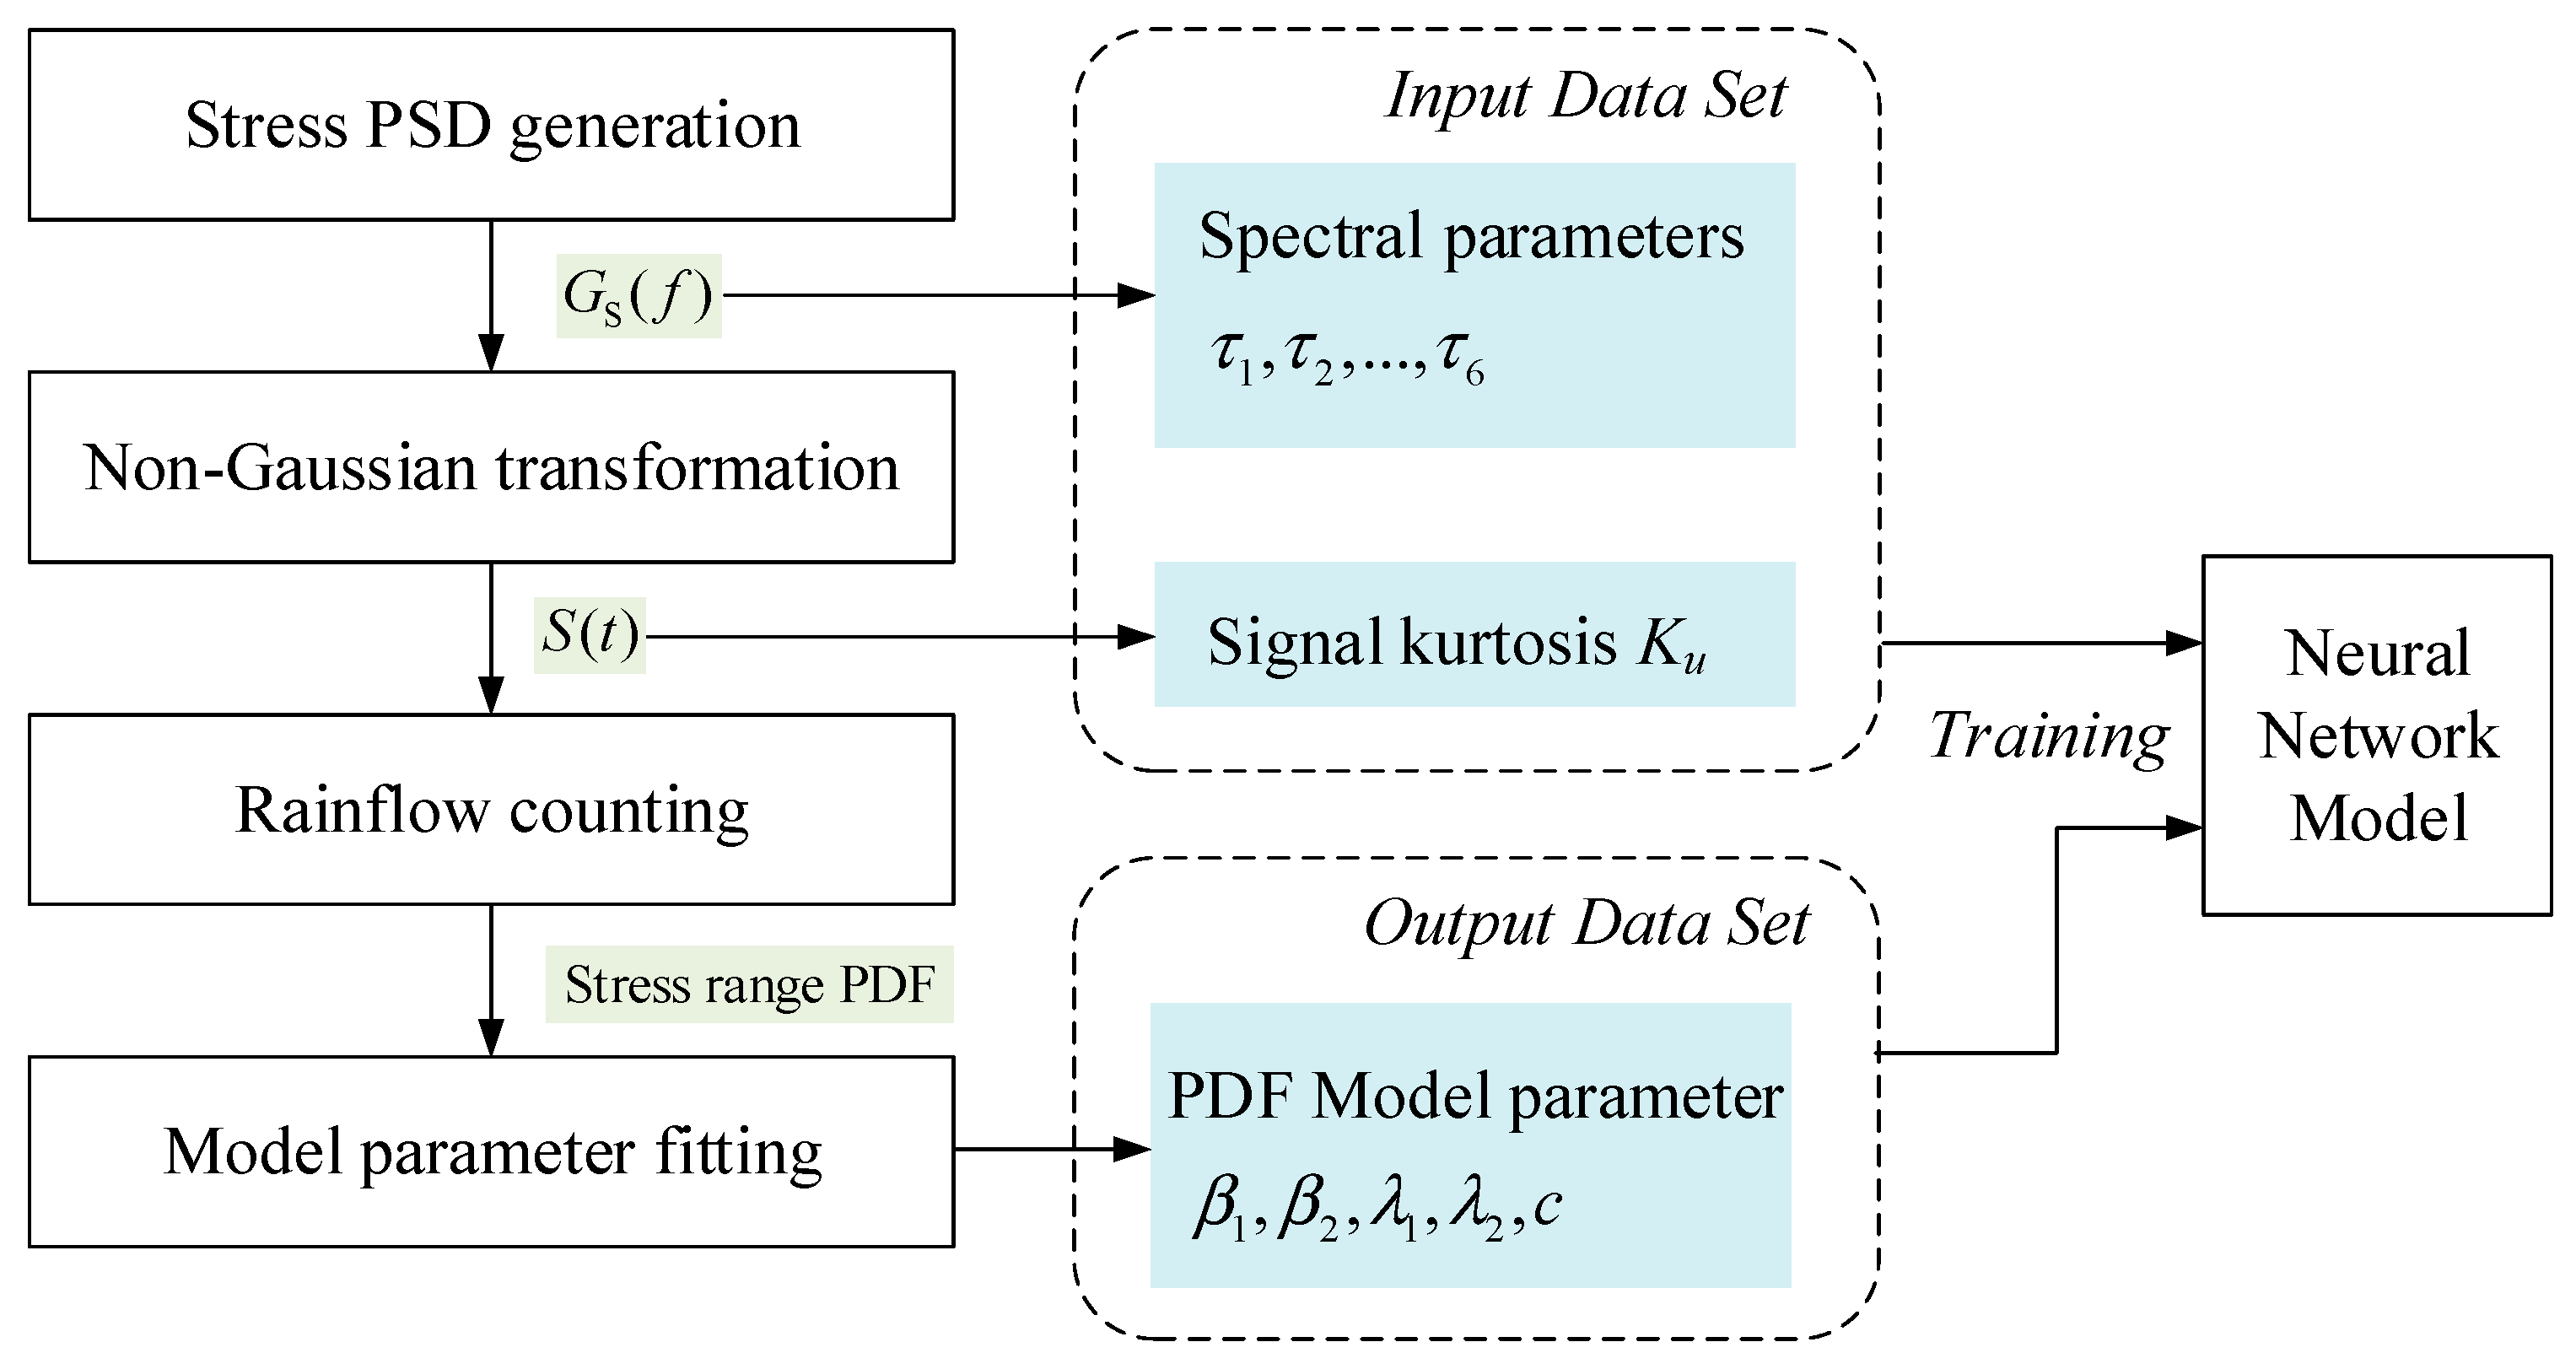
The process of generating the dataset for training the neural network is depicted in Figure 6. Once the stress PSD required for training is determined, a time-domain randomization method is employed to generate corresponding Gaussian stress time-domain data. Subsequently, the data are transformed into non-Gaussian stress. Then, the obtained non-Gaussian stress time-domain signal is used to statistically calculate its amplitude PDF using the rainflow counting method. The parameters of the bi-Gamma model are fitted to the amplitude PDF, resulting in model parameters that serve as the output parameters of the neural network. Simultaneously, the spectral parameters are calculated for the original stress PSD, and these spectral parameters along and the kurtosis value are used as input parameters for the neural network. After generating multiple sets of input–output datasets corresponding to different PSDs, the neural network prediction model can be trained and generated.
According to Equations (3) and (4), let f1 start at 5 Hz, increasing by 1 Hz each time until reaching 55 Hz, resulting in 51 values; similarly, f2 ranges from 60 Hz to 200 Hz, resulting in 141 values. By combining different random combinations of f1 and f2, a total of 7191 stress PSDs are obtained. Among these stress PSDs, 10 sets are randomly selected to serve as a test group for verifying the final results of the neural network training. During the conversion of non-Gaussian stress data, non-Gaussian stresses with kurtosis Ku values of 5, 6, and 7.5 are generated. All of the stress PSDs of the training set are processed according to the procedure in Figure 6 to generate input and output data for training the neural network. After training, a neural network model capable of predicting the rainflow cycle PDFs of wideband random stresses is obtained.

5. Results

The stress PSD parameters of the test group are shown in Table 3. The spectral parameters and kurtosis values of the stress PSDs of the test group are input into the neural network to obtain its output bi-Gamma model parameters. By incorporating these parameters into the bi-Gamma model, the predicted stress rainflow range PDF of the stress range can be obtained.
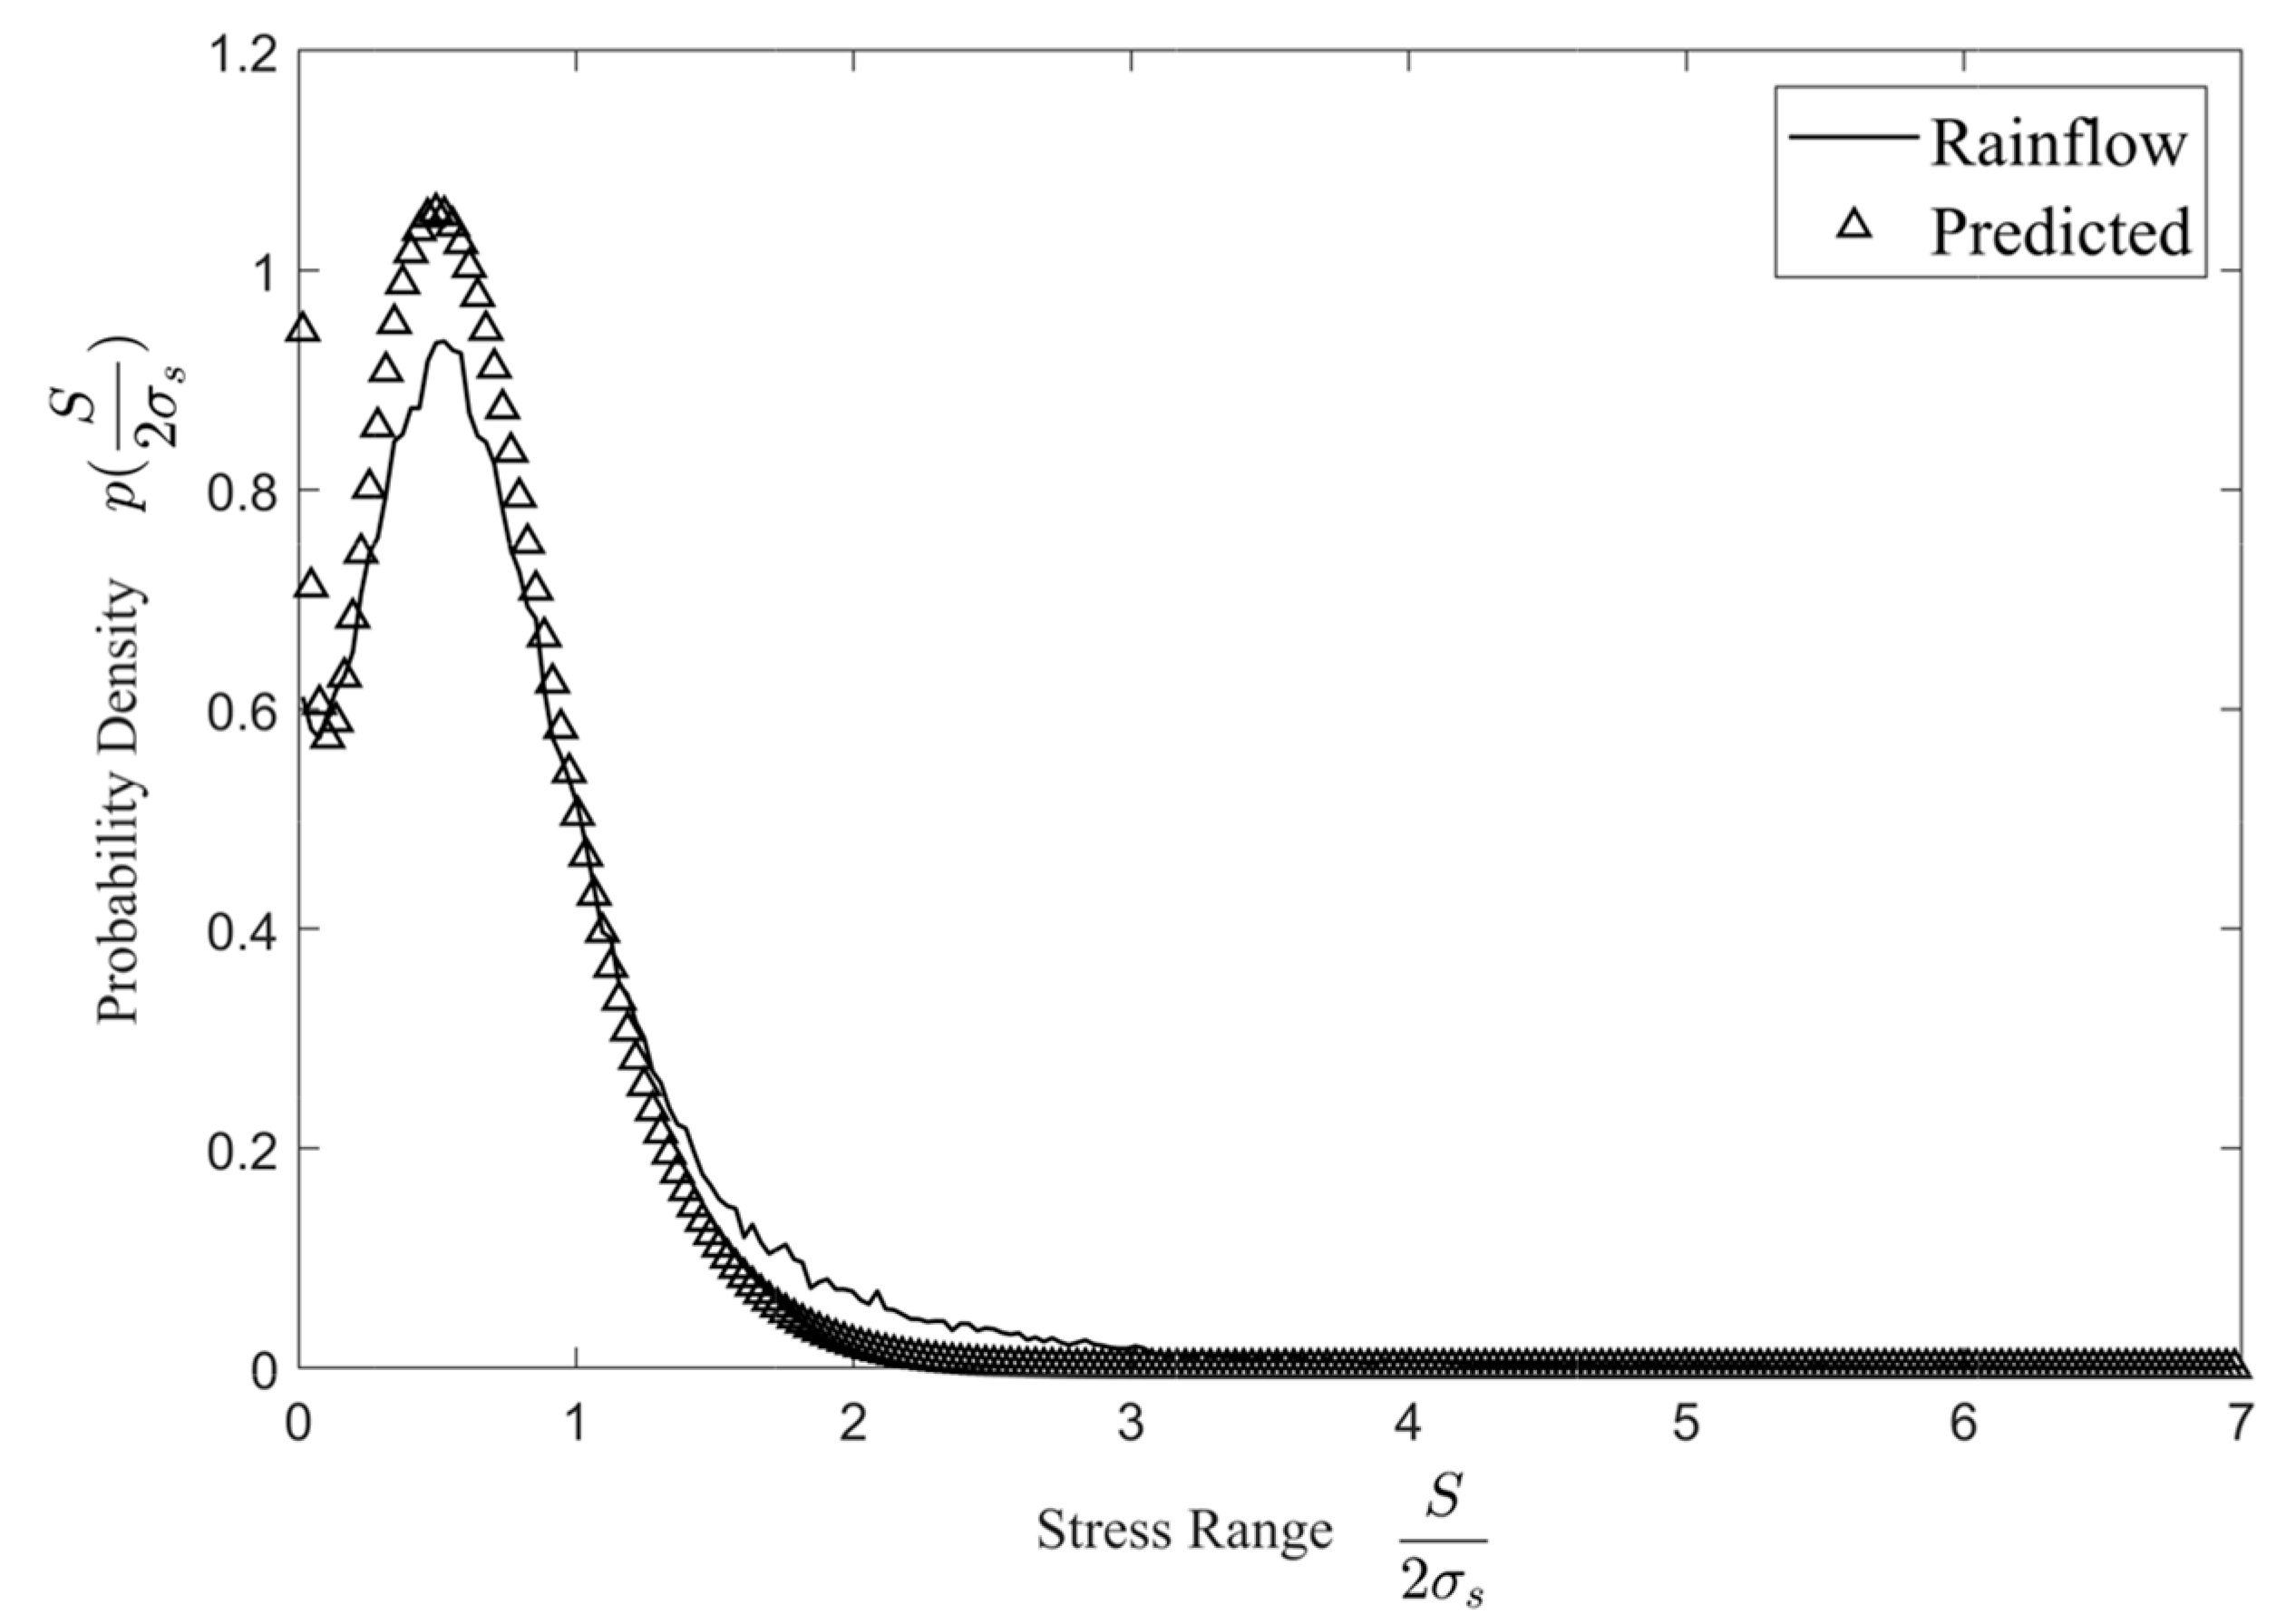
During the testing of the network, the predicted PDF results obtained from the neural network model proposed in this paper are compared with the rainflow range PDF results of the non-Gaussian stress time history under the same stress PSD, as shown in Figure 7. To analyze the consistency between the predicted and calculated PDFs and the corresponding rainflow statistical results, a correlation coefficient is introduced. The definition for the correlation coefficient is as follows
R X Y = E [ ( X μ X ) ( Y μ Y ) ] σ x σ y
where X and Y represent two signal sequences where μ denotes the signal’s mean and σ denotes the signal’s standard deviation. The range of the correlation coefficient RXY is between 0 and 1, where 0 indicates a complete lack of correlation between the two signals, and 1 indicates a perfect correlation between them. The results of the correlation coefficient analysis are depicted in Figure 8.
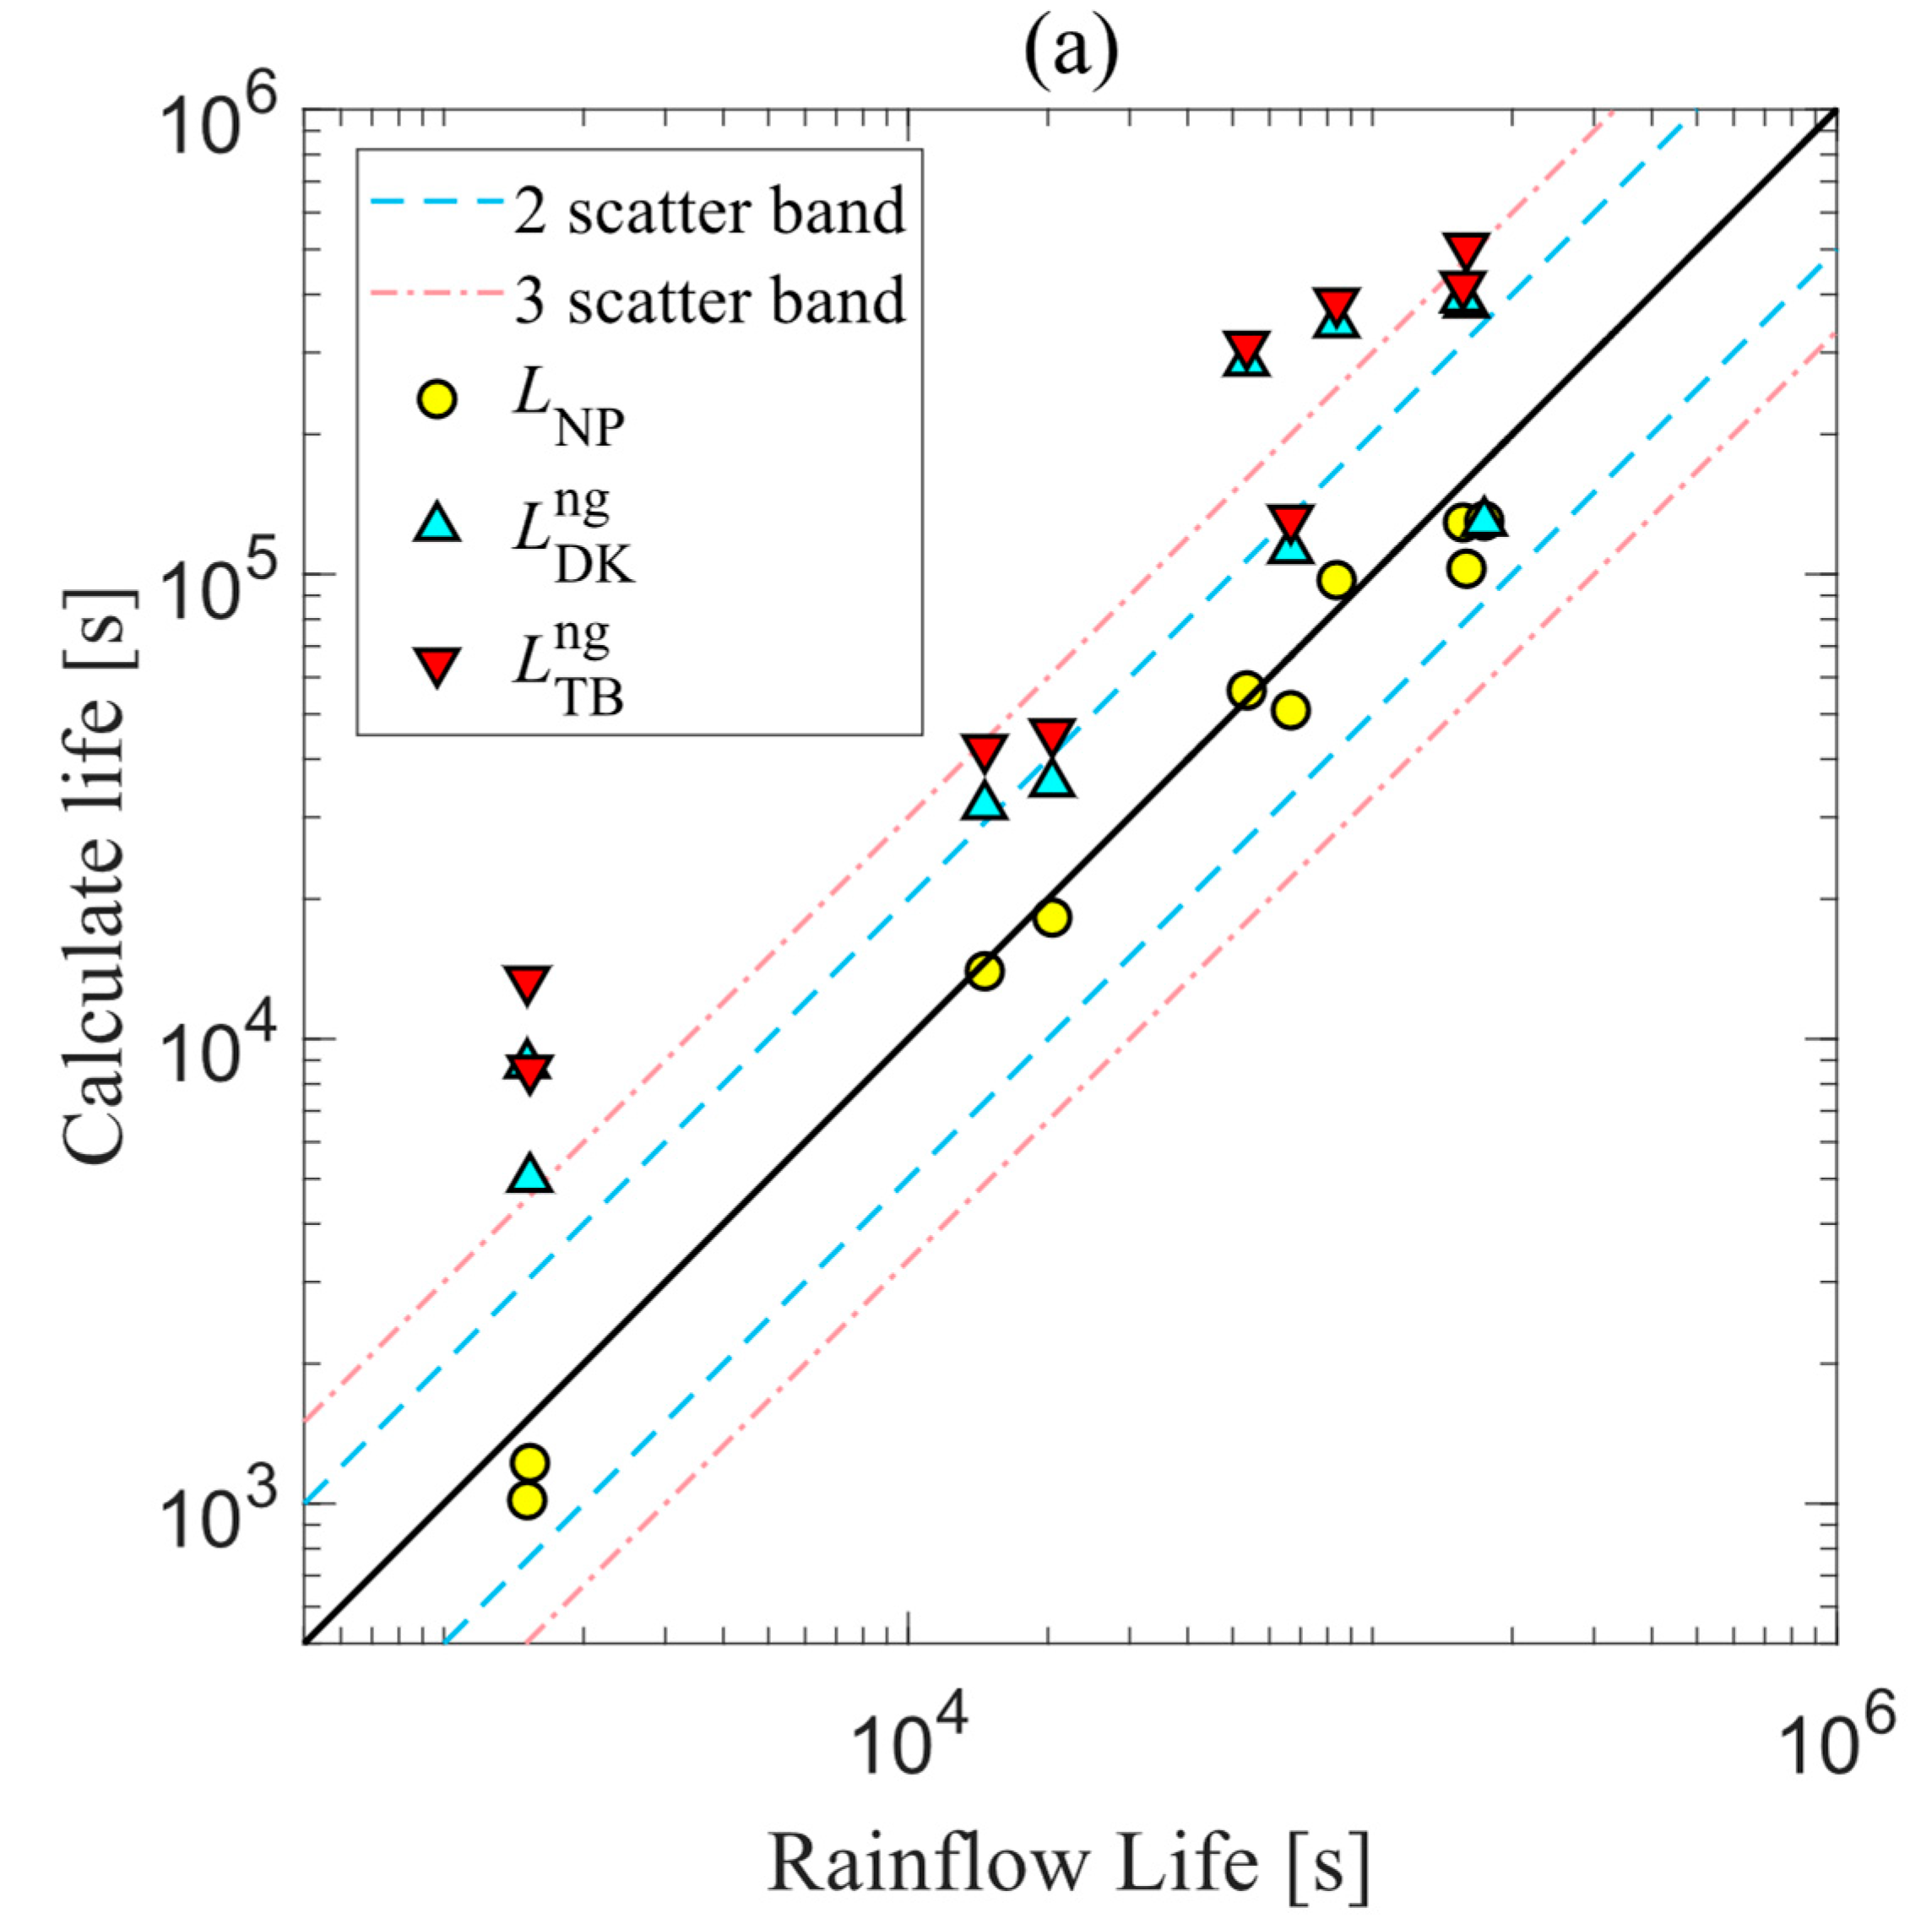
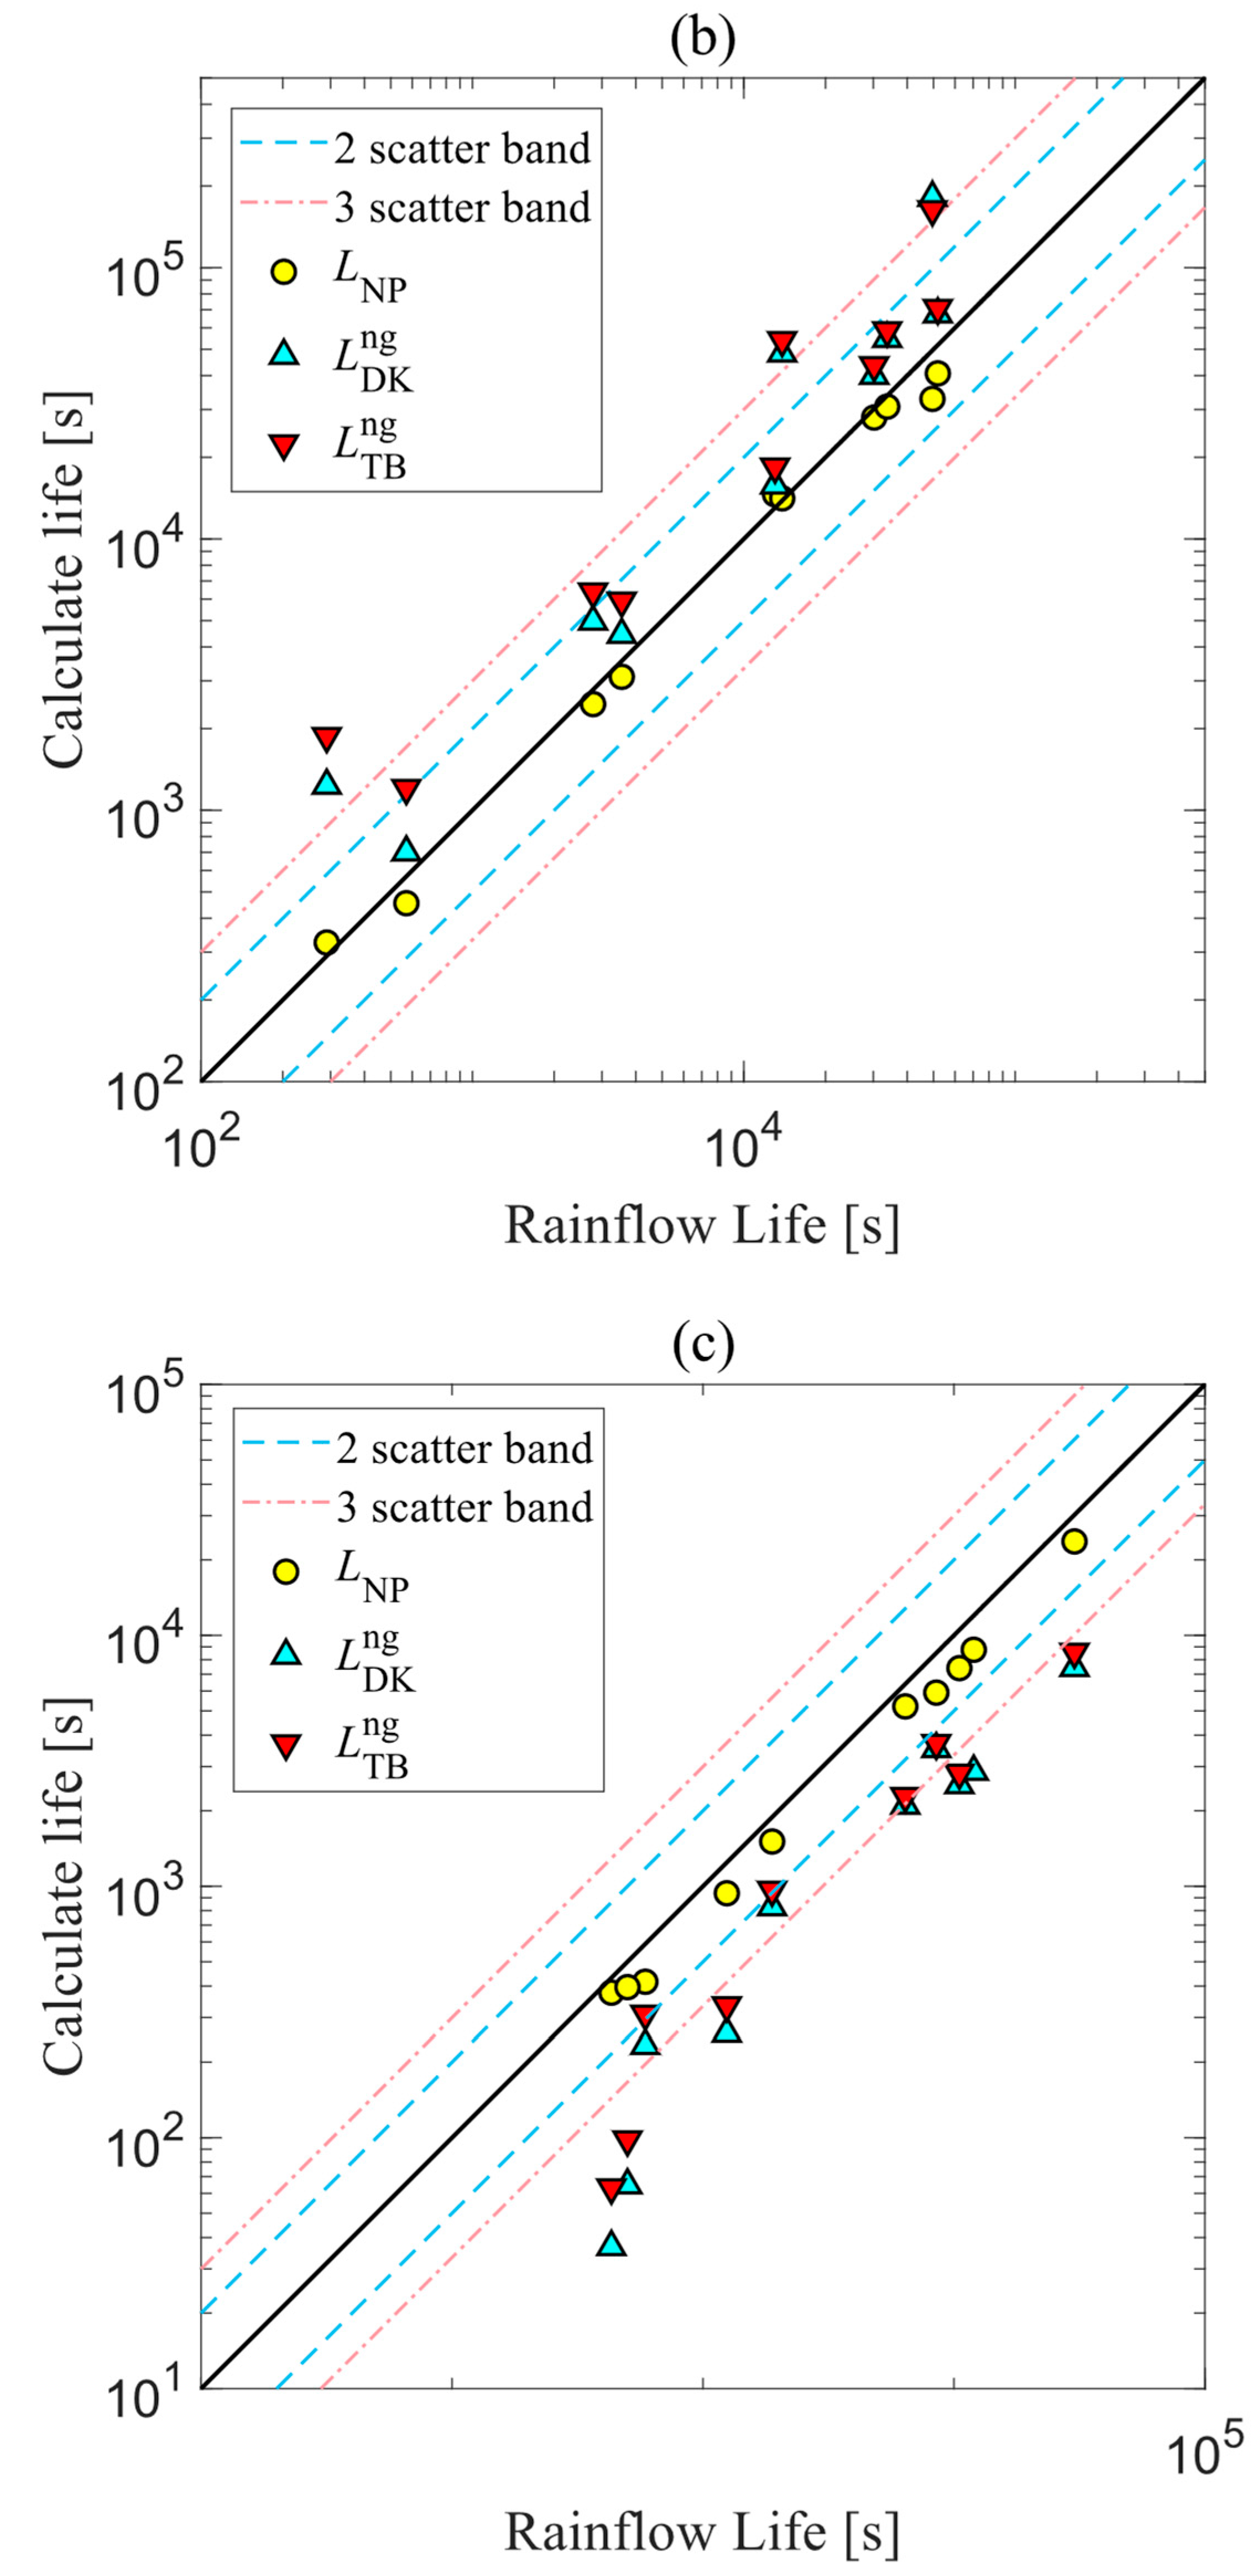
The lifetimes under Gaussian and non-Gaussian stresses with different kurtosis values for the stress PSD described for the test group are calculated separately. The material used for the calculation is aluminum alloy 6061-T6, with S-N curve parameters as shown in Table 4. Table 5 presents a comparison of the lifetime calculation results for a kurtosis of Ku = 7.5. Additionally, the lifetimes for kurtosis values of Ku = 5 and Ku = 6 are also calculated, as depicted in Figure 9.
Table 5 presents the fatigue life calculation results under Gaussian stress with the kurtosis of Ku = 3 and non-Gaussian stress with the kurtosis of Ku = 7.5. For Gaussian stress, the fatigue life results of rainflow counting method L RF g , the Dirlik method L DK g , and the Tovo–Benasciutti method L TB g are compared. It is observed that in this case, the Dirlik method always yields conservative results compared to the Tovo–Benasciutti method. And, it seems that the results of Tovo–Benasciutti are closer to the results for rainflow. For non-Gaussian stress, fatigue life results are computed among the rainflow counting method L RF ng , the correction method with the Dirlik model L DK ng , the correction method with the Tovo–Benasciutti model L TB ng , and the neural network’s prediction method L NP . The results are shown in Figure 9a, b and c, respectively, for the three different kurtosis values. It can be seen that the results of this article method are within the 2-scatter band in comparison to the rainflow life, while the correction method results fall outside the 3-scatter band.
Furthermore, based on the calculation results for the lifetimes under different kurtosis values, it can be observed that when the kurtosis is 7.5, the correction method results based on the Dirlik and Tovo–Benasciutti models are consistently conservative, as shown in Figure 9c. However, as the kurtosis decreases, the predictive results become less conservative, as shown in Figure 9a,b. This also indicates that, for the correction of the non-Gaussian fatigue life, not only should the accuracy of the original Gaussian life calculation should be considered, but the selection of correction coefficients should also be considered.
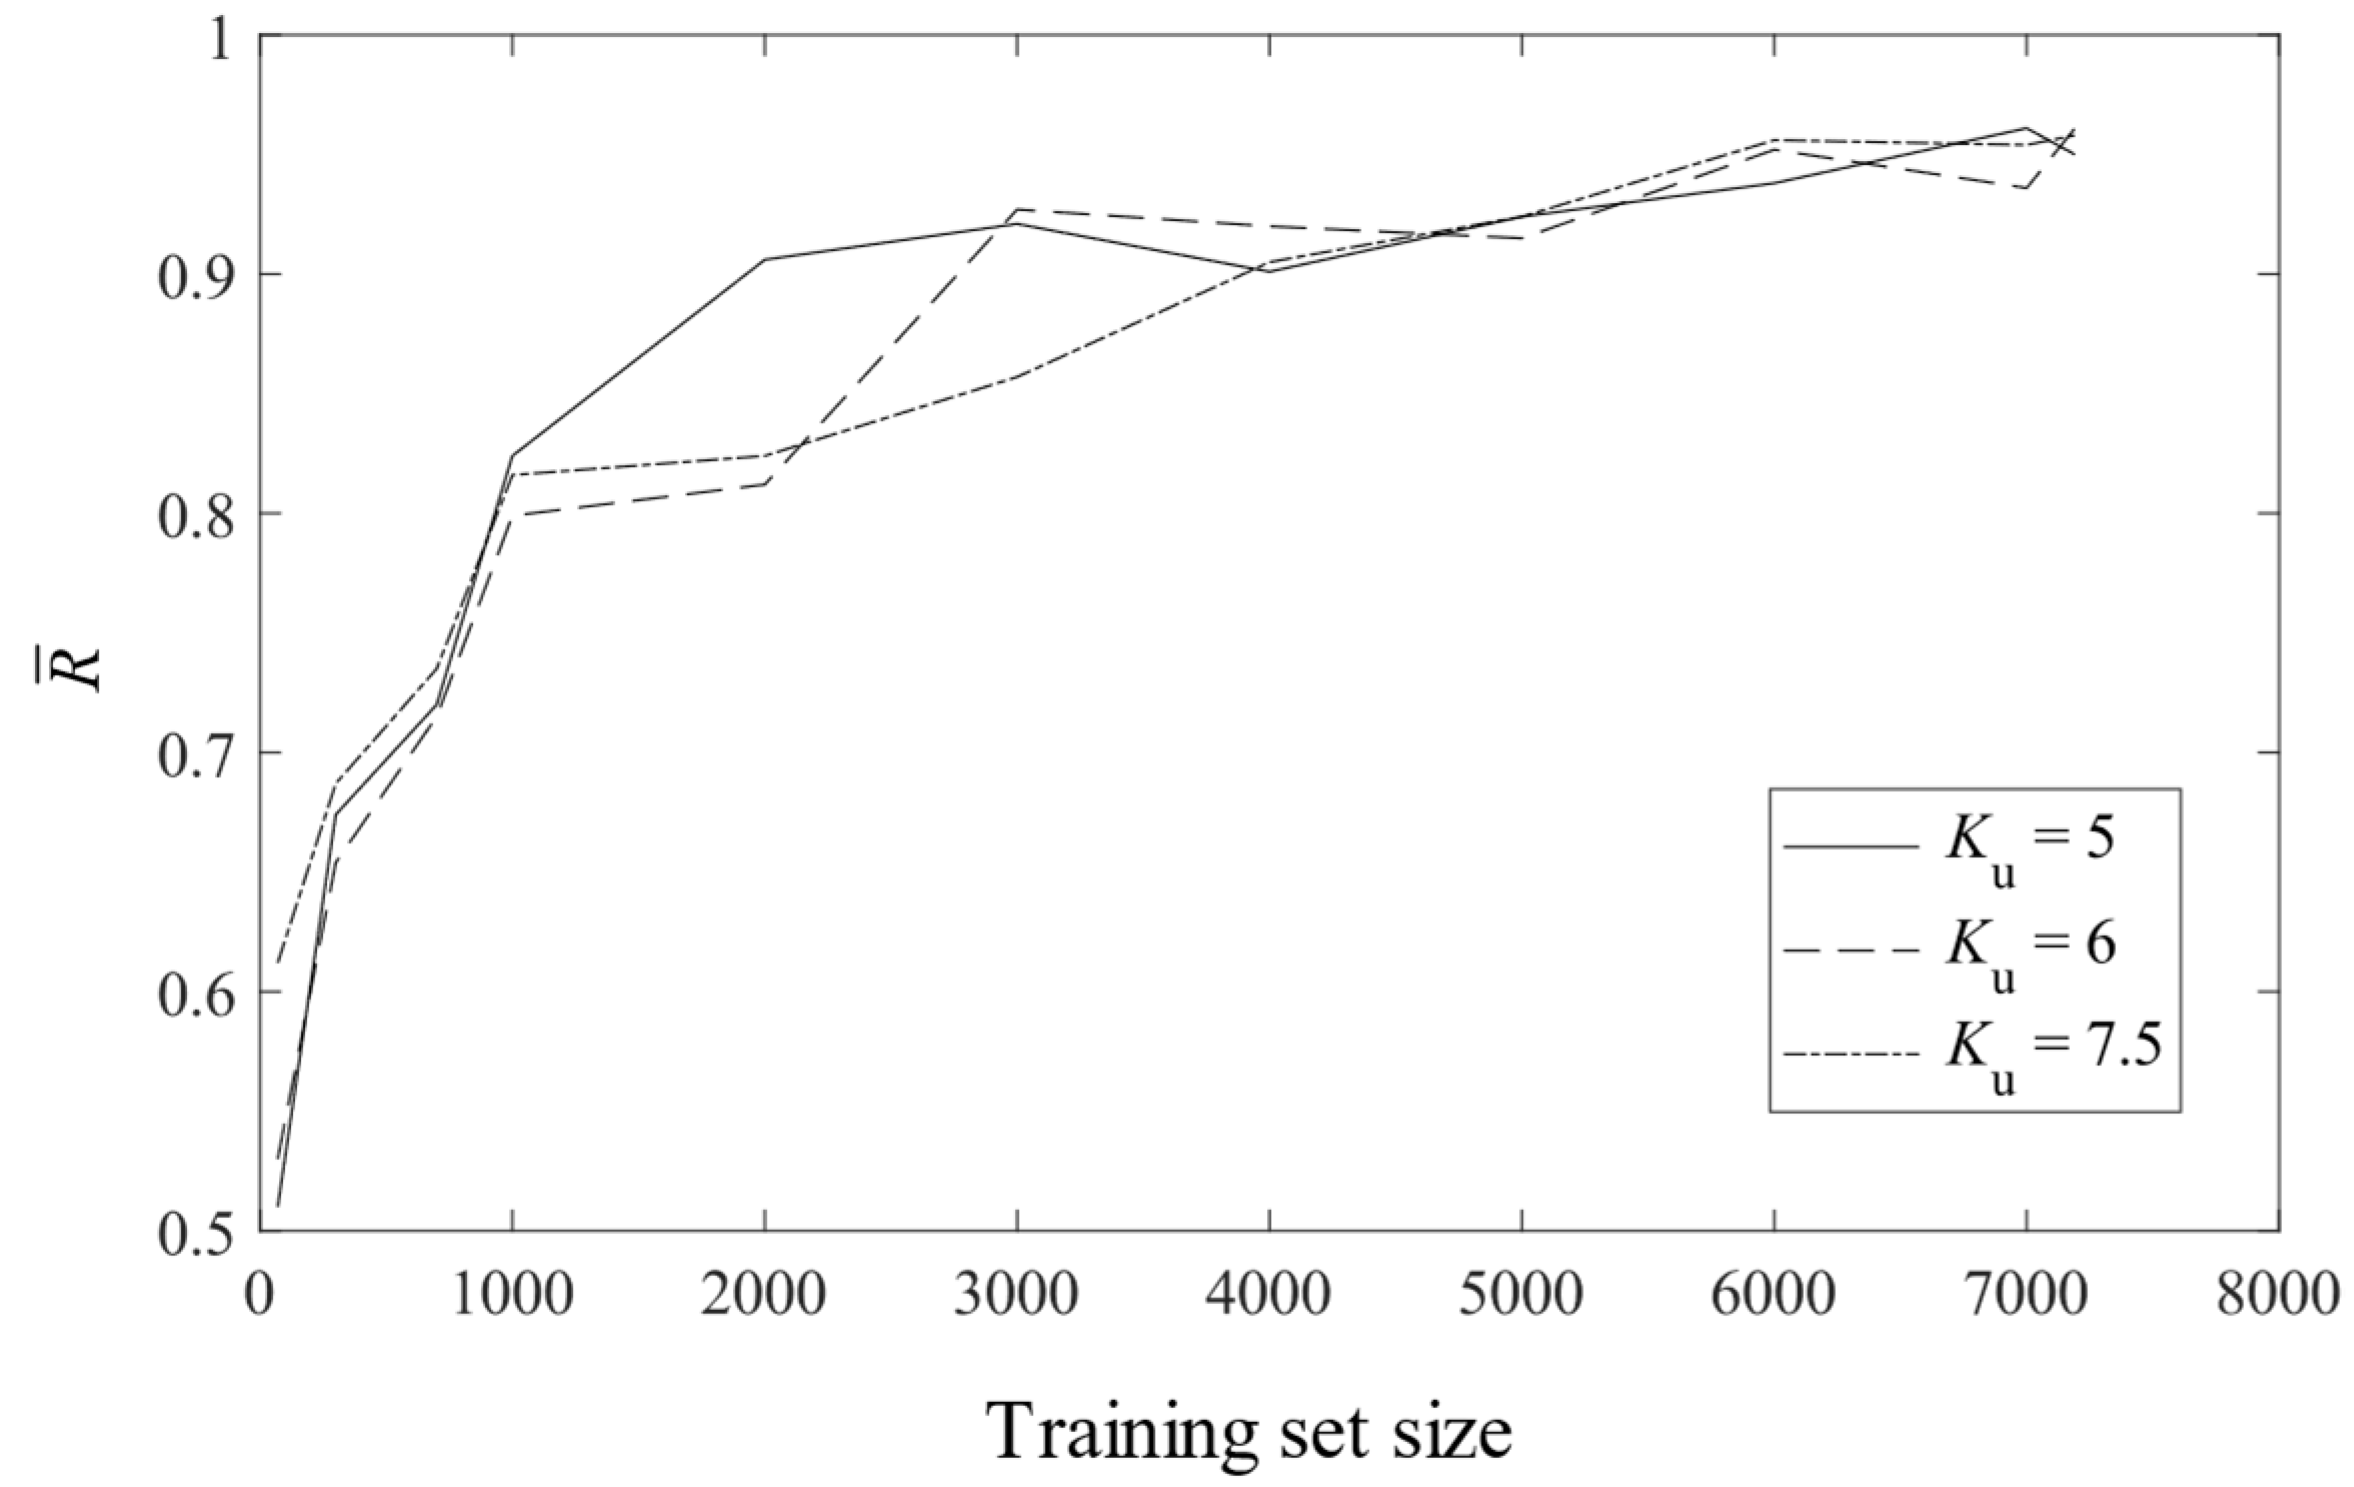
Different training set sizes were used to train the neural network. The purpose was to study the impact of varying training set sizes on the network’s prediction performance. Training was conducted with training set sizes of 70, 300, 700, 1000, 2000, 3000, 4000, 5000, 6000, 7000, and 7197. The neural network’s prediction results were then evaluated using the test set shown in Table 3, and the correlation between the predicted and actual results was analyzed, as shown in the Figure 10 below. R ¯ is the mean correlation coefficient of the 10 test groups in Table 3. The results indicate that when the training set size exceeds 5000, the neural network’s prediction performance stabilizes.
Since the kurtosis values used for training the neural network were 5, 6, and 7.5, the robustness test was conducted using untrained kurtosis values of 3, 4, 4.2, 4.3, 4.5, 5.5, 7, 8, 8.5, and 9 as input parameters, combined with the stress PSD parameters from Table 3 to predict the PDF. The results in Figure 11 show that when the kurtosis values fall within the range of those used during training, the correlation between the predicted PDF and the actual rainflow statistical results is high. However, as the kurtosis values deviate from this range, the correlation gradually decreases. If a correlation of 0.85 is considered an acceptable threshold, the kurtosis values used as input parameters for the neural network predictions should be in the range of 4.3 to 8.

6. Conclusions

In this paper, a method is established to determine the stress rainflow range PDF using neural networks for the given non-Gaussian stress PSD and kurtosis. A bi-Gamma model is proposed to describe the PDF, and the parameters of the model are determined through neural networks. A broadband stress PSD expression with bimodal peaks is provided, and a non-Gaussian stress time-domain dataset based on this PSD and specified kurtosis is generated. The neural network model is trained and validated with the dataset. The conclusions of the article are as follows:
The PDFs of the non-Gaussian stress rainflow ranges can be described accurately with the bi-Gamma model proposed in this article. The model demonstrates strong stability for stress PSDs with different parameters. The correlation coefficients between the predicted PDFs from neural network model and the PDFs obtained from the rainflow counting method all remain above 0.9.
When the PDFs of the non-Gaussian stress rainflow ranges obtained by the method of this paper are used for life calculation, the results are within the second scatter band compared to the rainflow counting results. Compared to the correction method, the results by this article method are more accurate.
In addition, through the sensitivity coefficient test of the training set size and robustness test, the impact of the training set size on the neural network’s training results was investigated, and the robustness limits during prediction were given.
The PDF model proposed in this paper can not only be used for predicting the stress rainflow range PDF under non-Gaussian stress but also has the potential to be applied to other more complex scenarios.
In practical engineering problems, the loads to which structures are subjected are more complex, and the influences on the structural response are not limited to non-Gaussian effects, but also include transient and other nonlinear effects. Therefore, when performing a fatigue analysis for structures, it is necessary to provide a model that takes into account complex parameters and can be used for training and predicting PDF models under various complex loading conditions.

Author Contributions

J.W.: Conceptualization; Investigation; Methodology; Validation; Data Curation; Writing—Original Draft; H.C.: Supervision; Methodology; Formal analysis; Writing—Review and Editing. All authors have read and agreed to the published version of the manuscript.

Funding

This research received no external funding.

Institutional Review Board Statement

Not applicable.

Informed Consent Statement

Not applicable.

Data Availability Statement

The data presented in this study are available on request from the corresponding author. The data are not publicly available due to privacy.

Conflicts of Interest

The authors declare that they have no known competing financial interests or personal relationships that could have appeared to influence the work reported in this paper.

References

  1. Dirlik, T. Application of Computers in Fatigue Analysis; University of Warwick: Coventry, UK, 1985. [Google Scholar]
  2. Lee, Y.-L. (Ed.) Fatigue Testing and Analysis: Theory and Practice; Elsevier Butterworth-Heinemann: Amsterdam, The Netherlands; Boston, MA, USA, 2005; ISBN 978-0-7506-7719-6. [Google Scholar]
  3. Slavic, J.; Boltezar, M.; Mrsnik, M.; Cesnik, M.; Javh, J. Vibration Fatigue by Spectral Methods: From Structural Dynamics to Fatigue Damage: Theory and Experiments; Elsevier: Amsterdam, The Netherlands, 2021; ISBN 978-0-12-822190-7. [Google Scholar]
  4. Zheng, R.; Chen, H.; He, X. Control Method for Multiple-Input Multiple-Output Non-Gaussian Random Vibration Test. Packag. Technol. Sci. 2017, 30, 331–345. [Google Scholar] [CrossRef]
  5. Palmieri, M.; Česnik, M.; Slavič, J.; Cianetti, F.; Boltežar, M. Non-Gaussianity and Non-Stationarity in Vibration Fatigue. Int. J. Fatigue 2017, 97, 9–19. [Google Scholar] [CrossRef]
  6. Cianetti, F.; Palmieri, M.; Slavič, J.; Braccesi, C.; Morettini, G. The Effort of the Dynamic Simulation on the Fatigue Damage Evaluation of Flexible Mechanical Systems Loaded by Non-Gaussian and Non Stationary Loads. Int. J. Fatigue 2017, 103, 60–72. [Google Scholar] [CrossRef]
  7. ASTM E1049-85; Standard Practices for Cycle Counting in Fatigue Analysis. ASTM: West Conshohocken, PA, USA, 2017.
  8. Benasciutti, D.; Tovo, R. Spectral Methods for Lifetime Prediction under Wide-Band Stationary Random Processes. Int. J. Fatigue 2005, 27, 867–877. [Google Scholar] [CrossRef]
  9. Benasciutti, D.; Tovo, R. Comparison of Spectral Methods for Fatigue Analysis of Broad-Band Gaussian Random Processes. Probabilistic Eng. Mech. 2006, 21, 287–299. [Google Scholar] [CrossRef]
  10. Banvillet, A. Fatigue Life under Non-Gaussian Random Loading from Various Models. Int. J. Fatigue 2004, 26, 349–363. [Google Scholar] [CrossRef]
  11. Benasciutti, D.; Tovo, R. Fatigue Life Assessment in Non-Gaussian Random Loadings. Int. J. Fatigue 2006, 28, 733–746. [Google Scholar] [CrossRef]
  12. Braccesi, C.; Cianetti, F.; Lori, G.; Pioli, D. The Frequency Domain Approach in Virtual Fatigue Estimation of Non-Linear Systems: The Problem of Non-Gaussian States of Stress. Int. J. Fatigue 2009, 31, 766–775. [Google Scholar] [CrossRef]
  13. Sun, H.; Qiu, Y.; Li, J. A Novel Artificial Neural Network Model for Wide-Band Random Fatigue Life Prediction. Int. J. Fatigue 2022, 157, 106701. [Google Scholar] [CrossRef]
  14. Yang, J.; Kang, G.; Liu, Y.; Kan, Q. A Novel Method of Multiaxial Fatigue Life Prediction Based on Deep Learning. Int. J. Fatigue 2021, 151, 106356. [Google Scholar] [CrossRef]
  15. Plets, J.; Bouckaert, Q.; Ahmed, B.; De Waele, W.; Hectors, K. Neural Network Based Fatigue Lifetime Prediction of Metals Subjected to Block Loading. Int. J. Fatigue 2024, 183, 108283. [Google Scholar] [CrossRef]
  16. Bai, Y.; Xie, C.; Zhou, X. AI-Based Macro Model Learning for High Cycle Fatigue Assessment of Welded Joints in Large-Span Steel Structures. Int. J. Fatigue 2024, 184, 108321. [Google Scholar] [CrossRef]
  17. Susmel, L. Estimating Notch Fatigue Limits via a Machine Learning-Based Approach Structured According to the Classic Kf Formulas. Int. J. Fatigue 2024, 179, 108029. [Google Scholar] [CrossRef]
  18. Wang, B.; Xie, L.; Song, J.; Zhao, B.; Li, C.; Zhao, Z. Curved Fatigue Crack Growth Prediction under Variable Amplitude Loading by Artificial Neural Network. Int. J. Fatigue 2021, 142, 105886. [Google Scholar] [CrossRef]
  19. Kamiyama, M.; Shimizu, K.; Akiniwa, Y. Prediction of Low-Cycle Fatigue Crack Development of Sputtered Cu Thin Film Using Deep Convolutional Neural Network. Int. J. Fatigue 2022, 162, 106998. [Google Scholar] [CrossRef]
  20. Blundell, C.; Cornebise, J.; Kavukcuoglu, K.; Wierstra, D. Weight Uncertainty in Neural Networks 2015. In Proceedings of the 32nd International Conference on International Conference on Machine Learning - Volume 37 (ICML’15), Lille, France, 6–11 July 2015. [Google Scholar]
  21. Arunakumara, P.C.; Sagar, H.N.; Gautam, B.; George, R.; Rajeesh, S. A Review Study on Fatigue Behavior of Aluminum 6061 T-6 and 6082 T-6 Alloys Welded by MIG and FS Welding Methods. Mater. Today Proc. 2023, 74, 293–301. [Google Scholar] [CrossRef]
  22. Moreira, P.M.G.P.; Richter-Trummer, V.; de Castro, P.M.S.T. Fatigue Behaviour of FS, LB and MIG Welds of AA6061-T6 and AA6082-T6. In Multiscale Fatigue Crack Initiation and Propagation of Engineering Materials: Structural Integrity and Microstructural Worthiness; Sih, G.C., Ed.; Springer: Dordrecht, The Netherlands, 2008; pp. 85–111. [Google Scholar]
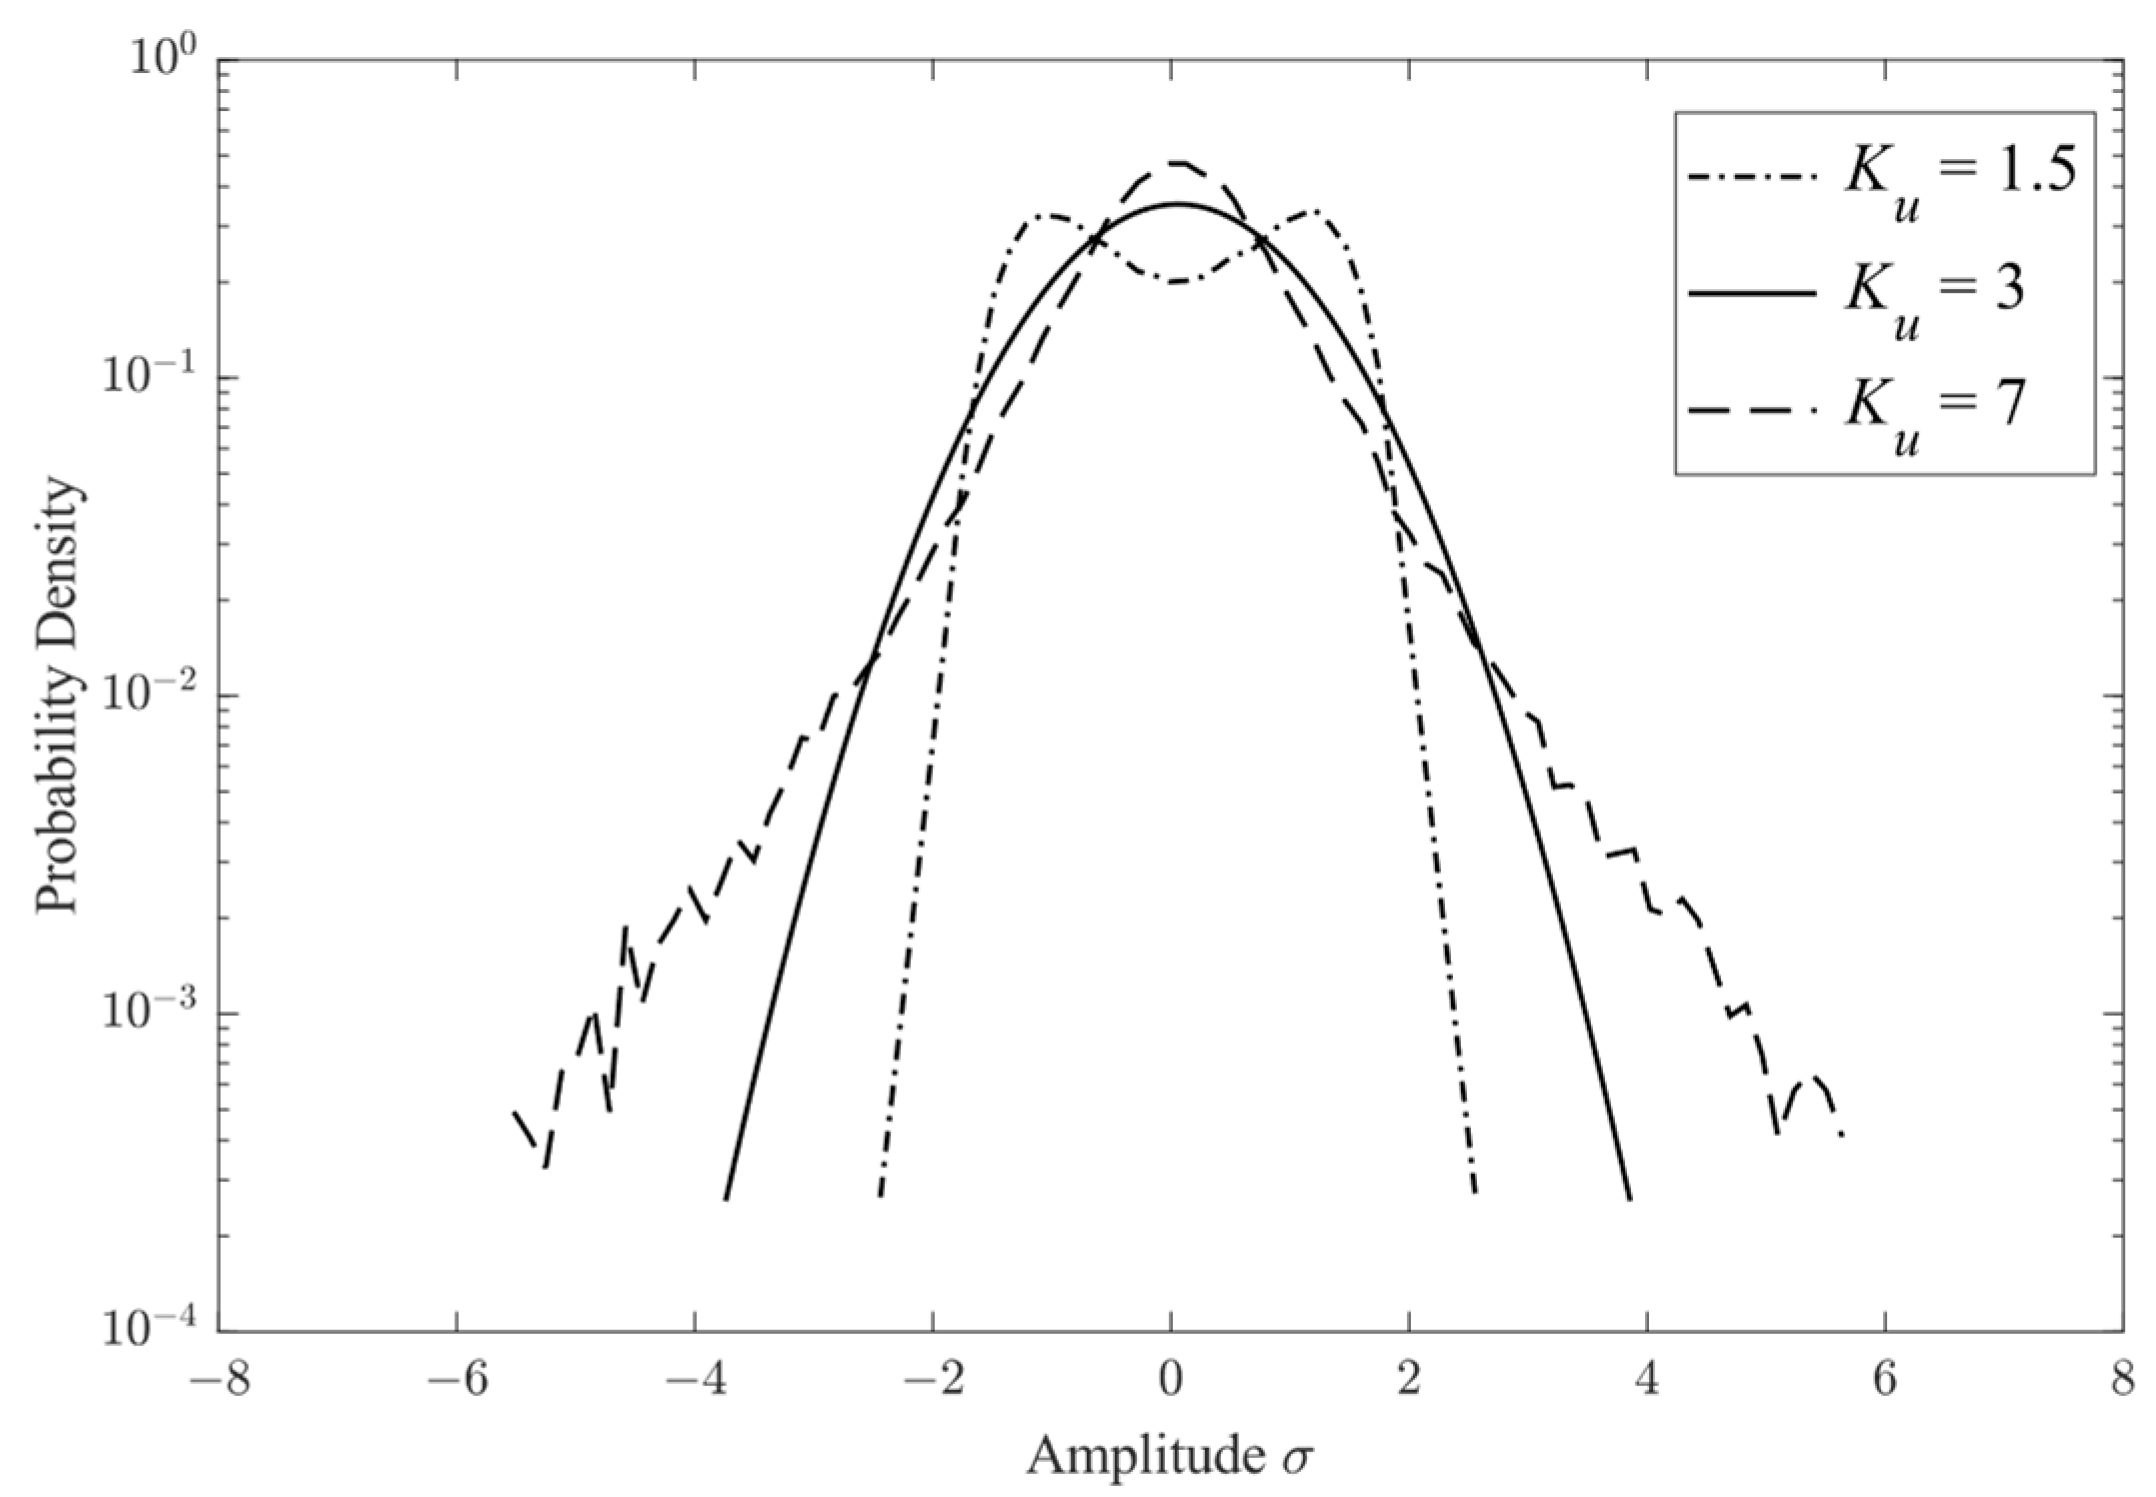
Figure 1. The probability density distribution with different kurtosis values.
Applsci 14 08376 g001
Figure 2. Three broadband stress PSDs.
Applsci 14 08376 g002
Figure 3. Plots of stress before and after transformation. (a) Gaussian stress; (b) non-Gaussian stress with Ku = 7.5.
Applsci 14 08376 g003
Figure 4. Comparison between the fitted bi-Gamma PDF and the rainflow PDF. (a) f1 = 8 Hz, f2 = 91 Hz; (b) f1 = 19 Hz, f2 = 192 Hz; (c) f1 = 42 Hz, f2 = 153 Hz.
Applsci 14 08376 g004
Figure 5. Neural network model.
Applsci 14 08376 g005
Figure 6. Flowchart for the generation of the datasets used for training neural networks.
Applsci 14 08376 g006
Figure 7. PDF results of rainflow and predictions for Group 5 (f1 = 10 Hz, f2 = 161 Hz).
Applsci 14 08376 g007
Figure 8. Correlation coefficients between predicted PDFs and rainflow PDFs. (a) Ku = 5; (b) Ku = 6; (c) Ku = 7.5.
Applsci 14 08376 g008
Figure 9. Comparison of predicted life with non-Gaussian corrected life. (a) Ku = 5; (b) Ku = 6; (c) Ku = 7.5.
Applsci 14 08376 g009aApplsci 14 08376 g009b
Figure 10. A sensitivity test to the training set size of the neural network.
Applsci 14 08376 g010
Figure 11. The robustness test of the neural network.
Applsci 14 08376 g011
Table 1. Comparison of signal parameters before and after transformation.
KurtosisRMS
Gaussian signal3.024620.1679
Non-Gaussian signal7.598820.1679
Table 2. Fitting parameters of the bi-Gamma model.
β1β2λ1λ2c
f1 = 8 Hz, f2 = 91 Hz0.61074.02690.81145.34800.4984
f1 = 19 Hz, f2 = 192 Hz1.07734.05211.43236.81560.5895
f1 = 42 Hz, f2 = 153 Hz0.81122.43480.99517.35050.7691
Table 3. The PSDs of the test group.
Group No.12345678910
f1 [Hz]33151344103313332115
f2 [Hz]80111150108161711961727276
Table 4. The S-N curve parameters for aluminum alloy 6061-T6 [21,22].
ParameterCk
Value5.899 × 10269.842
Table 5. Comparison of fatigue life calculation results.
No.Gaussian Stress Ku = 3Non-Gaussian Stress Ku = 7.5
L RF g L DK g L TB g L RF ng L DK ng L TB ng L NP
12.4666 × 1061.6156 × 1062.1526 × 106589.2192232.5485309.8470416.4163
22.6203 × 1072.4503 × 1072.5823 × 1078.5049 × 1033.5269 × 1033.7170 × 1035.9124 × 103
31.6319 × 1071.4576 × 1071.5879 × 1076.4004 × 1032.0981 × 1032.2856 × 1035.2125 × 103
44.9295 × 1052.5516 × 1054.3926 × 105431.545036.728163.2274376.7941
52.2346 × 1071.9906 × 1072.1365 × 1071.1993 × 1042.8653 × 1033.07538.7648 × 103
62.6646 × 1061.8067 × 1062.3256 × 1061.2440 × 103260.0622334.74938.0734
77.9882 × 1065.7403 × 1066.7135 × 1061.8858 × 103826.2697966.34661.5082 × 103
87.8686 × 1064.4939 × 1056.8265 × 105500.246164.685798.2612396.3677
92.0573 × 1071.7607 × 1071.9657 × 1071.0515 × 1042.5344 × 1032.8294 × 1037.4056 × 103
106.3115 × 1075.1605 × 1075.9634 × 1073.0222 × 1047.4280 × 1038.5838 × 1032.3686 × 104
Disclaimer/Publisher’s Note: The statements, opinions and data contained in all publications are solely those of the individual author(s) and contributor(s) and not of MDPI and/or the editor(s). MDPI and/or the editor(s) disclaim responsibility for any injury to people or property resulting from any ideas, methods, instructions or products referred to in the content.