Article

Method for Detecting Underwater Microbubbles Using Dual-Mode Fusion of Laser Polarization

College of Electronic Engineering, Naval University of Engineering, Wuhan 430034, China
*
Author to whom correspondence should be addressed.
Appl. Sci. 2024, 14(18), 8465; https://doi.org/10.3390/app14188465
Submission received: 23 August 2024 / Revised: 9 September 2024 / Accepted: 13 September 2024 / Published: 20 September 2024

Abstract

:
Bubble detection in water plays important roles in human exploration and management of the ocean. This research presents a detection technique based on laser polarization dual-mode fusion, aiming at solving the difficulties of light scattering intensity characteristics that are hard to extract and the small particle size of underwater bubbles that are hard to detect. To increase the precision of bubble identification, an image fusion technique based on bubble polarization degree is first presented. Second, we quantitatively investigate the grayscale undulation of bubbles with different size and number distributions in the image from both statistical and experimental aspects, introduce image grayscale fluctuation (GF) to fuse two modes of laser polarization and the image, establish an a posteriori distribution probability model of discriminating features such as the size and number of bubbles, and realize the bubble small-sample, multi-source data fitting. The findings demonstrate that dynamic bubble detection in the 50–1000 μm and 100–2000 cm−3 ranges can achieve more than 95%, as well as more than a 93%, accuracy in quantity distribution and bubble size change. This technique achieves the continuous perception of bubble features in complicated underwater environments, and offers a possible application scheme for the detection of marine bubble environments.

1. Introduction

There are a lot of bubbles in the marine environment because of things like ship navigation, breathing marine life, and breaking waves [1]. A technique that has been widely employed in the detection and acquisition of marine environmental information, the analysis of marine biological activity, the recognition of ship track heading, and other elements is examining the variations in the features of different bubbles in seawater [2]. As a result, the ability to detect bubbles in saltwater is crucial to human ocean exploration and management. Optical detection techniques are commonly employed to identify bubble attributes (e.g., bubble size distribution, bubble number, etc.) because bubbles are good light scatterers [3]. When compared to the single data source of traditional optical radiation measurement, which only provides intensity information and makes it difficult to perceive changes in the size and number of bubbles [4], and the low quality of traditional image detection, which is based on the polarization difference of different targets and can reduce the influence of medium scattering and accurately distinguish between bubbles and impurity targets [5], active polarization imaging is one of the best ways to generate crisp underwater bubble images because it uses the polarization difference of various targets to minimize the impact of medium scattering and accurately distinguish between bubbles and other targets [6]. However, the optimal imaging region of active polarization imaging is significantly reduced, as is the detection performance, in scenarios like the uneven light intensity in the imaging region caused by multiple scattering of seawater particles, the “polarization camouflage” formed by marine plankton absorbing polarized light, and the mixed stack occlusion of bubbles and impurities. These factors make it challenging to quantitatively detect the size and quantity distribution of bubbles by polarization imaging [7]. Therefore, it is of great theoretical and practical significance to study the technology of bubble image enhancement under non-uniform light conditions and bubble feature recognition under complex water quality conditions.
Underwater bubbles have been extensively studied by numerous academics. Because of their small particle size, these bubbles are challenging to recognize, detect, and extract the properties of light scattering intensity from. In order to measure the features of bubble groups, Tan et al. [8] suggested using laser imaging, and Qian et al. [9] created an experimental apparatus that used polarized light scattering to identify casein bubbles that were both monodisperse and double-disperse. Nevertheless, the technique is challenging to modify for the dynamic ocean environment, and the two researchers mentioned above only observed bubble particles in static settings. Ma et al. [10] proposed a method using trained convolutional neural networks (CNNs) to segment overlapping bubbles for identification. Zhao et al. [11] designed a polarization descattering imaging method based on a genetic algorithm to enhance image features. However, the scheme proposed by the two scholars is not suitable for underwater objects with different polarization characteristics in the imaging scene and the recognition of weakly polarized targets such as bubbles, and it is difficult to distinguish the stacking of bubbles and impurities. Shukla et al. [12] analyzed the relationship between the polarization-gated imaging effect and refractive index at a specific scatterer scale. Meanwhile, Li et al. [13] used a Monte Carlo simulation and quantitative experiment to study the influence of continuous particle size change on polarization imaging. However, the above method struggles to detect the compound change in bubble number and size characteristics. Hu et al. [14] proposed a visibility enhancement method using transmittance correction to realize underwater imaging of objects with different polarization characteristics. Zhang et al. [15] further developed an underwater image restoration algorithm based on polarization imaging under non-uniform light field. However, the above method relies heavily on the accuracy of extraction of the background region without any detection target, which is difficult to adapt to the complex Marine environment where the turbulent field induced by the bubble causes the sediment to float, and it is difficult to detect and extract the time-varying bubble characteristics of the polarization state.
In order to address the underwater strong scattering complex field, non-static bubble recognition, and feature detection, this paper selects and merges laser polarization detection and active imaging detection, which have similar application modes, complementary detection modes, and a strong correlation of data sources, and proposes a detection mechanism based on laser polarization dual-mode fusion. This process employs the linear polarization degree of the image as the weight to fuse the collected polarized and unpolarized images. It achieves this by combining bubble polarization simulation, polarization, and unbiased image fusion into the laser active illumination imaging system. The image’s region enhances the polarization features of bubbles. In order to detect bubble speckle and extract bubble size, number density, and other properties from the fusion image, a time-varying model of bubble polarization based on simulation and image processing techniques was employed. Lastly, a probabilistic fusion method based on laser polarization and bimodal image data is proposed. This method combines the different characteristics of the image, such as its size, number, and polarization degree, and establishes a probabilistic model for the posterior distribution of discriminative features like these. It also realizes the fitting of the small-sample and multi-source data of bubbles. The relationship function characterizing the fluctuation of image grayscale value by the dynamic occupancy ratio of the confidence value is also combined. This mechanism allows us to quickly and effectively detect the distribution of the underwater bubble field. In addition to actively predicting the influence of the bubble environment on optical imaging, we can also invert the bubble morphology, number, and other features based on grayscale changes.

2. Dual-Mode Fusion Detection Mechanism

Figure 1 characterizes the specific components of this bimodal fusion mechanism, which can be divided into the following three steps:
  • Ideal bubble state simulation. This paper establishes a dynamic time-varying simulation model of underwater microbubbles based on the vector Monte Carlo method, which can be used to simulate the polarization characteristics of bubbles of different sizes and numbers according to different water quality parameters fed back from the detector, and outputs the corresponding data as the historical optimal values to provide the corresponding parameters for the subsequent algorithms.
  • Image fusion and feature extraction. This paper proposes an image polarization-weighted fusion method based on polarization fluctuation changes, using polarized image and non-polarized image coefficient weighting, image enhancement of the target of the bubble to be detected, and segmentation of adherent bubbles by the fast radial symmetric transform method (FRS), then combined with ellipse fitting to complete the contour estimation and data expansion, and the relevant feature parameters are output for the subsequent bubble feature recognition statistics.
  • Dual-mode fusion discrimination. This paper proposes a dual-mode fusion bubble feature recognition method based on the inter-correlation between image scattering and bubbles, through the feedback of the fluctuation of the gray value of the image in the two cases of the existence or non-existence of bubbles, and the use of laser polarization and the image of the data complementary to the image from the perspective of statistical probability of the image grayscale and bubble polarization features for the fusion of confidence and the establishment of the bubble size, number, and other discriminative features in an a posteriori distribution probability model. In the experimental test phase, according to the target confidence adaptive fusion dual-mode detection results, the impurities and bubble characteristics are accurately distinguished, and the grayscale fluctuation value (GF) is used to correlate bubble size, number, and other characteristics, so as to realize the target identification and feature extraction of bubbles under complex water quality.

2.1. Ideal Bubble State Simulation

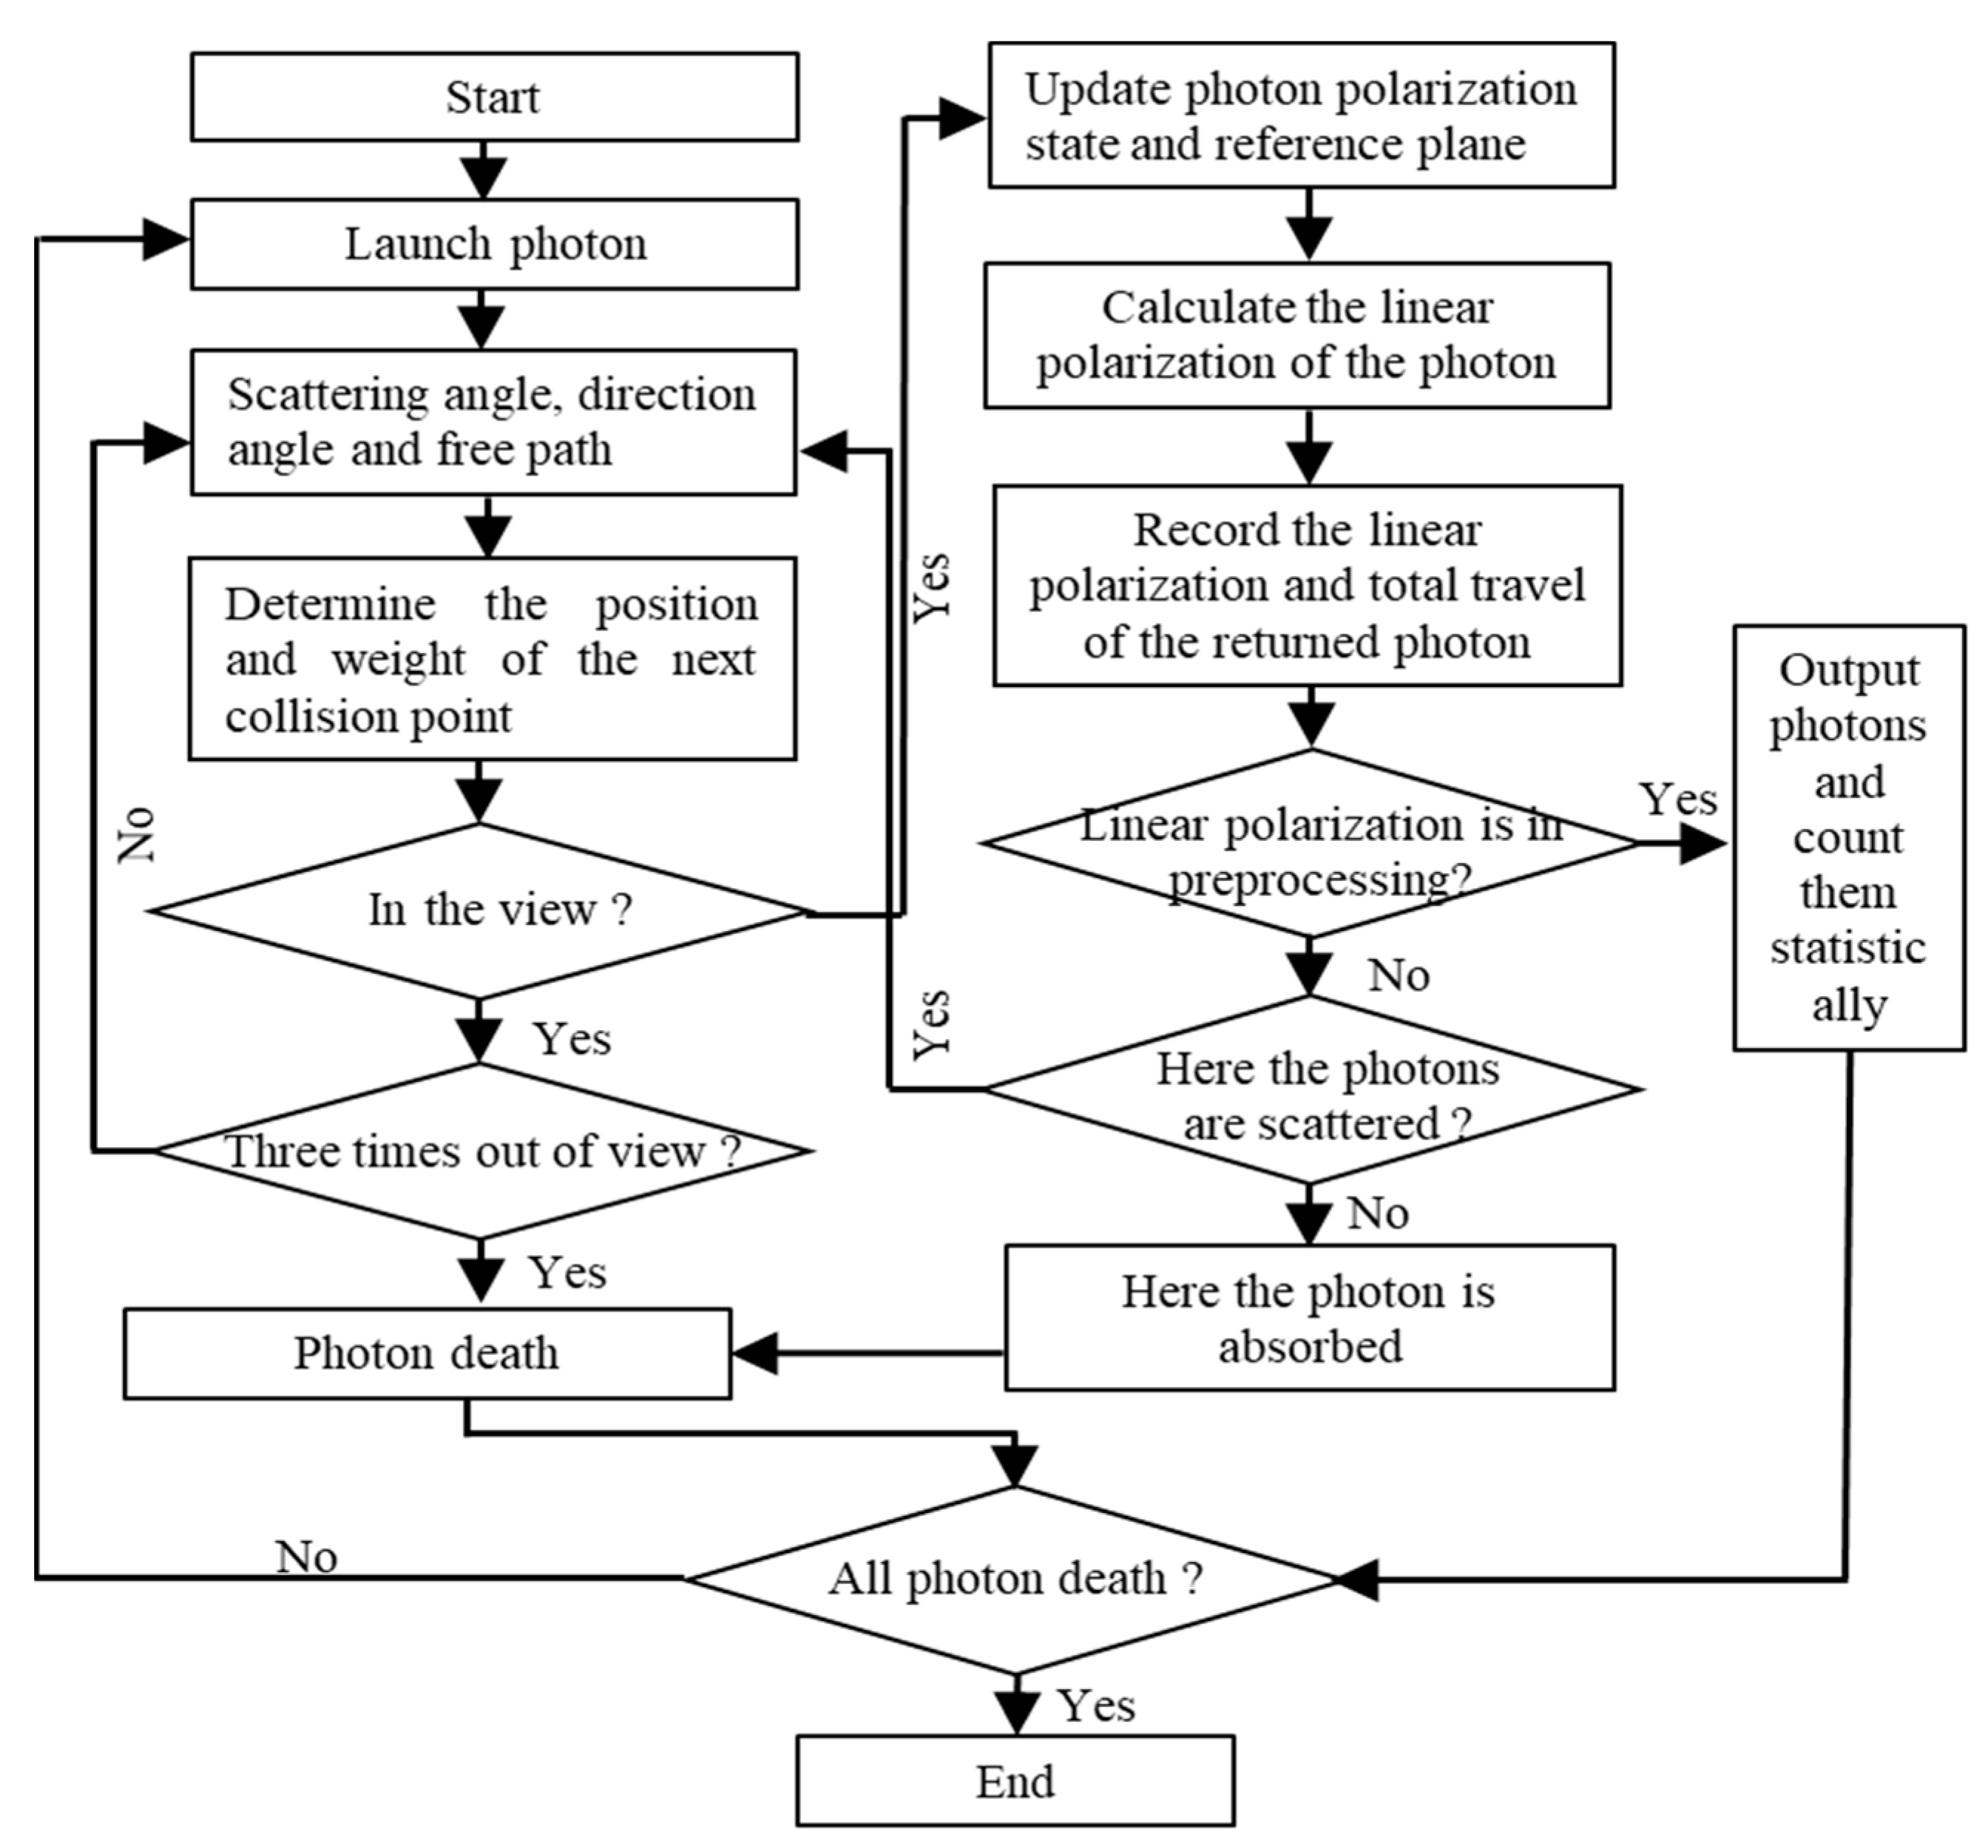
This section establishes a dynamic time-varying simulation model of underwater microbubbles based on the vector Monte Carlo method, and uses the vector Monte Carlo method to simulate the polarization state of the laser backscattered echo signal of the particles in the underwater bubble cluster. Compared with the traditional Monte Carlo method, this method adds the link of outputting the polarization state of each photon, and at the same time increases the preprocessing neighborhood screening work, counting the number of photons in the backscattered echo photons that are similar to the preprocessing polarization reference value, and the specific flow is shown in Figure 2.
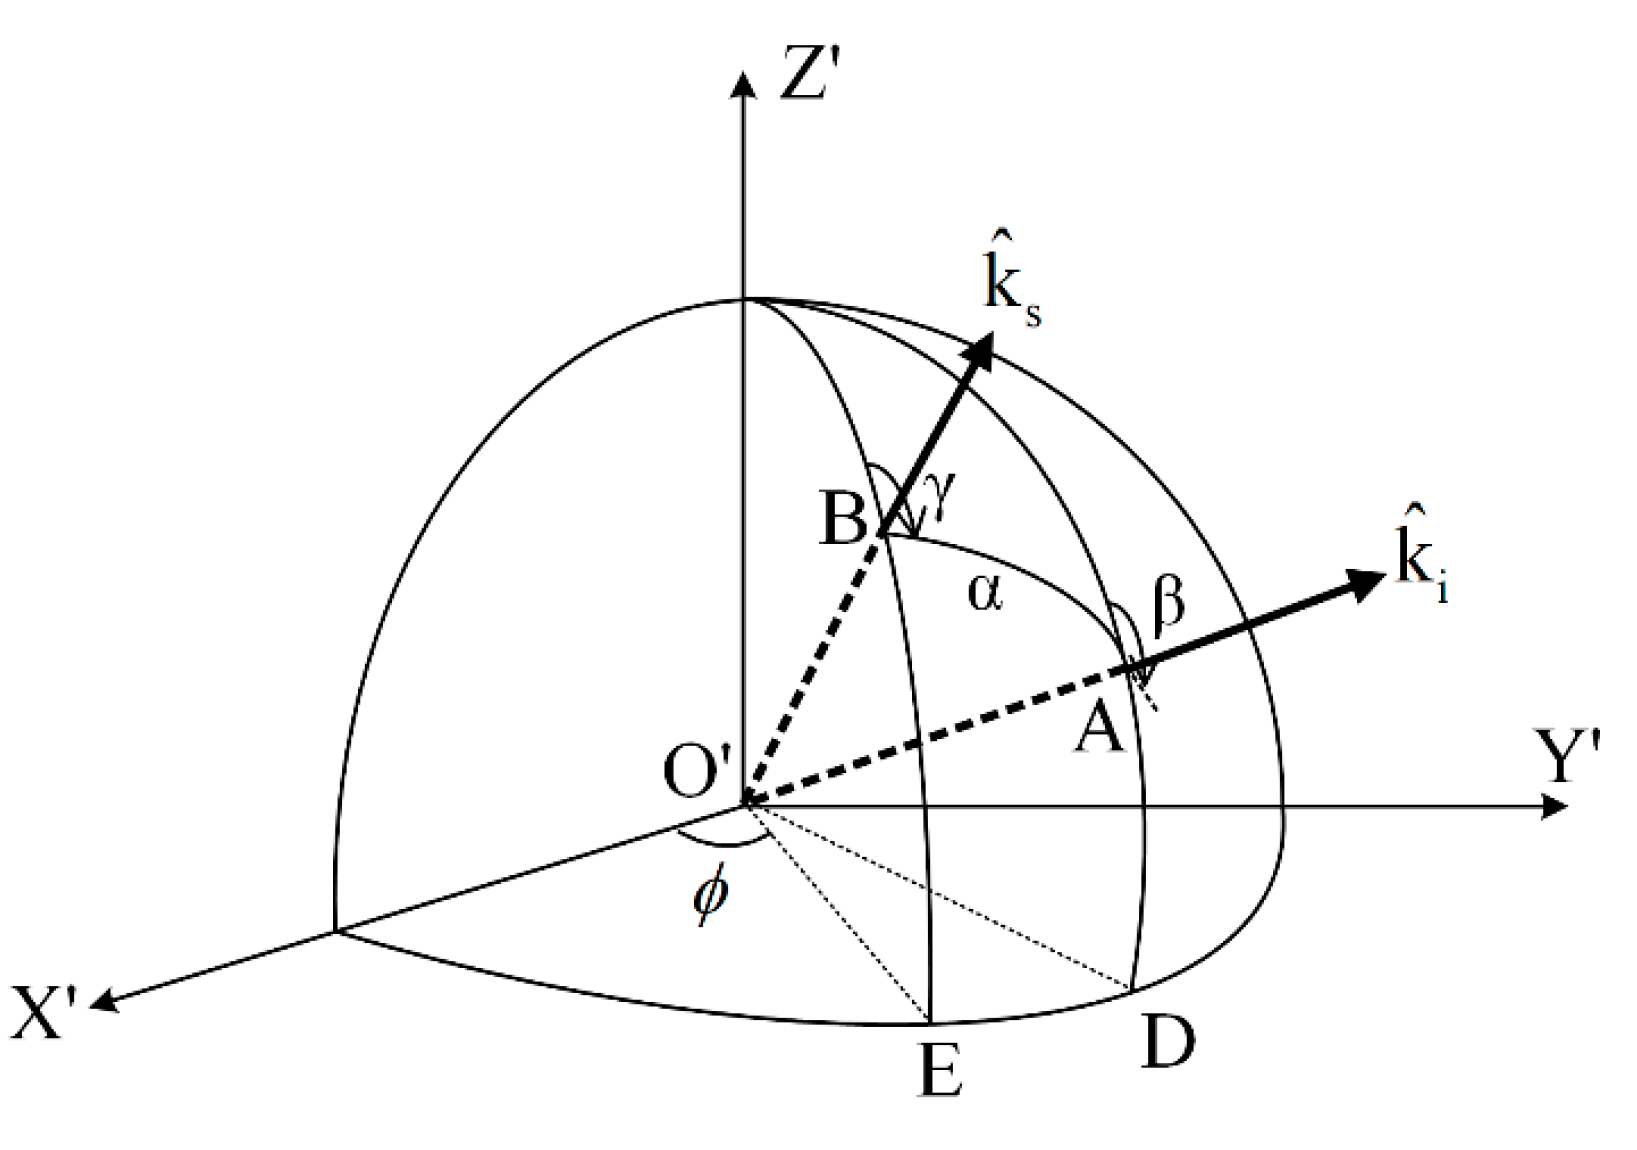
To solve the Stokes vector before and after photon scattering using the meridian plane method, the coordinate system as shown in Figure 3 needs to be established. In Figure 3, the 3D coordinate system X Y Z represents the local coordinate system with the photon scattering point as the origin O . The vectors O A and O B represent the motion direction of the photon before and after scattering, respectively, and can also be represented by the unit vectors k ^ i and k ^ s ; points A and B represent the intersection of the photon’s motion direction before and after scattering with the unit sphere. A O B represents the scattering plane; α represents the scattering angle, which is the angle between O A and O B ; β represents the angle at which the plane C O A rotates clockwise to the plane A O B as seen from the opposite direction of O A and O B ; γ represents the angle from which the plane C O B rotates clockwise to the plane A O B as seen in the reverse direction of O B ; ϕ represents the angle at which O X rotates counterclockwise to O E as viewed from the reverse of O C ; and O E and O D are, respectively, the projections of O A and O B on the plane X O Y [16]. The polarization state of photons is represented by the Stokes vector:
S = I , Q , U , V T
The Stokes vector is relative to a reference plane, and the selection of the reference plane is not carried out at the same time. The Stokes vector photon is endless and also stays the same, so we select principle of the prior specification reference. The meridional plane method stipulates that for any direction vector, the meridional plane formed by the vector and the axis of the coordinate system O Z should be selected as its reference plane. Therefore, for the photon incidence and scattering direction vectors k ^ i and k ^ s , the corresponding Stokes vectors should be selected as their reference plane, C O A and C O B , respectively [17].
For tracking the photon polarization state, the vector Monte Carlo method is referred to. The conditional probability distribution function of the sampling method to obtain the photon scattering angle α and azimuth β requires the renewal of the Stokes vector [18]; the concrete steps are as follows:
(a)
The Stokes vector S a of the incident photon in the k ^ i direction is converted to the Stokes vector S b of the scattering plane A O B as the reference plane. The rotation matrix of the Stokes vector from the meridional plane C O A to the scattering plane A O B is as follows:
R β = 1 0 0 0 0 cos 2 β sin 2 β 0 0 sin 2 β cos 2 β 0 0 0 0 1
where β represents the angle of clockwise rotation of C O A to A O B along O A . By substituting Equation (2) into Equation (3), we can calculate the Stokes vector defined by the incident light on the scattering plane A O B before scattering occurs:
S b = R β S a
where S a represents the Stokes vector in the incident direction k ^ i with respect to the meridional plane C O A . S b represents the Stokes vector of k ^ i relative to the scattering plane  A O B .
(b)
On the scattering plane A O B , the Stokes vector S c of photons in the k ^ s direction after scattering is calculated using the bubble Mueller matrix M α . The Mueller matrix can describe the polarization characteristics of the scattering process. Since the Stokes vector is relative to a scattering plane, it is necessary to transform the Stokes vector S a into the scattering plane A O B , and then use the incident Stokes vector to multiply the scattering matrix M α to solve the Stokes vector after photon scattering, namely:
S c = M α S b = M α R β S a
where S c represents the Stokes vector of the scattering photon in the k ^ s direction with respect to the scattering plane A O B .
(c)
The Stokes vector S c of the photon in the direction of  k ^ s  is transformed from the scattering plane A O B to the meridian plane C O B of k ^ s . The Stokes vector of the scattered photon relative to the new meridional C O B is as follows:
S d = R π γ S c = R π γ M α R β S a
In the simulation, we use the line polarized light S = [1,1,0,0] in any direction to perform the polarization simulation for different sizes and numbers of bubble groups, and obtain the bubble group receding polarization curves as shown in Figure 4.
The depolarization of bubble groups of varying sizes as the amount distribution changes is depicted in Figure 4. The polarization characteristics of bubbles are weak in the simulation of small-particle-size and sparse discrete bubbles due to the loss of polarization information caused by water turbidity attenuation/distortion and multiple scattering depolarization of bubble particles. As a result, the polarization degree of simulated bubbles appears to have a strong fluctuation and be non-monotonic. Generally speaking, there is still a positive correlation between the depolarization and the size and quantity of bubbles. The depolarization impact caused by repeated scattering is more evident the larger the size and number of bubbles and the smaller the linear polarization degree characterized by the bubbles. Meanwhile, through the simulation, we can know that the polarization degree of 100–600 μm size bubbles under the number density of 100–600 cm−3 is in the interval of [0.85, 0.98], which provides a discriminating threshold for the subsequent bubble image identification and feature extraction.

2.2. Image Fusion and Feature Extraction

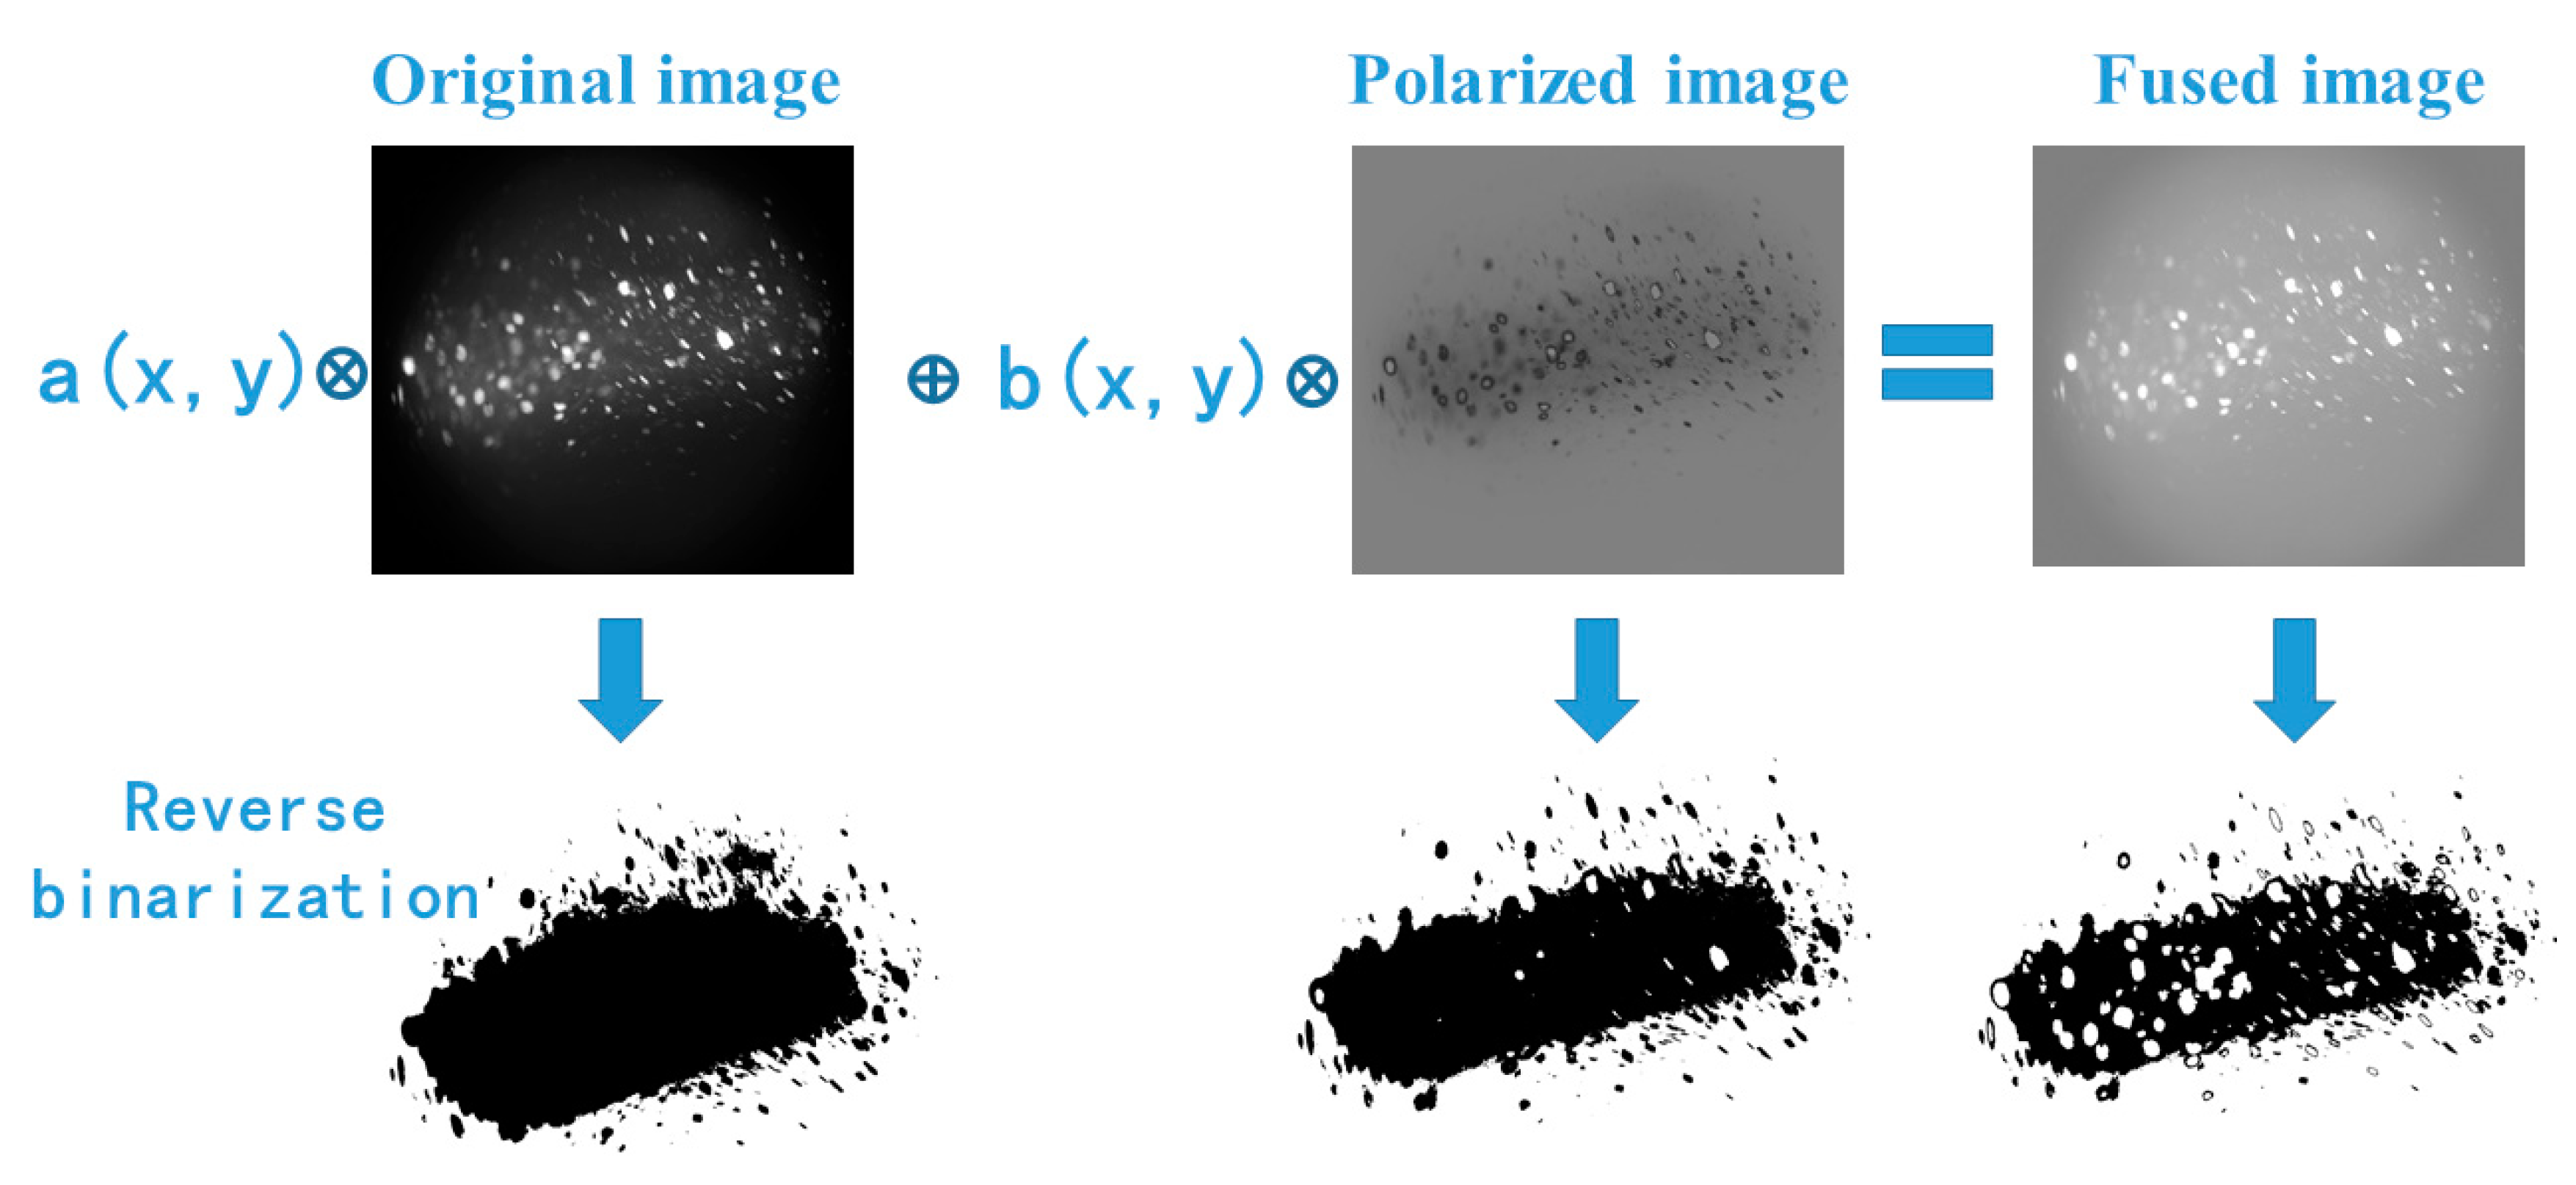
In this section, we propose a polarization scattering-weighted fusion imaging method for turbid water bubbles. We consider the effect of bubble number density on the detection transmission; according to the literature [18], we can know that with an increase in bubble number density, the Mie scattering probability of the laser and the bubble group increases not only single scattering but also multiple scattering probability, which leads to an increase in the scintillation factor. Therefore, in order to accurately measure the fluctuation value of the bubble density on the scintillation factor, the key is to accurately identify and count the number of bubbles in the laser detection channel. Due to the large number of stray particles in the water, the coexistence of bright bubbles and dark bubbles occurs easily in the traditional active illumination imaging and particle velocimetry (PIV) methods due to the limitation of illumination methods and mutual blockage [19]. It is difficult to accurately identify the bubble particles by the grayscale-based identification method, while using polarization imaging, it is difficult to unify the bubble polarization due to the severe receding effect caused by the bubble’s own stray particles. At the same time, due to the movement of the bubbles, the background polarization changes significantly, so the coexistence of bright and dark bubbles still occurs on the image, making it difficult to accurately locate and identify them so as to better determine the number of bubbles and identify the bubble targets. A literature review [20], which suggests using the fusion of polarized and unpolarized pictures to discriminate and determine the likelihood, is cited in this paper. One way to describe the fused image is as follows:
I f u s e d ( x , y ) = a ( x , y ) I P ( x , y ) + b ( x , y ) I n P ( x , y )
where I f u s e d ( x , y ) is the fused image, I P ( x , y ) is the polarized image, I n P ( x , y ) is the unpolarized image, and a ( x , y ) , b ( x , y ) are the weights of the polarized image and the unpolarized image, respectively. The calculation of the weights of a ( x , y ) , b ( x , y ) are determined by the polarization change of the polarized image, which can be specifically characterized as follows:
a ( x , y ) = P D ( x , y ) P D ¯ b ( x , y ) = P D ¯ P D ( x , y )
where P D ( x , y ) is the line polarization of a point in the polarized image and P D ¯ is the average polarization of the polarized image, taking into account that when P D ( x , y ) is too small it will make the weight b ( x , y ) too large, making the image appear as an oversaturated point, an overexposure phenomenon, which will affect the subsequent judgment, so the weights will be modified to the following:
a ( x , y ) = P D ( x , y ) P D ¯ b ( x , y ) = P D ¯ P D ( x , y ) + θ
θ  is a correction parameter ranging from 0 to 1, which is adjusted according to the background and impurity content of the water body, and is measured to be around 0.104 in clear water, 0.226 in coastal water, and 0.486 in port water, and in order to ensure the quality of the fused images, the correction function θ  should not be higher than 0.5. The polarization fusion image mechanism is shown in Figure 5 below:
After the fusion, we again calculate the line polarization degree after the scatter calibration process in the image, as shown in the literature [20]:
P x ( x , y ) = L 0 L 90 L 0 + L 90
P x ( x , y ) is the degree of linear polarization at an optical scattering within the image, L 0 and L 90 are the light intensity of the fused image in the direction of 0° and 90°. From the literature [20], it is known that the intensity of the light in the image is linearly correlated with the grayscale and from Equation (6) each parameter of the fused image is also linearly correlated with the polarization and the non-polarized image; therefore
P x ( x , y ) = a ( x , y ) ( G P 0 G P 90 ) a ( x , y ) ( G P 0 + G P 90 ) + 2 b ( x , y ) G n p
where G P 0 and G P 90 are the grayscale in the 0° and 90° directions of the polarized image, and G n P is the grayscale of the non-polarized image, so the line polarization in a certain scattering region can be expressed as follows:
P x = x = 1 W y = 1 H P x ( x , y ) W · H
W , H denote the width and height of the fused image respectively.

2.3. Dual-Mode Fusion Discrimination

In this section, we define that there are two states of image grayscale in this case: G 1  denotes the image grayscale at the moment of the presence of bubbles; G 2 denotes the background image grayscale when there are no bubbles. Assume that p is the probability that the channel is disturbed by the change in bubble number density: P ( V = G 1 ) = p ,   P ( V = G 2 ) = 1 p and σ 1 2 is the value of image gray-scale fluctuation GF (gray fluctuation) caused by the change of bubbles. Specifically, this is expressed as follows:
σ 1 2 ( G 1 , G 2 , p ) = ( G 2 G 1 ) 2 p 2 + ( G 2 G 1 ) 2 p G 1 2 p 2 + G 1 2 ( 1 p ) 2 + 2 G 1 G 2 p ( 1 p )
where G 1 , G 2 are the target and ambient background gray level thresholds, respectively. The image gray level fluctuation probability p is specifically denoted as follows:
p = i = 1 n s N i N max
N i is the pixel size occupied by a particular scatter, and s is the confidence level of whether a particular optical spot image is a bubble. Where s = P x 1 2 π σ ( ( z P r o o m ¯ ) 2 2 σ 2 ) d x , where  P x is the line polarization at a certain optical scatter within the image, P r o o m ¯ is the average value of the line polarization of the simulated bubble,  d = ( ( P min + P max ) / 2 ) 2 P max P min , P max is the maximum value of the line polarization in the optical scatter region of the image, P min is the minimum value of the line polarization in the optical scatter region of the image, and N max is the total number of pixel points of the image, and for the sake of simplicity and efficiency of the computation, the probability p denoted as:
p = s ¯ N p N max
N p is the number of pixel points and the number of pixels occupied by the scattering area, s ¯ is the average confidence level in the area,  s ¯ = P x ¯ 1 2 π d ( ( z P r o o m ¯ ) 2 2 d 2 ) d x , and P x ¯ is the average linear polarization of the optical scattering area of the image. Meanwhile, the number of pixel points per scattering is linearly related to the scattering area, i.e., it is linearly related to the square of the scattering diameter, so the probability can be expressed as:
p = s ¯ N n u m ω D s 2 N m a x
N num is the total number of scattered spots in the image,  ω is the scale factor and D s is the diameter of scattered spots. Therefore, the gray scale fluctuation coefficient σ 1 2 can be expressed as:
σ 1 2 ( G 1 , G 2 , N n u m , D s ) = ( G 2 G 1 ) 2 ( s ¯ N n u m ω D s 2 N m a x ) 2 + ( G 2 G 1 ) 2 ( s ¯ N n u m ω D s 2 N m a x ) G 1 2 ( s ¯ N n u m ω D s 2 N m a x ) 1 2 + G 1 2 ( 1 ( s ¯ N n u m ω D s 2 N m a x ) ) 2 + 2 G 1 G 2 ( s ¯ N n u m ω D s 2 N m a x ) ( 1 ( s ¯ N n u m ω D s 2 N m a x ) )
G 1 , G 2 are the target and ambient background gray level thresholds, respectively, which are variable parameters, so we can write a set of variable parameters after normalizing them:
σ 1 2 ( a , b , N n u m , D s ) = ( b a ) 2 ( s ¯ N n u m ω D s 2 N m a x ) 2 + ( b a ) 2 ( s ¯ N n u m ω D s 2 N m a x ) a 2 ( s ¯ N n u m ω D s 2 N m a x ) 1 2 + a 2 ( 1 ( s ¯ N n u m ω D s 2 N m a x ) ) 2 + 2 a b ( s ¯ N n u m ω D s 2 N m a x ) ( 1 ( s ¯ N n u m ω D s 2 N m a x ) )
where a , b are the normalized characteristic parameters, which can be flexibly adjusted with the change in the density and size of the number of detected bubbles.
Finally, we averaged the dynamic normalized grayscale received by the CCD camera for a selection of n cases to obtain Equation (18):
σ 1 2 ( a , b , N n u m , D s ) = 1 n i = 1 n ( a b ) 2 ( s ¯ N n u m ω D s 2 N m a x ) 2 + ( a b ) 2 ( s ¯ N n u m ω D s 2 N m a x ) ( a b ) 2 ( s ¯ N n u m ω D s 2 N m a x ) 2 2 a ( s ¯ N n u m ω D s 2 N m a x ) ( a b ) + c
where n is the total number of images and c is a characteristic constant.

3. Experimental Design and Result Analysis

3.1. Experimental Components

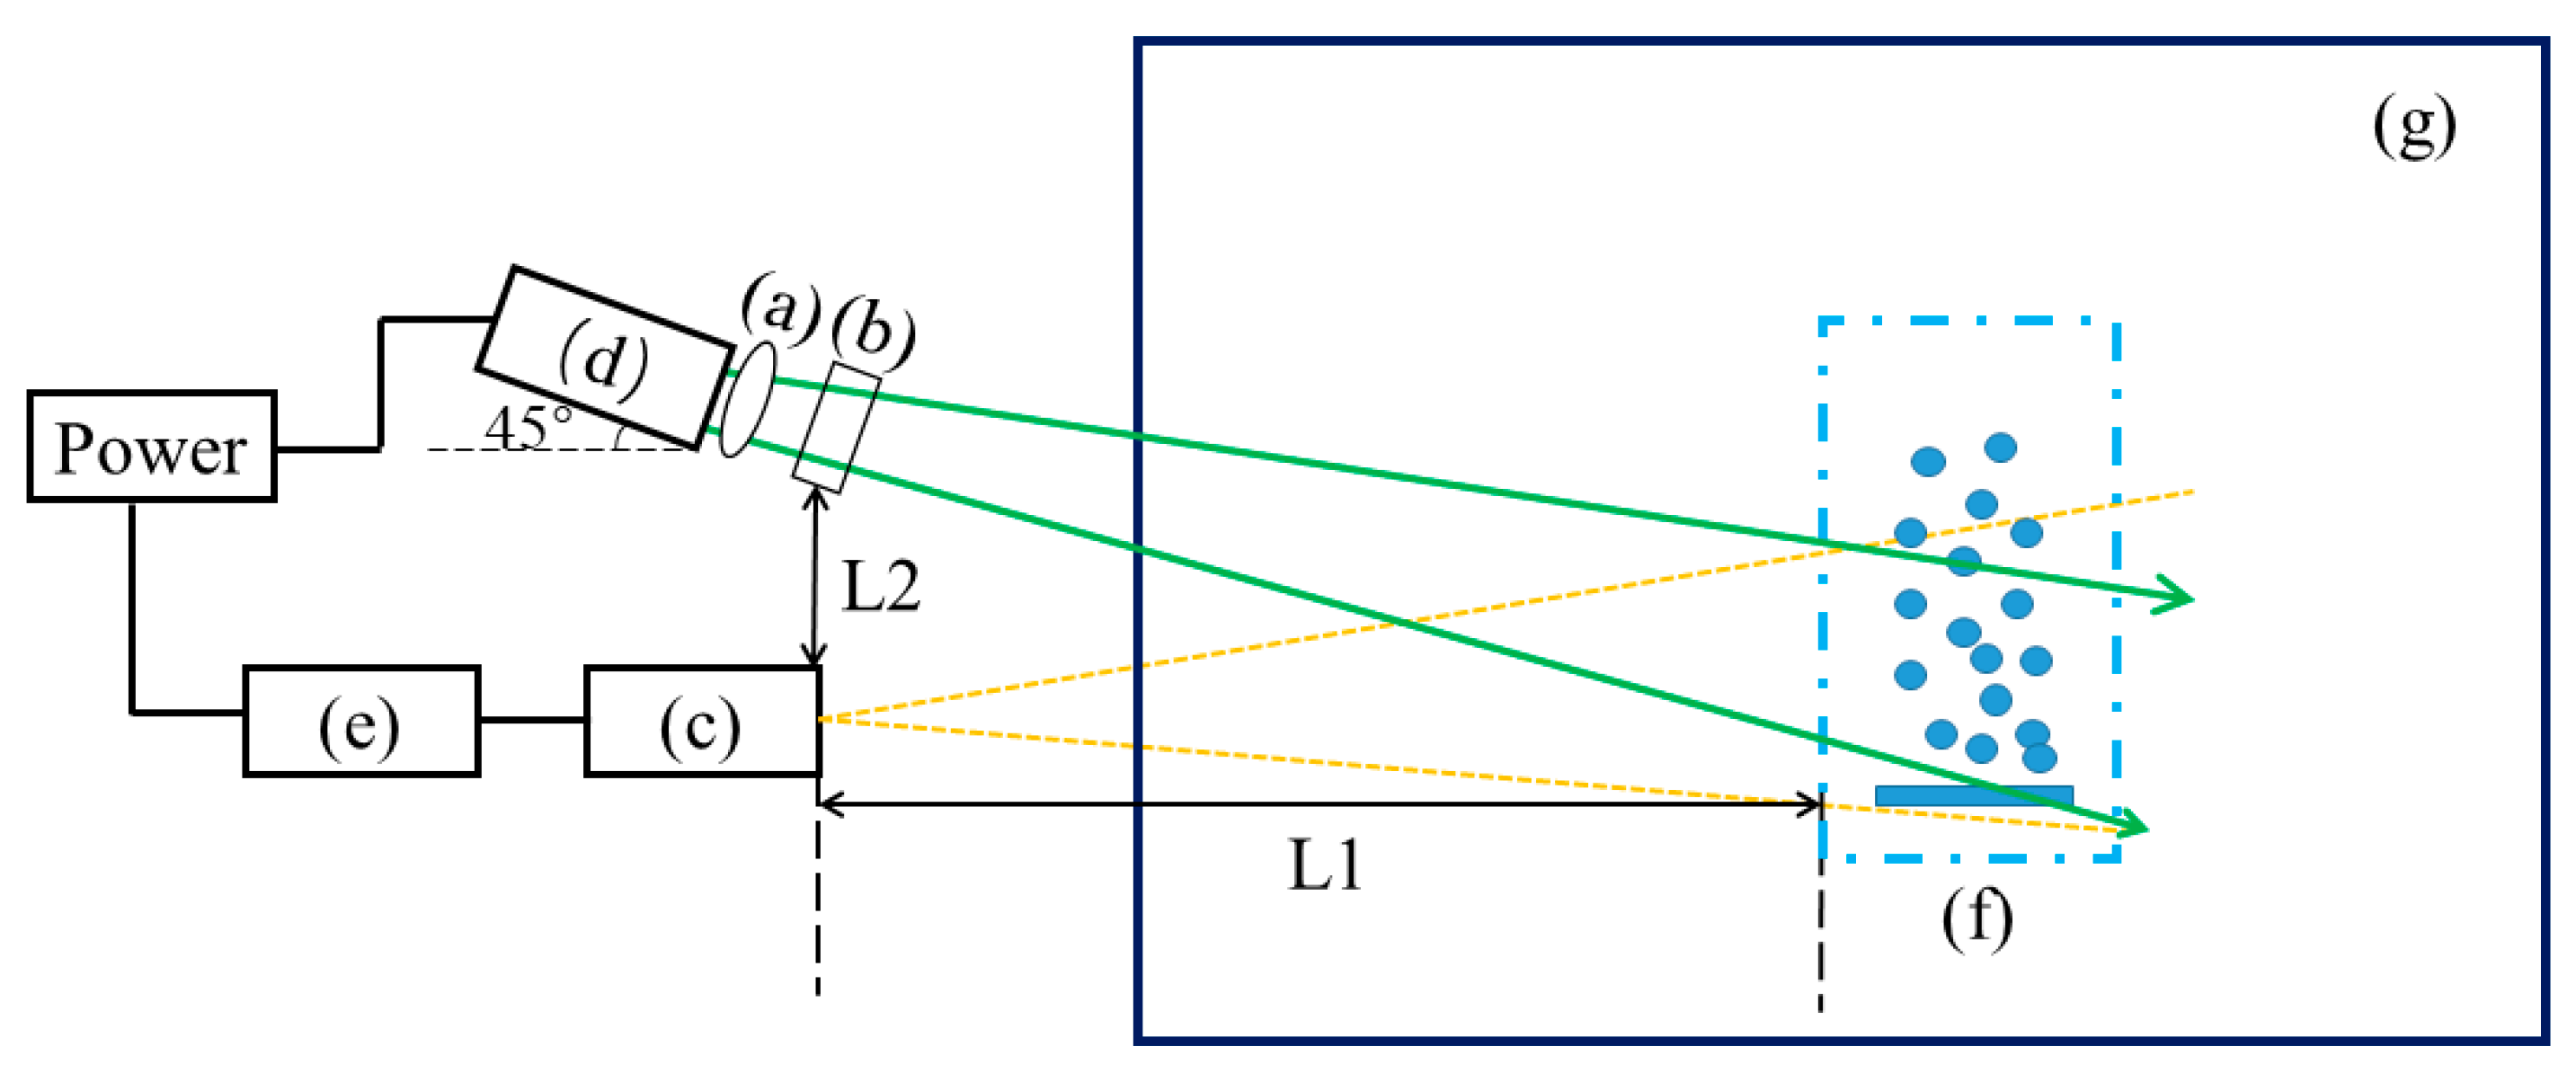
In this section, the validity of the prediction model is verified. We used a 2 m long and 0.5 m deep water tank and utilized sea salt mixed with tap water to simulate medium-salinity (13.5‰) artificial seawater [21]. We adopted molybdenum wire electrolysis of water to simulate the generation of bubbles, using different sizes of molybdenum wire loaded with different strengths of current at both ends for the electrolysis to simulate bubbles of different sizes and number distribution. The molybdenum wire plate was at a distance of 0.3 m from the detection system. At the same time, a polarization camera was used to capture both polarized and non-polarized images simultaneously, and the images were transmitted to a PC via a gigabit network cable for fusion and feature extraction. The system composition is shown in Figure 6 and Figure 7.
In Figure 6 and Figure 7, a is a 400–700 μm adjustable beam expander mirror; b is a 25.4 mm rotating polarizer, where the laser is emitted at an angle of 0°; c is a Lucid line polarization camera, using conventional lenses and a 10×–120× microscope head at an angle of 45° in the implementation of backward non-invasive detection of gas bubbles; d is a RGB tunable continuous laser, with an emission of 1 μj energy; e is the PC side of the display; f is the electrolytic bubble generator, located at L1 of the detection system (L1 = 30 cm), with an axial distance of L2 = 10 cm between the illuminating end and the receiving end.

3.2. Result Analysis

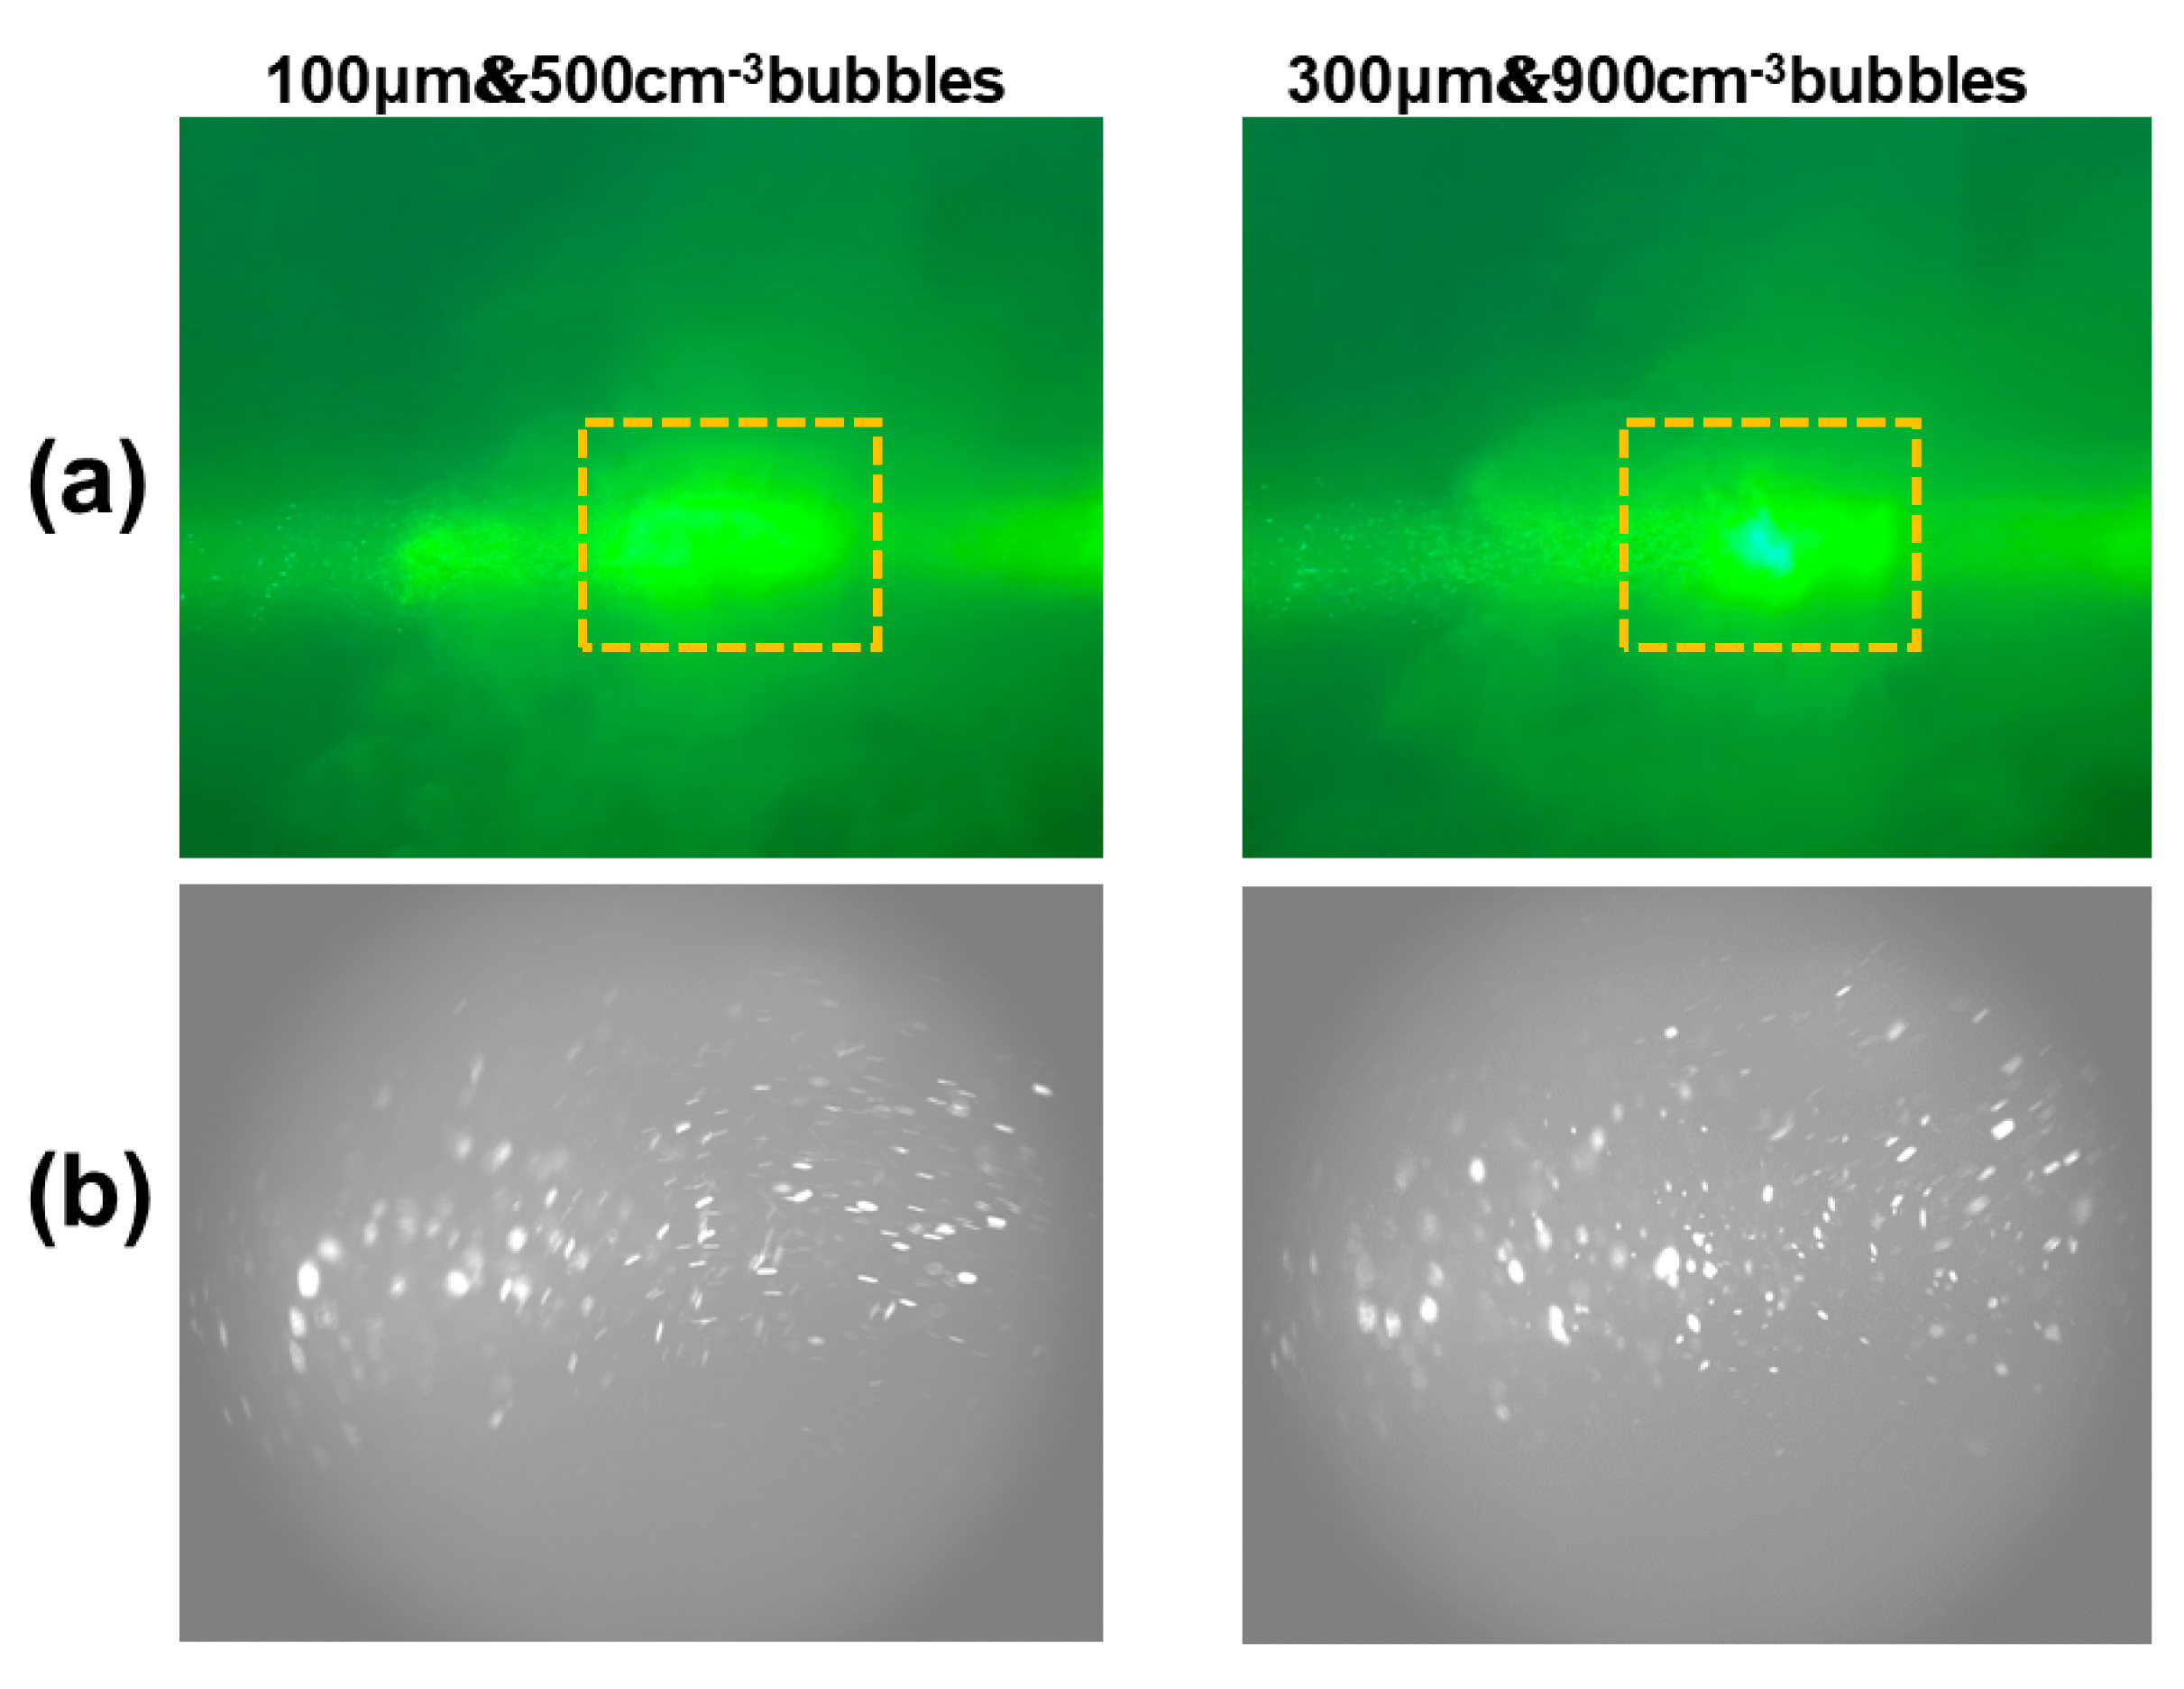
The acquisition rate of our camera is 5 fps, and we acquired for 60 s for different bubble characterization situations; each situation corresponds to the acquisition of 300 images, and some of the bubble characterization situations are shown in Figure 8 below.
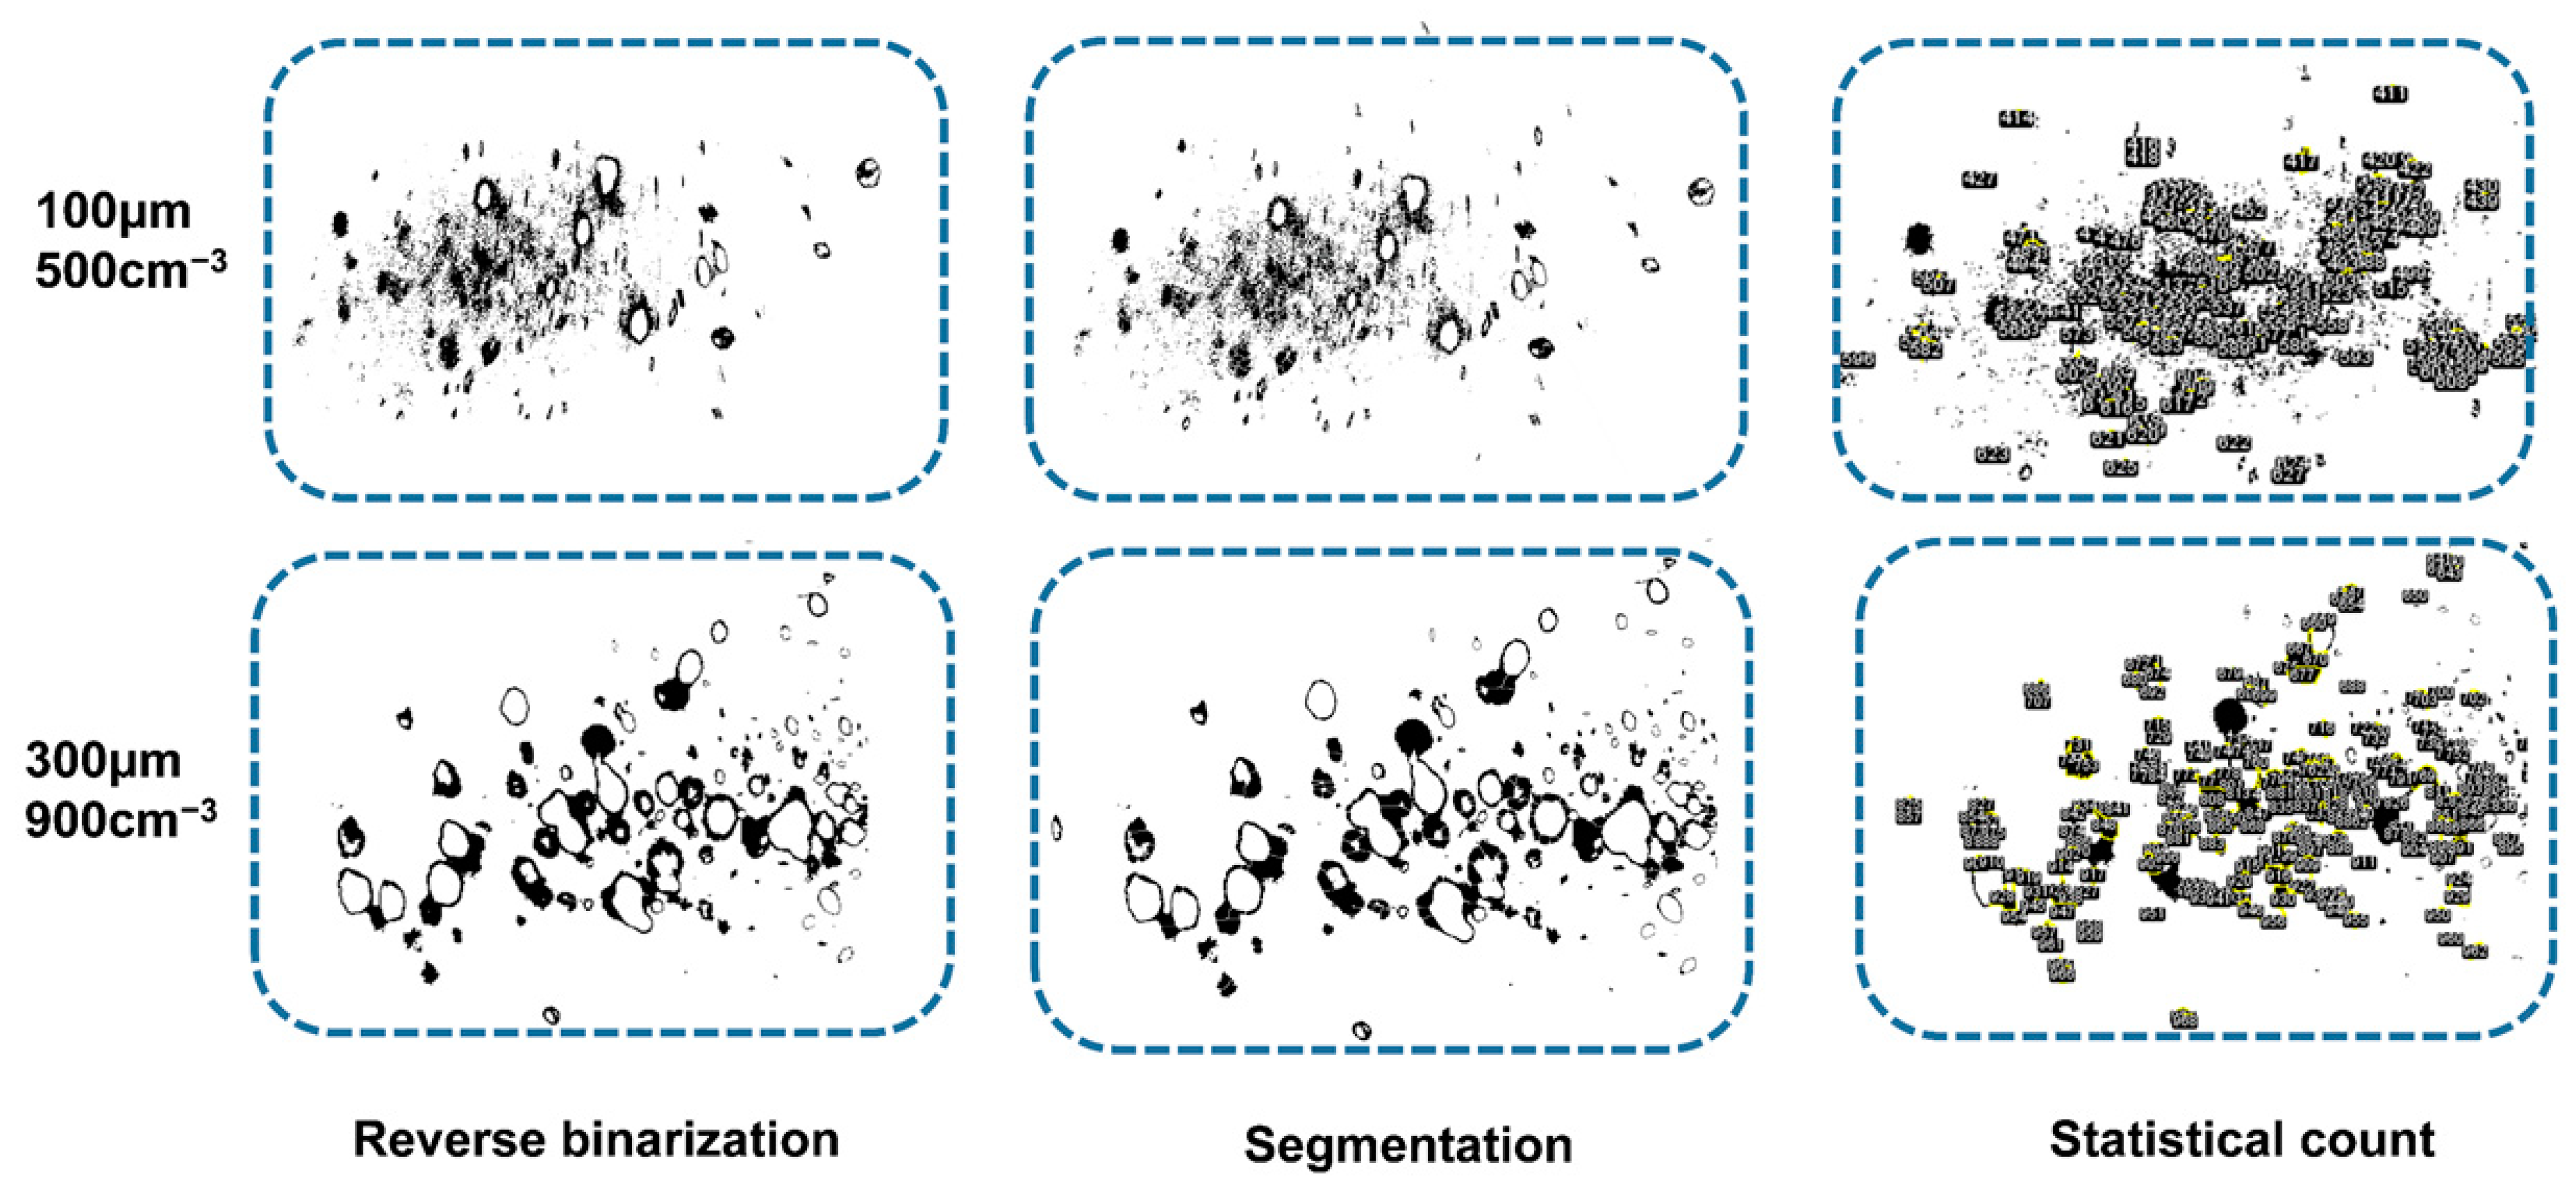
Reverse binarization was employed for the processed bubble images, and the adhesive bubbles were separated using the fast radial symmetric transform (FRS). Ellipse fitting was then used to complete the contour estimation and data expansion, yielding the characteristics of the bubble size and number distribution in the target image. The processing results are displayed below in Figure 9.
As can be seen from Figure 9, in the binarized view, most of the bubbles are characterized as dark at the edges and bright at the center, but there are also a small number of them that are bright at the edges and dark at the center, which is due to the multiple scattering characteristics of the bubble population, resulting in uneven light intensity in the illuminated area, coupled with the stacking of bubbles on top of each other, forming shadows, resulting in differences in the reflected light intensity of some of the bubbles, and even non-illuminated areas due to the illumination of the scattered light of the bubbles, resulting in the appearance of a light patch within the situation. At the same time, due to the influence of the flow field caused by the floating bubbles, the impurities in the water are also re-suspended with the floating bubbles, resulting in the appearance of many solid black spots in the field of view. Through the image fusion enhancement and polarization recognition technology, we have filtered out most of them, but due to the fact that the suspension contains many plankton, which have the ability to absorb the polarized light formed by the “polarization artifacts”, they and the bubble have a similar degree of polarization, even after polarization recognition, and there are still a significant portion of errors for bubble size and number remaining in the distribution statistics. This brings errors to the statistics of bubble size and number distribution.
We test the effectiveness of our polarization image fusion algorithm by introducing the bubble detection rate ( D R ) with a multi-frame detection standard deviation ( S 2 ). The detection rate and standard deviation equations are shown below:
D R = C f C T
where C f is the actual bubble detection value and C T is the theoretical value of the bubble generated in that case.
S 2 = [ ( D 1 D ¯ ) 2 + ( D n D ¯ ) 2 ] / n
where D n is the nth frame bubble size and D ¯ is the average of the bubble sizes in that case.
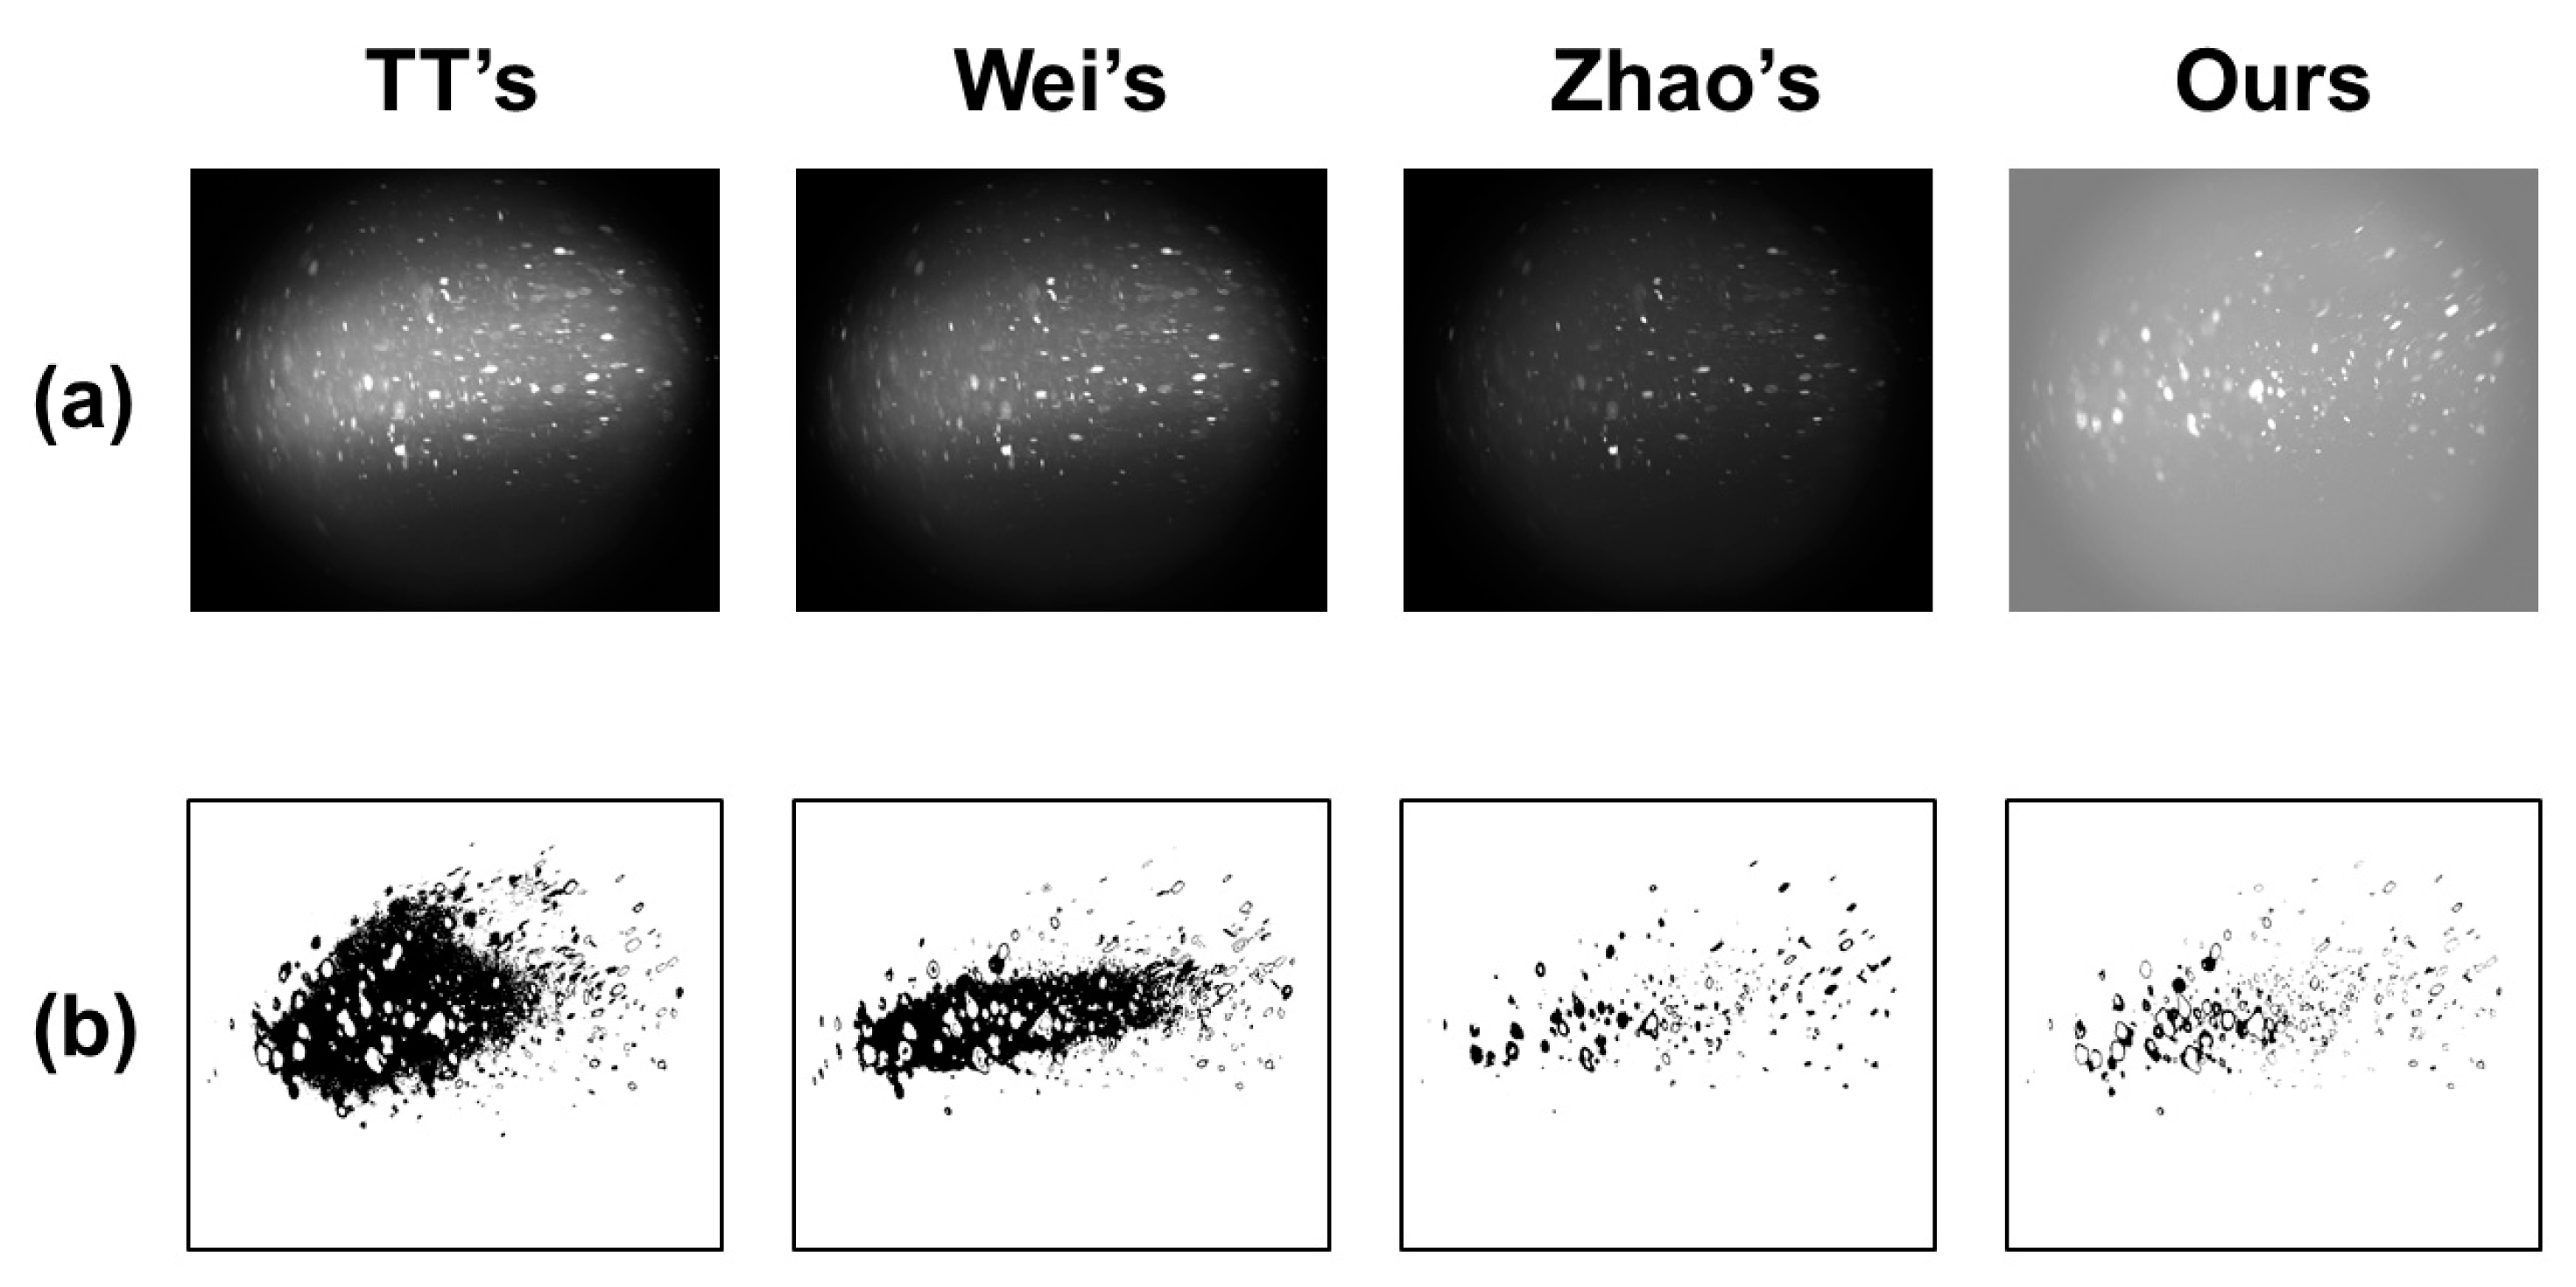
Meanwhile, in order to verify the reliability and accuracy of the polarization fusion algorithm, we use several common polarization image processing methods to detect and process the bubble images in the same case, and compare their binarization results as well, which are measured by the detection rate and variance mentioned above. The comparison results are shown in Figure 10 and Table 1 below.
Figure 10 illustrates how the established algorithms can be used to finish bubble recognition. However, TT’s and Wei’s methods depend on the extraction of stable background regions to some extent, so under the high-turbidity suspended particle flow field, the processed images all have large shadow regions, and are disturbed by dynamic background light, and the light intensity is uneven, so the images are blurred. As a result, the variance of multi-frame detection is larger and the error recognition rate is higher. However, compared with TT’s method, Wei’s algorithm has strong adaptability in background selection and correction, so Wei’s method has a higher value in the bubble detection rate. Zhao’s method does not rely on prior knowledge and assumptions, so it has strong ability in background scattering. Meanwhile, the contour of bubble recognition is clear, the image shadows are less, the multi-frame detection variance is low, and the error recognition rate is low. However, due to the existence of multiple objects with polarization characteristics in the image, the algorithm struggles to achieve uniformity in recognition, so its threshold of descattering is high. Some of the bubble particles with weak light intensity are filtered out, which makes the detection rate of this method low. Our method not only achieves image enhancement by weighted fusion of polarized and unpolarized images, but also homogenizes the brightness of the overall image and strengthens the bubble edge contour information. At the same time, the weights based on the target polarization greatly enhance the polarization characteristics of weak targets such as bubbles, increase the gray value of small-sized bubbles in the polarization fusion image, effectively distinguish suspended particles and bubbles, and filter out part of the background scattered light to increase the contrast of the bubble target, making it easier to identify the target in the fused image. As a result, the fused image has a greater advantage in recognition detection rate and multi-frame stability, which can significantly improve the image resolution and help to accurately recognize and detect the features of smaller bubbles.
In the dual-mode fusion module, the R 2 index is used to verify the degree of fitting between the posterior probability model and the experimental data, so as to evaluate the performance of the prediction module [24]. The R 2 index is also called the fit index, as shown in Equation (21).
R 2 = 1 S S r e g S S t o t
where S S reg is the sum of the squared errors of the statistical distributions, i.e., S S reg = i = 1 M f m , i f n , i 2 , where M is the number of segments in the histogram of the collected data, f m , i and f n , i are the measured and predicted probability values corresponding to the i-th segment for a given received intensity level, respectively. S S tot is the sum of the squares of the distances between the measured points and their mean values, i.e., S S tot = i = 1 M f m , i f 2 , where f = i = 1 M f m , i / M . It is clear that this fitting function fits the experimental data better when the R 2 measurements for a given distribution are close to the maximum (i.e., 1).
Through simulation and polarization detection, we can know that under a certain degree of confidence, that is, within a certain degree of polarization, the speckle in the image can be determined to be a bubble in water. Therefore, the number density and diameter of a speckle can directly represent the number density and diameter of the bubble under a certain coefficient. Therefore, we can obtain the fitting function and curve of the gray fluctuation of the image and the density and size of bubble values, as shown in Figure 11 and Table 2 below:
From the analysis in Figure 11 and Table 2, it can be seen that the model is suitable for the feature detection of the mixed bubble layer in the range of 50–1000 μm and 100–2000 cm−3, and the fitting degree reaches 0.9352. As illustrated in Figure 11, the image grayscale fluctuation (GF) exhibits a consistent increasing trend when bubble size and bubble number density rise. This is due to the fact that when bubbles are large and dense, there is a greater chance that the image will capture them. The influence of these conditions is demonstrated by the increasing number of scattered bubble spots in the image, the acceleration of the bubbles’ floating speed, and the rapid passage of the bubbles through the field of view, which cause significant fluctuations in the image’s gray level across multiple frames. The image gray level fluctuation (GF) changes from sporadic weak fluctuation to a vast range of strong fluctuations as the size and density of the bubble rise. This causes the GF value to increase continuously. In addition, as Figure 11 illustrates, an increase in bubble size has a greater effect on the image’s grayscale fluctuation than an increase in bubble number density. This is due to the increased significance of the turbulence effect following the bubble size increase, which causes the overall image’s light intensity to become more uneven and unstable, leading to sharp variations in the grayscale value and more noticeable variations in the GF value.
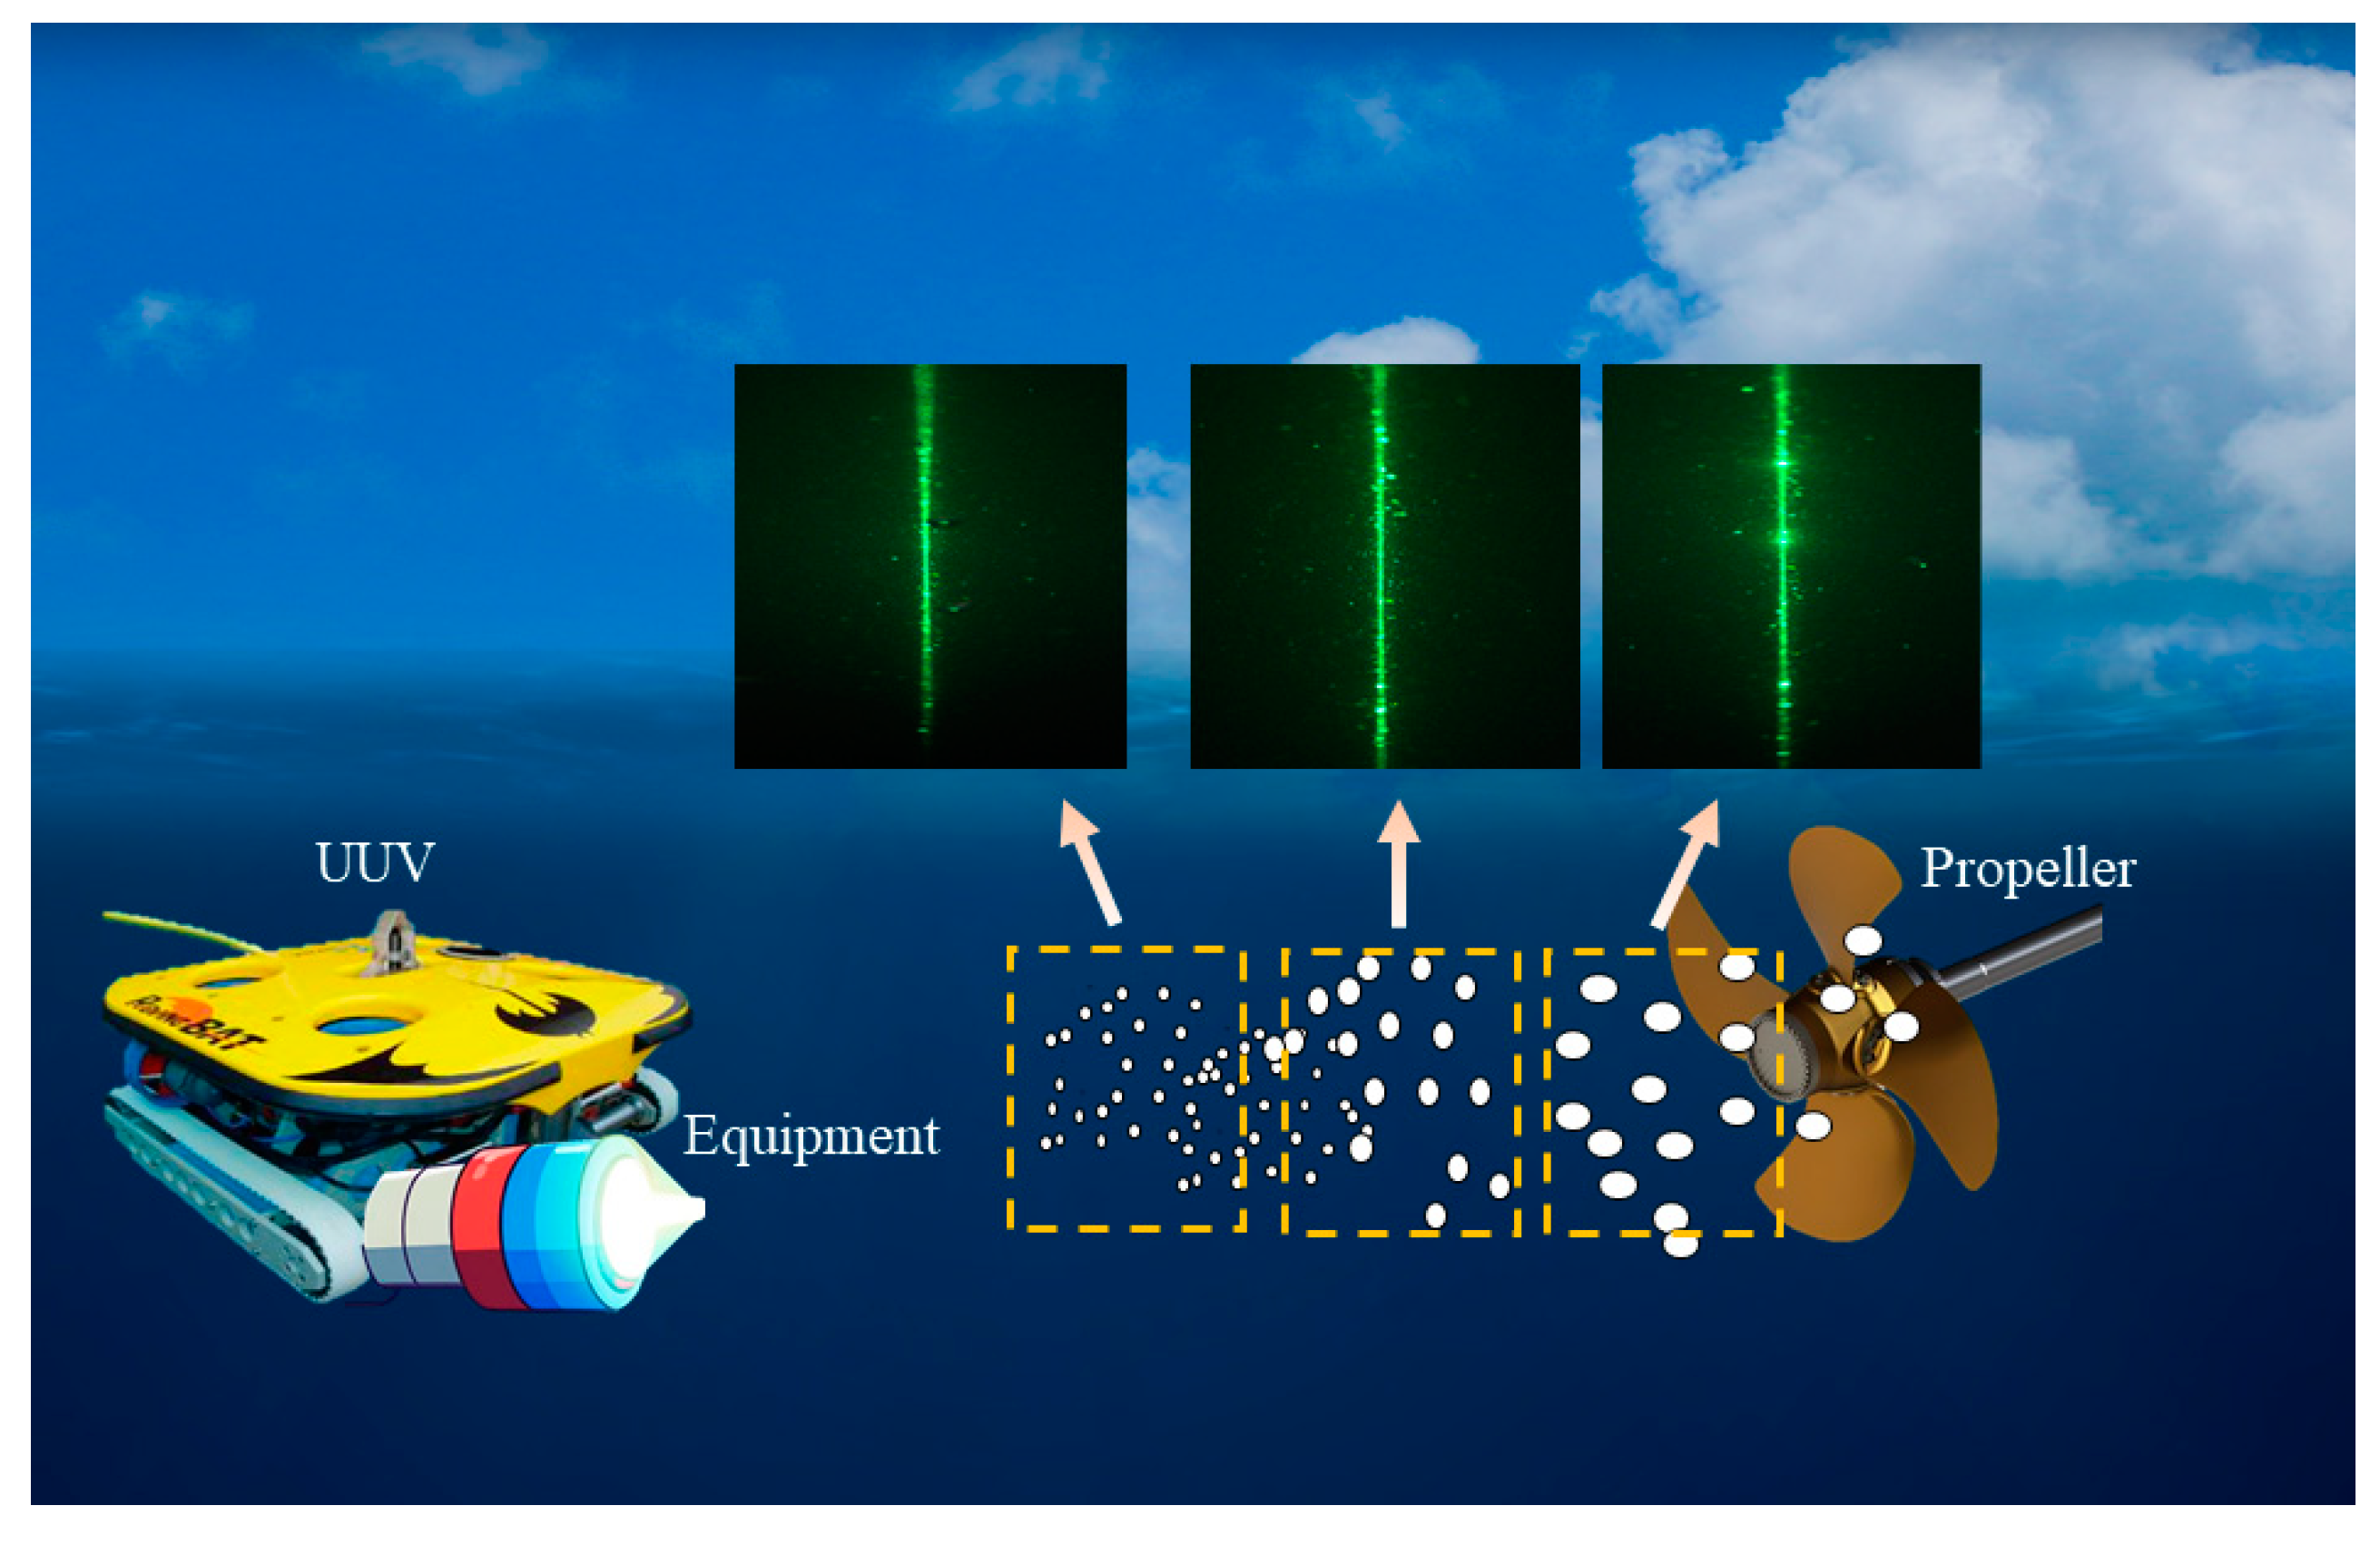
In order to verify the environmental adaptability, detection accuracy, and real-time performance of the detection mechanism, and provide a potential application scheme for subsequent engineering, we tried to carry out field verification of the detection method in a lake environment. In the lake environment, the detection equipment is integrated in a watertight box, placed at a water depth of 0.5 m, in the form of a UUV mount, and slowly brought closer to the propeller cavitation bubble area to verify the detection mechanism in a real natural environment [25]. The external field design and original capture results are shown in Figure 12, and the recognition and extraction of bubble features are shown in Figure 13.
Figure 13 characterizes the results of the continuous dynamic detection of the proposed method in the outfield lake environment. As can be seen from Figure 13, with the increase in time, that is, the closer the detection device is to the propeller, the number of bubbles increases significantly. At the same time, with the gradual distance, the number of large bubbles and its proportion in the detected bubble group also increased significantly, which is consistent with the distribution law of cavitation bubbles produced by the propeller. At the same time, compared with the existing dual-mode detection methods [26], although the dual-mode fusion method improves the bubble detection capability, it is difficult to quantitatively extract and analyze the characteristics of bubble size and quantity distribution. This method can accurately perceive and identify the changes in bubble size and density distribution at the second time scale. The scheme has high practical value and engineering application prospects.

4. Conclusions

This research proposes a dual-mode fusion of laser polarization image-based bubble detection techniques based on the polarization and imaging properties of underwater bubbles. Three components make up the scheme: dual-mode fusion bubble feature recognition, picture fusion and feature extraction, and ideal bubble state simulation. An image-polarization-weighted fusion approach is proposed to improve the polarization features of the bubble target using weighted coefficients of polarized images and unbiased images, with the threshold value being the outcomes of an ideal bubble simulation. Lastly, a probabilistic fusion approach based on laser polarization and dual-module image data is suggested, and the confidence fusing of bubble polarization features and picture gray level is executed from a statistical probability standpoint. A posterior distribution probability model of discriminative characteristics, including bubble size and number, is established, a fitting of bubble small-sample and multi-source data is realized, and continuous perception of bubble characteristics in complex underwater environments is achieved through the use of the gray wave value (GF) to correlate the characteristics of bubbles and impurities. These results are based on the target confidence adaptive fusion dual-mode detection results, which show that the impurities and bubble characteristics are accurately distinguished. Adaptive analysis at the bubble instance level is achieved. The results of the experiments indicate that the measurement accuracy of quantity distribution and bubble size change may approach 93%, and the detection rate of bubbles in the 50–1000 μm and 100–2000 cm−3 range can reach 95%. The method can detect that the minimum size of bubbles is 50 μm, the minimum number of bubbles is 100 cm−3, the change in bubble size is ±5 μm, and the change in bubble number is ±50 cm−3. Based on this mechanism, real-time identification and tracking of ship track and fish activity can be realized, which provides a potential application scheme for ocean detection and marine biological monitoring. However, this method has the disadvantage of a low speed being required by the moving platform, which is insufficient for anti-jitter and algorithm recovery of images captured in high-speed motion, and the recognition rate decreases after a high-speed platform is installed.

Author Contributions

Conceptualization, S.Z.; methodology, S.Y.; software, S.L. All authors have read and agreed to the published version of the manuscript.

Funding

This work was supported by The National Defense Foundation of China (2019-JCJQ-JJ-056), The National Defense Pre-Research Foundation of China (2020-JCJQ-ZD-099-00-02).

Institutional Review Board Statement

Not applicable.

Informed Consent Statement

Not applicable.

Data Availability Statement

The original contributions presented in the study are included in the article, further inquiries can be directed to the corresponding author.

Acknowledgments

Thanks to Cheng Qian and Zhang Xin for their support in the experiment and paper writing.

Conflicts of Interest

The authors declare no conflicts of interest.

References

  1. Wang, D.; Josset, D.; Savelyev, I.; Anguelova, M.; Cayula, S.; Abelev, A. An Experimental Studyon Measuring Breaking-WaveBubbles with LiDAR. Remote Sens. 2022, 14, 1680. [Google Scholar]
  2. Li, W.; Yang, K.; Xia, M.; Rao, J.; Zhang, W. Influence of characteristics of micro-bubble clouds on backscatter lidar signal. Opt. Express 2009, 17, 17772–17783. [Google Scholar] [PubMed]
  3. Olsen, J.E.; Skjetne, P. Modelling of underwater bubble plumes and gas dissolution with an Eulerian-Lagrangian CFD model. Appl. Ocean. Res. 2016, 59, 193–200. [Google Scholar]
  4. Abbaszadeh, M.; Alishahi, M.M.; Emdad, H. Experimental investigations on the bubbly wake of a transom stern model using optical laser beam scattering characteristics. Appl. Ocean. Res. 2020, 104, 102380. [Google Scholar]
  5. Josset, D.; Cayula, S.; Concannon, B.; Sova, S.; Weidemann, A. On the bubble-bubbleless ocean continuum and its meaning for the LiDAR equation: LiDAR measurement of underwater bubble properties during storm conditions. Opt. Express 2024, 32, 20881–20903. [Google Scholar]
  6. Song, Q.; Sun, X.B.; Liu, X.; Ti, R.F.; Huang, H.L.; Wang, H. Exploring target imaging in underwater bubble group environment based on polarization information. Acta Phys. Sin. 2021, 70, 210–225. [Google Scholar]
  7. Ma, T.; Hessenkemper, H.; Lucas, D.; Bragg, A.D. Effects of surfactants on bubble-induced turbulence. Fluid Mech. 2023, 970, A13. [Google Scholar]
  8. Tan, W.; Liu, X.; Wu, D.; Luo, B.; Zhao, M.; Guo, Y.; Long, J.; Zhang, Y. Measurement of Bubble Group Characteristics of Gas-Liquid Two-Phase Flow by Laser Cross Section Imaging. Acta Opt. Sin. 2022, 42, 1510001. [Google Scholar]
  9. Qian, S.Y.; Chen, J.J.J. Effect of liquid fraction and bubble size distribution on the polarised light scattering characteristics of Casein foam. Chem. Eng. Sci. 2015, 122, 250–269. [Google Scholar]
  10. Ma, T.; Hessenkemper, H.; Lucas, D.; Bragg, A.D. Fate of bubble clusters rising in a quiescent liquid. Fluid Mech. 2023, 973, A15. [Google Scholar]
  11. Zhao, Y.; He, W.; Ren, H.; Li, Y.; Fu, Y. Polarization descattering imaging through turbid water without priorknowledge. Opt. Lasers Eng. 2022, 148, 106777. [Google Scholar]
  12. Shukla, P.; Sumathi, R.; Gupta, S.; Pradhan, A. Influence of size parameter and refractive index of the scatterer on polarization-gated optical imaging through turbid media. J. Opt. Soc. Am. A 2007, 24, 1704–1713. [Google Scholar]
  13. Li, H.; Zhu, J.; Deng, J.; Guo, F.; Sun, J.; Zhang, Y.; Hou, X. Influence mechanism of the particle size on underwater active polarization imaging of reflective targets. Opt. Express 2023, 31, 7212–7225. [Google Scholar] [PubMed]
  14. Hu, H.; Zhao, L.; Li, X.; Wang, H.; Liu, T. Underwater image recovery under the nonuniform optical field based on polarimetric imaging. IEEE Photonics J. 2018, 10, 1–9. [Google Scholar]
  15. Zhang, Y.; Cheng, Q.; Zhang, Y.; Han, F. Image-restoration algorithm based on an underwater polarization imaging visualization model. J. Opt. Soc. Am. A 2022, 39, 855–865. [Google Scholar] [CrossRef]
  16. Ramella-Roman, J.; Prahl, S.; Jacques, S. Three Monte Carlo programs of polarized light transport into scattering media: Part I. Opt. Express 2005, 13, 4420–4438. [Google Scholar]
  17. Miller, S.; Ding, Y.; Jiang, L.; Tu, X.; Pau, S. Observation of elliptically polarized light from total internal reflection in bubbles. Sci. Rep. 2020, 10, 8725. [Google Scholar]
  18. Song, Q.; Liu, X.; Huang, H.; Ti, R.; Sun, X. Polarization Reconstruction Algorithm of Target Based on the Analysis of Noise in Complex Underwater Environment. Front. Phys. 2022, 10, 813634. [Google Scholar]
  19. Liang, S.; Wang, J.; Zong, S.; Wu, R.; Ma, Z.; Wang, X.; Wang, L. Laser detection method of ship wake bubbles based on multiple scattering intensity and polarization characteristics. Acta Phys. Sin. 2013, 62, 060704. [Google Scholar]
  20. Wang, J.; Wan, M.; Cao, X.; Zhang, X.; Gu, G.; Chen, Q. Active non-uniform illumination-based underwater polarization imaging method for objects with complex polarization properties. Opt. Express 2022, 30, 46926–46943. [Google Scholar]
  21. Fan, L.; Sun, G.; Qiu, J.; Ma, Q.; Hess, P.; Li, A. Effect of seawater salinity on pore-size distribution on a poly(styrene)-based HP20 resin and its adsorption of diarrhetic shellfish toxins. J. Chromatogr. A 2015, 1373, 1–8. [Google Scholar] [CrossRef] [PubMed]
  22. Treibitz, T.; Schechner, Y. Active polarization descattering. IEEE Trans. Pattern Anal. Mach. Intell. 2009, 31, 385–399. [Google Scholar] [CrossRef] [PubMed]
  23. Wei, Y.; Han, P.; Liu, F.; Shao, X. Enhancement of underwater vision by fully exploiting the polarization information from the Stokes vector. Opt. Express 2021, 29, 22275–22287. [Google Scholar] [CrossRef] [PubMed]
  24. Andres, A.; Hernández, M. To have value, comparisons of high-throughput phenotyping methods need statistical tests of bias and variance. Front. Plant. Sci. 2023, 14, 1325221. [Google Scholar]
  25. Zong, S.G.; Chen, B.; Zhang, X.; Duan, Z.; Yang, S.; Li, X. Laser forward and backward scattering characteristics and experimental study of bubbles in ship wake. Appl. Opt. 2024, 63, 1795. [Google Scholar] [CrossRef]
  26. Zong, S.; Zhang, X.; Duan, Z.; Yang, S.; Chen, B. Research on Laser Dual-Mode Fusion Detection Method of ShipWake Bubbles. Appl. Sci. 2024, 14, 3695. [Google Scholar] [CrossRef]
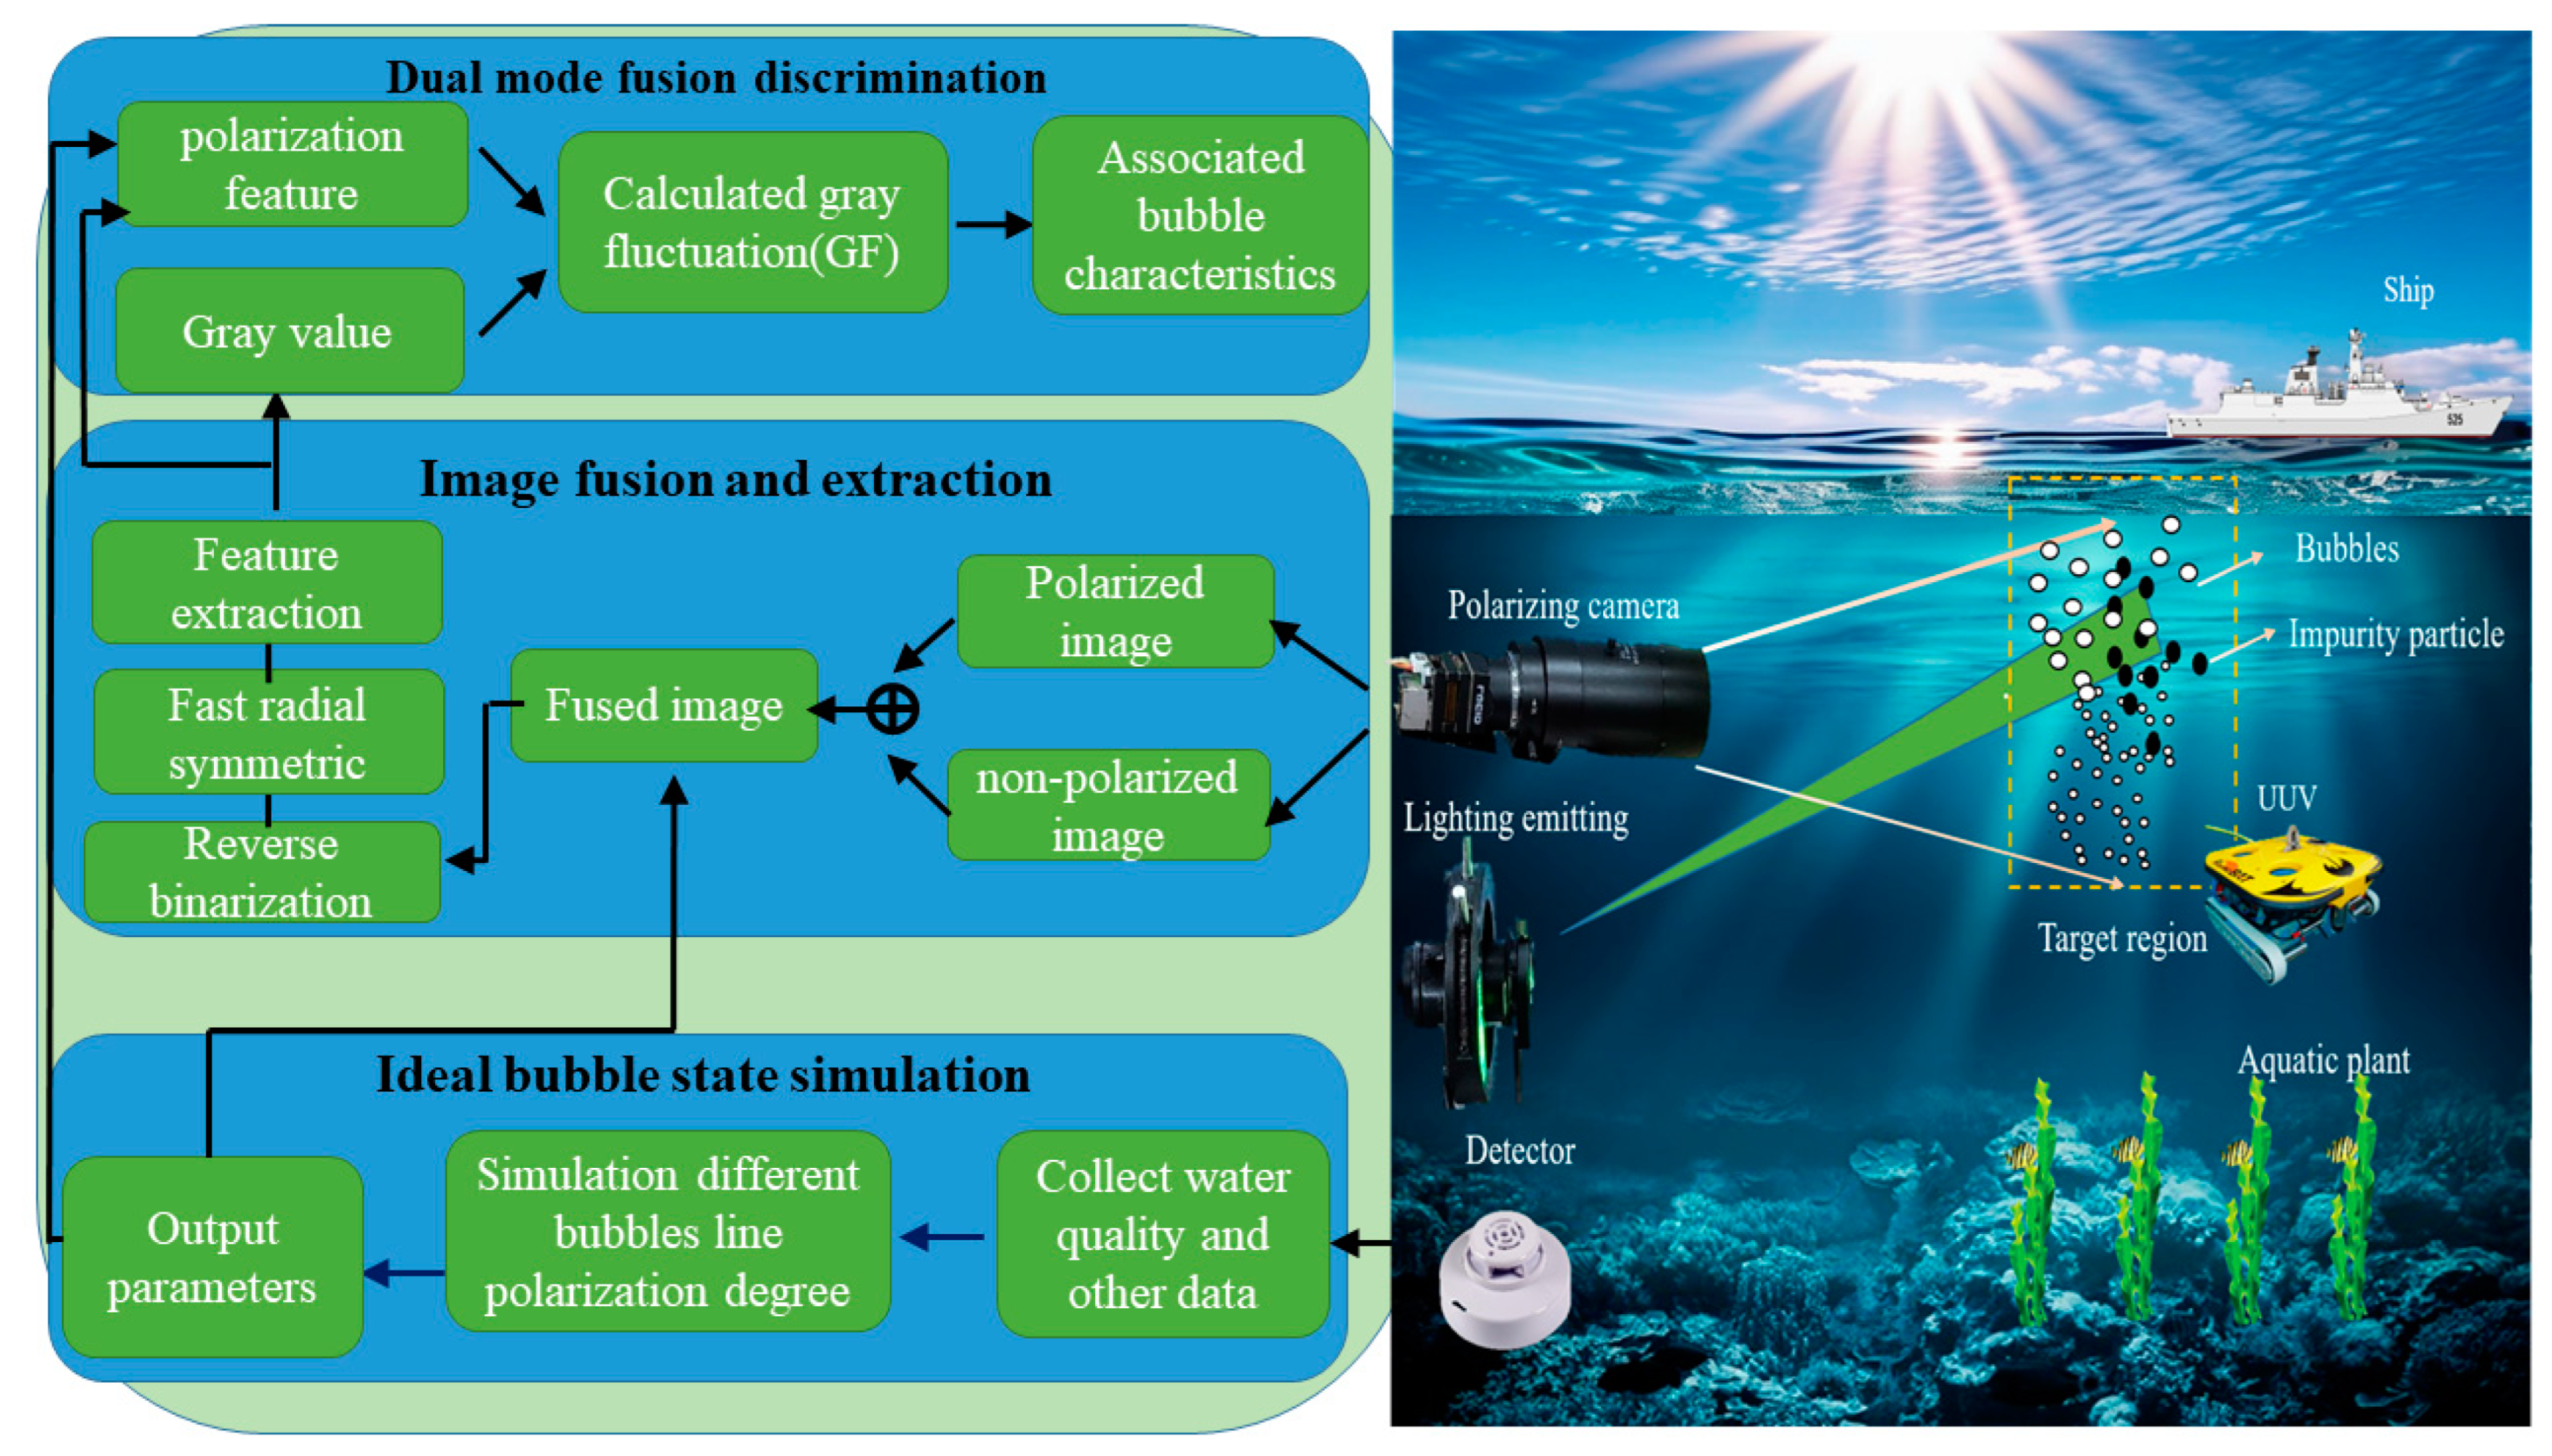
Figure 1. Block diagram of bubble detection by dual-mode fusion method.
Applsci 14 08465 g001
Figure 2. Simulation algorithm flow chart.
Applsci 14 08465 g002
Figure 3. The meridian plane solves the photon scattering coordinate system.
Applsci 14 08465 g003
Figure 4. Bubble group receding polarizability results with different size and number distributions.
Applsci 14 08465 g004
Figure 5. Polarization image fusion mechanism.
Applsci 14 08465 g005
Figure 6. Experimental structure diagram.
Applsci 14 08465 g006
Figure 7. Experimental setup. (a) Experimental construction of the overall architecture; (b) probe-specific composition components.
Applsci 14 08465 g007
Figure 8. Bubble image under partial conditions. (a) Real shot image of bubbles generated by electrolytic molybdenum wire. (b) Bubble image after fusion processing in the box selection.
Applsci 14 08465 g008
Figure 9. Bubble handling count results.
Applsci 14 08465 g009
Figure 10. Results of different methods to identify bubbles under high-turbidity (attenuation coefficient 2.198 m−1) conditions. (a) Original image after different ways of processing; (b) binarized image after different ways of processing.
Applsci 14 08465 g010
Figure 11. The bubble characteristic fitting results of dual mode fusion.
Applsci 14 08465 g011
Figure 12. Schematic diagram of the field experiment.
Applsci 14 08465 g012
Figure 13. Recognition results in the field dynamic environment.
Applsci 14 08465 g013
Table 1. Comparison of results under different treatments.
MethodTT’s [22]Wei’s [23]Zhao’s [11]Our
Detection rate75.6%84.7%81.2%95.3%
S 2 0.3640.2050.0640.051
Table 2. Function fitting parameters.
R20.9352RMSE0.0503
a0.4694b0.020
c0.1843ω 0.679
Disclaimer/Publisher’s Note: The statements, opinions and data contained in all publications are solely those of the individual author(s) and contributor(s) and not of MDPI and/or the editor(s). MDPI and/or the editor(s) disclaim responsibility for any injury to people or property resulting from any ideas, methods, instructions or products referred to in the content.