Article

Analysis of Granite Deformation and Rupture Law and Evolution of Grain-Based Model Force Chain Network under Anchor Reinforcement

1
State Key Laboratory of Intelligent Construction and Healthy Operation and Maintenance of Deep Underground Engineering, China University of Mining and Technology, Xuzhou 221116, China
2
Shanxi Huaning Coking Coal Co., Ltd., China Coal Group Huajin Co., Ltd., Linfen 042100, China
3
State Key Laboratory of Disaster Prevention and Mitigation of Explosion and Impact, Army Engineering University of PLA, Nanjing 210007, China
*
Author to whom correspondence should be addressed.
Appl. Sci. 2024, 14(18), 8548; https://doi.org/10.3390/app14188548
Submission received: 9 August 2024 / Revised: 16 September 2024 / Accepted: 18 September 2024 / Published: 23 September 2024

Abstract

:
In actual underground rock engineering, to prevent the deformation and damage of the rock mass, rock bolt reinforcement technology is commonly employed to maintain the stability of the surrounding rock. Therefore, studying the anchoring and crack-stopping effect of rock bolts on fractured granite rock mass is essential. It can provide significant reference and support for the design of underground engineering, engineering safety assessment, the theory of rock mechanics, and resource development. In this study, indoor experiments are combined with numerical simulations to explore the impact of fracture dip angles on the mechanical behavior of unanchored and anchored granite samples from both macroscopic and microscopic perspectives. It also investigates the evolution of the anchoring and crack-stopping effect of rock bolts on granite containing fractures with different dip angles. The results show that the load-displacement trends, displacement fields, and debris fields from indoor experiments and numerical simulations are highly similar. Additionally, it was discovered that, in comparison to the unanchored samples, the anchored samples with fractures at various angles all exhibited a higher degree of tensile failure rather than shear failure that propagates diagonally across the samples from the regions around the fracture tips. This finding verifies the effectiveness of the numerical model parameter calibration. At the same time, it was observed that the internal force chain value level in the anchored samples is higher than in the unanchored samples, indicating that the anchored samples possess greater load-bearing capacity. Furthermore, as the angle αs increases, the reinforcing and crack-stopping effects of the rock bolts become increasingly less pronounced.

1. Introduction

In the realm of underground rock engineering, anchor reinforcement technology is commonly employed to avert deformation and damage to the rock mass, thereby ensuring the stability of the surrounding rock [1,2,3]. This technology, by offering proactive resistance, markedly enhances the shear strength of the structural surfaces and fortifies the constraints on ground deformation. It also optimizes the stress conditions within the excavated rock and soil mass [4]. Additionally, anchor reinforcement effectively harnesses the geotechnical body’s intrinsic strength and load-bearing capacity [5], unleashing its latent strength potential. This approach not only reduces project costs but also expedites construction timelines and supports the project’s sustainable long-term operation. In summary, the crack-stopping effect exerted by anchors on the fissured granite rock mass is of pivotal importance in underground rock reinforcement engineering. It offers substantial guidance and support for the design of underground engineering projects, safety assessments, the advancement of rock mechanics theory, and the exploitation of resources. The fracture stopping effect of anchors on the interior of the rock body cannot be solved by formula derivation of its rupture mechanism using theoretical methods, so indoor tests have become one of the main methods of studying the anchoring mechanism of anchors on fissured rock bodies, and many scholars and experts at home and abroad have carried out a lot of work on the mechanical behavior of the anchored fissured rock bodies.
In 1974, Bjurstrom [6] conducted a series of shear tests, revealing that anchors are capable of effectively containing deformation damage in jointed rock bodies and enhancing the shear resistance of joint surfaces. In 1975, Littlejohn and Bruce [7] categorized the damage modes of rock anchors into the following three distinct types: damage to the perimeter rock, interfacial failure, and damage to the anchor body itself. In 1987, Egger and Spang [8] carried out a series of large-scale in situ shear tests and similarly found that the anchorage angle of the anchor affects the anchorage effect of the anchor on the rock body. In 1990, Spang and Egger [9] investigated the anchorage effect of anchors in different rock materials by dividing their shear stress–displacement curves into a linear-elastic deformation, a yielding stage, and a plastic deformation stage. In 2010, Bezuijen [10] demonstrated that even with anchorage, jointed rock masses can still exhibit shear displacement when subjected to external loads. As the shear displacement across the joint surfaces accumulates, the anchor is likely to form a plastic hinge, at which point the maximum shear stress is reached.
On the domestic front, studies on the mechanical behavior of anchored fractured rock bodies have also focused on uniaxial compression and shear, which are the two most common and simplest stress states. Chen [11] conducted an experimental investigation on bolted rock samples to assess the anchoring efficacy of threaded steel bolts and D-bolts. The study incorporated a range of variables, including various angles of displacement, different joint spacings, and three distinct rock materials, namely, weak concrete, strong concrete, and concrete–granite. For anchored rock with perforated weak interlayers, Zong et al. [12] found that the anchoring effect could change the damage mode of the rock samples from brittle to ductile, with tensile damage being replaced by more shear damage. These above conclusions are consistent with the studies of Ren et al. [13] and Ding et al. [14]. In 2016, Li et al. [15] and Yang et al. [16] conducted laboratory tests on the effect of prestressing anchors in fractured rock bodies, which indicated the optimal anchorage angle and location. They also found that the anchors acted to inhibit fracture creation and expansion, and to improve the integrity of the fractured rock body. Under shear conditions, many scholars focused on the effects of anchors on shear force, displacement, and deformation, and achieved good results. In 2020, Yang et al. [17] explored in detail the fracture and anchorage mechanisms of jointed rock bodies on a microscopic scale by using the digital speckle correlation method, acoustic emission technology, and X-ray CT observation. In 2021, Li et al. [18] conducted anchorage shear tests. It was identified that the residual resistance contribution of full-length bond bolts was the largest at anchorage angles of 55° to 70°. The maximum contribution of the anchor bolts increased linearly with the increase in the joint extension angle. In addition, the effects of different anchorage types, anchorage patterns, joint roughness values, loading angles, and displacement angles were investigated in the anchorage shear tests.
With the rapid development of computer technology, numerical simulation has gradually become one of the mainstream research methods in the field of rock mechanics [19,20]. In the study of the mechanical behavior of anchored fractured rock, there are usually two methods, i.e., the finite element method (FEM) and discrete element method (DEM).
Han et al. [21] utilized the finite element analysis software ANSYS 2013R2 to construct a finite element model of fractured rock anchorage, investigating the impact of rock fractures on the load transfer mechanism of anchoring. Through numerical calculations, they analyzed the effects of fracture aperture, fracture length, and fracture position on the stress transfer mechanism in the anchored fractures. Kang et al. [22] analyzed the mechanism of “S”-type joint fractures in the fractured rock body and carried out numerical simulation research on the anchoring effect of this joint. They established the model of the fractured rock body under different anchoring methods using FEM software FLAC3D 5.0, and carried out simulation tests to analyze the mechanical properties of the fractured rock body under different anchoring methods. Comparison and analysis of the anchoring effect and the main damage mode under different anchoring methods. Yang et al. [16] used the FEM software ABAQUS (2018) to carry out a series of numerical simulation studies on the mechanical properties and anchoring effect of prestressed anchors reinforcing the fissured rock mass. In summary, the internal monitoring values of the samples, as well as the deformation and stress of the anchors can be easily obtained using FEM; however, the microscopic changes inside the rock mass are difficult to capture.
DEM can better capture some microscopic information inside the sample during the load damage process compared to FEM, and simulate the microcracks sprouting and expanding in the sample. Among them, many researchers have used bonded particles (BPs) in DEM to simulate anchors and rock masses [23]. Wu et al. [24] used three-dimensional particle flow code (PFC3D) to investigate the effect of different anchorage angles on crack extensions from a microscopic point of view, and used BPs in PFC to simulate both the rock body and the anchor system. Chen [25] conducted a series of numerical simulations using PFC3D to explore the mechanical impacts of anchoring on cracked rock. In these simulations, the rock mass was represented by the bonded particle model (BP) within PFC, while the prestressed anchor system was modeled using the Clump method.
It is not difficult to find that the internal monitoring values of the samples, as well as the deformation and stress of the anchors, can be easily obtained using FEM. However, the microscopic changes inside the rock mass are difficult to be captured [26,27,28]. In contrast, DEM offers a distinct advantage over FEM in capturing microscopic details within a sample during the loading and damage process, effectively simulating the initiation and propagation of microcracks within the material [29,30,31]. However, it falls short in accurately reflecting the elastic-plastic behavior of continuous media, such as the response of anchor rods to stress [25]. Therefore, many researchers have combined the advantages of these two methods by coupling FEM-DEM to provide a solution to the above mentioned problems. Luo et al. [32] established a numerical model of anchored fissured rock mass by coupling FEM and DEM, and investigated the internal stress evolution in the sample and the stress distribution in the anchor under the anchoring action.
However, for natural rock materials with a crystalline structure, such as granite, the complexity of their internal mineral composition and structure means that using a homogeneous model to simulate granite materials has certain limitations. Currently, for the numerical modeling of granite materials, the grain-based model (GBM) has become the choice of many scholars [33,34]. Potyondy et al. [35,36] were the first to establish a GBM based on the particle flow code (PFC). The PFC-GBM is capable not only of reproducing the interactions between crystals but also of simulating the internal mechanical behavior of mineral particles. In recent years, numerous scholars have improved upon the PFC-GBM and applied it to validate various indoor tests and to analyze the related mechanisms [37,38,39].
When rock materials are subjected to external loads, localized stress concentrations can lead to the destruction and fracturing of particles and bonds within the material, culminating in macroscopic failure. However, both the theoretical analysis and traditional indoor experimental methods fall short in capturing this macroscopic process. The force chain network (FCN) model offers a valuable perspective. It represents a network of interwoven force chains within granular materials. According to granular mechanics, under external loads, particles within the granular system are pressed against each other, creating a network known as the connection network of granular materials. These contact paths constitute the force chains and the overall force chain network. This network allows for the investigation of damage and fractures within the granular particles and their bonds in the rock material.
Currently, the force chain network is widely used in geotechnical discrete element numerical simulation studies and is considered as an important source of mechanical information in the microscopic perspective of geotechnics. In 2002, Zhang et al. [40] simulated a straight shear test in geotechnics using DEM to investigate the particle morphology and force chain distribution. In 2020, Leśniewska et al. [41] used DEM to study the quasi-static behavior under active earth pressure conditions, and compared with the results of photo-elastic tests to successfully predict the overall structure of the force chain network and its characteristics. Zhang et al. [40] utilized the discrete element method (DEM) to simulate the direct shear test in soil mechanics, investigating the effects of particle shape and force chain distribution. In 2023, Wang et al. [42] investigated the evolution and distribution characteristics of the internal contact force in samples with different particle size gradations. In summary, the force chain network is a crucial indicator for elucidating the shifts in the mechanical behavior of rock materials. It serves as a vital research instrument for dissecting the deformation and rupture processes of rock materials under load from a granular perspective. Consequently, examining the mechanical response of the fractured and anchored rock mass through the lens of the force chain network is imperative.
To provide a scientific basis for the design and safety assessment of underground rock engineering, a combination of laboratory experiments and numerical simulations is employed, focusing on unanchored and anchored granite samples to capture their mechanical behavior during uniaxial compression tests. By comparing the macroscopic mechanical properties and the evolution of the force chain network, the research investigates the impact of fracture dip angles on the mechanical behavior of anchored granite samples from both macroscopic and microscopic viewpoints. It explores the evolution of the role of rock bolts in anchored granite samples containing fractures with varying dip angles, as well as the progression of the anchoring effect in granite with different fracture dips.

2. Research Methods

2.1. Uniaxial Compression Test

To ensure the tests closely reflect the actual project conditions, natural granite samples from Jining City, Shandong Province, are utilized. For the simulation of the anchor system, 8.8-grade low carbon alloy steel screws are selected, whose composition includes carbon (C), phosphorus (P), sulfur (S), and boron (B). The screws have an effective diameter of 3.88 mm, a length of 140 mm, and an elastic modulus of 121 GPa. The preparation of the granite-anchor composite samples involves several steps: initially, waterjet technology is employed to drill holes with a 6 mm diameter into the granite samples. The screws are then inserted into these holes, and a syringe is used to inject an anchoring filler. The filler is the anchoring agent, that fills the gap between the screw and the inner wall of the hole, ensuring the anchor adheres firmly to the hole. After allowing the anchors to cure for 1–2 days, shims, trays, and nuts are installed to complete the assembly. Figure 1 illustrates the schematic diagram of the final granite-anchor sample.
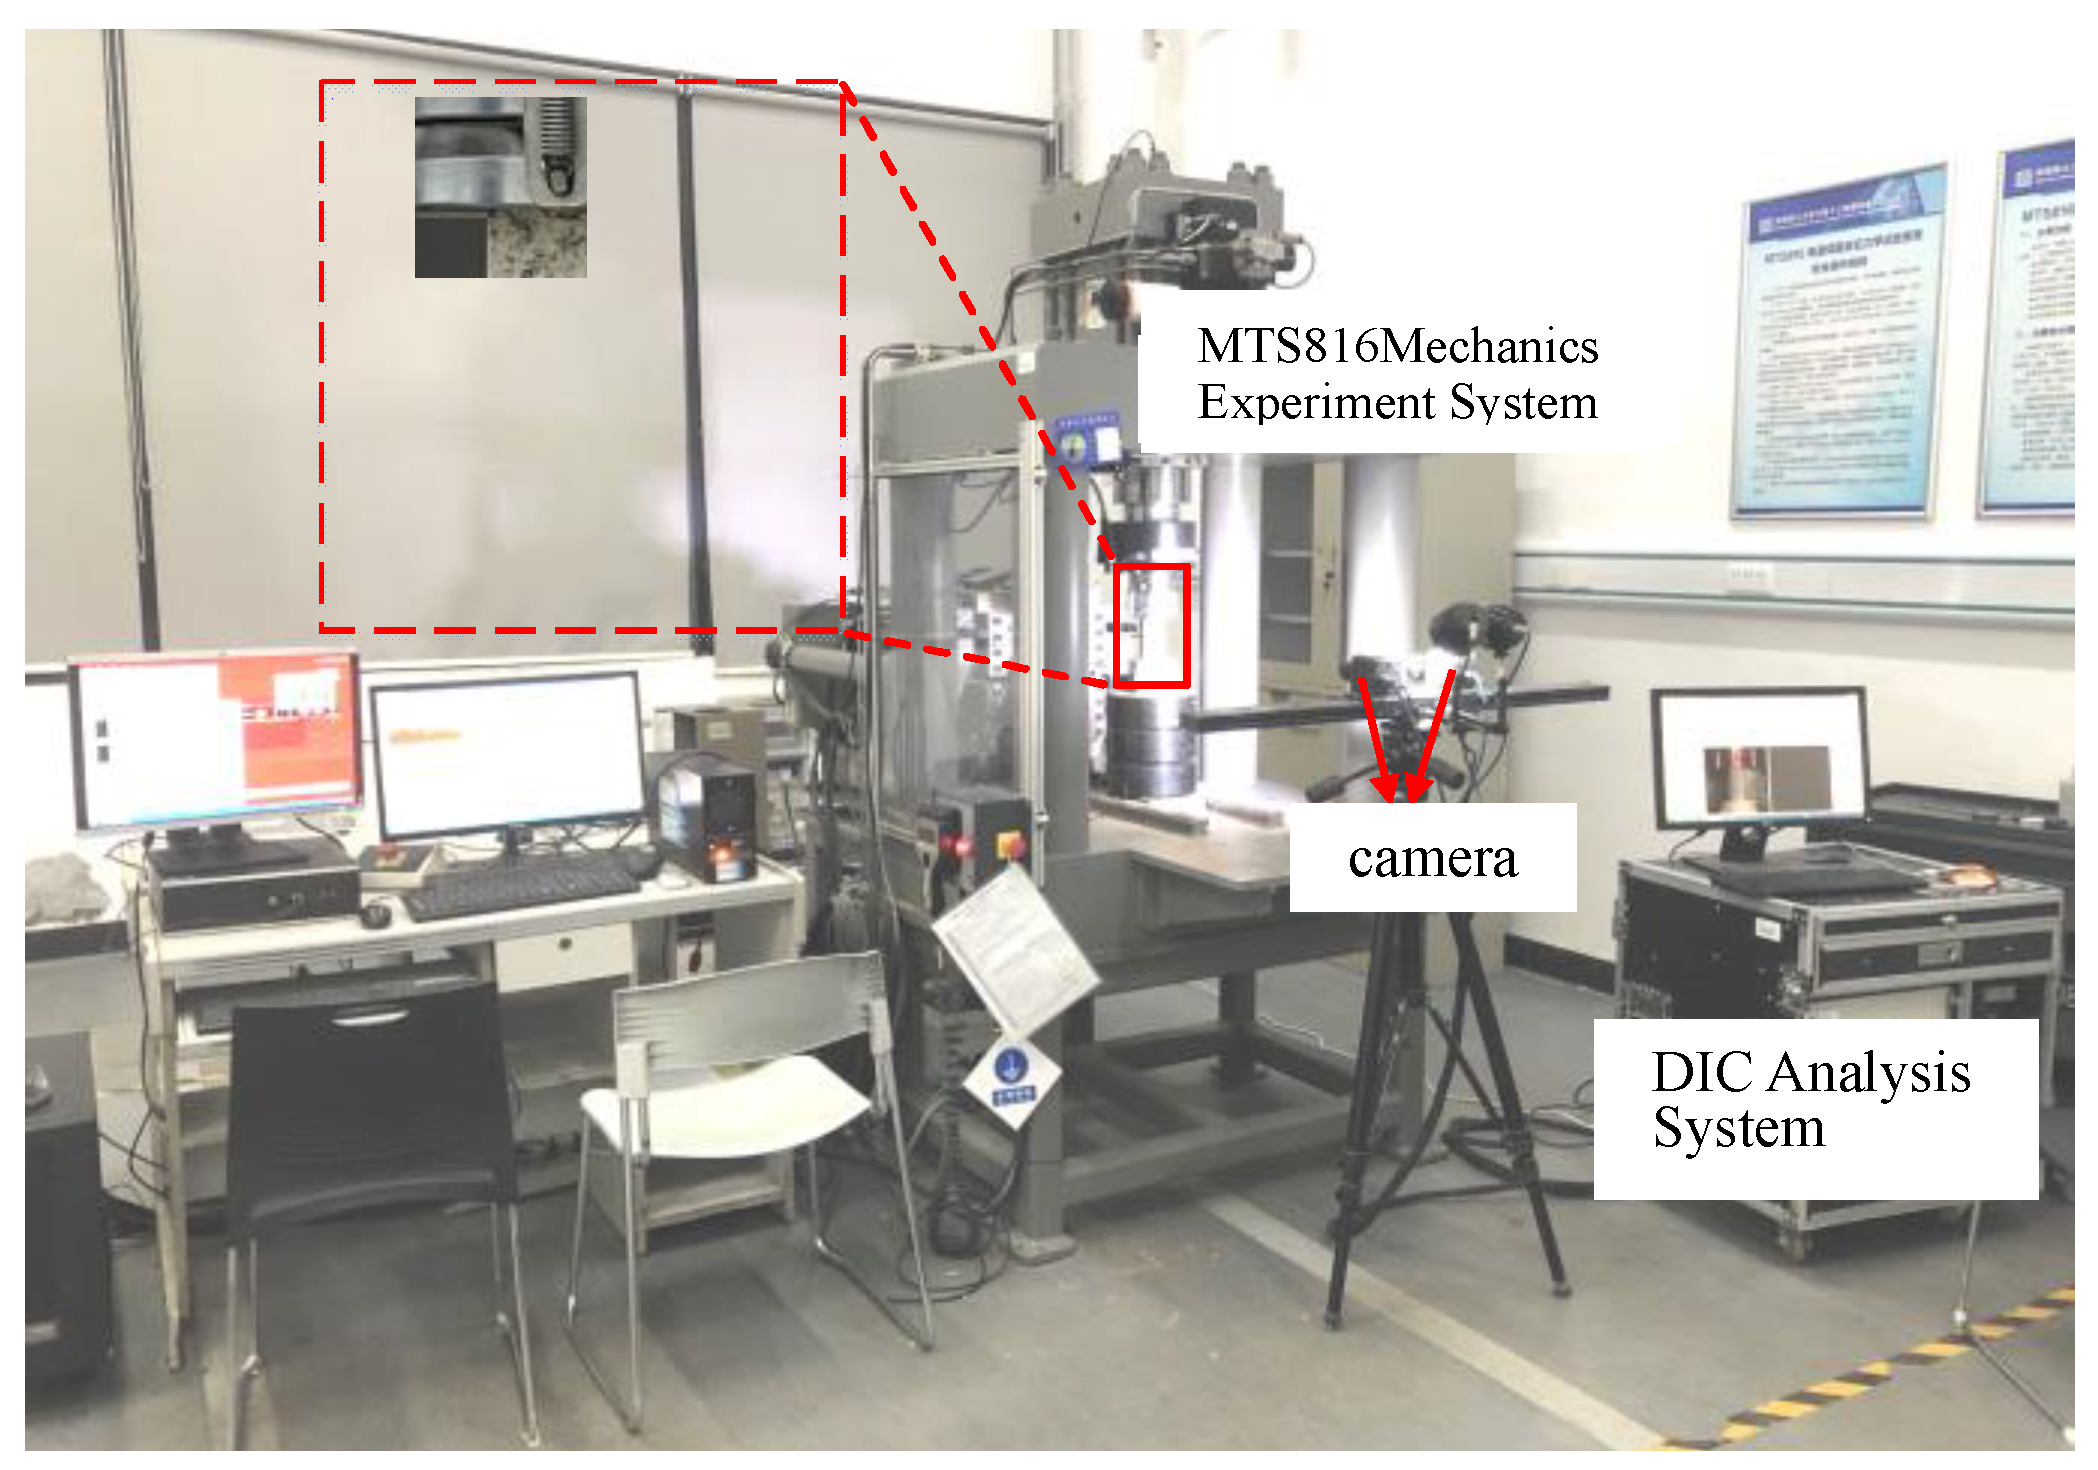
Considering the stress state of the granite samples and facilitating the recording of the deformation and rupture process of the samples, the MTS816 electro-hydraulic servo rock tester (MTS Systems Corporation, Eden Prairie, MN, USA) was used in this test. The maximum axial compression force of MTS816 is 1459 kN, which is used for uniaxial compression experiments on the granite samples, as shown in Figure 2. The test process was loaded by axial displacement control, with a displacement loading rate of 1.5 × 10⁻³ mm/s and a preset compression contact force of 1.0 kN.
The monitoring tools used in this study were digital image correlation (DIC), computerized tomography (CT), and polarized light microscopy.

2.2. Construction of Continuous-Discrete Coupled Numerical Models

To incorporate the effects of non-homogeneity, mineral composition, and microstructure on the fracture behavior of granite, in this section, the development of a 3D numerical model is presented. This model is constructed using the three-dimensional equivalent mineral crystal model (3D-GBM) in particle flow code 3D (PFC3D). PFC3D 6.0 software is a powerful particle analysis program that simulates the dynamic motion and interaction of aggregates composed of disks or spherical particles of any size. The detailed procedure is depicted in Figure 3.
To advance the construction of the numerical model incorporating granite and anchor samples, it is imperative to identify an appropriate method for simulating the anchor system. Utilizing the finite element method (FEM) for simulation can more accurately capture the elastic–plastic mechanical behavior of the anchor during the stress process while significantly reducing computational expenses. Consequently, in this study, a continuous-discrete coupling method was employed to develop the numerical model for the granite-anchor composite sample.

2.3. Quantitative Analysis and Representation of Force Chain Network

The force chain network is a model formed by the interweaving of force chain structures within granular materials. According to particle material mechanics, particles in a granular system are squeezed together under external loads to form a network. This network, known as the connection network between particle materials, consists of contact paths that form force chains and force chain networks. Consequently, the failure and fracture of particles and bonds within rock materials can be explored through the analysis of force chain networks.
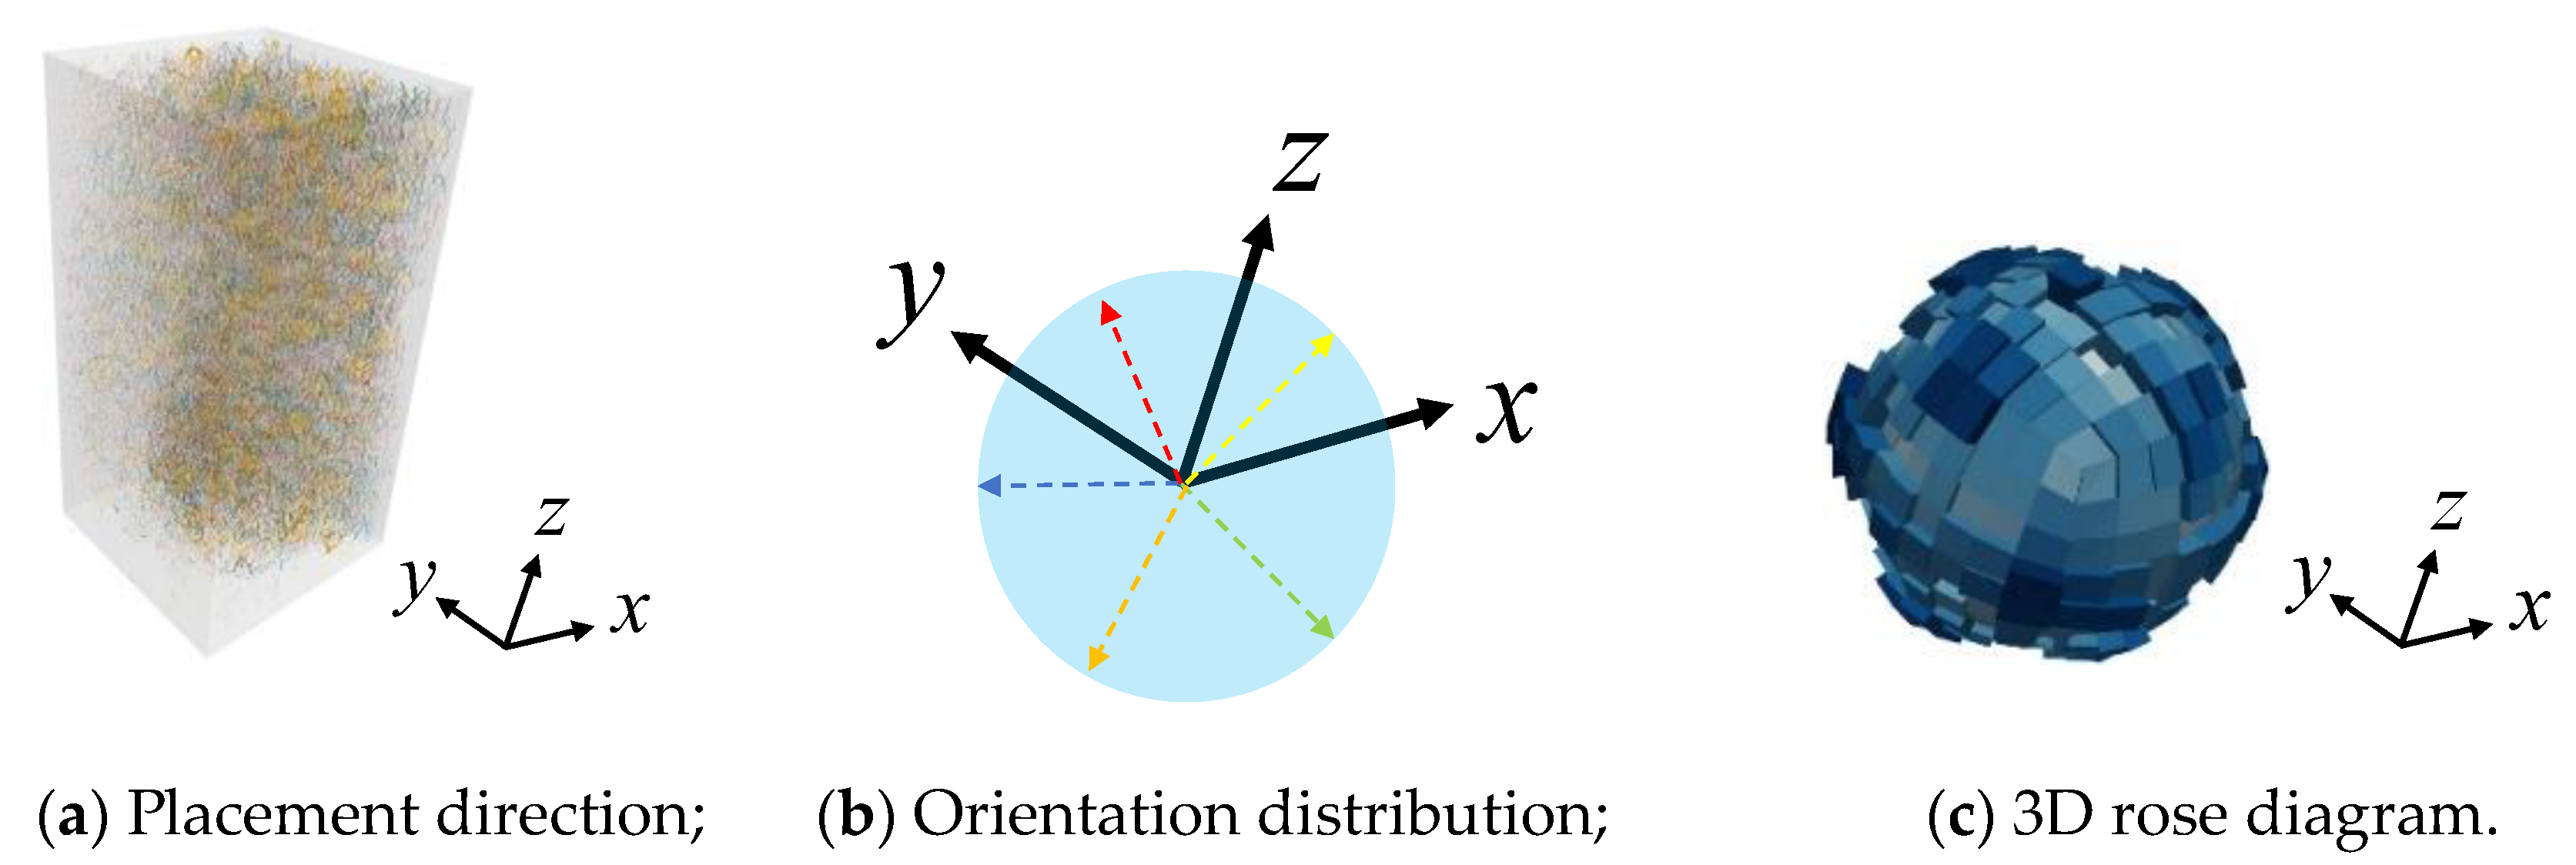
The built-in program of the PFC3D software can extract the values of the unit vectors of the internal force chain of the specimen in the x, y, and z directions in 3D space during the loading process. The center of the rose diagram is the coordinate origin, and the direction of the coordinate axis is consistent with the direction of the specimen placement, as shown in Figure 4. The 3D rose diagrams, also known as 3D group configuration diagrams, are widely used to show the distribution of force chains in 3D space [43,44]. The tendency in the rose diagram is the tendency of the force chain, and the height and color of individual columns can illustrate the number of force chains distributed on this tendency.

2.4. Effectiveness Verification of Numerical Model

From a microscopic perspective, the mechanical properties of the rock are primarily determined by the mineral grains themselves and the extent of their cementation. The extensive research by predecessors has demonstrated that the parallel bond model (PBM) within PFC3D is the most appropriate simulation method for capturing the mechanical behavior of rocks, offering superior simulation capabilities compared to other methods. Consequently, the numerical simulation of natural granite rock materials presented in this paper will be grounded in the PBM framework. Furthermore, in this paper, the trial-and-error method is employed for calibrating the microscopic parameters of the numerical model. This approach has garnered widespread acceptance and recognition among scholars due to its proven effectiveness and reliability in various applications [44,45,46].
Through an iterative process of refining the micro-parameters and meticulously comparing the outcomes of the calibrated numerical simulations with those of the indoor tests, the set of micro-parameters that align closely with the experimental data is identified as the definitive configuration. The specific micro-parameters of the finalized numerical simulation samples, which correspond to the indoor test results, are presented in Table 1.
Subsequently, aligning with the dimensions and positions of the anchor holes in the indoor tests, the particles at corresponding locations within the 3D GBM model were selectively removed. The anchor system was then integrated into the model at the post-removal locations. The numerical simulation introduces a finite element-based anchor with isotropic elastic properties, mirroring the characteristics of actual anchors. The model anchor is defined with a density of 7850 kg/m3, a Young’s modulus of 9.7 GPa, and a Poisson’s ratio of 0.3. The interaction between the anchors and the granite rock mass is governed by a parallel bond contact model, with detailed fine-grained parameters provided in Table 2.
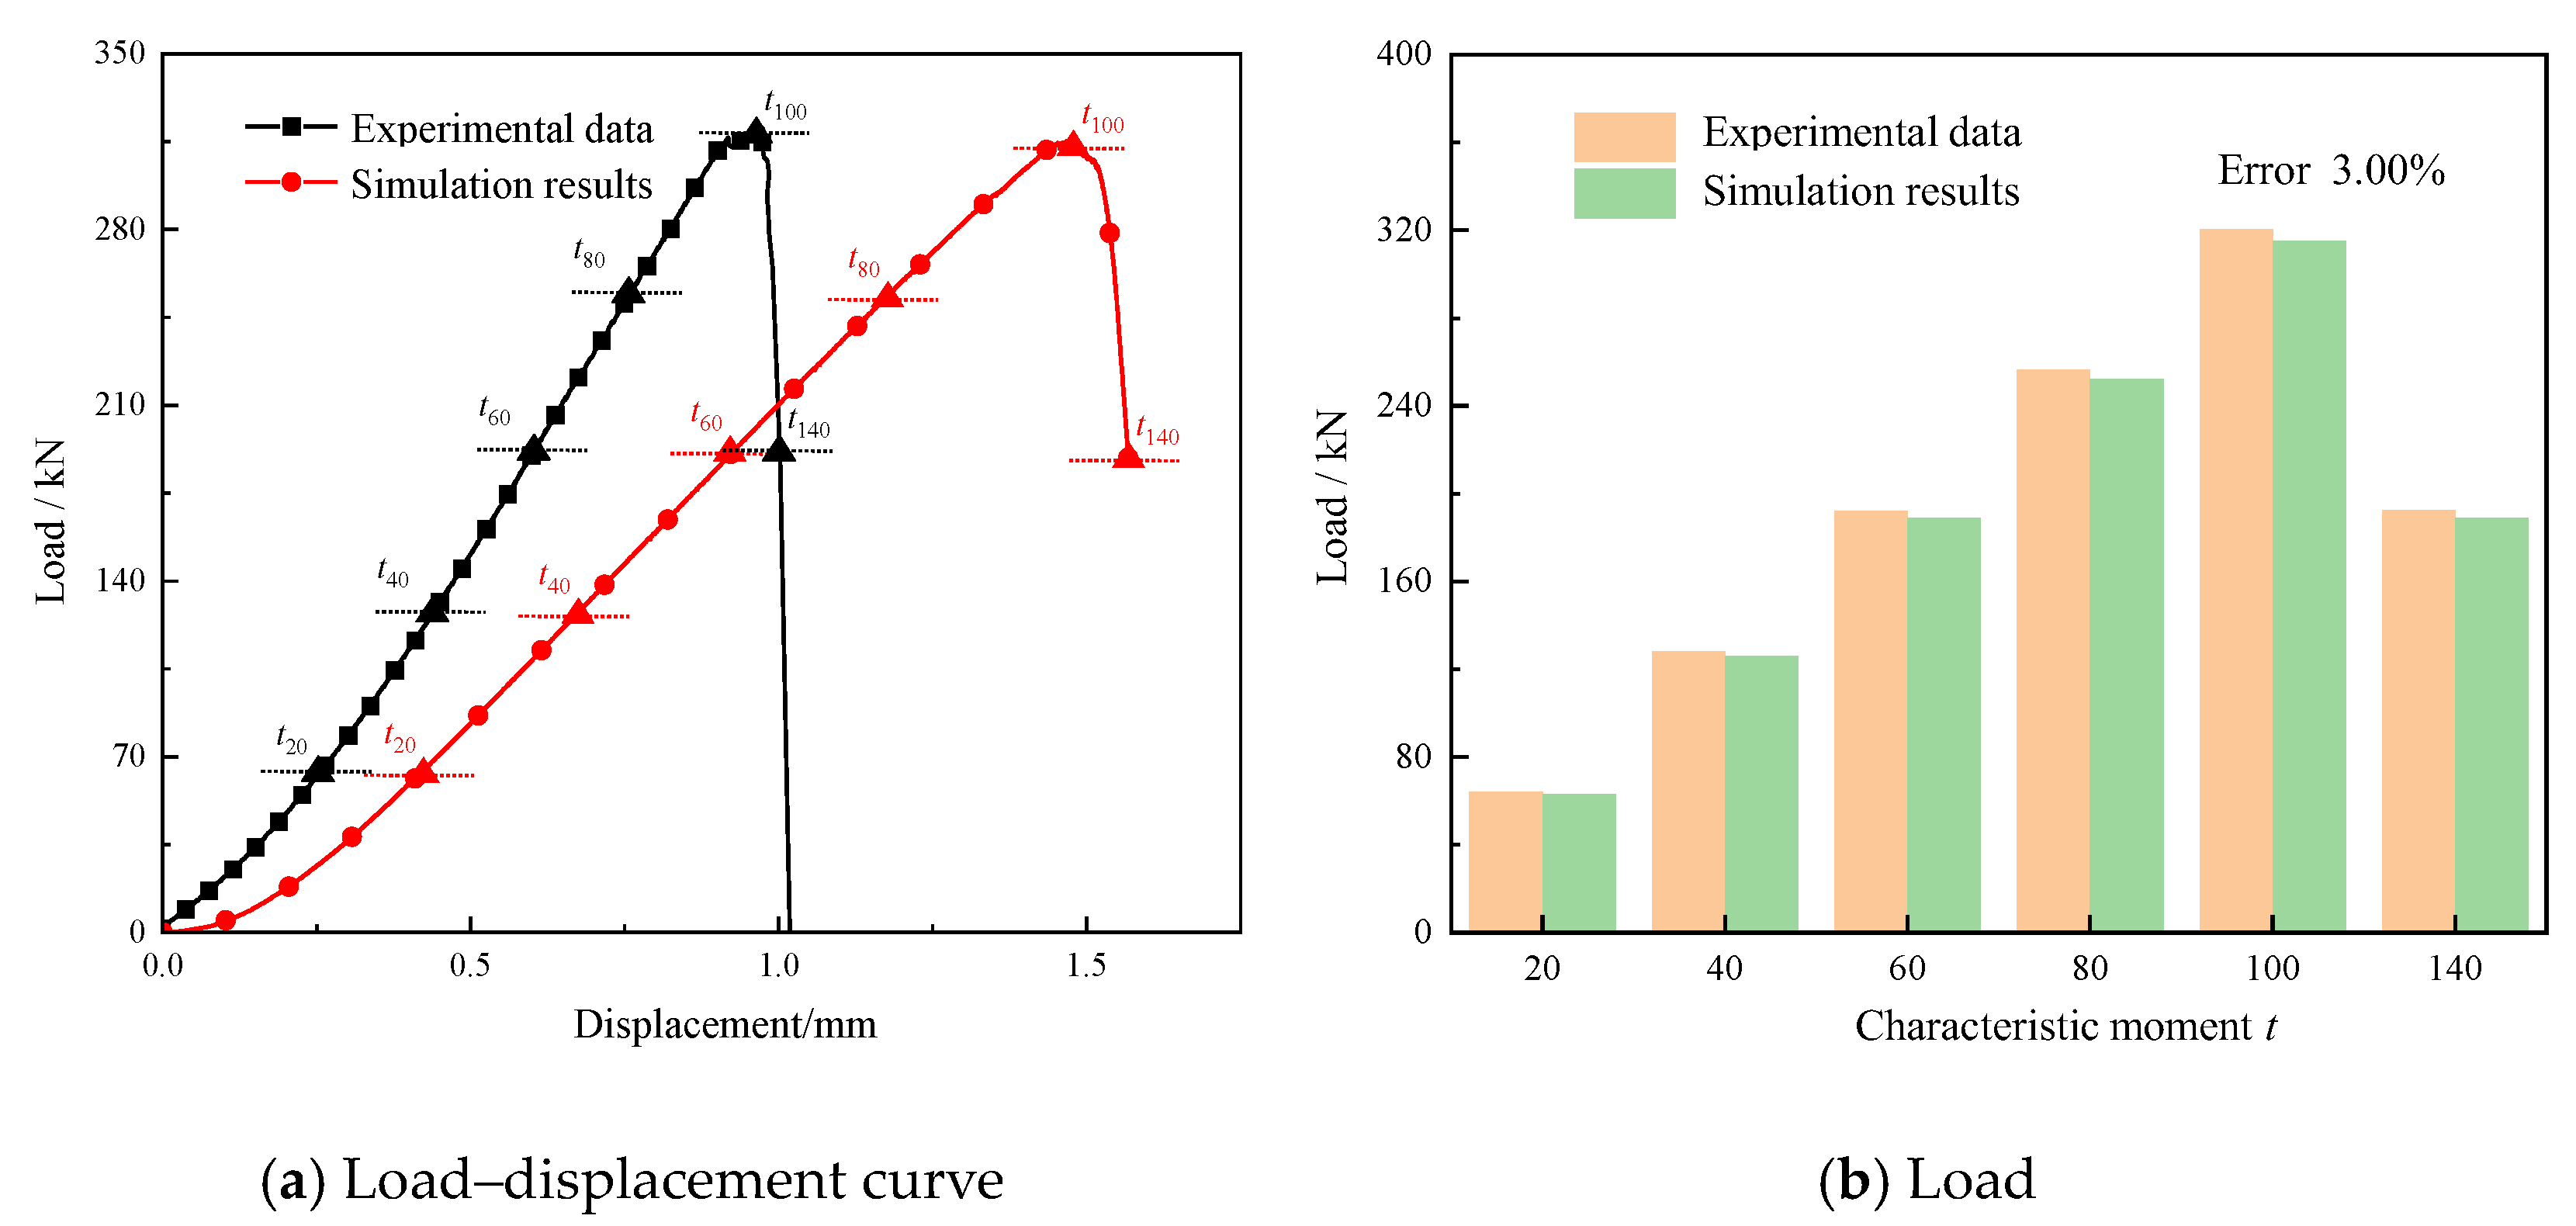
By comparing and analyzing the uniaxial compression test results of the sample under laboratory testing and numerical simulation, the effectiveness of the micro-parameter calibration of the numerical model is verified. Figure 5a shows a comparison of the load–displacement curves from the uniaxial compression tests. The comparison indicates a strong consistency between the load–displacement results of the laboratory tests and the numerical simulations, demonstrating the reliability of the numerical model’s micro-parameter calibration.
In order to investigate the fracture process of the specimen in depth, in this study, the following six characteristic moments were selected during the loading process: the peak load moments of 20%, 40%, 60%, 80%, and 100% before the peak, and the peak load moments of 40% after the peak. These moments are denoted as t20, t40, t60, t80, t100, and t140, respectively. The load values at these six characteristic moments are extracted for comparison, as shown in Figure 5b. The figure demonstrates that the load levels of the experimental and simulation results are almost identical at the same characteristic time. Specifically, at peak load time t100, the load values for the experimental and simulation results are 320.55 kN and 315.12 kN, respectively, with an error of only 3.00%.

3. Macroscopic Mechanical Properties

3.1. Mechanical Parameters

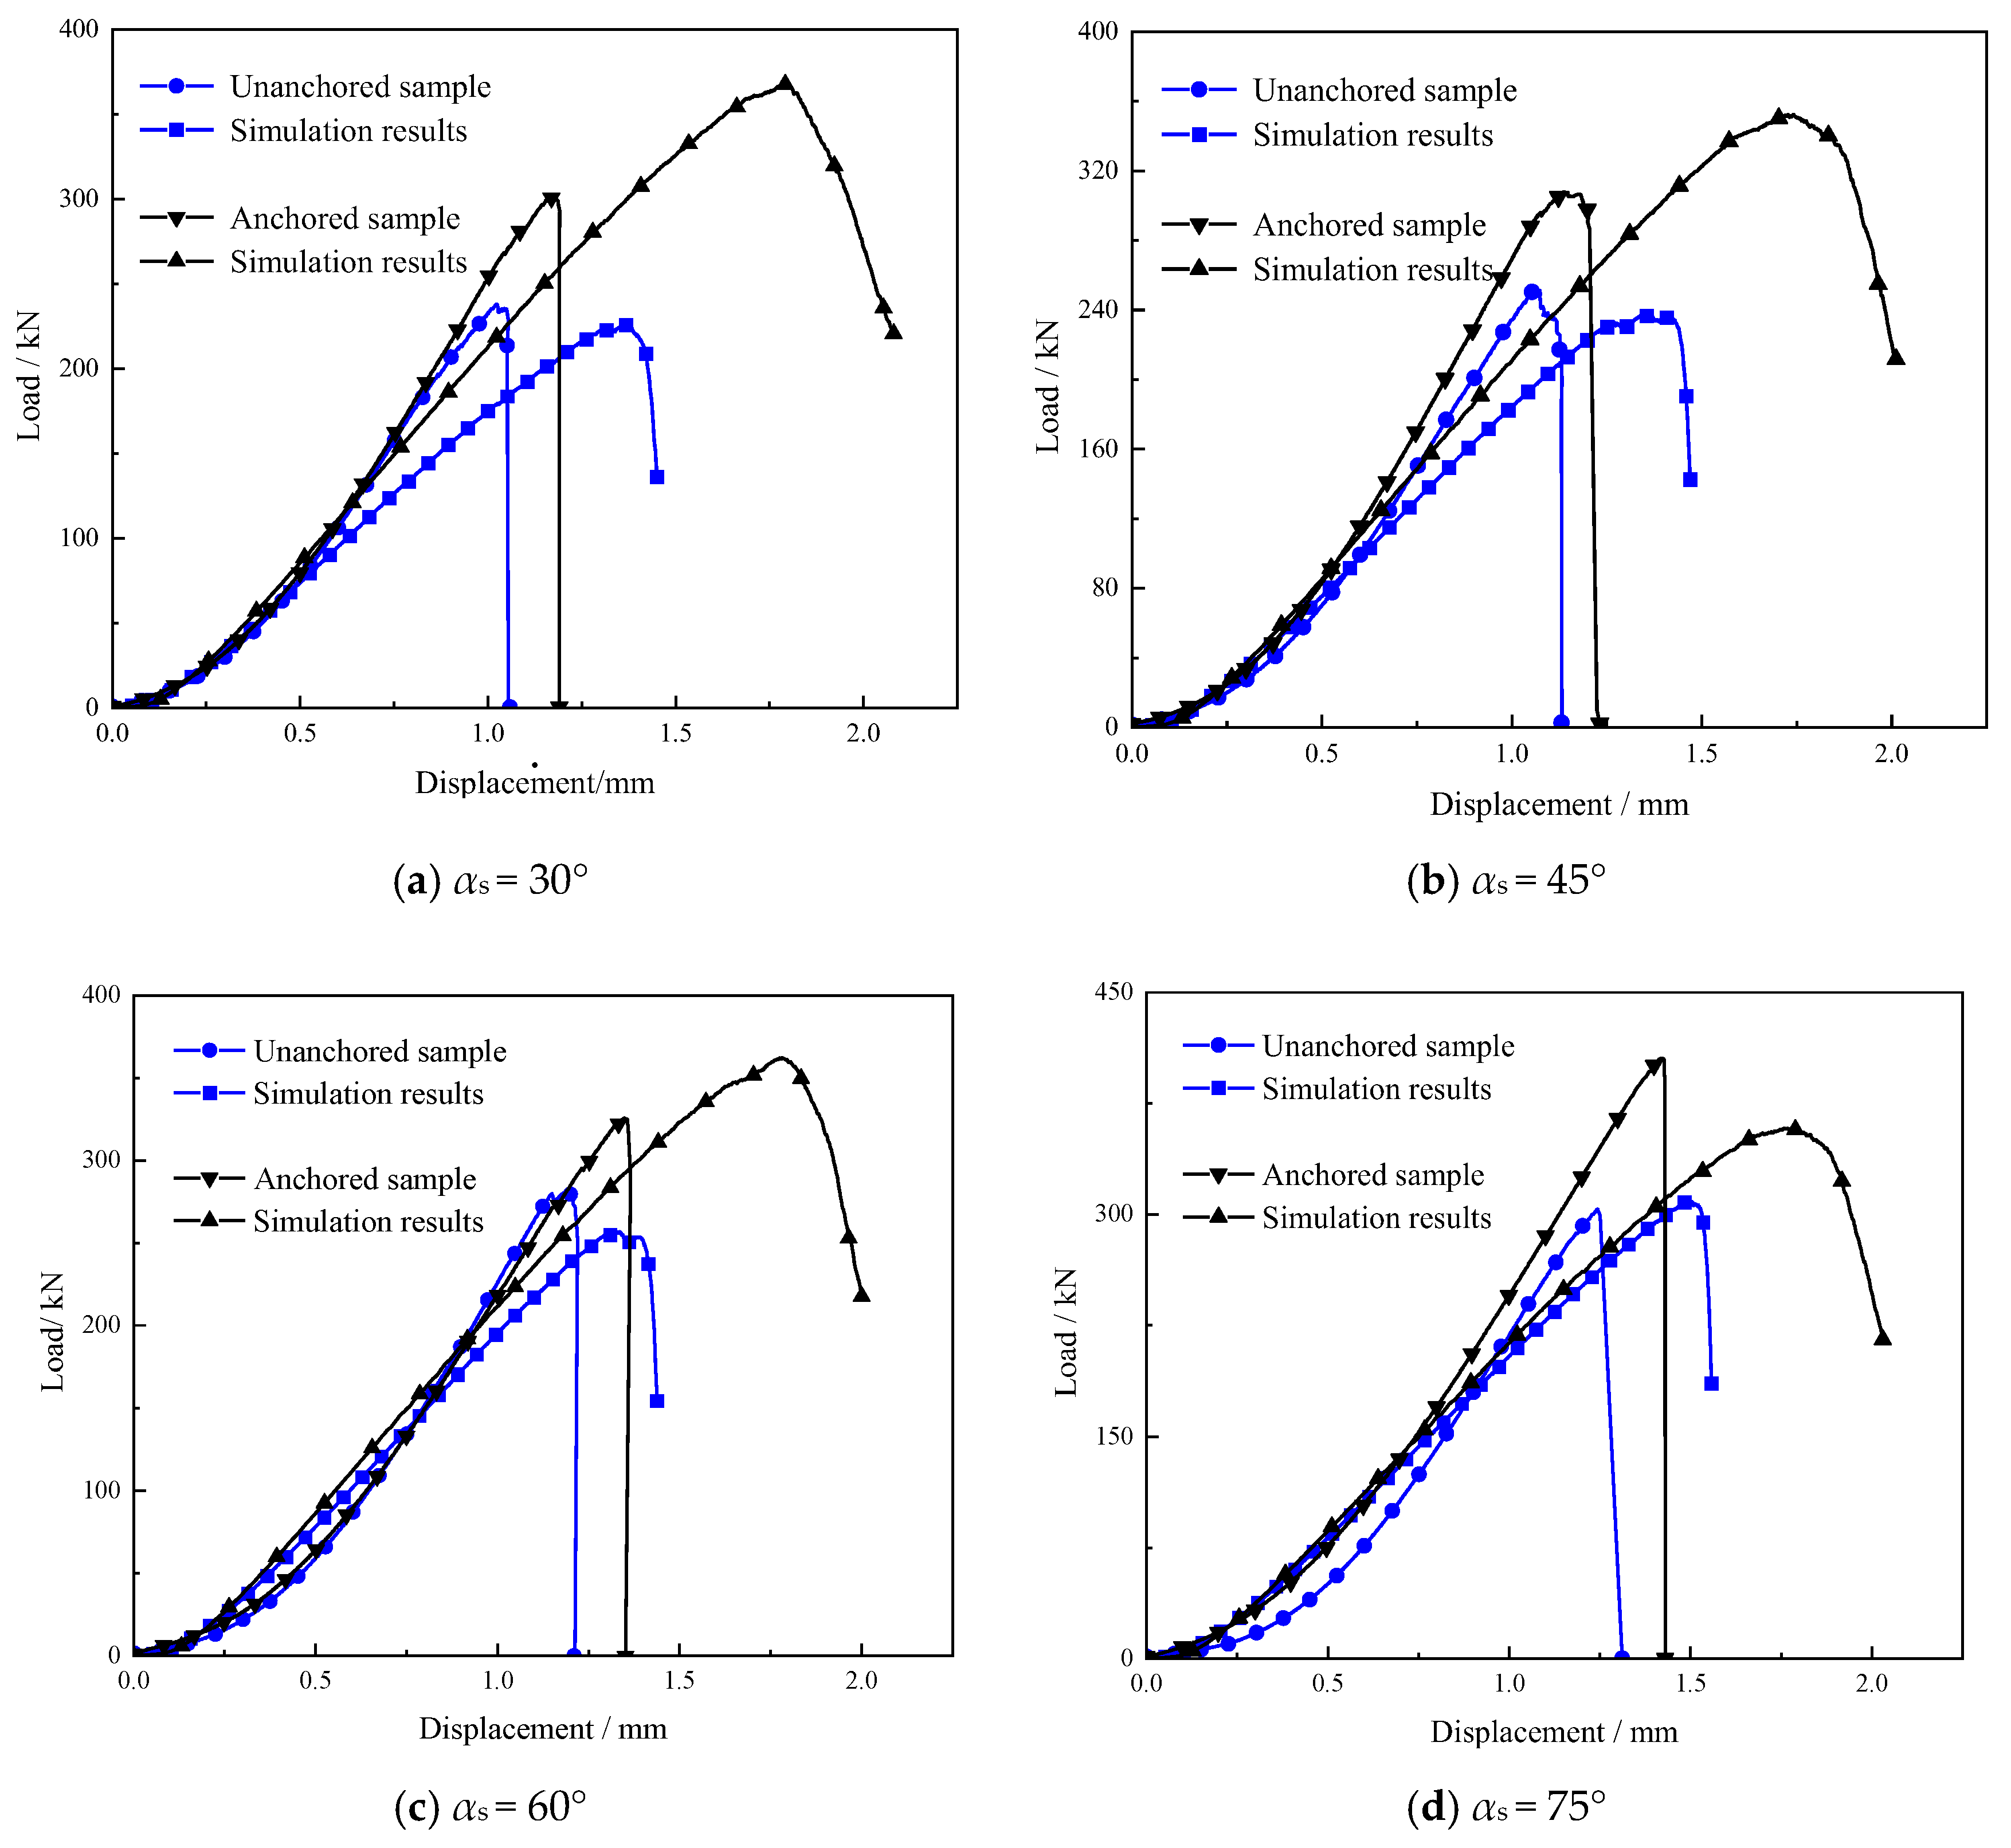
Figure 6 shows the load–displacement curves of the unanchored and anchored samples of granite with four different inclination fissures containing αs = 30°, 45°, 60°, and 75°. Among them, the blue curves are the load–displacement curves of each inclined fissure sample under the unanchored condition, while the black color is the result of the sample under anchoring.
Through the comparison of the sample compression process, the results show a strong consistency in the trend of the load–displacement results of the indoor tests and numerical simulation samples, which further validate the numerical model. It can be clearly observed that the ground curves of the anchored samples of each inclined fissure are above the unanchored samples. The curves of each inclined fissure sample under both indoor test conditions and numerical simulation conditions mainly go through the following stages: initial compaction stage, linear elasticity growth stage, nonlinear deformation stage, and post-peak damage stage. The experimental results show that as αs increases from 30° to 75°, the peak load of the anchored sample rises from 301.07 kN to 402.12 kN, representing a 33.5% increase. As αs increases, the peak load levels of anchored samples are increased by 62.72%, 47.97%, 40.99%, and 15.58% compared to unanchored samples.

3.2. Macroscopic Rupture Models

Then, we analyzed the displacement field, rupture surface, and fragmentation field by comparing the displacement field, rupture surface, and fragmentation field of anchored samples containing different αs fissures based on indoor tests and numerical simulation conditions.
(1)
Comparison of displacement field features
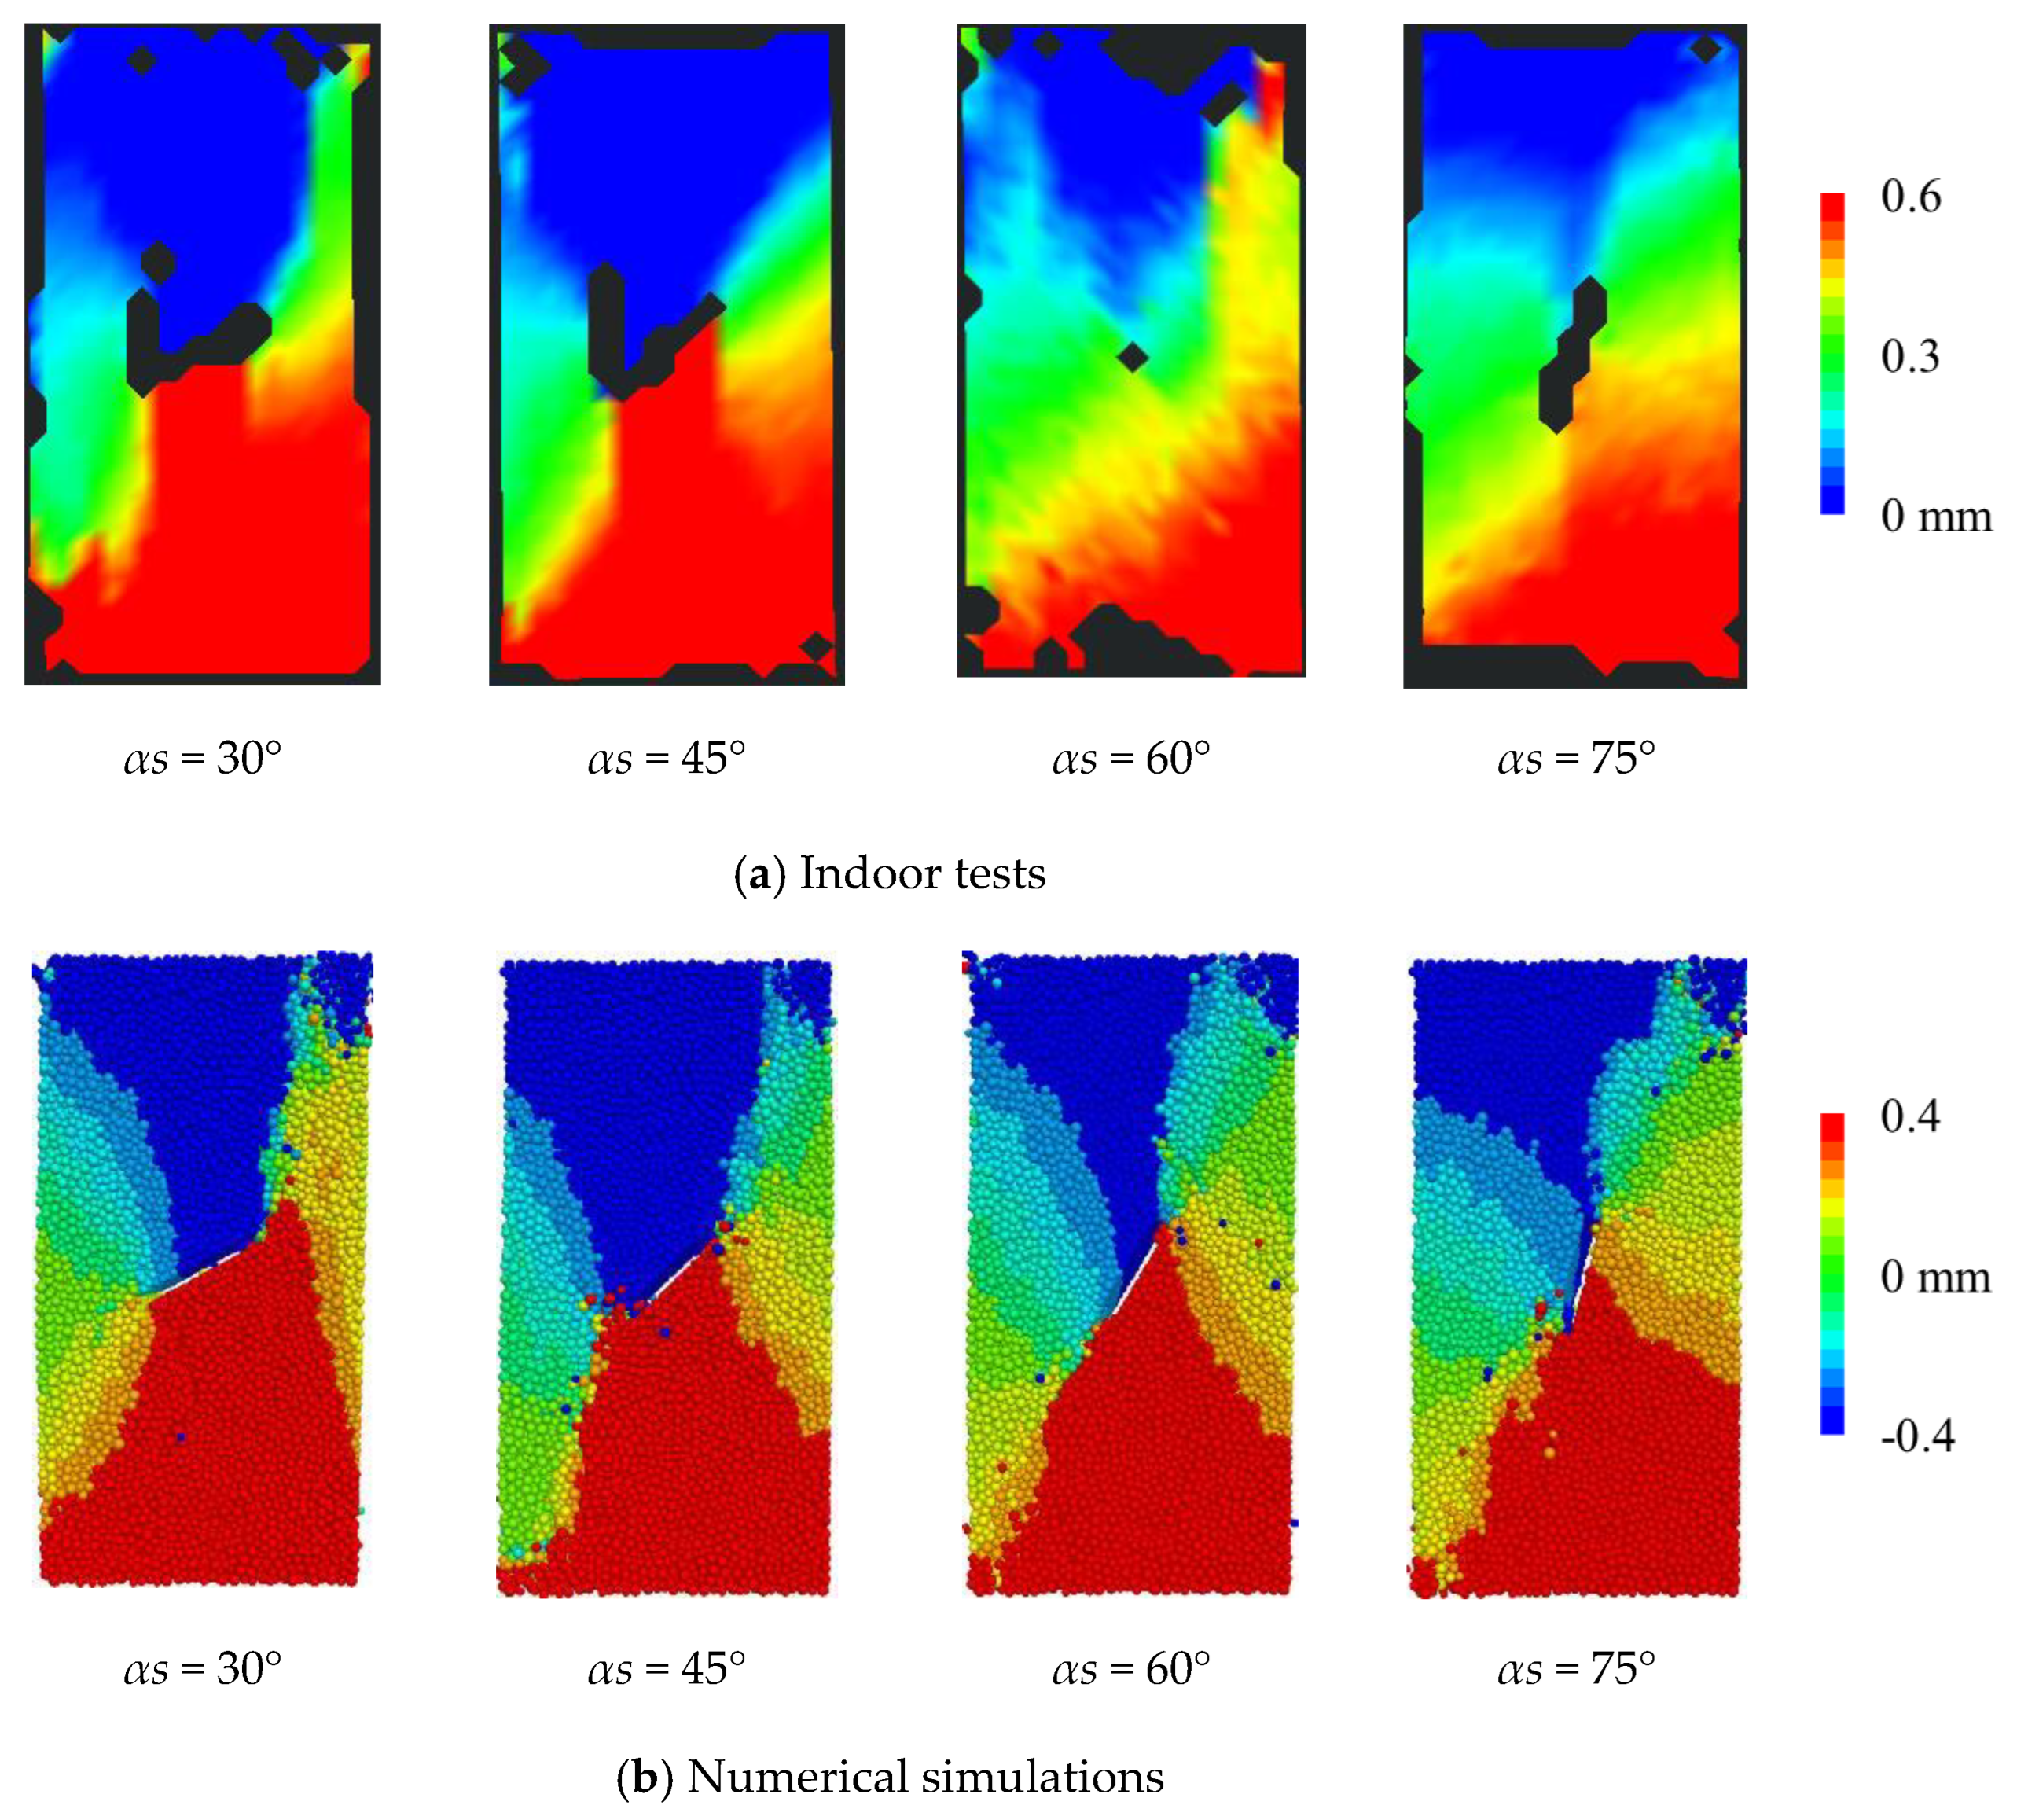
Figure 7 illustrates the displacement field results of anchored samples containing different αs fractures based on both indoor tests and numerical simulation conditions. It can be observed that the displacement field results of the test and simulated samples are highly similar. Specifically, the cleft of the sample becomes the demarcation of the displacement field for both the test and simulation results, which means that the tip region of the cleft undergoes a large displacement. The presence of cracks induces an uneven stress distribution within the sample, resulting in localized displacement and deformation. Specifically, stress concentrations form at the crack tips, which in turn, drive crack propagation in these regions. This process cumulatively leads to the overall damage of the sample.
(2)
Comparison of fragmentation fields
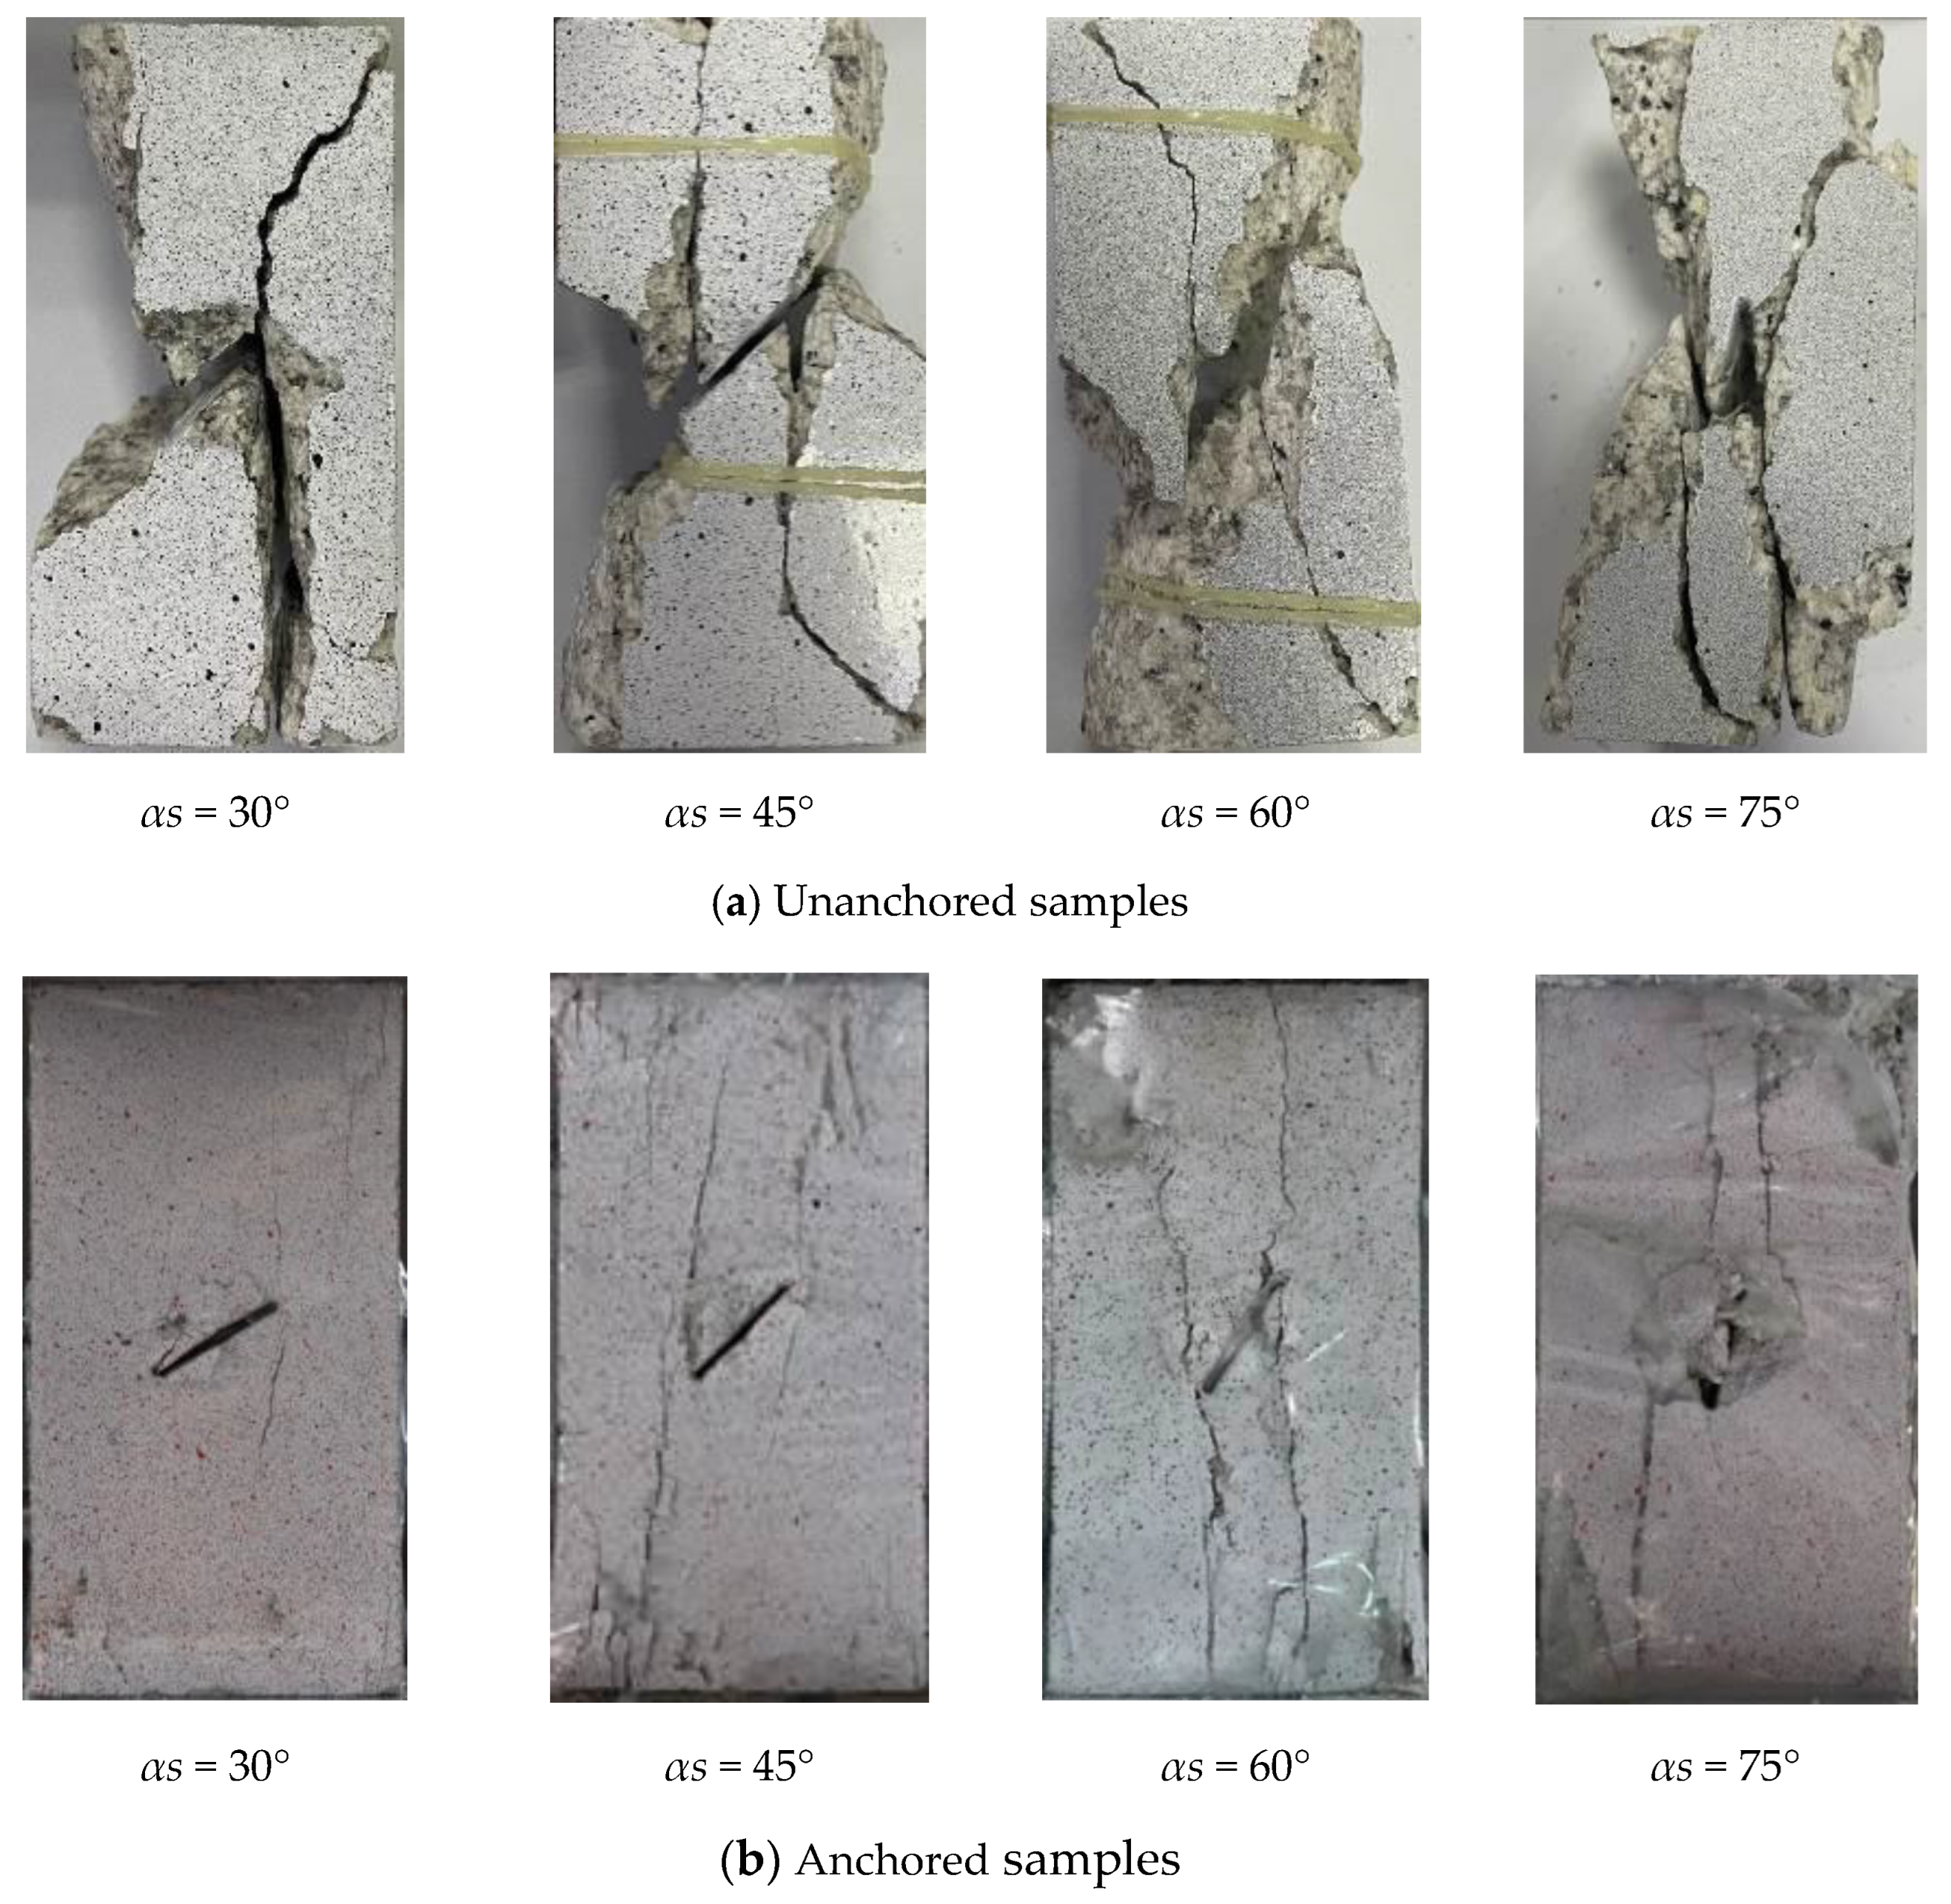
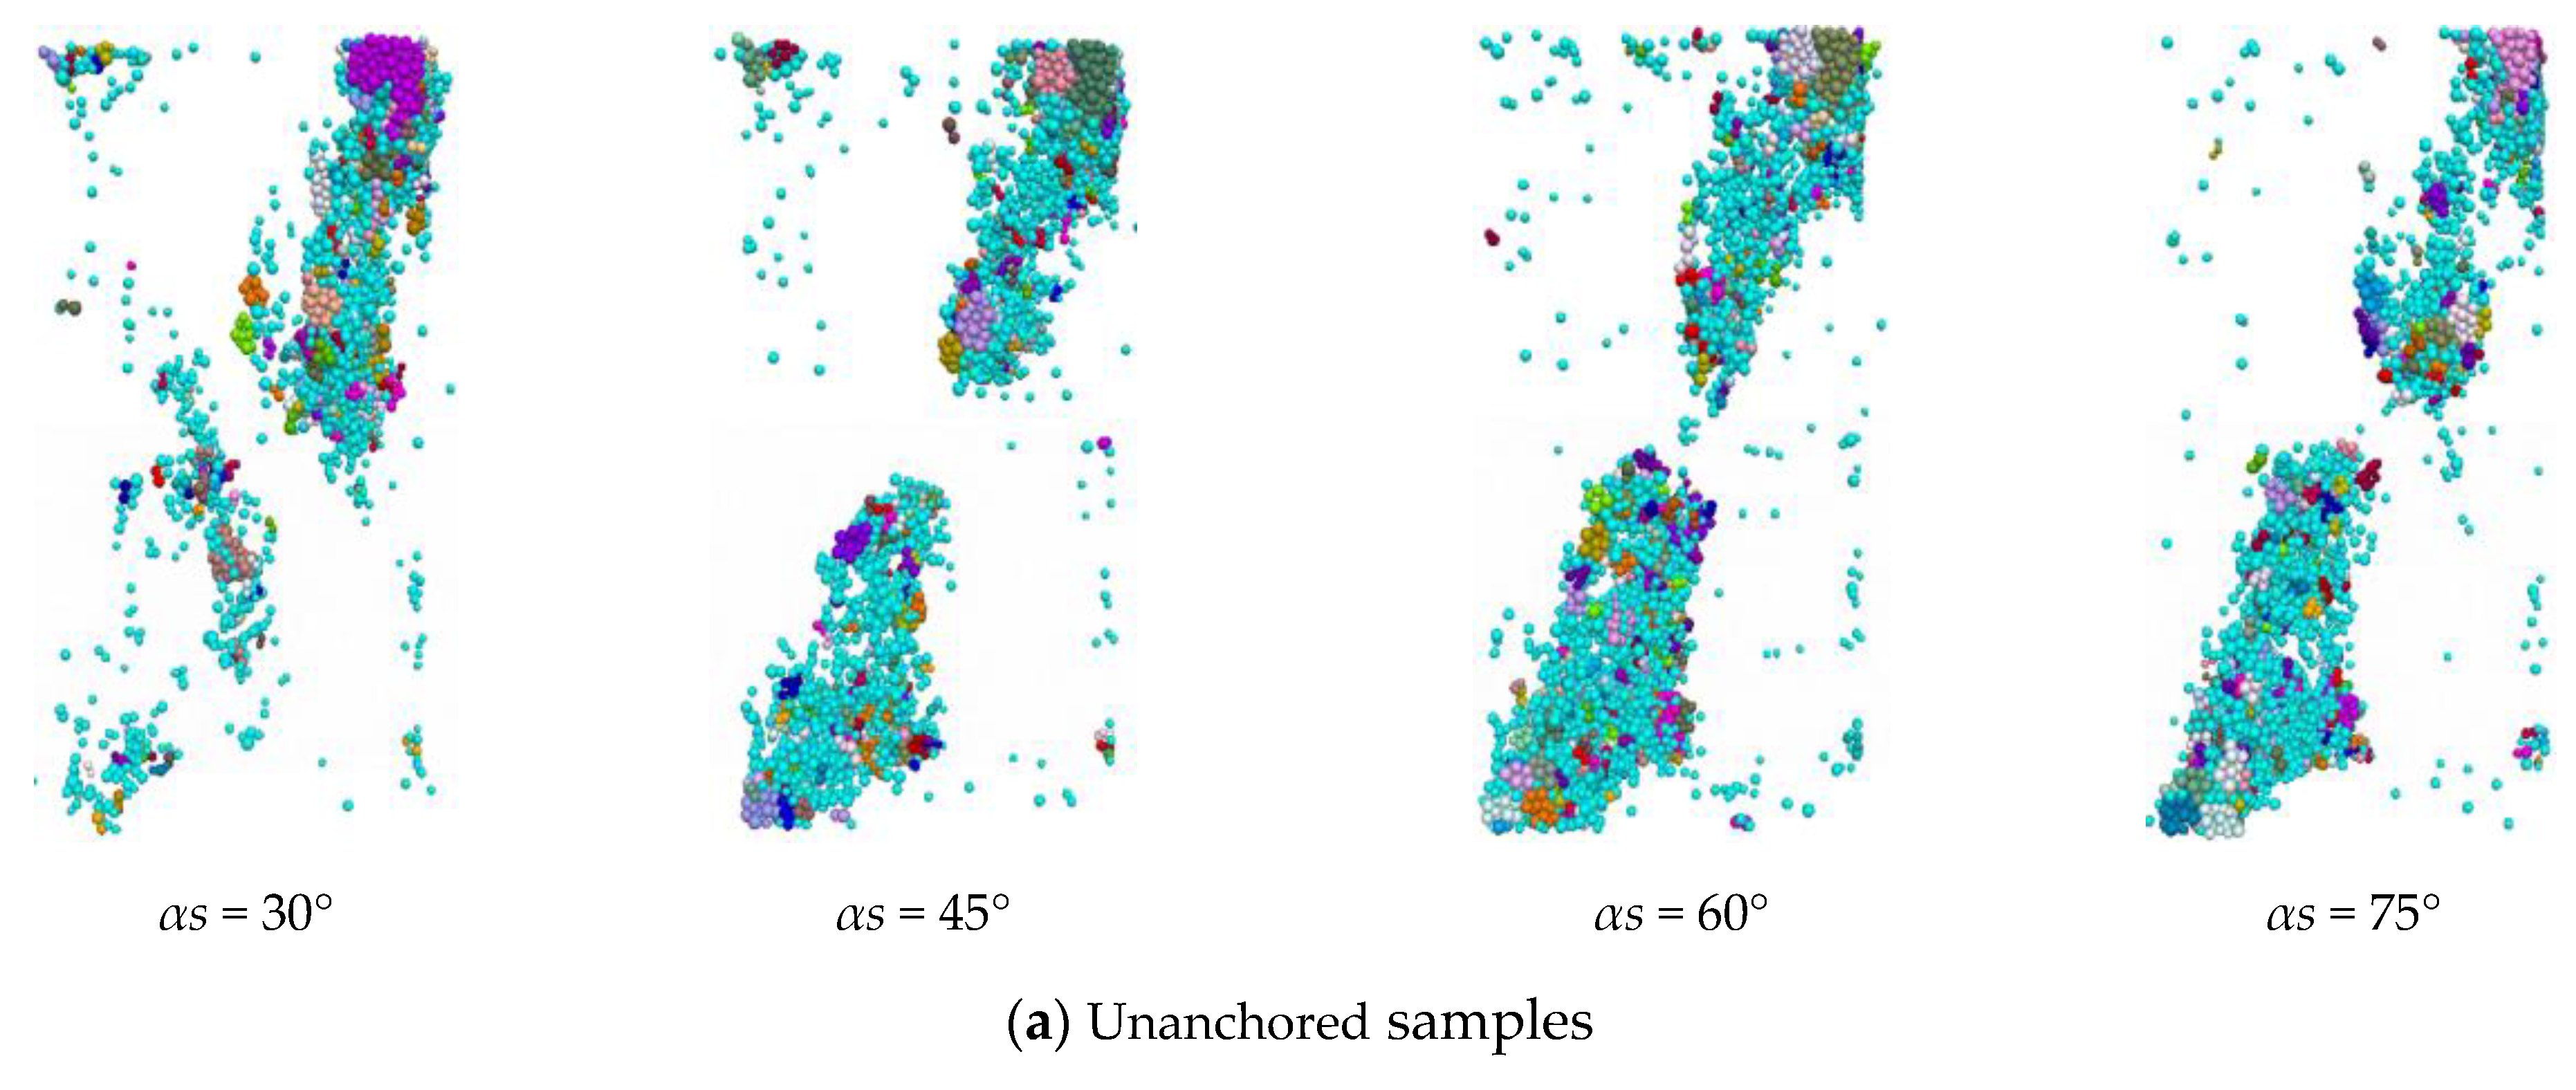
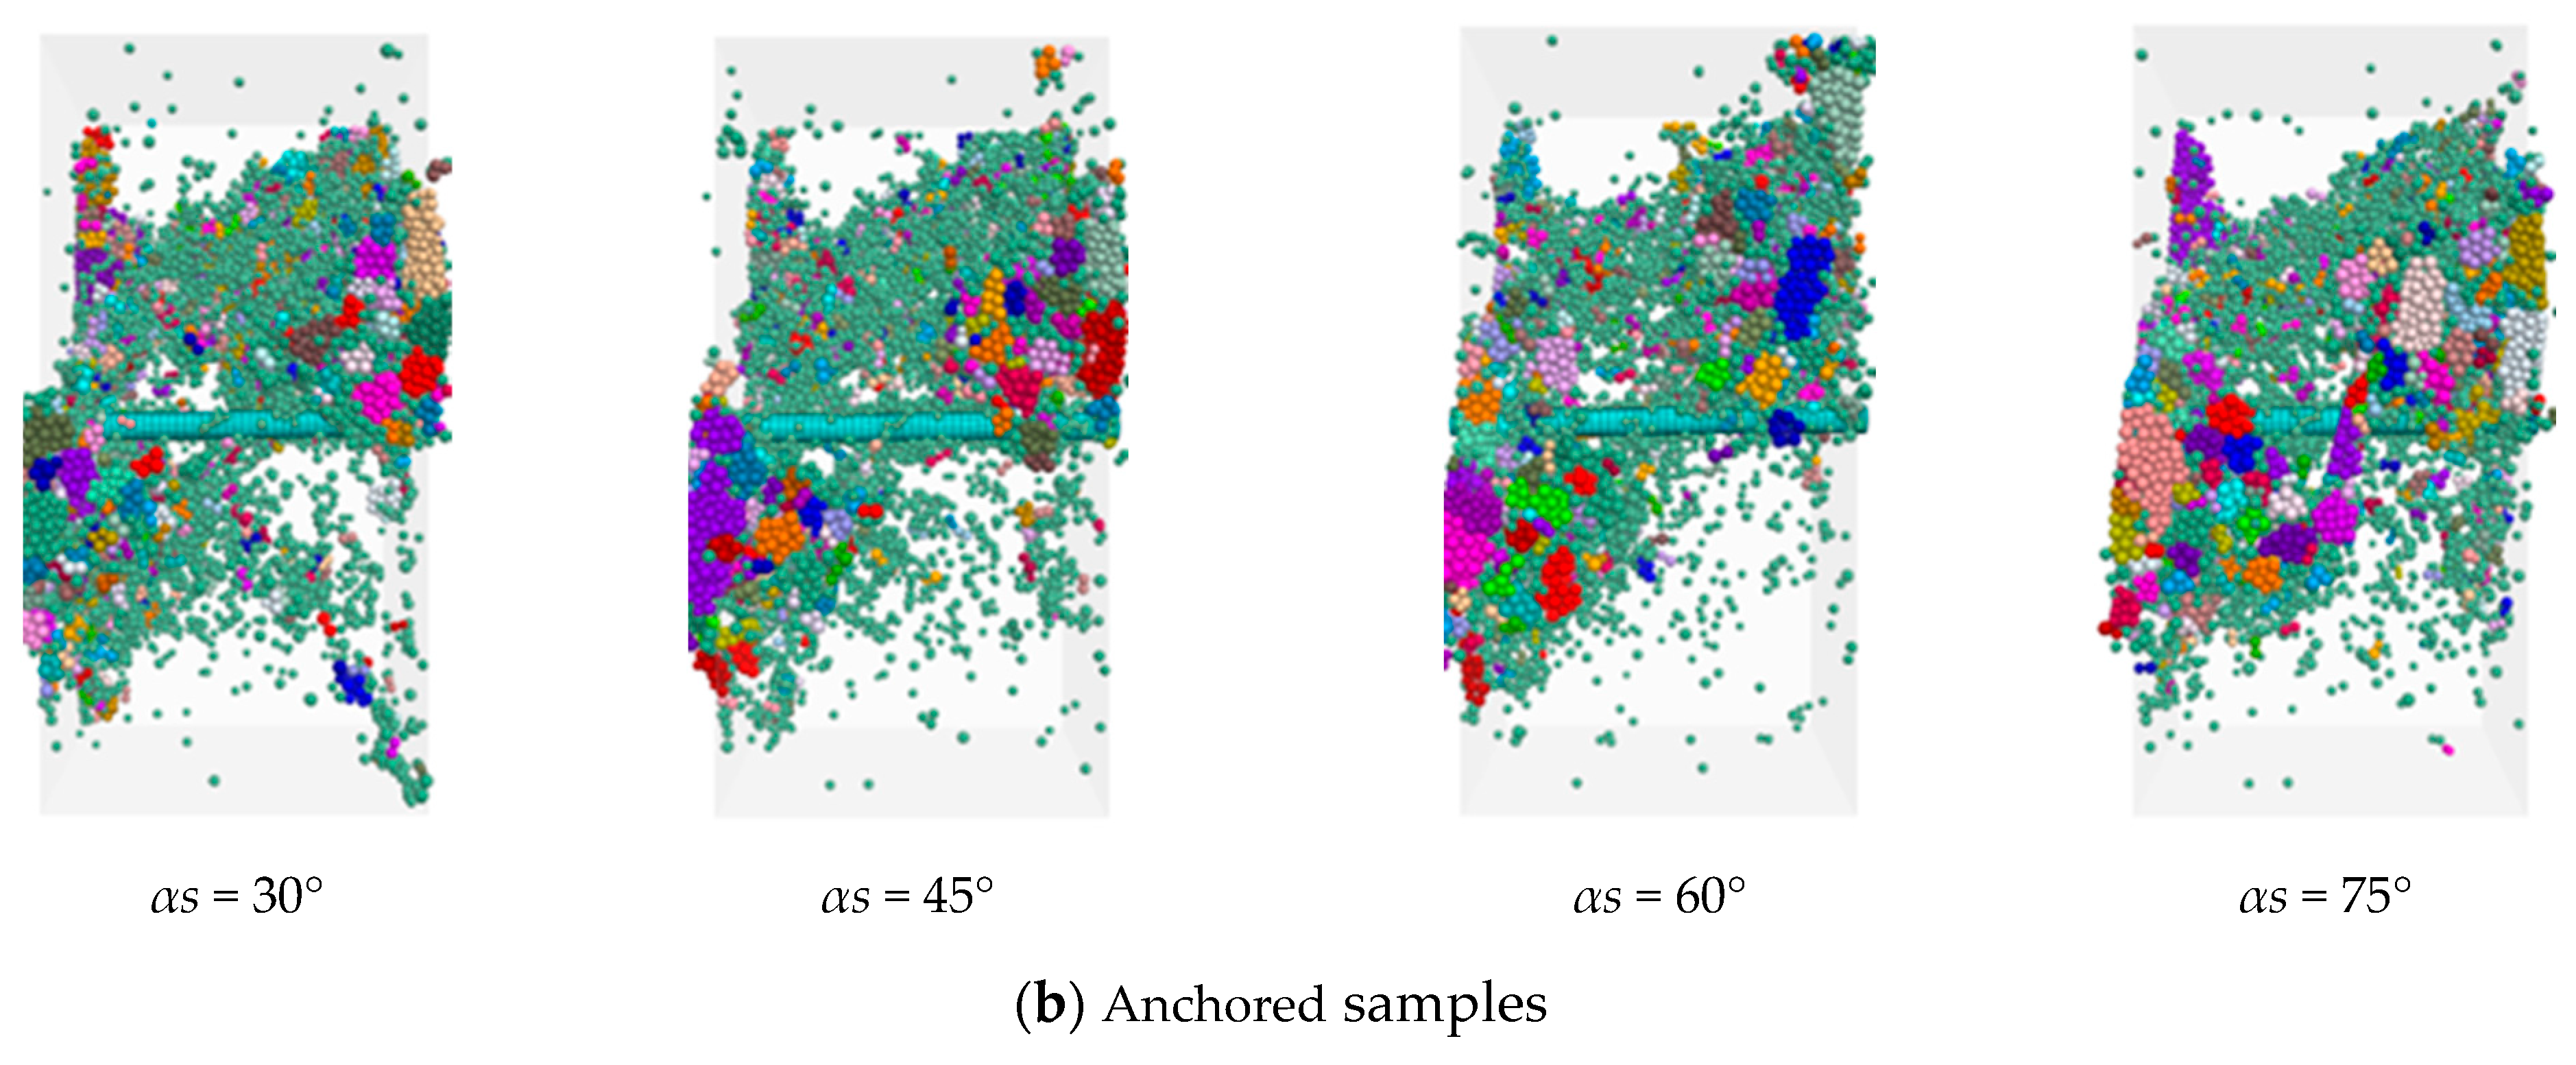
Figure 8 presents the macroscopic damage patterns of unanchored and anchored samples of the fissures containing different αs. Figure 9 presents the comparative results of the fragmentation fields of the unanchored and anchored samples under numerical simulation conditions. The results are similar to those of the simulated samples; the fragmentation field of the unanchored sample is concentrated at the tip of the fissure and distributed along the diagonal of the sample, which shows an obvious shear damage pattern. In contrast, the fragment length of the anchored sample is more uniformly distributed, which implies that the anchor structure improves the stress distribution inside the granite sample. This results in a larger and more evenly distributed stress area within the samples, thereby enhancing their load-bearing capacity.

4. Analysis of Force Chain Network Characteristics in Anchored Granite with Different Fissure Angles

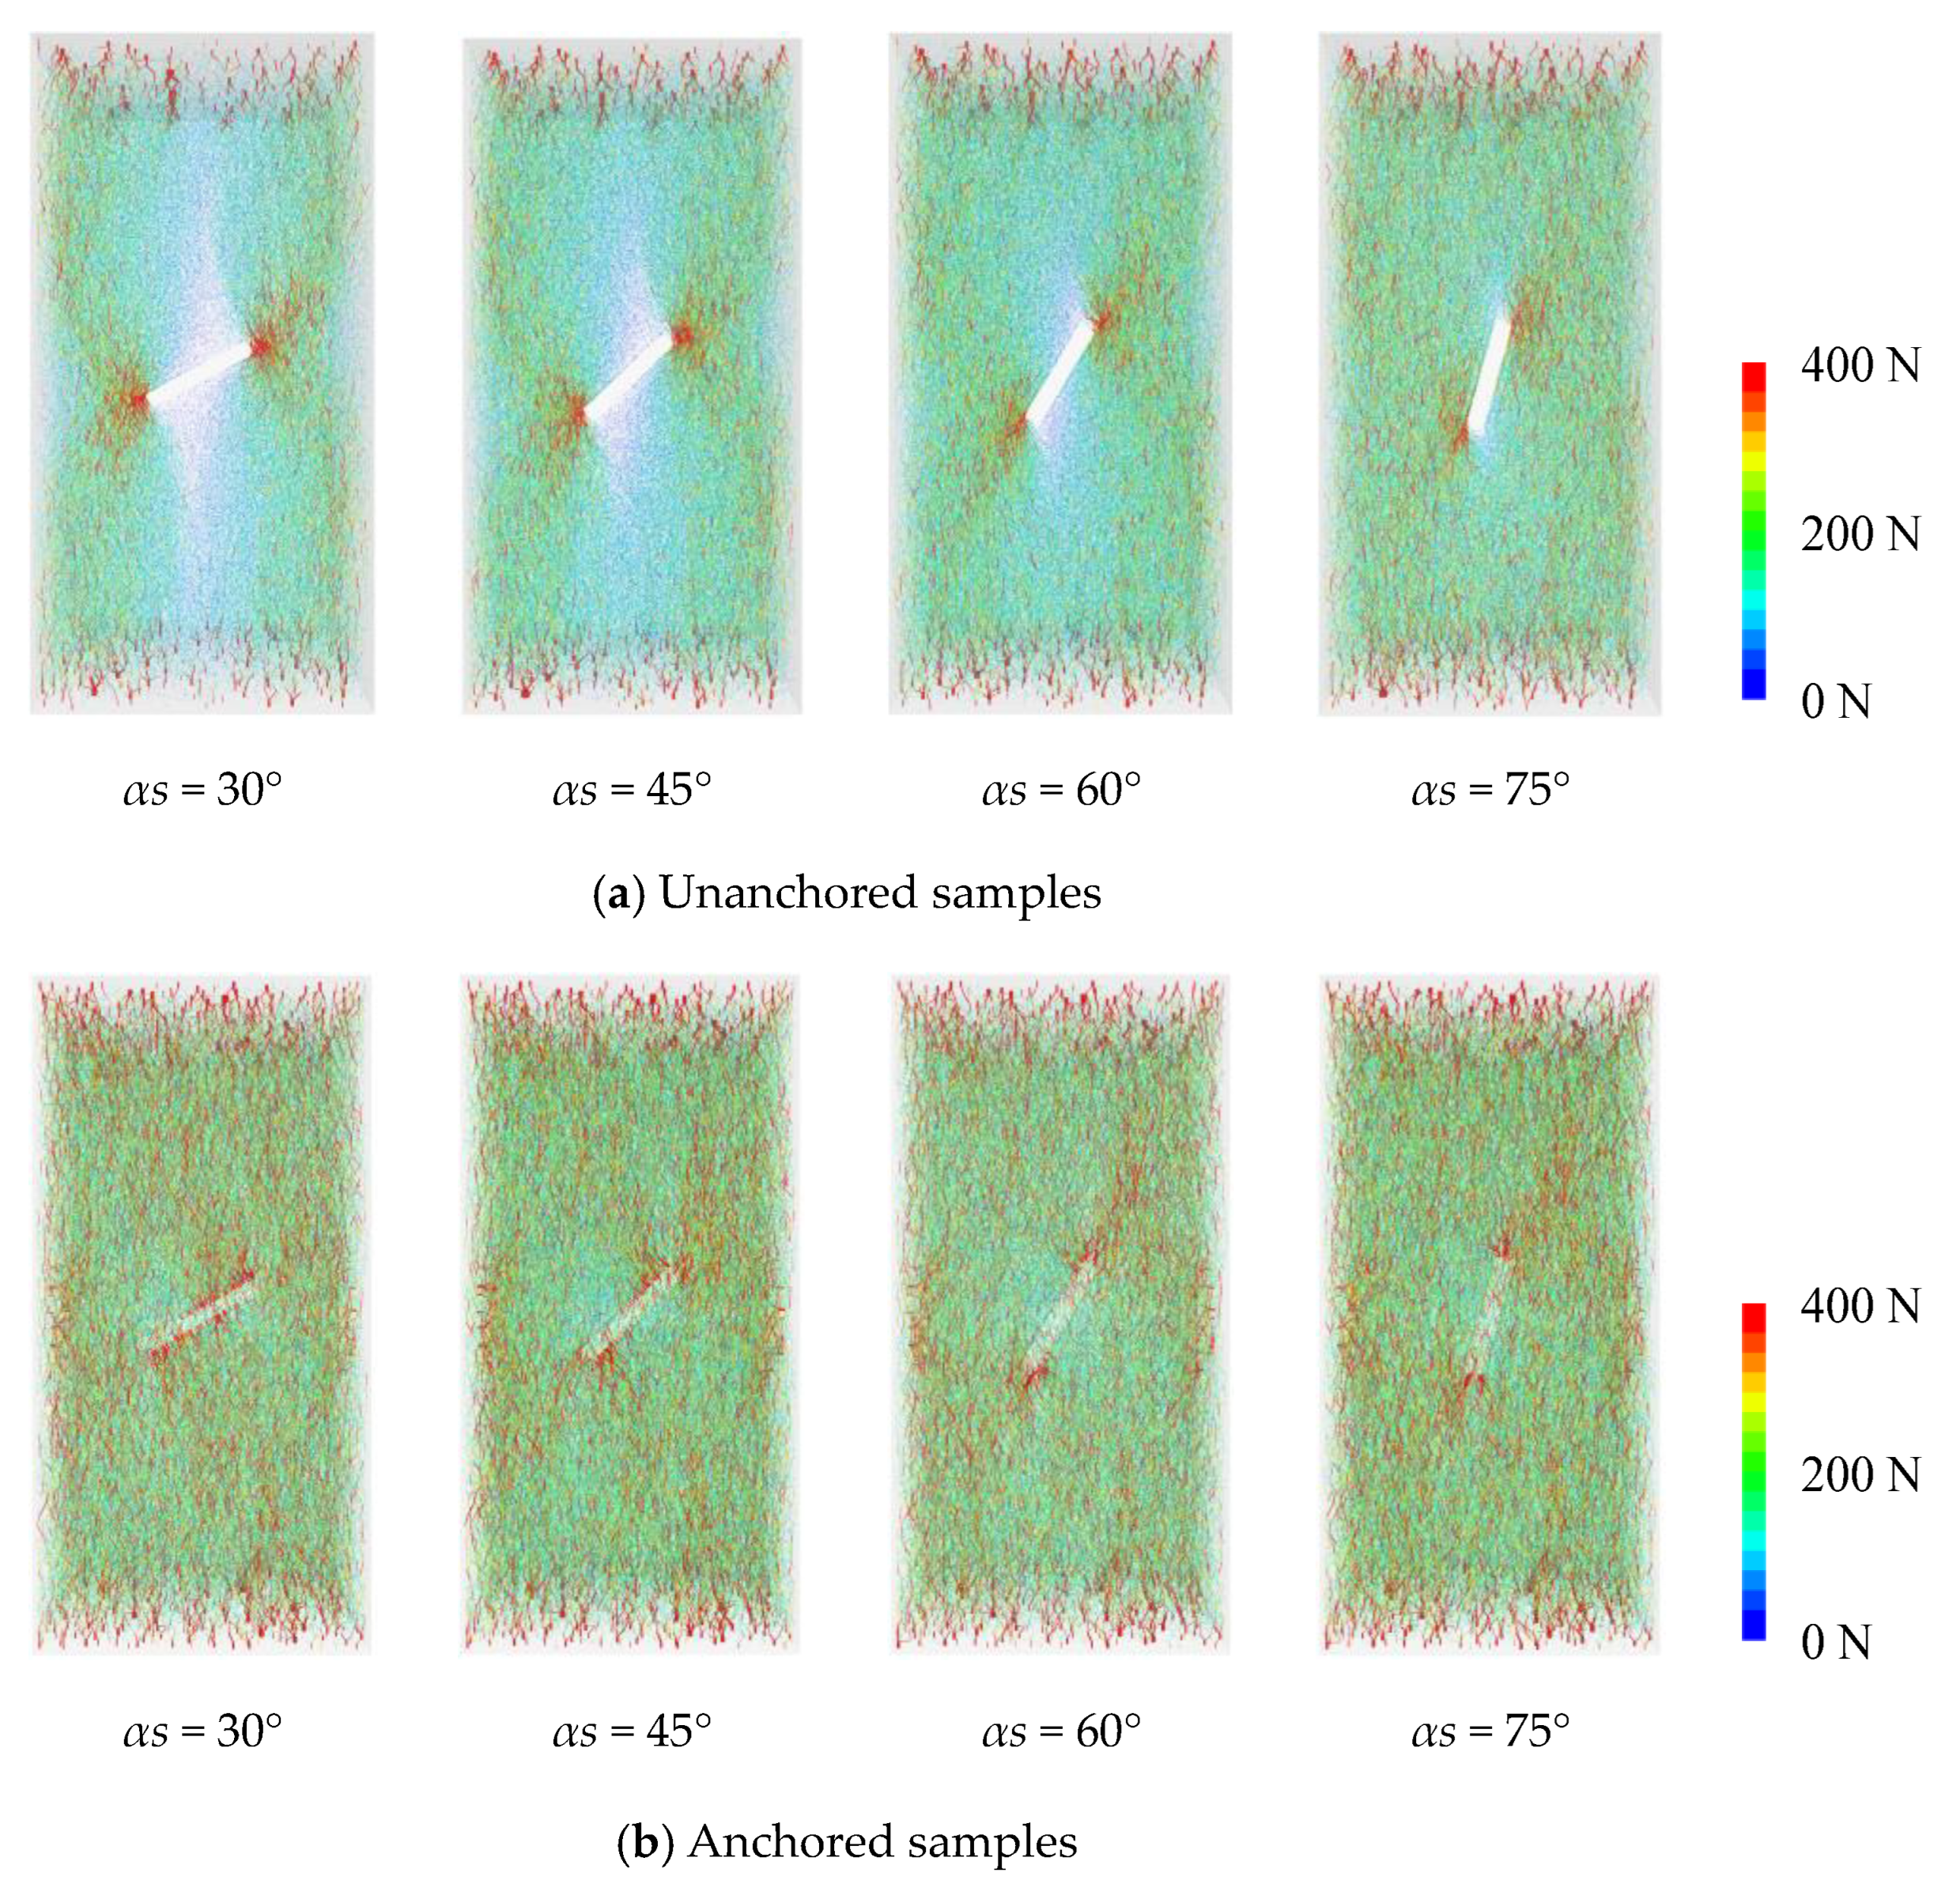
Figure 10 demonstrates the internal force chain level cloud diagrams of unanchored and anchored samples under uniaxial compression for different inclination cracks. It can be clearly observed that the overall level of internal force chains in the anchored samples is greater than that in the unanchored samples.
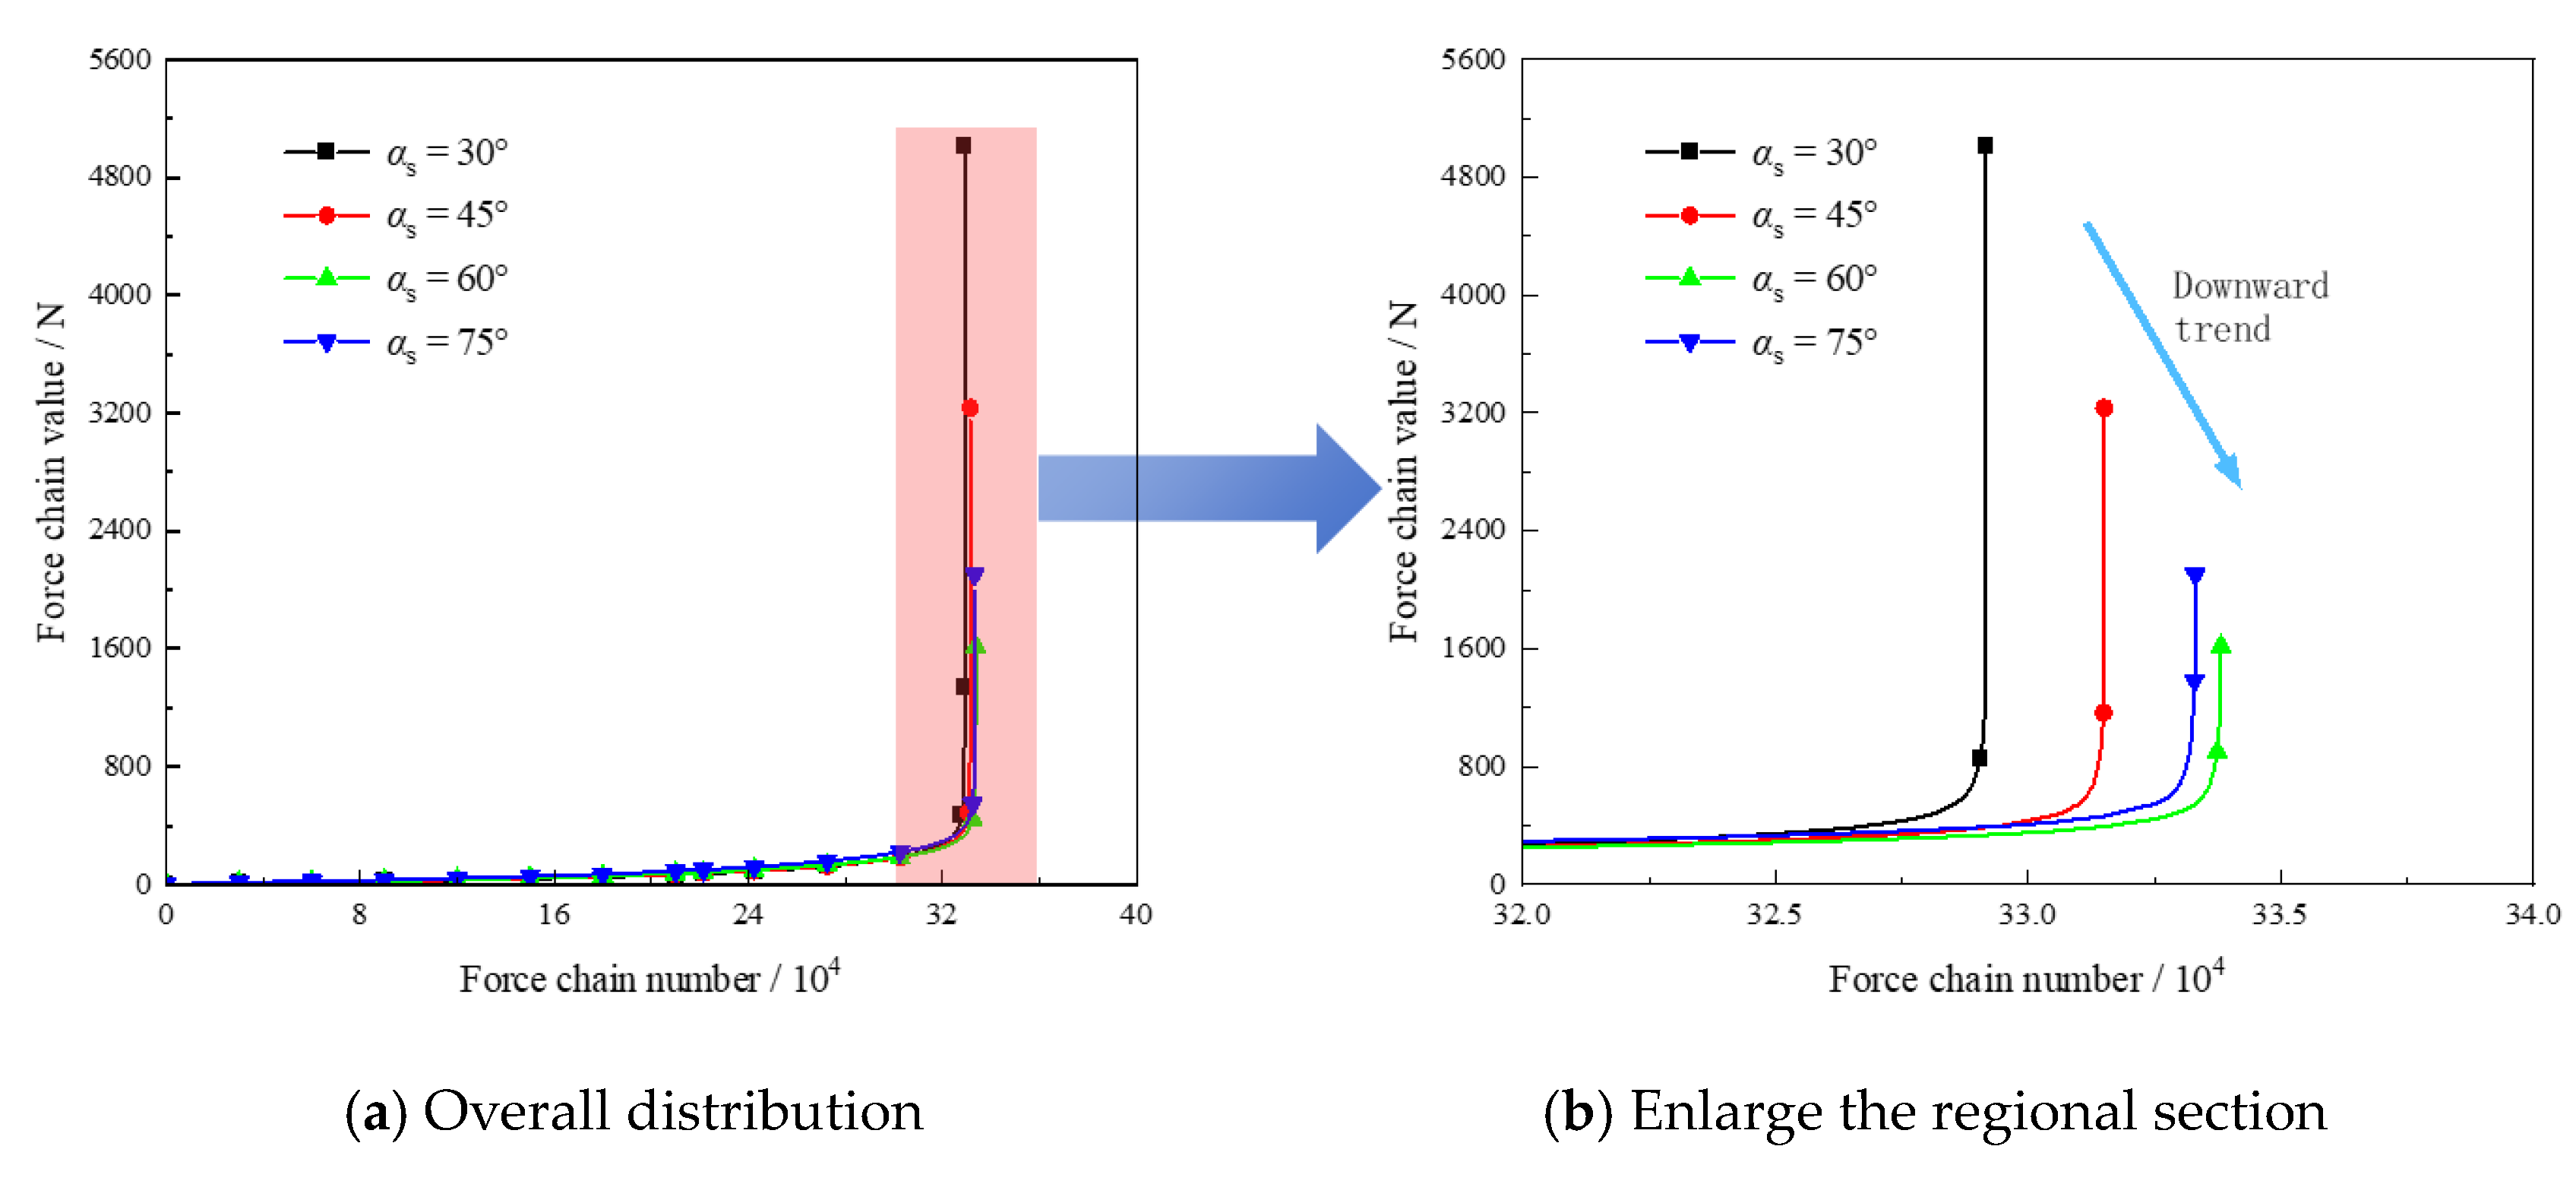
The force chain values of the internal force chains in the fracture anchorage samples with different αs were extracted, and all samples’ internal force chains were arranged according to the magnitude of the force chain values from smallest to largest, as shown in Figure 11. It can be observed that the force chain values of the internal force chains for the fracture-anchored samples with different αs are mostly at a very low level, with only a few having higher values, as indicated in the red-marked section of Figure 11. Upon zooming in on the red area, we can see that the horizontal axis of the curve, which represents the number of force chains, increases and then decreases with the increase in αs. Meanwhile, the vertical axis, indicative of the force chain values, shows a trend of first decreasing and then increasing with the increase in αs. This suggests that the anchoring system has varying degrees of anchoring effects on the anchored samples with fractures at different inclination angles, but further research is needed to explain this phenomenon.
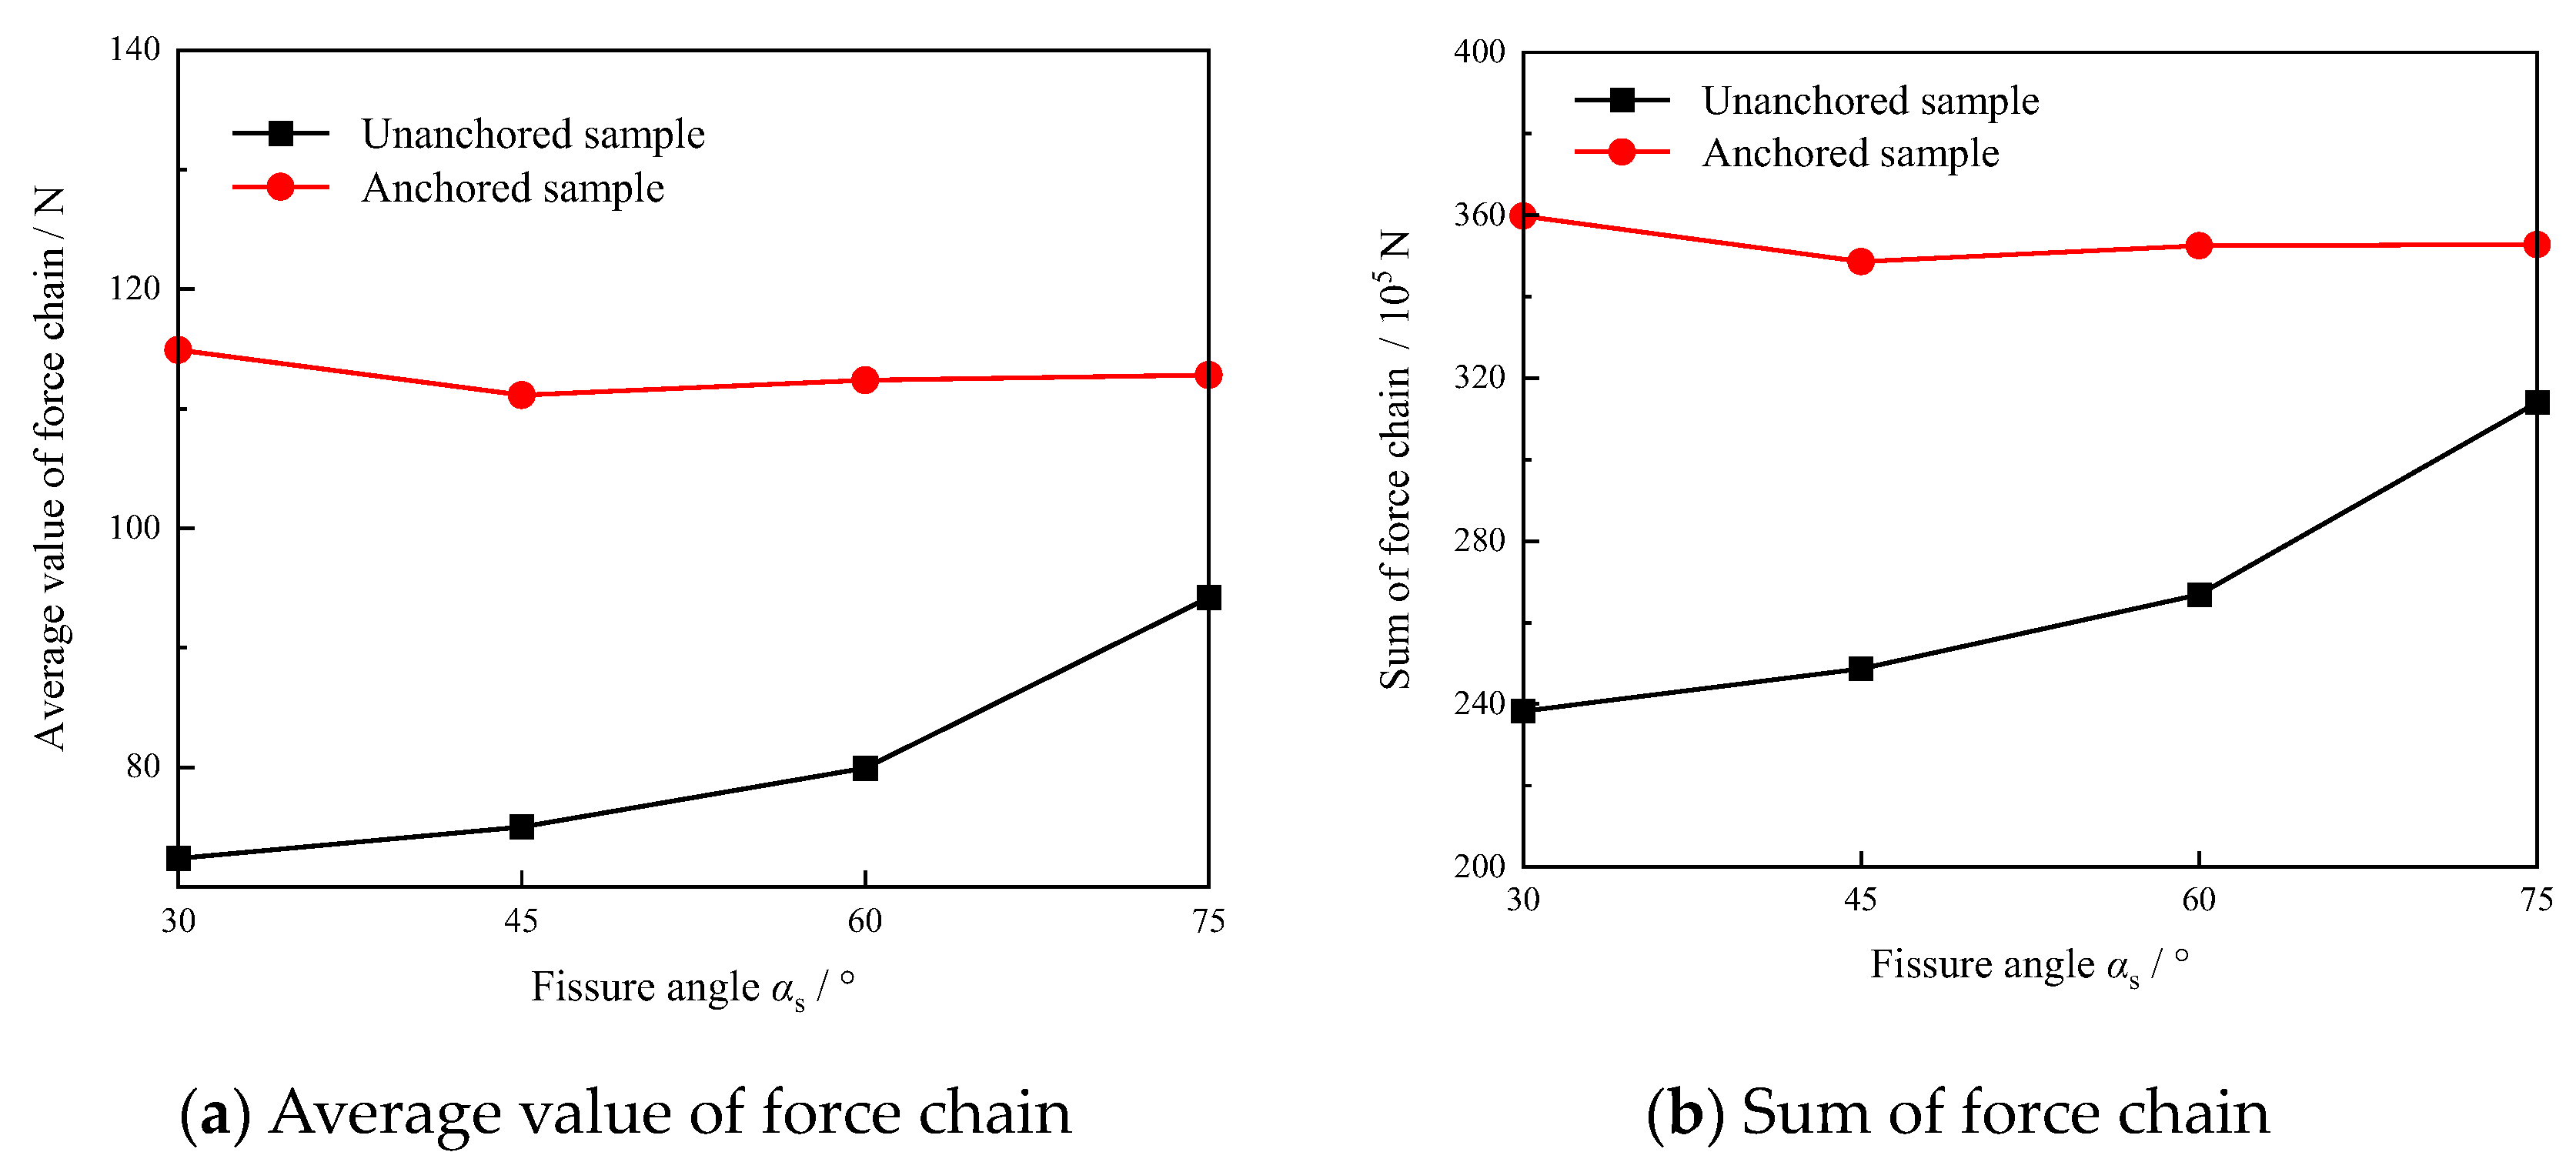
Figure 12 shows a comparative plot of the variation in the eigenvalues of the internal force chains of the anchored samples of the fissures containing different αs. It can be clearly seen that the mean and sum of the internal force chains of the unanchored and anchored samples have a similar trend. Specifically, as the αs increase, there is a tendency for the increase in the mean value of the force chains and the sum of the force chains of the anchored samples compared to the unanchored samples to decrease gradually.
Specifically, in Figure 12a, as the αs increase from 30° to 75°, the mean force chain values of the unanchored samples are 72.38 N, 75.01 N, 79.95 N, and 94.21 N. The mean force chain values of the anchored samples were 114.93 N, 111.14 N, 112.38 N, and 112.83 N, which increased by 58.79% compared to the unanchored samples, respectively, 48.17%, 40.56%, and 19.76%. In Figure 12b, as the αs increase from 30° to 75°, the sum of force chains of the unanchored samples are 238.26 × 10⁵ N, 248.65 × 10⁵ N, 266.90 × 10⁵ N, and 314.01 × 10⁵ N. The mean values of force chains of the anchored samples were 359.80 × 10⁵ N, 348.60 × 10⁵ N, 352.50 × 10⁵ N, and 352.80×10⁵ N, with increases of 51.01%, 40.20%, 32.07% and 12.35% compared with the unanchored samples.
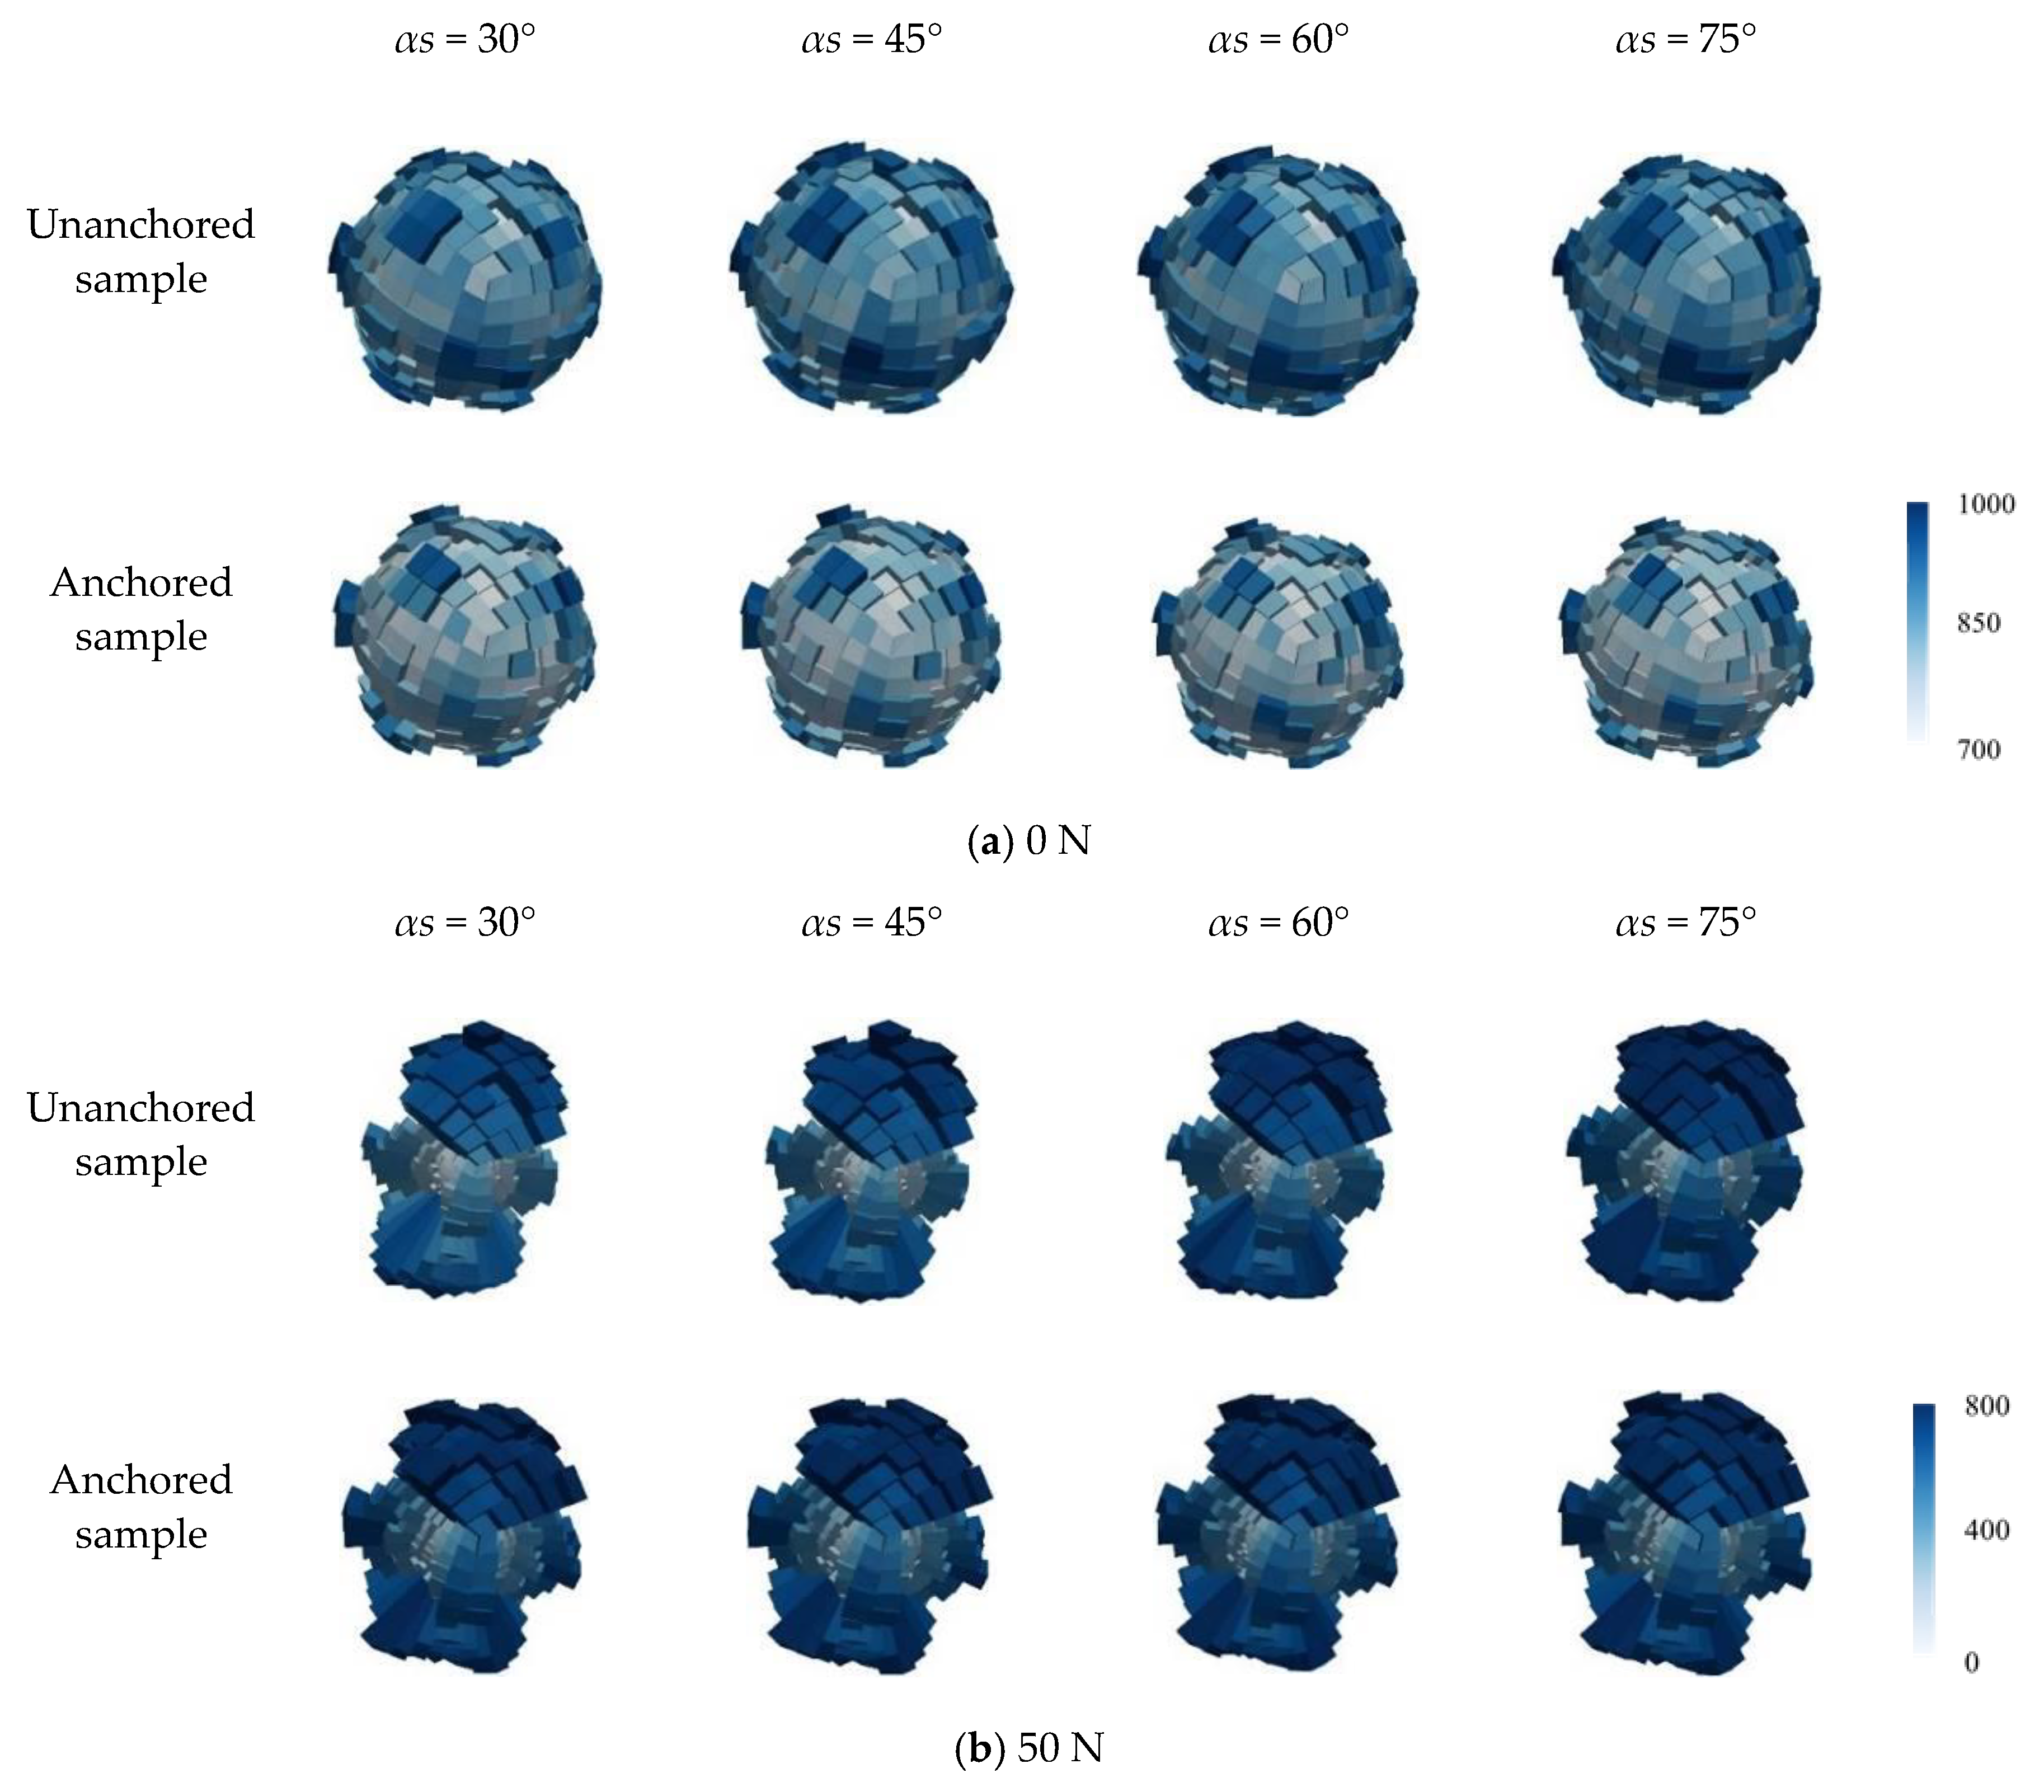
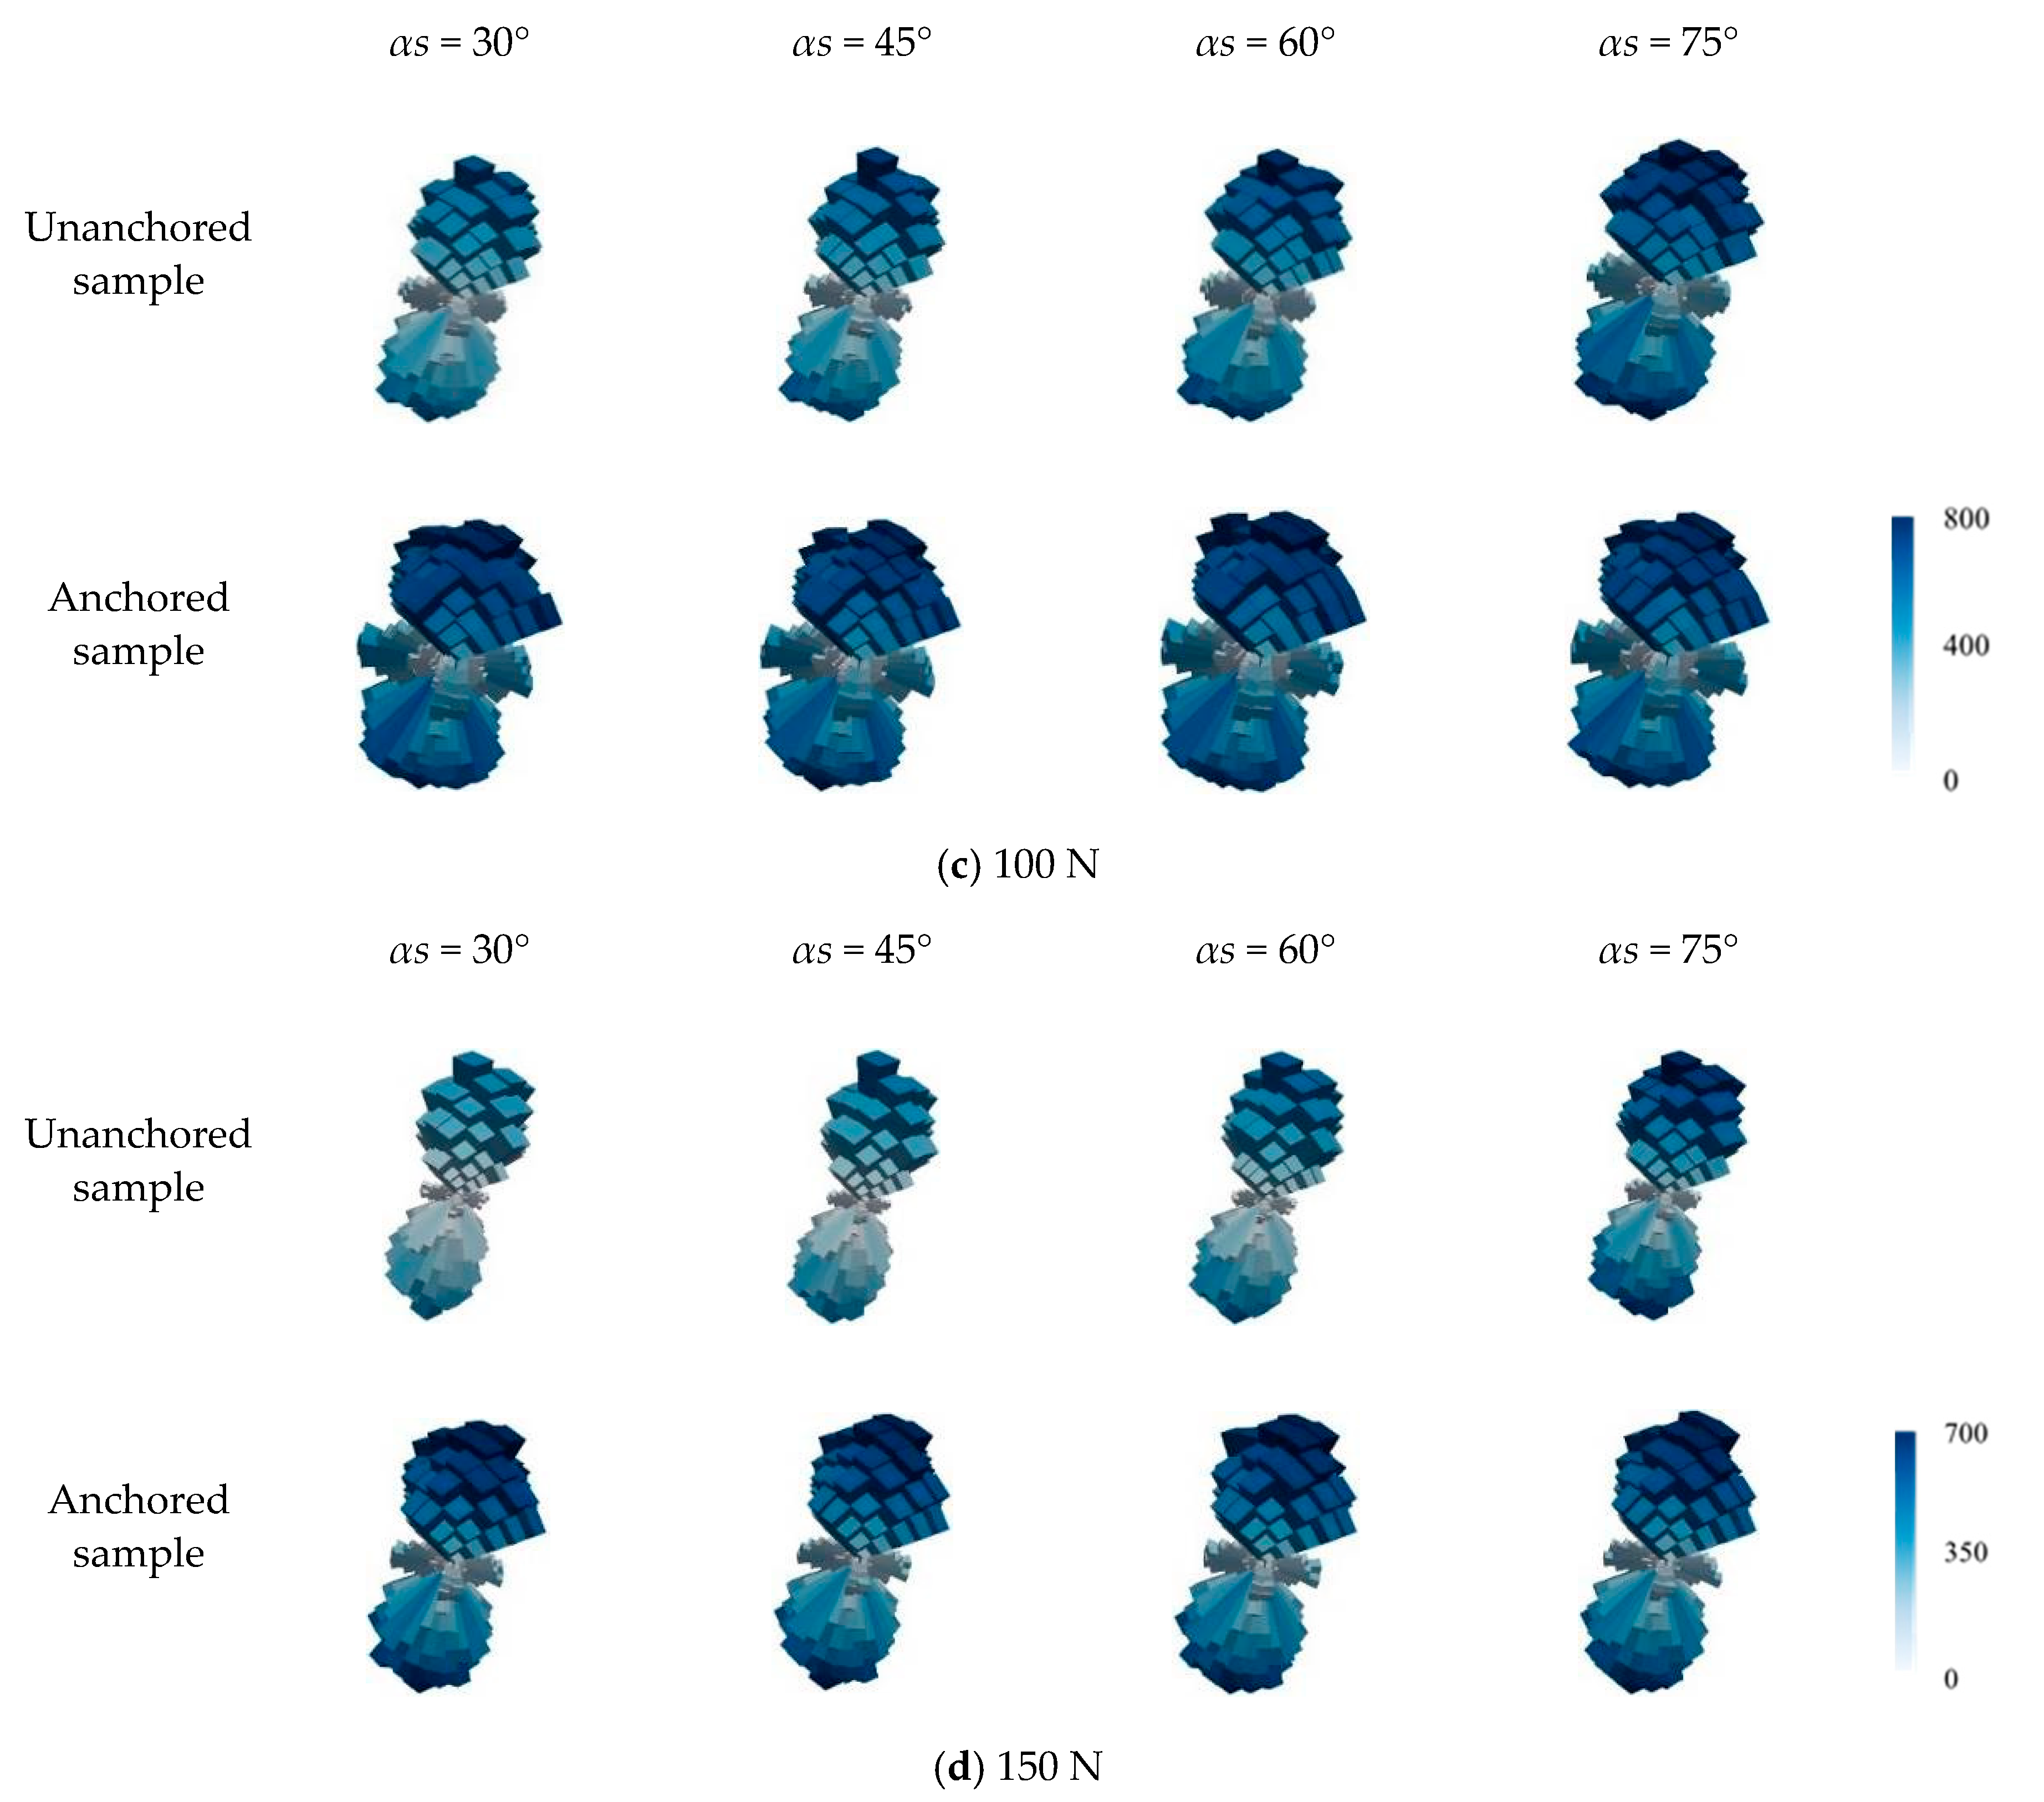
Next, all force chains inside the fissure unanchored and anchored samples containing different αs were screened by setting thresholds, which were also selected as 0 N, 50 N, 100 N, and 150 N. Figure 13 illustrates the rose diagrams of the force chains inside the fissure unanchored and anchored samples containing different αs for different screening thresholds.
Figure 13a shows the force chain rose diagrams for all force chains that were not threshold screened for force chains. Overall, the force chain rose diagrams for both the anchored and unanchored samples closely resemble a spherical shape, and the volume of the force chain rose diagrams for samples with inclined fractures, whether anchored or unanchored, is similar, with no significant differences in coloration. However, the volume of the rose diagrams of the anchored samples is reduced and the color is lightened to some extent from the unanchored samples compared to the unanchored samples. This implies that the number of force chains inside the unanchored sample is more.
As the sieving threshold increases, the force chain rose diagrams for both the unanchored and anchored samples no longer exhibit a spherical shape. Among samples with the same αs, when the sieving threshold is increased from 50 N to 150 N, the volume of the force chain rose diagrams for both types of samples gradually decrease. This indicates that only a small number of force chains within the samples are influenced by the external load. Additionally, Figure 13b–d show that after threshold sieving, the volume of the force chain rose diagrams for the anchored samples is larger than that for the unanchored samples. Moreover, as the sieving threshold increases, this phenomenon becomes increasingly evident. This suggests that compared to the unanchored samples, the anchored samples carry a higher level of load within the sample under external loading and are able to retain more force chains with higher force chain values, thereby possessing greater load-bearing capacity.
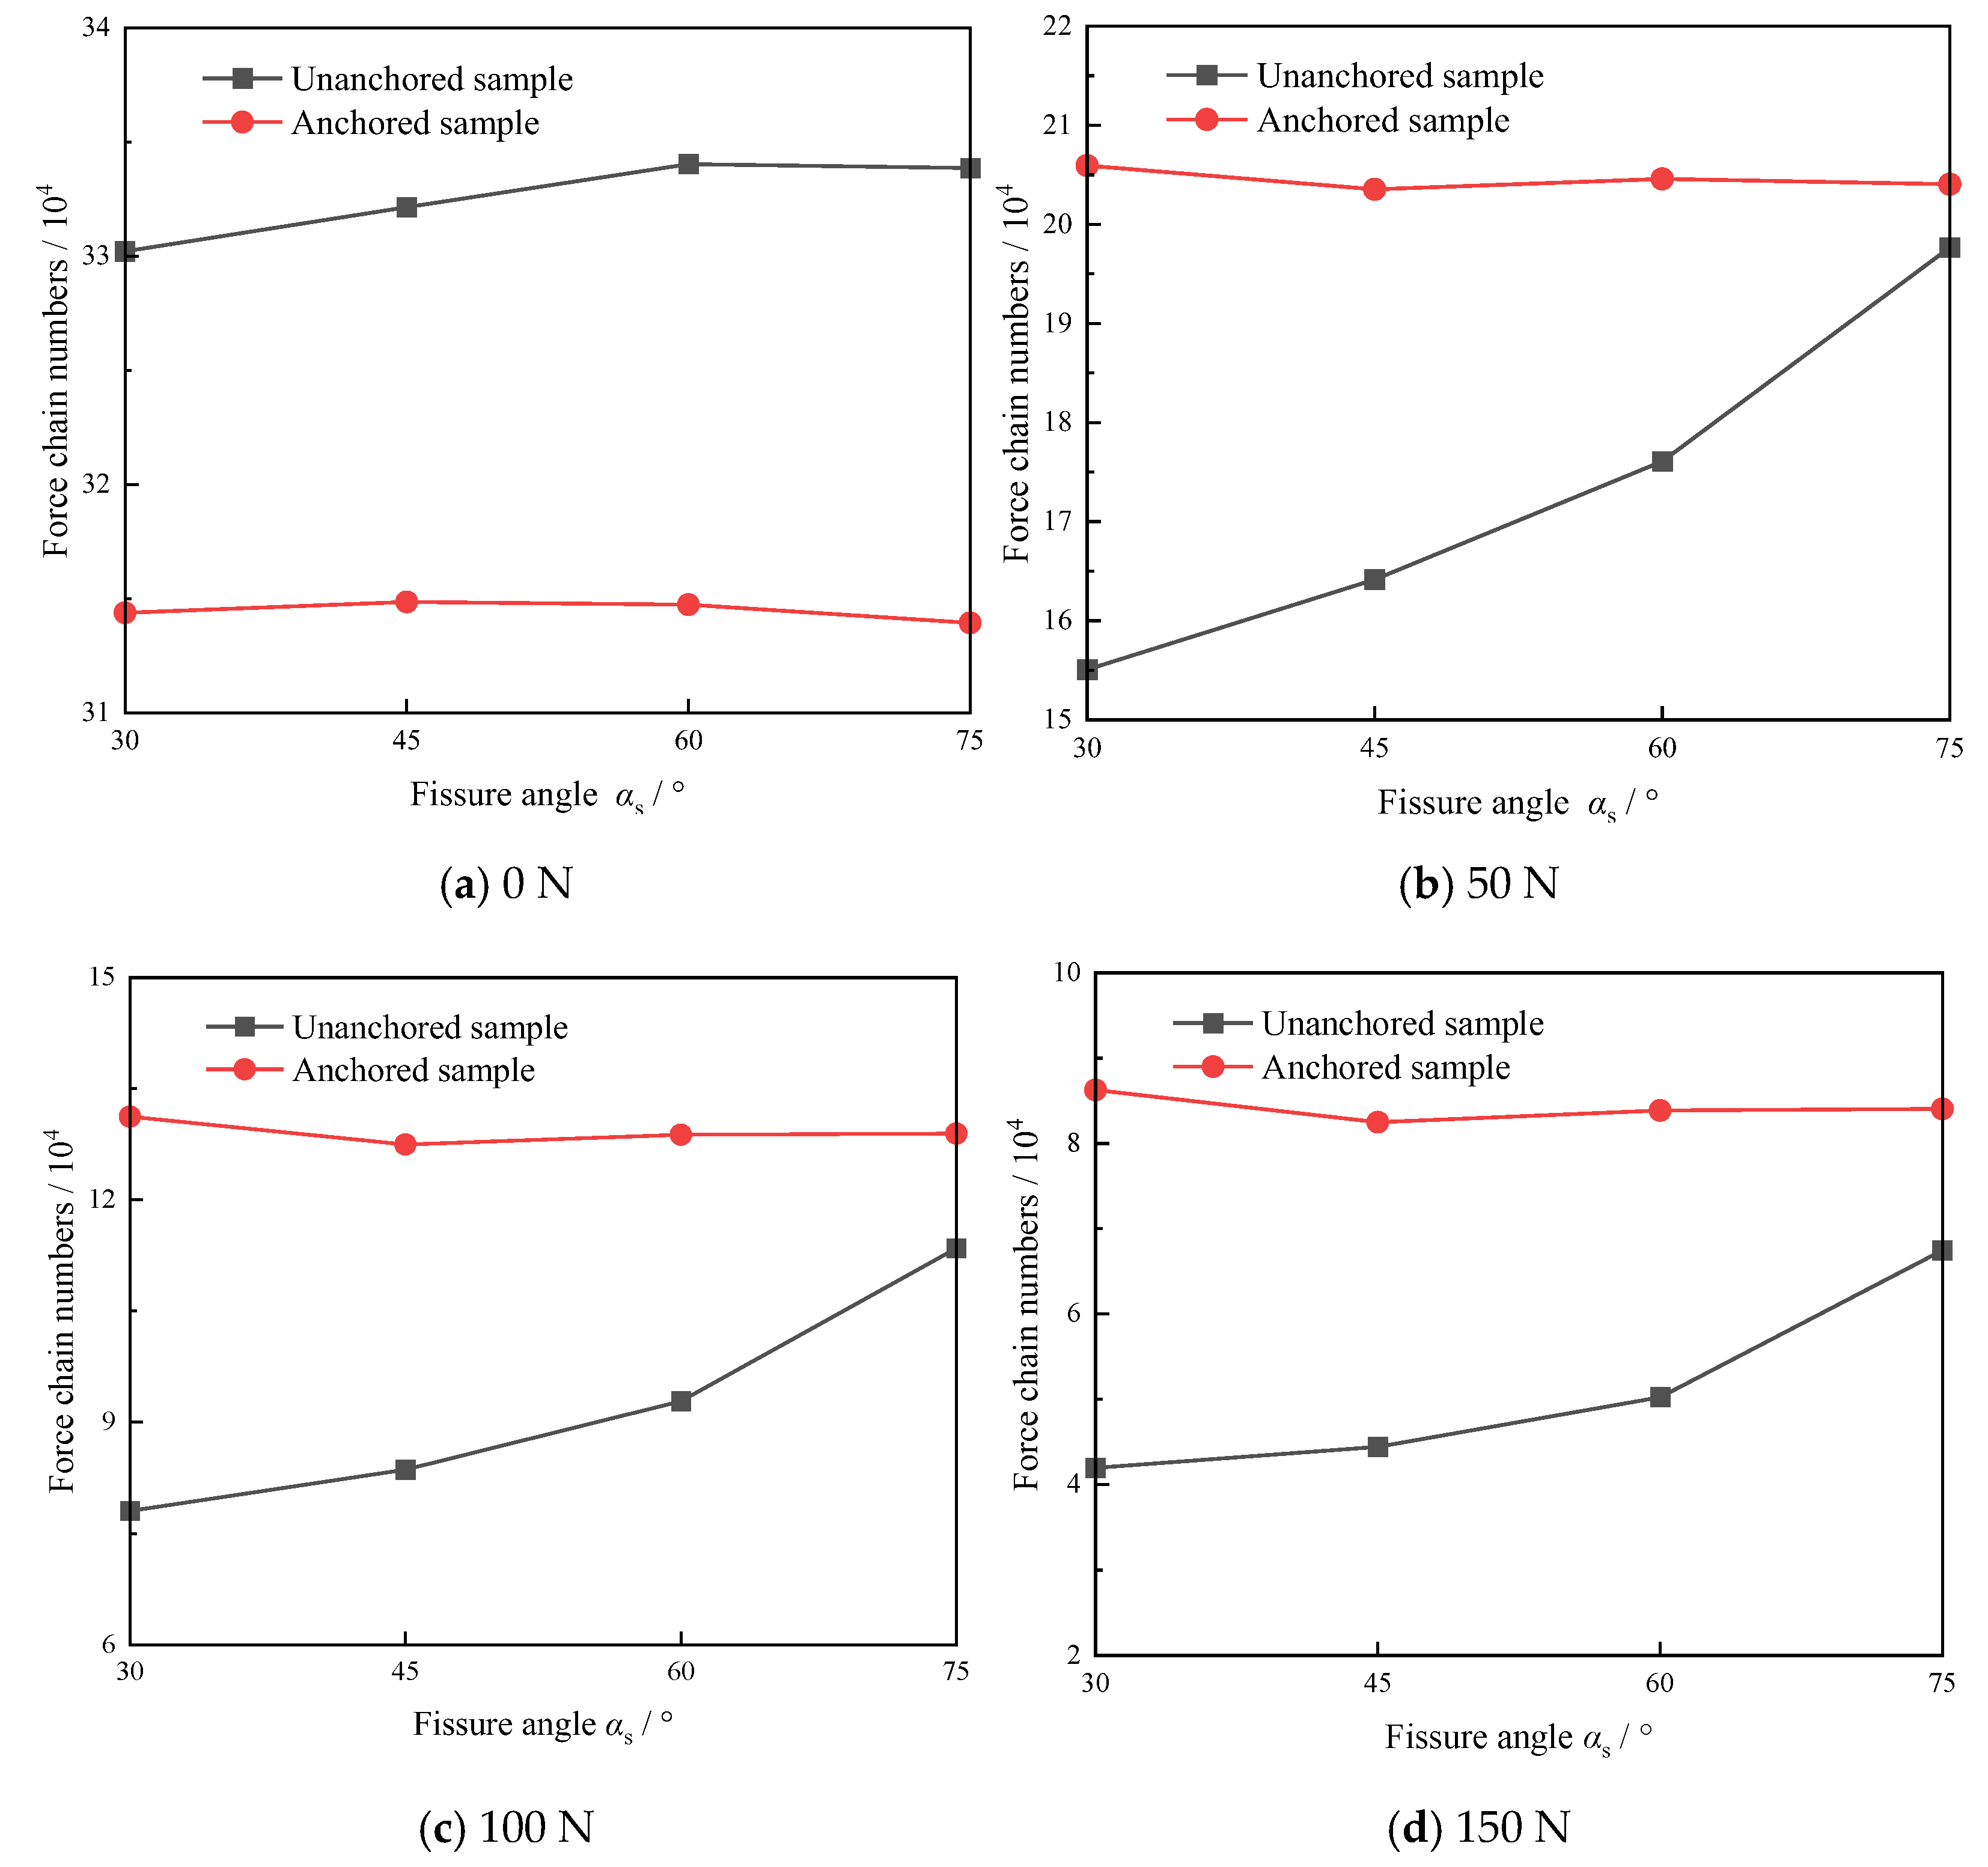
Figure 14 illustrates a comparative plot of the number of force chains in the unanchored and anchored samples of the fissure containing different αs screened with different thresholds. As can be observed from Figure 14a, the number of force chains inside the unanchored sample is also consistently larger than that of the anchored sample without threshold screening.
In Figure 14b–d, it can be clearly observed that the number of force chains inside the unanchored sample is always lower than that of the anchored sample at different screening thresholds. The increase in the number of force chains of the anchored sample compared to the unanchored sample tends to diminish with the increase in αs.
Among them, when the force chain screening threshold is set to 50 N, as αs increases from 30° to 75°, the number of force chains within the anchored samples increases by 32.81%, 23.98%, 16.18%, and 3.23% compared to the unanchored samples, respectively. When the force chain screening threshold is set to 100 N, the number of force chains within the anchored samples increase by 68.30%, 52.53%, 38.75%, and 13.66%, respectively; when the force chain screening threshold is set to 150 N, as αs increases from 30° to 75°, the number of force chains within the anchored samples increases by 105.67%, 85.75%, 66.99%, and 24.59% compared to the unanchored samples, respectively. From the above results, it can be inferred that the increase in the number of force chains in the anchored samples relative to the unanchored samples gradually decreases, which may be related to the influence of the fracture dip angle on the anchoring effect. The mechanism by which the fracture dip angle affects the anchoring effect warrants further research.

5. Discussion

5.1. Effect of Fissure Angles on Crack Distribution

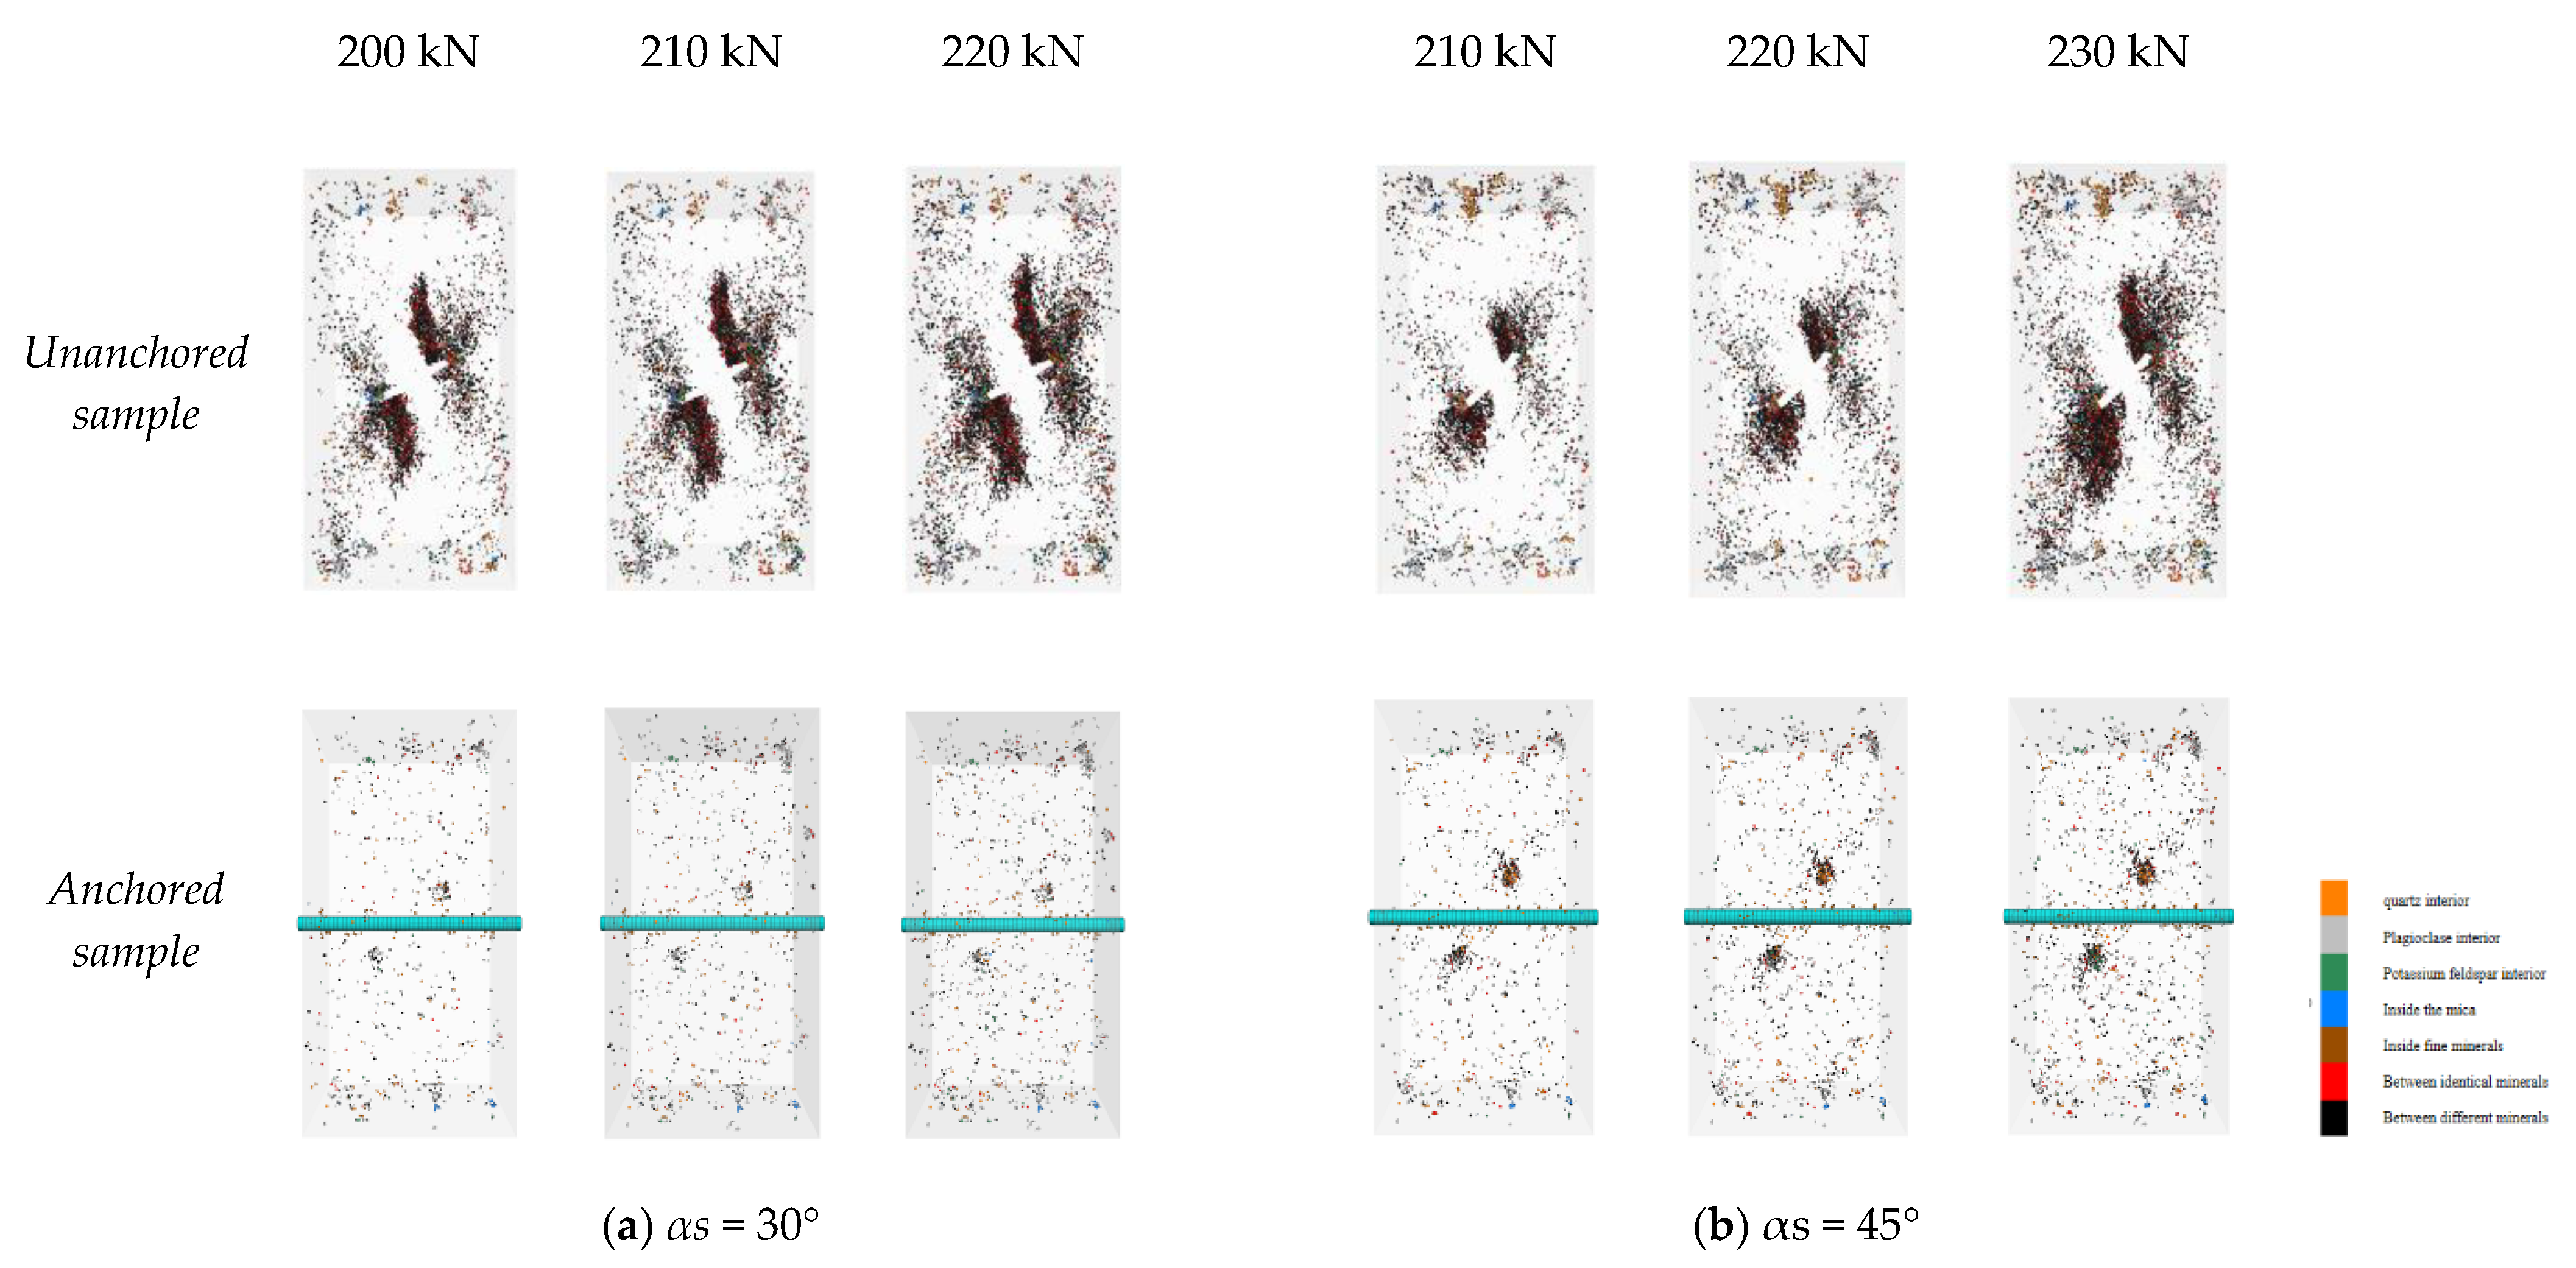
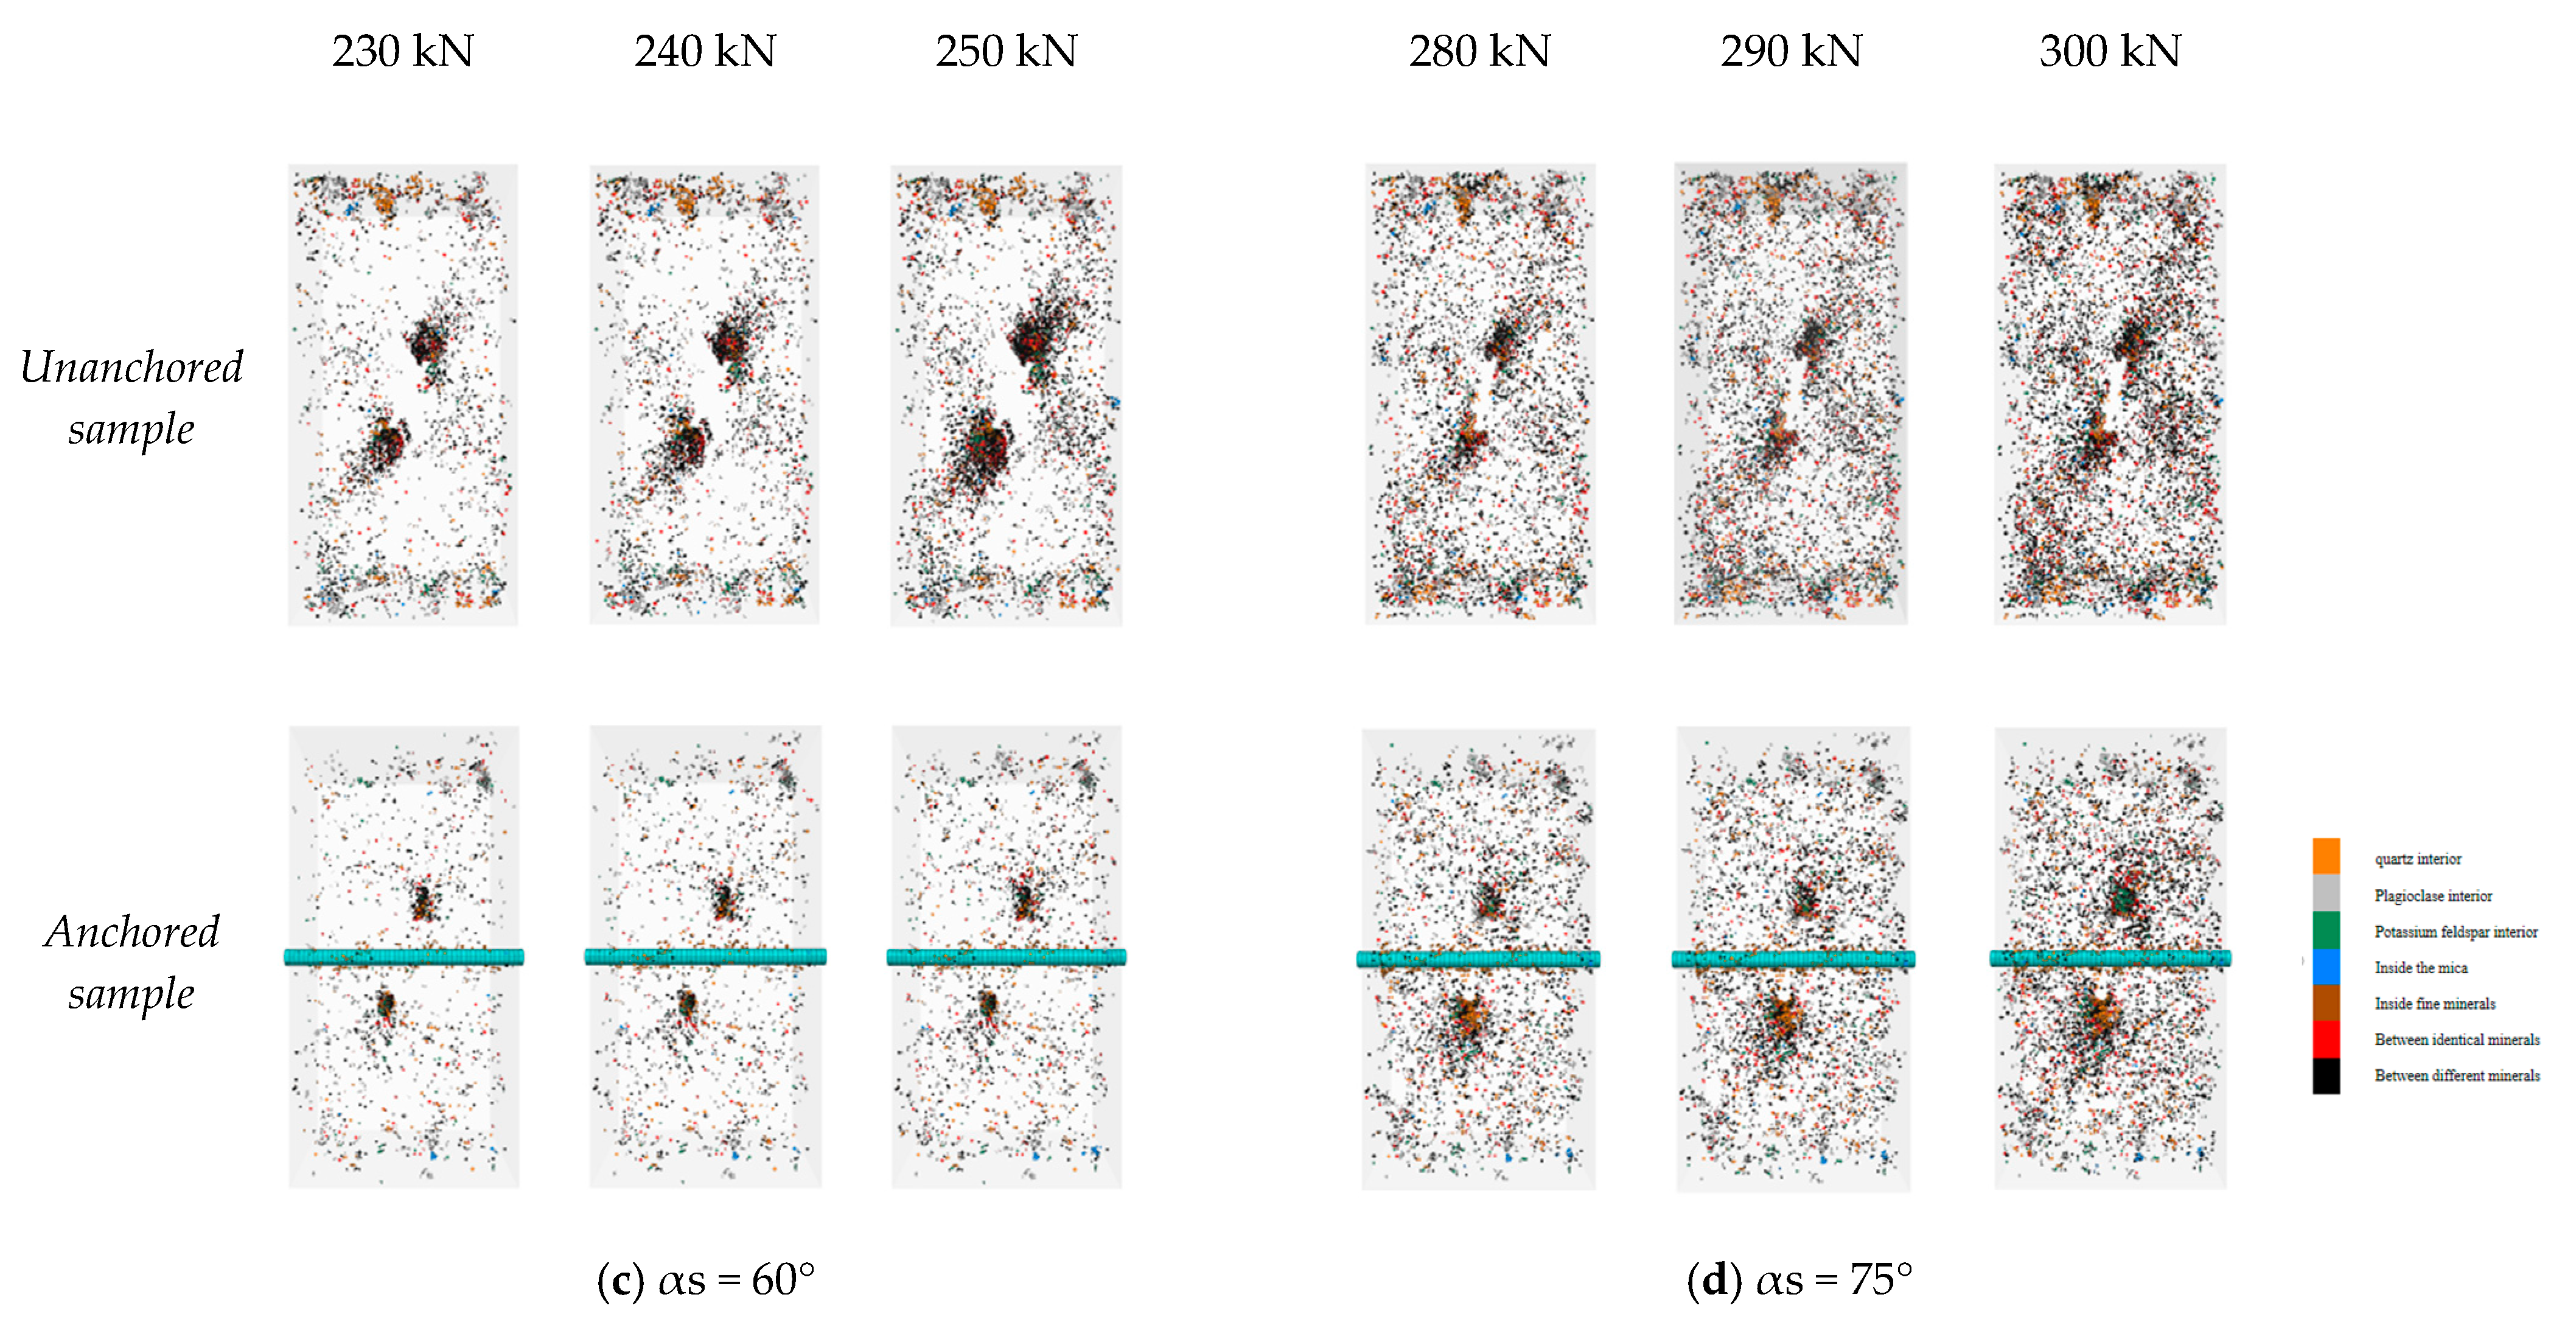
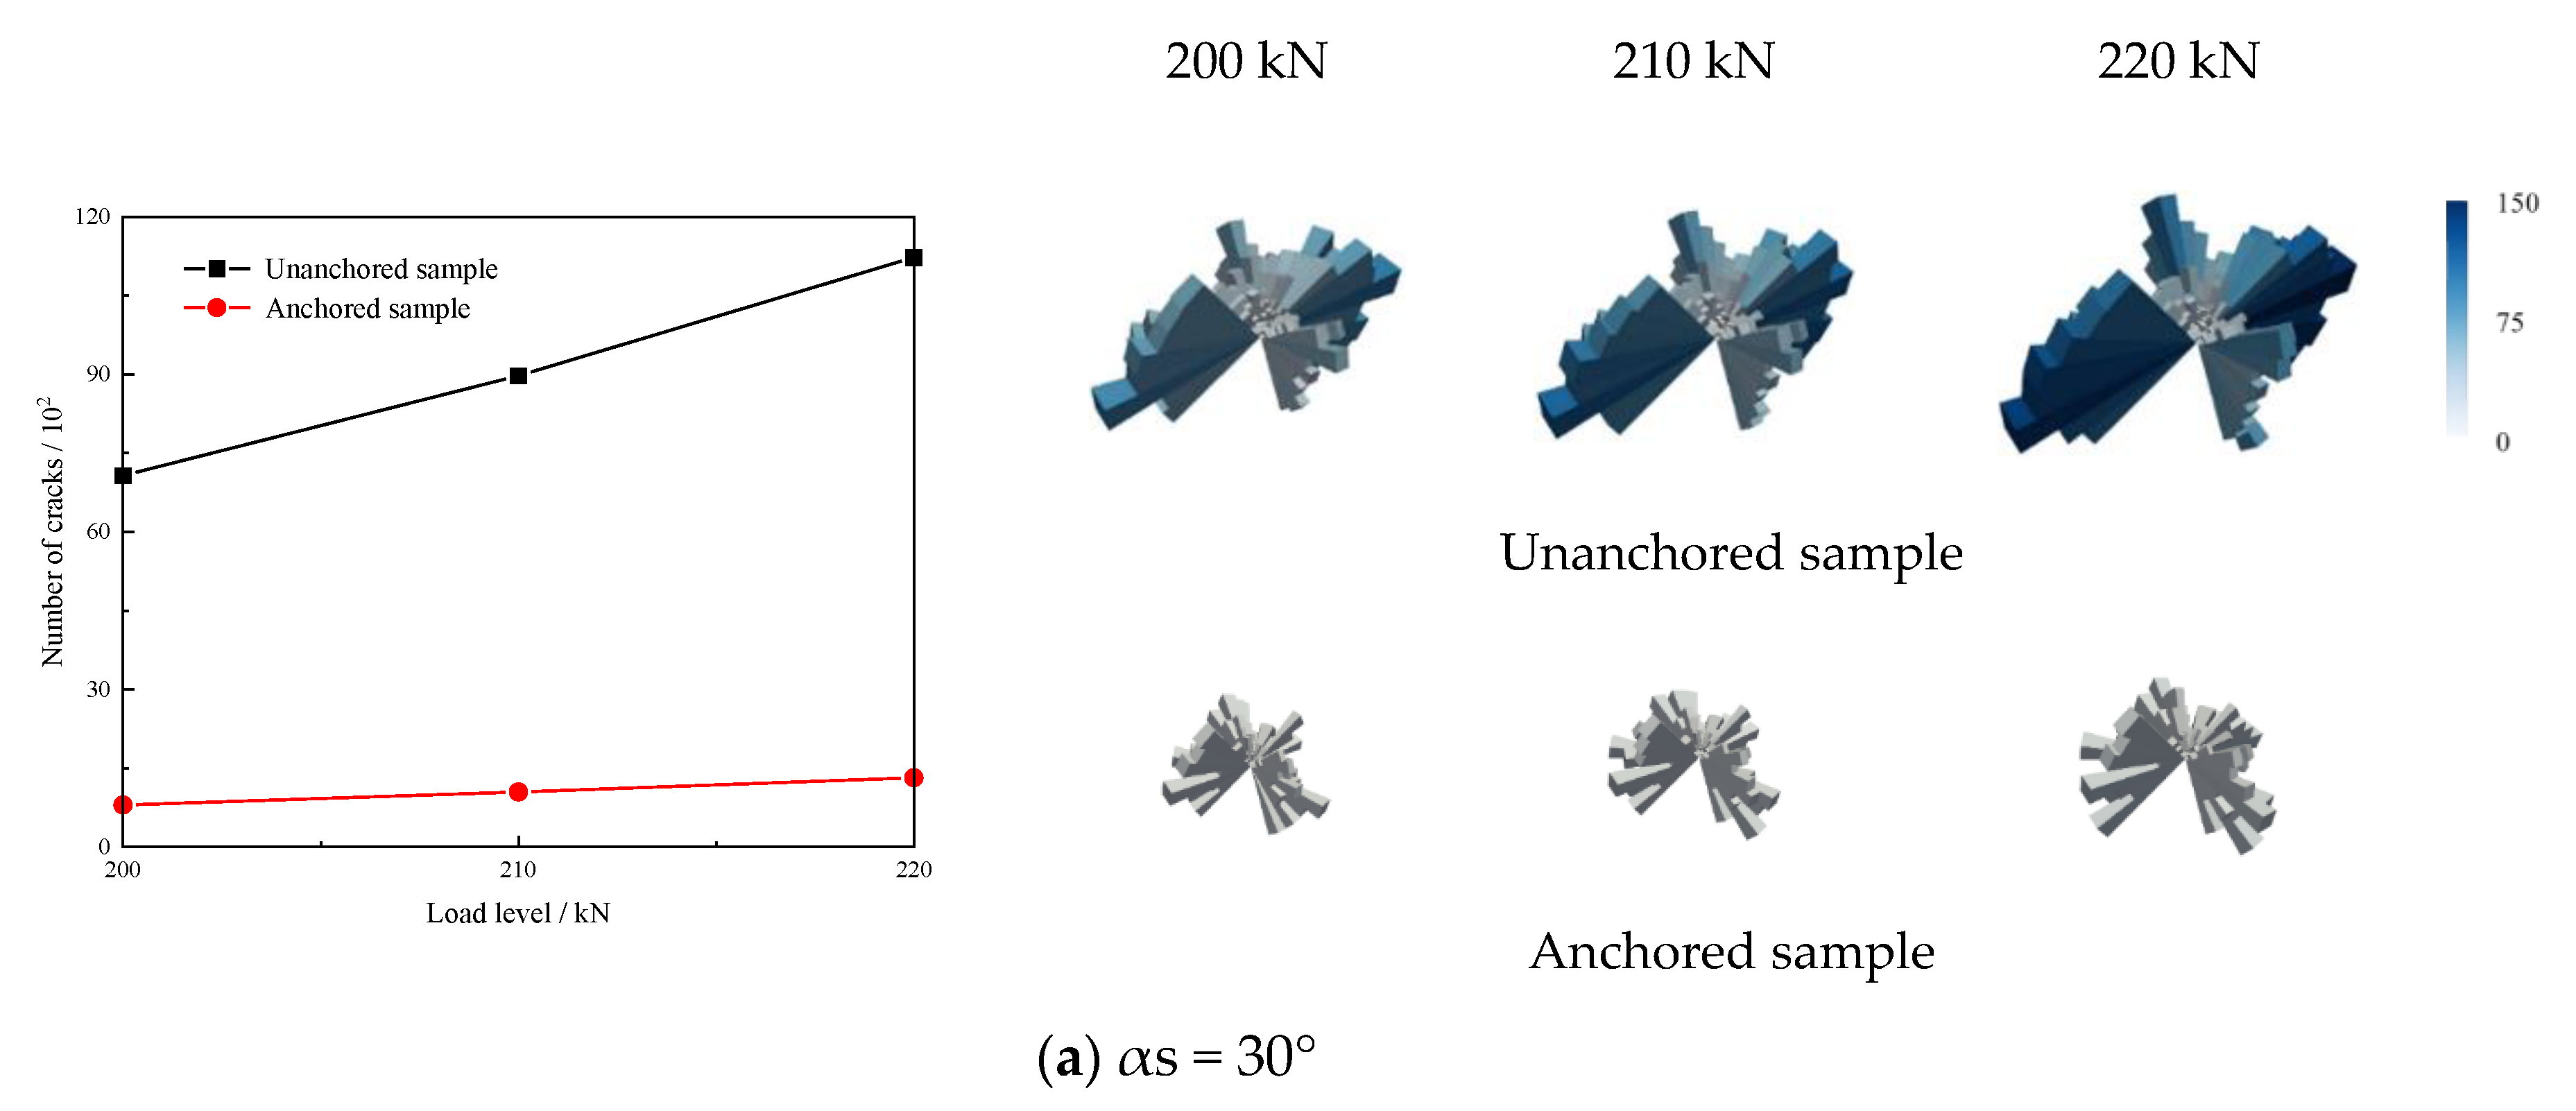
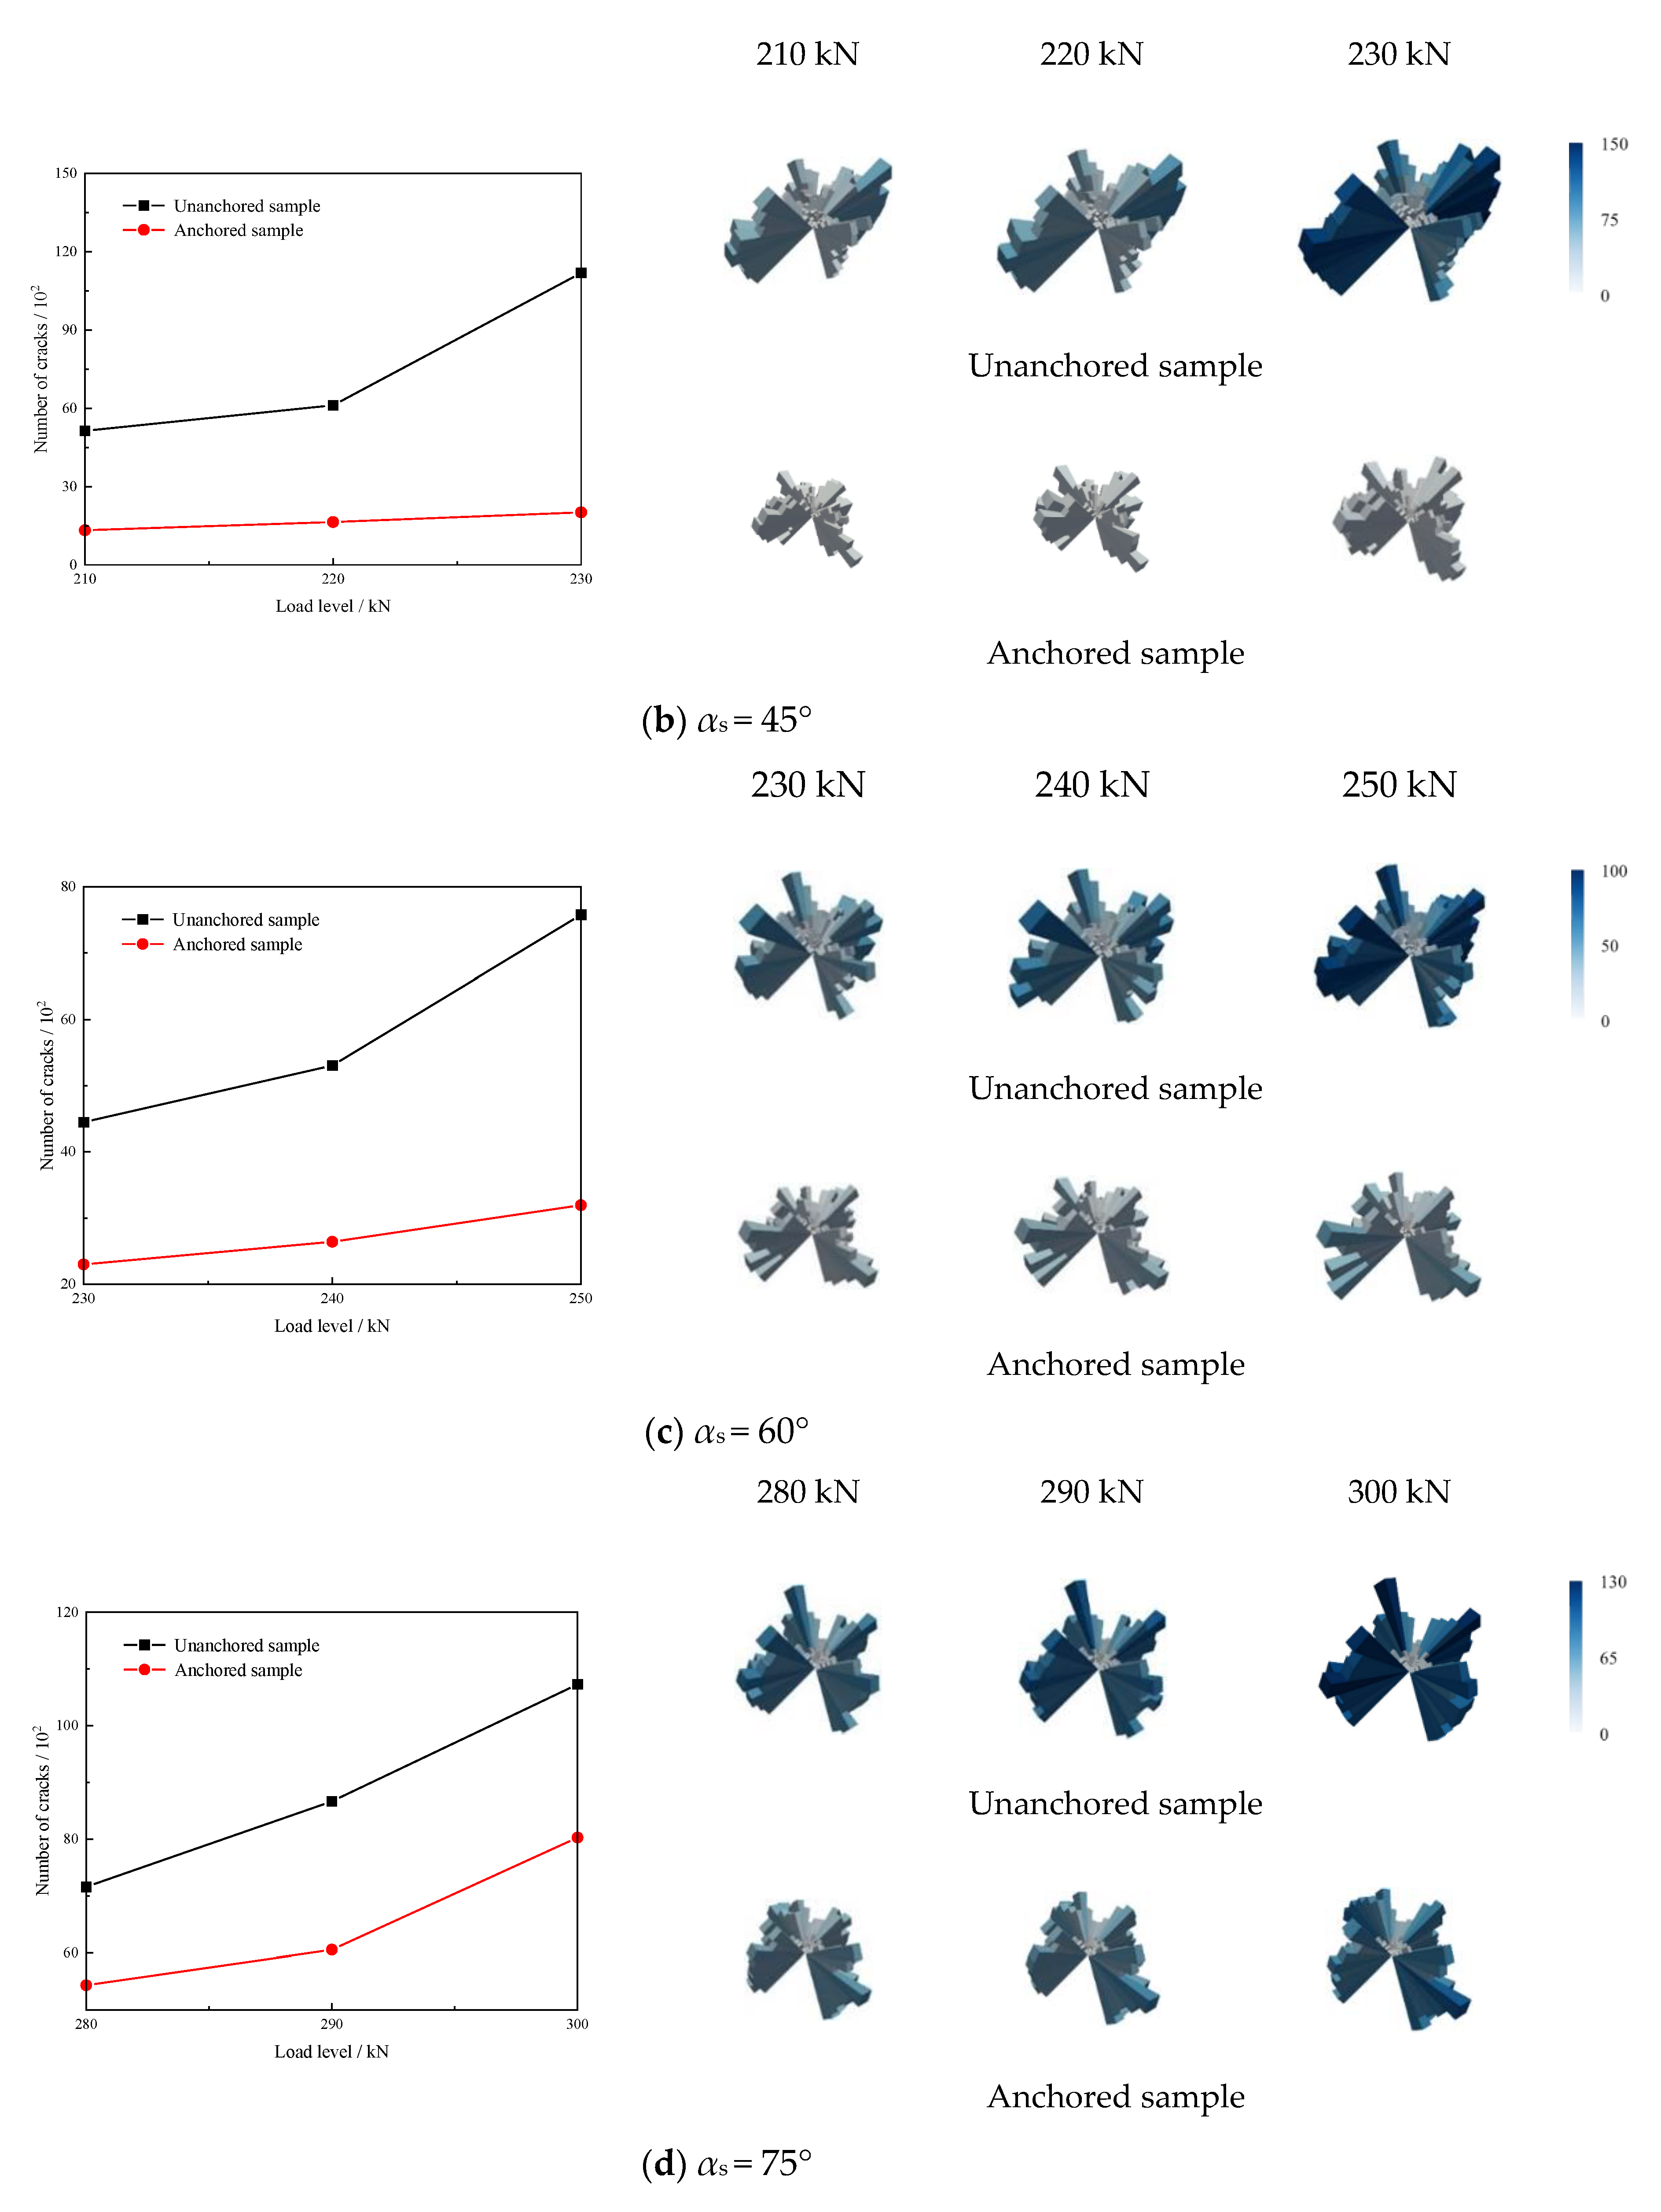
To further explore the anchoring and crack-stopping effect of rock bolts on fracture samples with different αs, three load levels before peak load were selected for each of the four dip angle fracture samples. A comparison and analysis were conducted on the changes in crack density cloud diagrams, crack quantity, crack rose diagrams, and the force chain values required to generate individual cracks at different load levels.
Figure 15 displays the internal crack change cloud diagrams of unanchored and anchored samples containing fractures with different αs under various load levels. It can be observed that as the load level increases for each, the crack density in the unanchored samples with different αs gradually increases in the fracture tip area. However, at the same load level, the internal crack density of the anchored samples is relatively less compared to the unanchored samples. Additionally, the cloud diagrams clearly show that the anchored samples with a fracture of αs = 30° have the greatest reduction in crack density compared to the unanchored samples, followed by the samples with a fracture of αs = 45°, while the change in the anchored samples with a fracture of αs = 75° is the smallest. This phenomenon further suggests that the anchoring and crack-stopping effect of the rock bolts is most pronounced in the samples with a fracture of αs = 30°.
Figure 16 presents the crack number curves and crack rose diagrams of unanchored and anchored samples with fractures of different αs at their respective different load levels. It can be observed that the internal crack number in the unanchored samples is always higher than that in the anchored samples; hence, the volume of the crack rose diagrams for the unanchored samples is larger, and the color is correspondingly deeper towards blue. However, the increase in the volume of the crack rose diagrams for the anchored samples with different αs compared to the unanchored samples varies; visually, the increase in volume and color deepening of the crack rose diagrams for the anchored samples with a fracture of αs = 30° is the most significant, while the increase for the samples with a fracture of αs = 75° is the smallest.
The curve diagrams also show that at their highest load levels, the reductions in crack number for the anchored samples with fractures of αs = 30°, 45°, 60°, and 75° compared to the unanchored samples are 88.25%, 81.99%, 57.85%, and 25.17%, respectively. This further confirms that the anchoring system can significantly reduce the number of cracks and enhance the stability of the rock mass, and also indicates that the fracture dip angle has a certain impact on the anchoring effect.

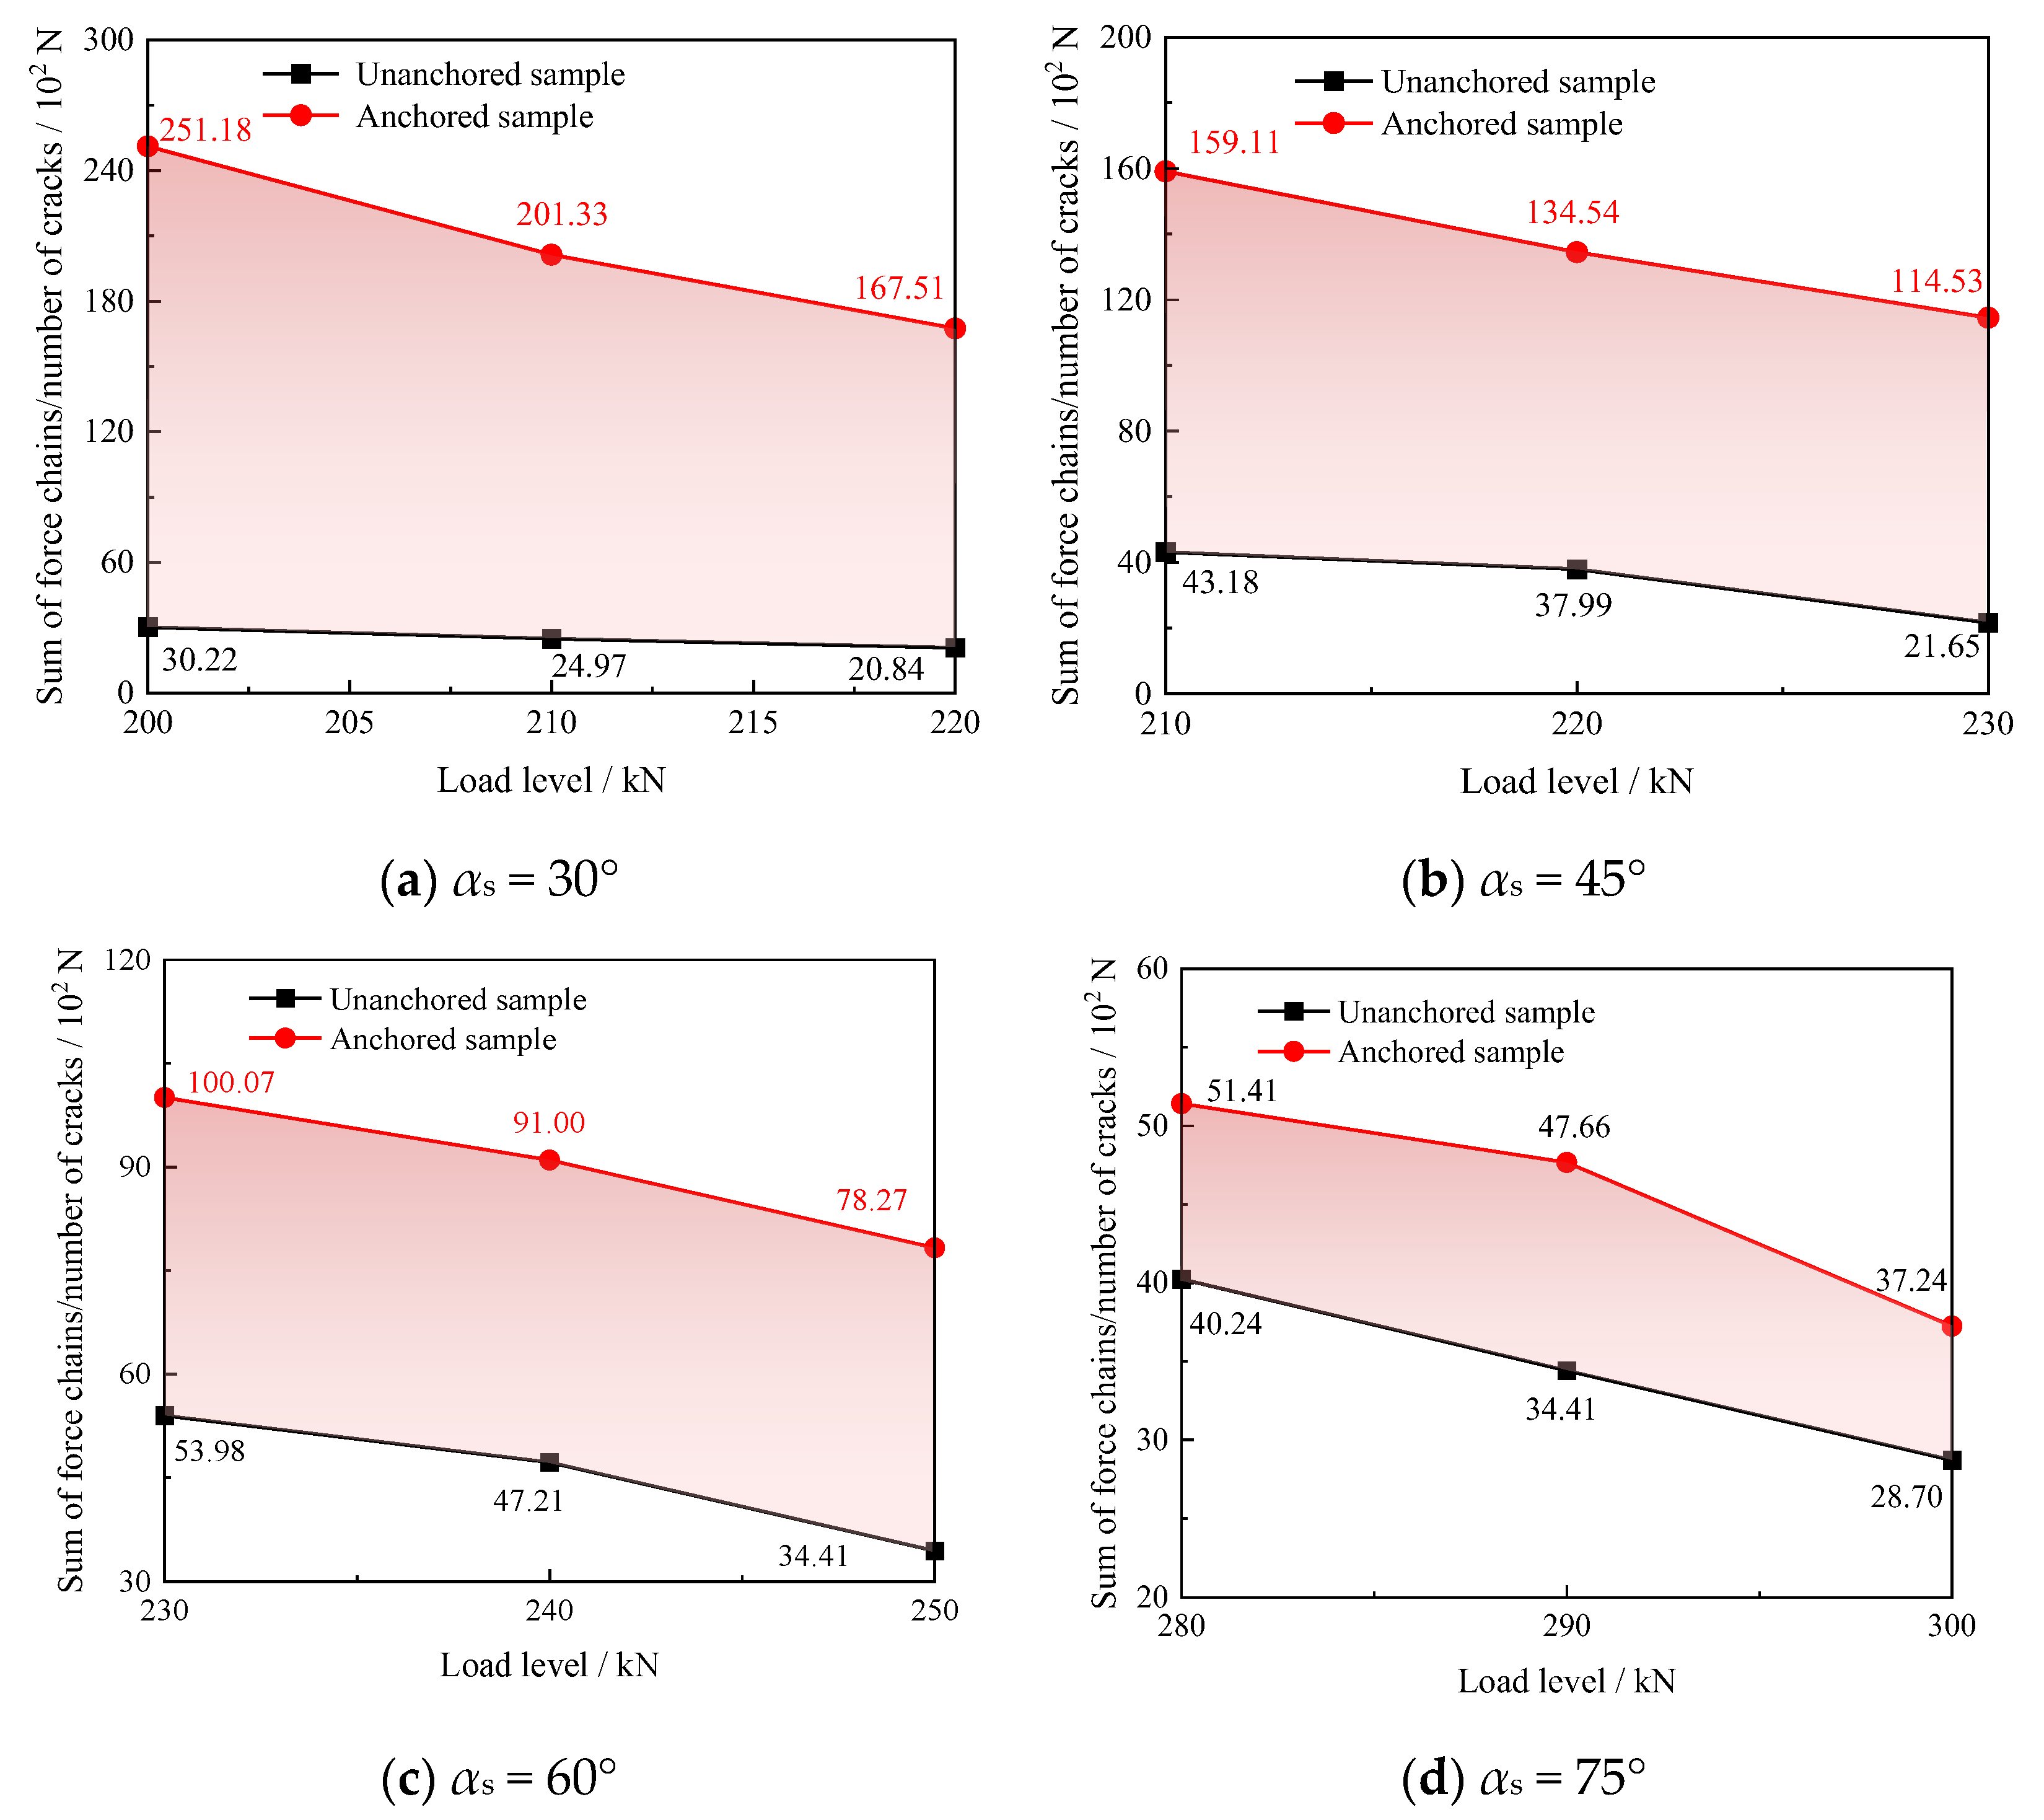
5.2. Effect of Fissure Angles on the Force Chain Values

Figure 17 illustrates the change curves of the force chain values required to generate individual cracks within unanchored and anchored samples with different αs under various load levels. It can be directly observed that the increase in the force chain values needed to produce a single crack within the anchored samples with a fracture of αs = 30° is the greatest compared to the unanchored samples, as indicated by the area of the red annotation, while the samples with a fracture of αs = 75° show the smallest increase. These above analysis results show that the crack inclination angle significantly affects the anchoring performance of the specimen. As the crack inclination angle decreases, the anchoring and crack-stopping effects become more pronounced.

6. Conclusions

In this paper, granite anchorage test samples were prepared and a numerical model of anchored fractured granite samples was constructed. A series of indoor experiments and numerical simulation studies were undertaken, exploring from the perspectives of macroscopic mechanical properties, deformation, and fracture patterns, and the evolution of the force chain network information. The ultimate goal was to reveal the differences in the mechanical behavior under uniaxial compression between unanchored and anchored fractured granite samples with varying αs, as well as to elucidate the influence of rock bolts on the anchoring and crack-stopping effects in these samples with different αs. The main conclusions of this paper are as follows:
(1)
It was found that there is a strong consistency in the trend of load–displacement results between experimental and simulation results. The macroscopic fracture patterns of unanchored samples all show obvious shear failure, with debris fields concentrated at the fracture tips and distributed along the diagonal of the samples, while the distribution of debris in anchored samples is more uniform. This, in turn, validates the effectiveness of the numerical model parameter calibration.
(2)
The number of force chains, the average force chain value, and the total force chain count within the anchored samples all exceed those of the unanchored samples. This suggests that there are fewer cementation fractures within the anchored samples, which implies fewer cracks. Furthermore, as the αs increase, the increase in force chain characteristics of the anchored samples compared to the unanchored samples decreases.
(3)
The results show that the volume of the three-dimensional rose diagrams of the anchored samples with fractures at various dips is greater than that of the unanchored samples. As the αs increase, the above phenomenon becomes less apparent, which means that the anchored samples have a higher load-bearing capacity. In addition, as αs increase, the anchoring reinforcement effect of the rock bolts becomes less obvious.
(4)
A quantitative exploration was conducted on the anchoring and crack-stopping effect of rock bolts on granite samples with different dip angles of fractures. The results show that at αs = 30°, the rock bolts have the best crack-stopping effect on the samples. As αs increases, the crack-stopping effect gradually weakens and becomes less apparent. This suggests that in practical engineering, when dealing with fractured rock masses under different working conditions, targeted anchoring and support measures can be applied. This approach can help reduce costs to a certain extent.

Author Contributions

Conceptualization, J.G.; methodology, D.F.; validation, L.Y., T.Z. and B.H.; formal analysis, H.S.; investigation, M.S.; writing—original draft preparation, M.S.; writing—review and editing, B.H., D.F. and M.S. All authors have read and agreed to the published version of the manuscript.

Funding

This research was funded by the National Natural Science Foundation of China (52274100, 42307238, 52409148), the Excellent Postdoctoral Program of Jiangsu Province (Grant No. 2023ZB602) and the China Postdoctoral Science Foundation (Grant No. 2023M733773).

Institutional Review Board Statement

Not applicable.

Informed Consent Statement

Not applicable.

Data Availability Statement

The original contributions presented in the study are included in the article, further inquiries can be directed to the corresponding author.

Conflicts of Interest

Author Jiangfeng Guo was employed by the company Shanxi Huaning Coking Coal Co., Ltd., China Coal Group Huajin Co., Ltd. The remaining authors declare that the research was conducted in the absence of any commercial or financial relationships that could be construed as a potential conflict of interest.

References

  1. Kang, H.P.; Gao, F.Q. Evolution of Mining-Induced Stress and Strata Control in Underground Coal Mines. Chin. J. Rock Mech. Eng. 2024, 43, 1–40. [Google Scholar]
  2. Jiao, K.J.; Fang, Q.B. Optimization Design Study of Bolt Support for Tunnel with High Ground Stress and Steep Bedding Surrounding Rock. Chin. J. Undergr. Space Eng. 2019, 19 (Suppl. S2), 813–818. [Google Scholar]
  3. Zhao, L.L.; Yang, W.B.; Pan, W.T.; Wu, F.Y.; Wang, Z.L.; Yang, Z.C. Study on model test and numerical simulation of layered soft rock tunnel construction with different large deformation grades. Chin. J. Rock Mech. Eng. 2024, 43, 454–467. [Google Scholar]
  4. Long, J.K.; Zu, Z.Y.; Wang, Y.S.; Luo, W.D. Experimental Study on Linkage anchorage Technique of the prestressed anchors. J. Min. Saf. Eng. 2012, 29, 662–667. [Google Scholar]
  5. Chen, W.Z.; Wang, L.Y.; Tan, X.J.; Yang, D.S.; Yuan, J.Q.; Yang, J.P. State-of-the-art and development tendency of the underground engineering stability of fractured rock mass. Chin. J. Rock Mech. Eng. 2021, 40, 1945–1961. [Google Scholar]
  6. Bjurstrom, S. Shear Strength of Hard Rock Joints Reinforced by Grouted Un-Tensioned Bolts. In Proceedings of the 3rd International Congress on Rock Mechanics, Denver, CO, USA, 1–7 September 1974; Volume 2, pp. 1194–1199. [Google Scholar]
  7. Littlejohn, G.S.; Bruce, D.A. Rock Anchors: State-of-the-Art Part I, Design, Ground Engineering; Foundation Publications Ltd.: London, UK, 1975; pp. 163–175. [Google Scholar]
  8. Egger, P.; Spang, K. Stability Investigations for Ground Improvement by Rock Bolt at a Large Dam. In Proceedings of the VI International Conference ISRM, Montreal, QC, Canada, 30 August–3 September 1987; pp. 349–354. [Google Scholar]
  9. Spang, K.; Egger, P. Action of fully-grouted bolt in jointed rock and factors of influence. Rock Mech. Rock Eng. 1990, 23, 201–229. [Google Scholar] [CrossRef]
  10. Bezuijen, A. Compensation Grouting in Sand: Experiments, Field Experiences and Mechanisms. Ph.D. Thesis, Delft University of Technology, Delft, The Netherlands, 2010. [Google Scholar]
  11. Chen, Y. Experimental study and stress analysis of rock bolt anchorage performance. J. Rock Mech. Geotech. Eng. 2014, 6, 428–437. [Google Scholar] [CrossRef]
  12. Zong, Y.J.; Han, L.J.; Qu, T.; Yang, S.Q. Mechanical properties and failure characteristics of fractured sandstone with grouting and anchorage. Int. J. Min. Sci. Technol. 2014, 24, 165–170. [Google Scholar] [CrossRef]
  13. Ren, M.Y.; Zhang, Q.Y.; Chen, S.Y.; Zhang, L.Y.; Xiang, W. Experimental study on mechanical properties of anchored rock-like material with weak interlayer under uniaxial compression. Geotech. Geol. Eng. 2020, 38, 4545–4556. [Google Scholar] [CrossRef]
  14. Ding, S.; Gao, Y.; Jing, H.; Shi, X.; Qi, Y.; Guo, J. Influence of weak interlayer on the mechanical performance of the bolted rock mass with a single free surface in deep mining. Minerals 2021, 11, 496. [Google Scholar] [CrossRef]
  15. Li, Y.; Zhou, H.; Zhang, L.; Zhu, W.S.; Li, S.C.; Liu, J. Experimental and numerical investigations on mechanical property and reinforcement effect of bolted jointed rock mass. Constr. Build. Mater. 2016, 126, 843–856. [Google Scholar] [CrossRef]
  16. Yang, W.D.; Luo, G.Y.; Bo, C.J.; Wang, L.; Lü, X.X.; Wang, Y.N.; Wang, X.P. Mechanical properties and reinforcement effect of jointed rock mass with pre-stressed bolt. J. Cent. South Univ. 2020, 27, 3513–3530. [Google Scholar] [CrossRef]
  17. Yang, S.Q.; Chen, M.; Huang, Y.H.; Jing, H.W.; Ranjith, P.G. An experimental study on fracture evolution mechanism of a non-persistent jointed rock mass with various anchorage effects by DSCM, AE and X-ray CT observations. Int. J. Rock Mech. Min. Sci. 2020, 134, 104469. [Google Scholar] [CrossRef]
  18. Li, Y.Z.; Tannant, D.D.; Pang, J.Y.; Su, G.S. Experimental and analytical investigation of the shear resistance of a rock joint held by a fully-grouted bolt and subject to large deformations. Transp. Geotech. 2021, 31, 100671. [Google Scholar] [CrossRef]
  19. Zhang, T. Investigation of Microscopic Mechanism of Fracture Process of Granite Based on Three-Dimensional GBM and Multi-Level Force Chain Network; China University of Mining and Technology: Xuzhou, China, 2023. [Google Scholar]
  20. Li, W.; Yu, L.Y.; Zhang, T.; Su, H.J.; Mi, X.Z.; Fan, D.D.; Jin, B. Quantitative Analysis of Grain Size Effect on Tensile Mechanical Behavior of Granite Based on Multi-Level Force Chain Networks. Comput. Part. Mech. 2024, in press. [CrossRef]
  21. Han, G.S.; Jing, H.W.; Zhu, T.T.; Su, H.J. Study on numerical simulation of effect of rock mass fracture on load transfer mechanism of rockbolt. Coal Technol. 2015, 34, 45–48. [Google Scholar]
  22. Kang, Z.Q.; Zhang, X.Y.; Zhao, J.M.; Zhang, S.Q. Effects of “S” type fractured rock anchoring and the distribution rule of stress field. Met. Mines. 2014, 1, 46–49. [Google Scholar]
  23. Saadat, M.; Taheri, A. A numerical approach to investigate the effects of rock texture on the damage and crack propagation of a pre-cracked granite. Comput. Geotech. 2019, 111, 89–111. [Google Scholar] [CrossRef]
  24. Wu, D.Y.; Yu, L.Y.; Su, H.J.; Wu, J.Y.; Liu, R.C.; Zhou, J. Experimental study and PFC3D simulation on crack propagation of fractured rock-like specimens with bolts under uniaxial compression. Rock Soil Mech. 2021, 42, 1681–1692. [Google Scholar]
  25. Chen, M. Study on the Deformation Failure behavior and Reinforcement Effect of Bolts of Non-Persistent Jointed Rock; China University of Mining and Technology: Xuzhou, China, 2019. [Google Scholar]
  26. Xu, Y.; Dai, F.; Xu, N.W.; Zhao, T. Numerical investigation of dynamic rock fracture toughness determination using a semi-circular bend sample in split Hopkinson pressure bar testing. Rock Mech. Rock Eng. 2016, 49, 731–745. [Google Scholar] [CrossRef]
  27. Huang, Y.H.; Yang, S.Q.; Ranjith, P.G.; Zhao, J. Strength failure behavior and crack evolution mechanism of granite containing pre-existing non-coplanar holes: Experimental study and particle flow modeling. Comput. Geotech. 2017, 88, 182–198. [Google Scholar] [CrossRef]
  28. Zhang, X.P.; Wang, G.; Jiang, Y.J.; Wu, X.Z.; Wang, Z.C.; Huang, N. Simulation research on granite compression test based on particle discrete element model. Rock Soil Mech. 2014, 35, 99–105. [Google Scholar]
  29. Du, H.B.; Dai, F.; Xu, Y.; Liu, Y.; Xu, H.N. Numerical investigation on the dynamic strength and failure behavior of rocks under hydrostatic confinement in SHPB testing. Int. J. Rock Mech. Min. Sci. 2018, 108, 43–57. [Google Scholar] [CrossRef]
  30. Zhang, Y.; Ding, Z.Q.; Fang, C.; Cong, B.T. Three-dimensional Discrete Element Simulation on Macro-Micro Mechanical Properties of Granite under Triaxial Cyclic Loading and Unloading. Min. Res. Dev. 2019, 39, 149–156. [Google Scholar]
  31. Cowie, S.; Walton, G. The effect of mineralogical parameters on the mechanical properties of granitic rocks. Eng. Geol. 2018, 240, 204–225. [Google Scholar] [CrossRef]
  32. Luo, X.Y.; Cao, P.; Liu, T.Y.; Zhao, Q.X.; Meng, G.; Fan, Z.; Xie, W.P. Mechanical behaviour of anchored rock containing weak interlayer under uniaxial compression: Laboratory test and coupled DEM-FEM Simulation. Minerals 2022, 12, 492. [Google Scholar] [CrossRef]
  33. Fan, D.D.; Zhang, T.; Yu, L.Y.; Hu, L.H.; Su, H.J.; Wei, J.B. A numerical study based on GBM3D-DEM model: Multi-level force chain analysis in dynamic flexural tensile strength test. J. Cent. South Univ. 2023, 30, 3821–3839. [Google Scholar] [CrossRef]
  34. Peng, Y.X.; Zhang, T.; Yu, L.Y.; Li, J.; Gao, Y.A.; Tian, W.L. Numerical investigation on the effect of intergranular contact bonding strength on the mechanical properties of granite using PFC3D-GBM. Int. J. Numer. Anal. Methods Geomech. 2023, 47, 694–716. [Google Scholar] [CrossRef]
  35. Potyondy, D.O.; Cundall, P.A. A bonded-particle model for rock. Int. J. Rock Mech. Min. Sci. 2004, 41, 1329–1364. [Google Scholar] [CrossRef]
  36. Potyondy, D.O. The bonded-particle model as a tool for rock mechanics research and application: Current trends and future directions. Geosyst. Eng. 2015, 18, 1–28. [Google Scholar] [CrossRef]
  37. Peng, J.; Wong, L.N.Y.; Teh, C.I.; Li, Z.H. Modeling micro-cracking behavior of Bukit Timah granite using grain-based model. Rock Mech. Rock Eng. 2018, 51, 135–154. [Google Scholar] [CrossRef]
  38. Li, X.F.; Zhang, Q.B.; Li, H.B.; Zhao, J. Grain-based discrete element method (GB-DEM) modelling of multi scale fracturing in rocks under dynamic loading. Rock Mech. Rock Eng. 2018, 51, 3785–3817. [Google Scholar] [CrossRef]
  39. Tian, W.L.; Yang, S.Q.; Huang, Y.H. Particle flow analysis of mechanical behavior and meso-mechanism of sandstone under unloading conditions. Rock Soil Mech. 2016, 37, 775–782. [Google Scholar]
  40. Zhang, L. Numerical simulations of the direct shear test. Chem. Eng. Technol. 2003, 26, 109–228. [Google Scholar]
  41. Leśniewska, D.; Nitka, M.; Tejchman, J.; Pietrzak, M. Contact force network evolution in active earth pressure state of granular materials: Photo-elastic tests and DEM. Granul. Matter 2020, 22, 71. [Google Scholar] [CrossRef]
  42. Wang, S.D.; Miao, Y.H.; Wang, L.B. Effect of grain size composition on mechanical performance requirement for particles in aggregate blend based on photoelastic method. Constr. Build. Mater. 2023, 363, 129808. [Google Scholar] [CrossRef]
  43. Zhang, T.; Yu, L.Y.; Peng, Y.X.; Jing, H.W.; Su, H.J.; Wei, J.B. Effect of the mineral spatial distribution heterogeneity on the tensile strength of granite: Insights from PFC3D-GBM numerical analysis. J. Rock Mech. Geotech. Eng. 2023, 15, 1144–1160. [Google Scholar] [CrossRef]
  44. Zhang, T.; Yu, L.Y.; Wu, B.B.; Tan, Y.Z.; Su, H.J.; Zhou, L.J. Influence of grain-to-particle size ratio on the tensile mechanical response of granite based on a novel three-dimensional grain-based model. Eng. Fract. Mech. 2022, 29, 108161. [Google Scholar] [CrossRef]
  45. Wang, G.; Yuan, K.; Jiang, Y.J.; Wu, X. Macro-micro mechanical on joint -grout-bolt interaction in rockmass subjected to shear loading. J. Cent. South Univ. Sci. Technol. 2015, 46, 2207–2215. [Google Scholar]
  46. Huang, Y.H.; Yang, S.Q.; Tian, W.L.; Wu, S.Y. Experimental and DEM study on failure behavior and stress distribution of flawed sandstone samples under uniaxial compression. Theor. Appl. Fract. Mech. 2022, 118, 103266. [Google Scholar] [CrossRef]
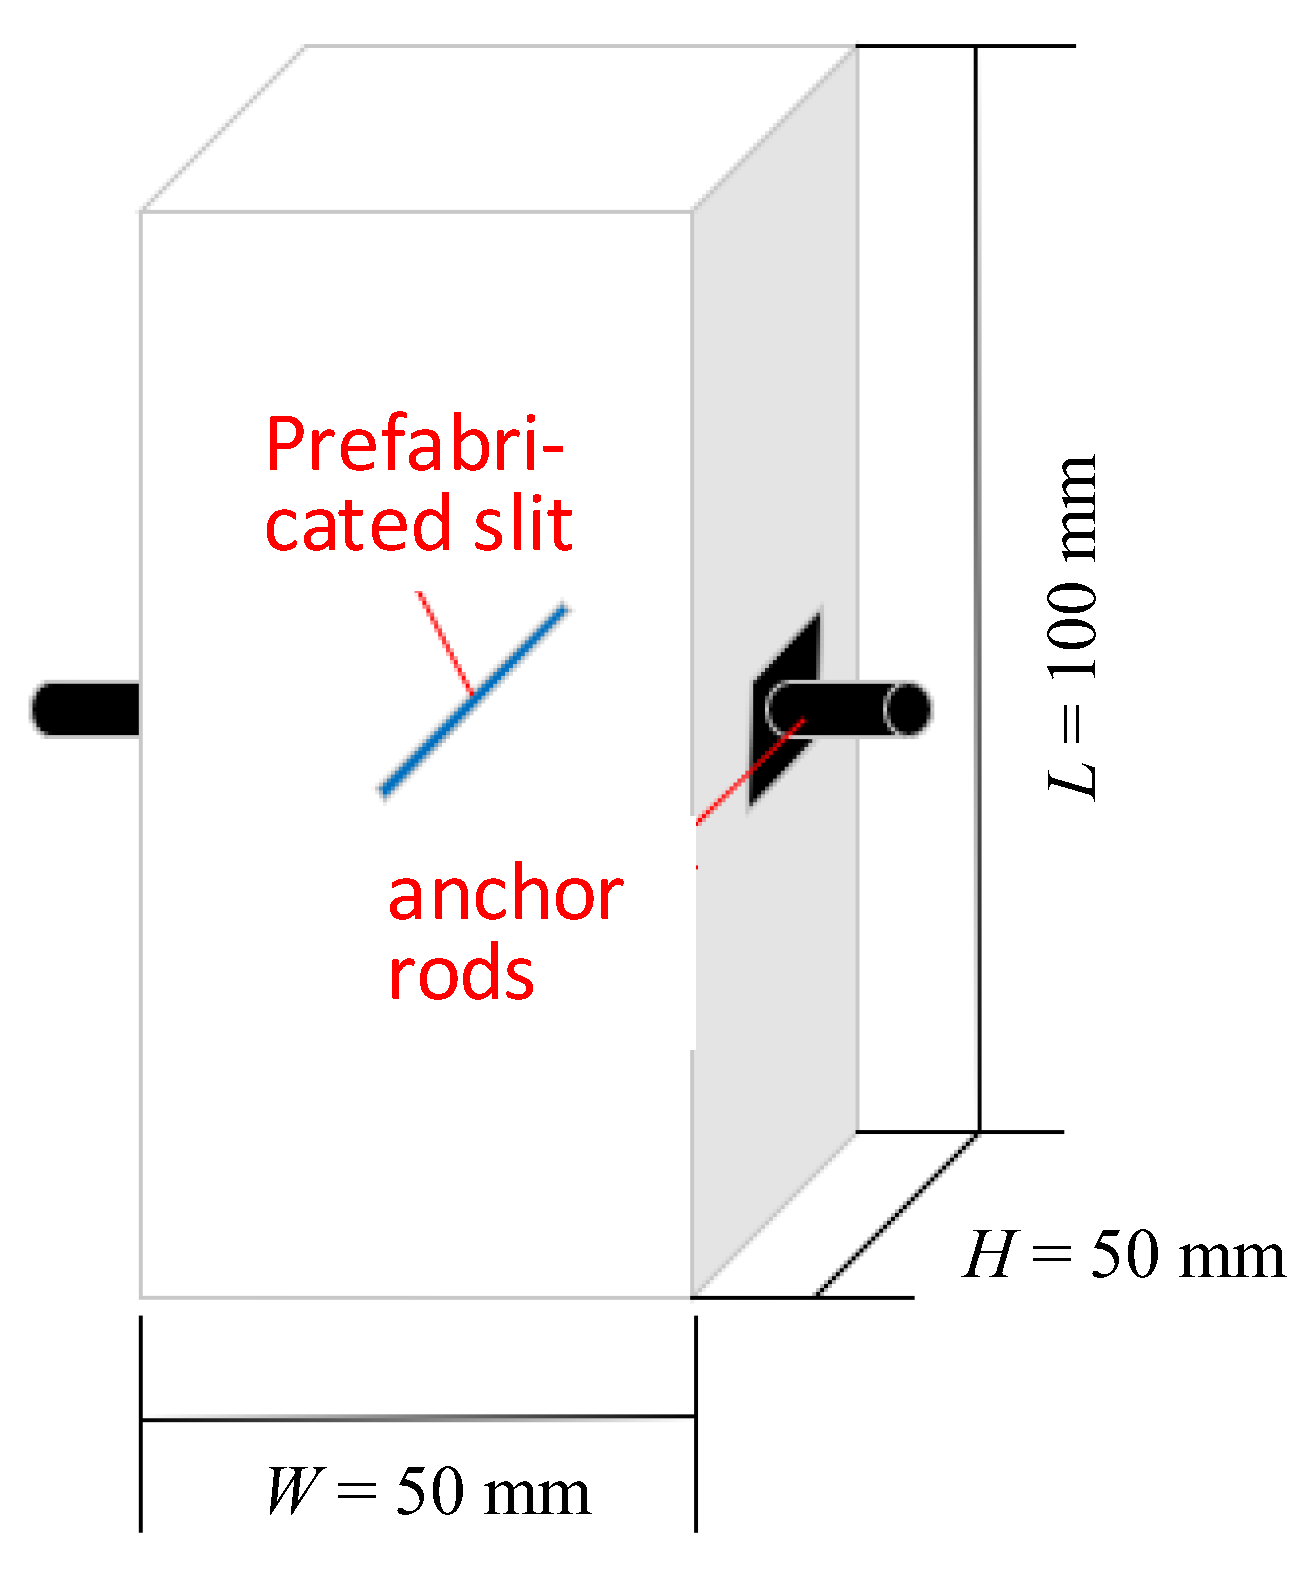
Figure 1. Diagram of anchored granite sample.
Applsci 14 08548 g001
Figure 2. Test equipment and deformation failure monitoring device.
Applsci 14 08548 g002
Figure 3. Process of constructing 3D GBM of granite.
Applsci 14 08548 g003
Figure 4. Three-dimensional rose diagram form of force chain orientation distribution.
Applsci 14 08548 g004
Figure 5. Comparison of uniaxial compression test results.
Applsci 14 08548 g005
Figure 6. Load–displacement curves.
Applsci 14 08548 g006
Figure 7. Variation in displacement field for anchored samples with different αs.
Applsci 14 08548 g007
Figure 8. Comparison of failure modes for samples with different αs.
Applsci 14 08548 g008
Figure 9. Variation in fragment field for numerical samples with different αs.
Applsci 14 08548 g009aApplsci 14 08548 g009b
Figure 10. Evolution of force chain networks of the sample with different αs under uniaxial compression.
Applsci 14 08548 g010
Figure 11. Value distribution of force chains in samples with different αs under uniaxial compression.
Applsci 14 08548 g011
Figure 12. Variations in characteristic values of force chains in samples with different αs under uniaxial compression.
Applsci 14 08548 g012
Figure 13. Variations in orientation distribution of force chains in samples with different αs under different filtering thresholds.
Applsci 14 08548 g013aApplsci 14 08548 g013b
Figure 14. Variations in force chain numbers in samples with different αs under different filtering thresholds.
Applsci 14 08548 g014
Figure 15. Evolution of crack distribution in samples with different αs before peak load.
Applsci 14 08548 g015aApplsci 14 08548 g015b
Figure 16. Variations in orientation distribution and numbers of force chains in samples with different αs under different load levels.
Applsci 14 08548 g016aApplsci 14 08548 g016b
Figure 17. Variation in force chain values required for single crack initiation in samples with different αs.
Applsci 14 08548 g017
Table 1. Micro-parameters of the numerical sample.
Microscopic ParameterNumerical Value
Mineralogical compositionSapphirePlagioclasePotassium feldsparMicasFine mineral
Percentage by volume/%29.442.221.92.64.0
Mineral Radius Minimum RG/mm1.81.41.61.20.65
Mineral radius maximum to minimum ratio rG2.0
Basic unitSapphirePlagioclasePotassium feldsparMicasFine mineral
Radius minimum Rp/mm0.65
Ratio of maximum to minimum radius rp2.0
Density ρp/kg/m326002650300017002400
Modulus of elasticity Ep/GPa62.047.032.027.022.0
Rigidity ratio kn-p/ks-p1.41.61.82.02.2
Friction factor μp0.250.300.400.500.60
Intracrystalline contactQuartz innerPlagioclasePotassium feldsparMicaInside the fine minerals
Modulus of elasticity Ec-tra/GPa62.047.032.027.022.0
Rigidity ratio kn-tra/ks-tra1.41.61.82.02.2
Angle of internal friction ϕtra1214161822
Bonding strength ctra/MPa366.0306.0286.0246.0106.0
Tensile strength σtra/MPa183.0153.0143.0123.083.0
Intergranular contactBetween identical mineralsBetween different minerals
Parallel stiffness ratio kpb-n-ter-s/kpb-s-ter-s2.62.8
Linear stiffness ratio kc-n-ter-s/kc-s-ter-s2.62.8
Friction factor μter-s0.70.8
Angle of internal friction ϕter-s26.028.0
Parallel modulus of elasticity Epb-ter-s/GPa2.52.2
Linear modulus of elasticity Ec-ter-s/GPa2.52.2
Bonding strength cter-s/MPa54.044.0
Tensile strength σter-s/MPa27.022.0
Table 2. Mesoscopic parameters of the interface contact bonding.
Basic Particle PropertiesEffective modulus of elasticity Ec (GPa)20.0
Normal to tangential stiffness ratio kn/ks2.8
Interparticle friction coefficient μ0.65
Parallel bonding modelParallel bonding tensile strength σ (MPa)12.0
Parallel bonding cohesion c (MPa)24.0
Bonding activation gap gc (mm)0.0001
Parallel bonded effective modulus of elasticity Ec (GPa)20.0
Normal to tangential stiffness ratio kn/ks2.8
Friction angle φ (°)45.0
Disclaimer/Publisher’s Note: The statements, opinions and data contained in all publications are solely those of the individual author(s) and contributor(s) and not of MDPI and/or the editor(s). MDPI and/or the editor(s) disclaim responsibility for any injury to people or property resulting from any ideas, methods, instructions or products referred to in the content.