Article

Four-Probe Bridges for In-Line Determination of Thickness and Sidewall Etch Angle of Surface Micromachined Thin Films

College of Computer and Information, Hohai University, No. 8 Fochengxi Road, Jiangning District, Nanjing 211100, China
*
Author to whom correspondence should be addressed.
Appl. Sci. 2018, 8(12), 2424; https://doi.org/10.3390/app8122424
Submission received: 30 October 2018 / Revised: 20 November 2018 / Accepted: 26 November 2018 / Published: 29 November 2018
(This article belongs to the Section Nanotechnology and Applied Nanosciences)

Abstract

:

Featured Application

The proposed structure is used for the characterization of geometrical parameters for surface micromachined thin films at the wafer level, with ordinary wafer-probe test equipment. It has a potential application for in-line quality control in surface fabrication process.

Abstract

Geometrical parameters, such as the thickness and the sidewall etch angle of microelectromechanical systems (MEMS) thin films, are important information for device design and simulation, material property extraction, and quality control in a fabrication process line. This paper presents an in-line test microstructure for measuring geometrical parameters of surface micromachined thin films. The structure consists of four-probe bridges with continuous step structures and deposited at three different angles. The extraction method takes advantage of the resistances of the step structures to determine the thickness and the sidewall etch angle of the phosphosilicate glass (PSG) layer and the thickness of the polysilicon layer. The sheet resistance and the width of the test structure are required for the extraction method and can also be measured by using the test structure. Thicknesses of (2.080 ± 0.011) µm, (2.142 ± 0.012) µm, (1.614 ± 0.014) µm and (2.892 ± 0.012) µm are obtained for the Poly 1 layer, the Oxide 1 layer, the Poly 2 layer and the stacked layer of Oxide 1-Oxide 2, respectively. The sidewall etch angles for the Oxide 1 layer and the stacked layer of Oxide 1-Oxide 2 are obtained as (77.51 ± 0.61)° and (76.17 ± 0.91)°, respectively. In comparison to previously reported thickness measurement approaches, the proposed method is nondestructive, and makes use of four-point probe technique which is featured with electrical input and output configuration, simple operation, low cost, fast response, good repeatability and ease of integration. Therefore, this method is more suited to in-line monitoring the MEMS fabrication process.

1. Introduction

Surface micromachining process is one of the most popular technologies used to manufacture microelectromechanical systems (MEMS) devices. A typical surface micromachining process involves thin films, normally structural and sacrificial layers, alternately deposited on the substrate and patterned. The MEMS parts are made of the structural layer while the sacrificial layer serves as a stable temporary support that can be removed to free the structural layer on top [1]. Polysilicon and phosphosilicate glass (PSG) are often used as the structural and sacrificial material, respectively. The thickness and the sidewall etch angle of polysilicon and PSG thin films are fundamental parameters for quality control in a surface fabrication process line. Besides, the correct thickness is vital for guaranteeing the performance of MEMS devices. On the one hand, mechanical responses of membrane/beam-based MEMS devices, such as mechanical resonance frequency, restoring force, longitudinal strain and deflection, etc., usually depend on the thickness of the structural layer. For example, the mechanical sensitivity of MEMS microphones is influenced by film thickness [2]. Thickness of the membrane has strong effect on the maximum deflection of membrane-based pressure sensor [3]. Thickness and other dimensions determine the resonance frequency of lateral comb drive devices [4]. On the other hand, the thickness of the sacrificial layer limits the longitudinal movement of a freestanding structure. The pull-in voltages of double-clamped beams and cantilever beams, for instance, are both related to the gap between the beam and the ground plane, which is defined the thickness of the sacrificial layer [5]. Moreover, in order to extract mechanical and thermal properties of the thin film, including Young’s modulus, residual stress, thermal conductivity, heat capacity, etc., the knowledge of the film thickness is often required [5,6,7,8]. Therefore, it is very necessary to characterize the thickness and other geometrical parameters of surface micromachined thin films.
There are many available techniques used to measure the thickness and sidewall etch angle of the thin films. Surface profilometer is widely used for the determination of the film thickness and shape information [9]. The measurement method is to prepare thin-film steps and measure them by moving a very sharp stylus tip over the step surface and tracing the stylus at each location. Scanning electron microscope (SEM) is one of effective tools to characterize geometrical parameters of thin films [10]. To obtain the film thickness and sidewall etch angle, the sample is sliced to reveal the cross section of the films and the viewing angle of SEM is aligned to be orthogonal to the sample surface. Another conventional approach to evaluate film thickness is performed by ellipsometers, which are optical instruments that detect the ellipticity of polarized light [11]. The film thickness is extracted by measuring the change in polarization upon reflection or transmission through the film. Various interferometric methods have been developed to determine film thickness [12,13,14,15,16]. These methods are principally divided into single and multiple beam interferometry and basically exploit the reflectance of surfaces as well as the intensity of light. The film thickness is estimated by analyzing interference pattern formation [17].
The aforementioned techniques for determining geometrical parameters are either optical or mechanical methods, most of which uses specific instruments that are time consuming, bulky and expensive. Often the sample has to be broken or to be prepared by metallographic techniques or the focused ion beam technique [18]. Although useful in laboratory investigations, the operations of such methods are inconvenient for batch-fabricated industrial scale measurements or post-packaged measurements, which are in generally not acceptable for in-line tests [19]. The test methods, which are nondestructive and performed at the wafer level, using ordinary wafer-probe test equipment, are much more preferred by foundries. Measurements utilizing electrical input and output are well adapted to this purpose. In addition, electrically-probed test structures offer simple operation, fast response, good repeatability and ease of integration, potentially giving rise to many conceivable applications. Geometrical parameters extracted by such structures and methods could be directly used in the process line for quality control and provide important information for MEMS designers to design, optimize and predict the performance of devices. Works on electrical measurements for geometrical parameters have been reported by using resonance frequency approach [20]. This technique is based on the fusion of analytically calculated and measured resonance frequencies, and a nonlinear least-squares curve fitting analysis is applied to yield geometrical parameters. Laterally resonant comb-drive test structures with prescribed changes in spring width are adopted in this approach. The vibration of the test structure is excited by sweeping the ac drive frequency while resonance is detected by capturing the maximum blur envelope of the test structure under an optical microscope. In order to get more Eigenmodes and hence acquire more reliable data, some researches use Laser Doppler Vibrometry (LDV) instead of the electrical measurements technique to obtain resonance frequencies [18,21]. The test structures based on micro mirrors are used in the LDV method [21]. The change of thickness of the test structures will significantly influence the resonant frequencies of the structures. Another test structure is a spring-mass damping structure [18]. The vibration of the test structure is excited by a sonde on one paddle, and the vibration is measured by a LDV while the laser spot is on the other paddle. The springs are twisted in some modes at low frequencies. This structure is used in MEMS fabricated by DRIE. This resonance frequency approach is only suited for the characterization of the geometry of the structural layer.
In this paper, an in-line test microstructure for measuring geometrical parameters of surface micromachined thin films is presented. Geometrical parameters of both structural and sacrificial layers, e.g., the thickness and the sidewall etch angle of the PSG layer and the thickness of the polysilicon layer, are obtained by the proposed test structure. The measurement method makes use of the additional resistance of polysilicon thin films caused by step structures. A theoretical model for extracting geometrical parameters based on resistance analysis of step structures is developed. The resistance analysis is confirmed by the finite element simulation. Four-point probe technique is adopted in this method and only current-voltage measurements are required in experiments, which is simple, efficient, nondestructive and compatible with standard IC wafer-level probing techniques. The test structure can be fabricated using surface micromachining process and in situ along with active devices on the same chip. We compare our results to those obtained using a SEM. The results are in agreement.

2. Materials and Methods

2.1. Resistance of the Step Structure

Figure 1 shows the schematic diagrams of the step structure. The PSG layer is etched to produce a trench. The polysilicon layer is deposited to cover the trench surfaces and patterned to form the step structure. A single constant sticking coefficient, Src, was found to be sufficient to describe the polysilicon deposition process for a given set of deposition conditions. When Src < 0.01, which is typical of silane-based polysilicon depositions, the distribution of the adsorbed concentration is uniform and the step coverage is conformal [22]. Figure 1a is the 3-D view of a step structure. It is a U-shaped structure with two horizontally extended arms. The width of the structure is w. As displayed in Figure 1b, the resistance of the step structure consists of four parts: the resistance of the arm (Ra), the resistance of the bottom (Rb), the resistance of the sidewall (Rsw) and the resistance of the corner (Rc). According to the law of resistance, the resistance of the step structure (Rstep) can be written as
R s t e p = 2 R S l a w + R S ( l b 2 ε ) w + 2 R S ( t 2 t 1 ) w sin θ + 4 R c ,
with
ε = t 2 t 1 tan θ + t 1 sin θ ,
where RS is the sheet resistance of the polysilicon layer, t1 and t2 are the thicknesses of the polysilicon layer and the PSG layer, respectively, la represents the length of Ra, lb denotes the designed length of the PSG trench, θ stands for the sidewall etch angle.
The method used to calculate the resistances of corners (Rc) is that of conformal transformations. The given pattern is transformed into a pattern with an obvious solution and then transformed back again to solve the desired problem [23,24,25]. Figure 2a shows six possible patterns of corners. The resistance of the corner is expressed as [24]
R c = λ R S t 1 w ,
in which λ is the correction factor due to various shapes of the corners. As discussed extensively in [23,24], the correction factors for corners of type A, type B, type C, type D, type E and type F illustrated in Figure 2a are estimated to be (0.57 ± 0.01), 0.583, 0.317, −0.882, 0.559, and (0.341 ± 0.005), respectively. Figure 2b is a SEM photo for the cross-section view of a step structure manufactured by a standard surface micromachining process. It is observed that the resistances of top corners and bottom corners of the step structure can be approximately estimated by corners of type B (Rc = 0.583RS·t1/w) and type E (Rc = 0.559RS·t1/w), respectively.

2.2. Test Structure and Extraction Model

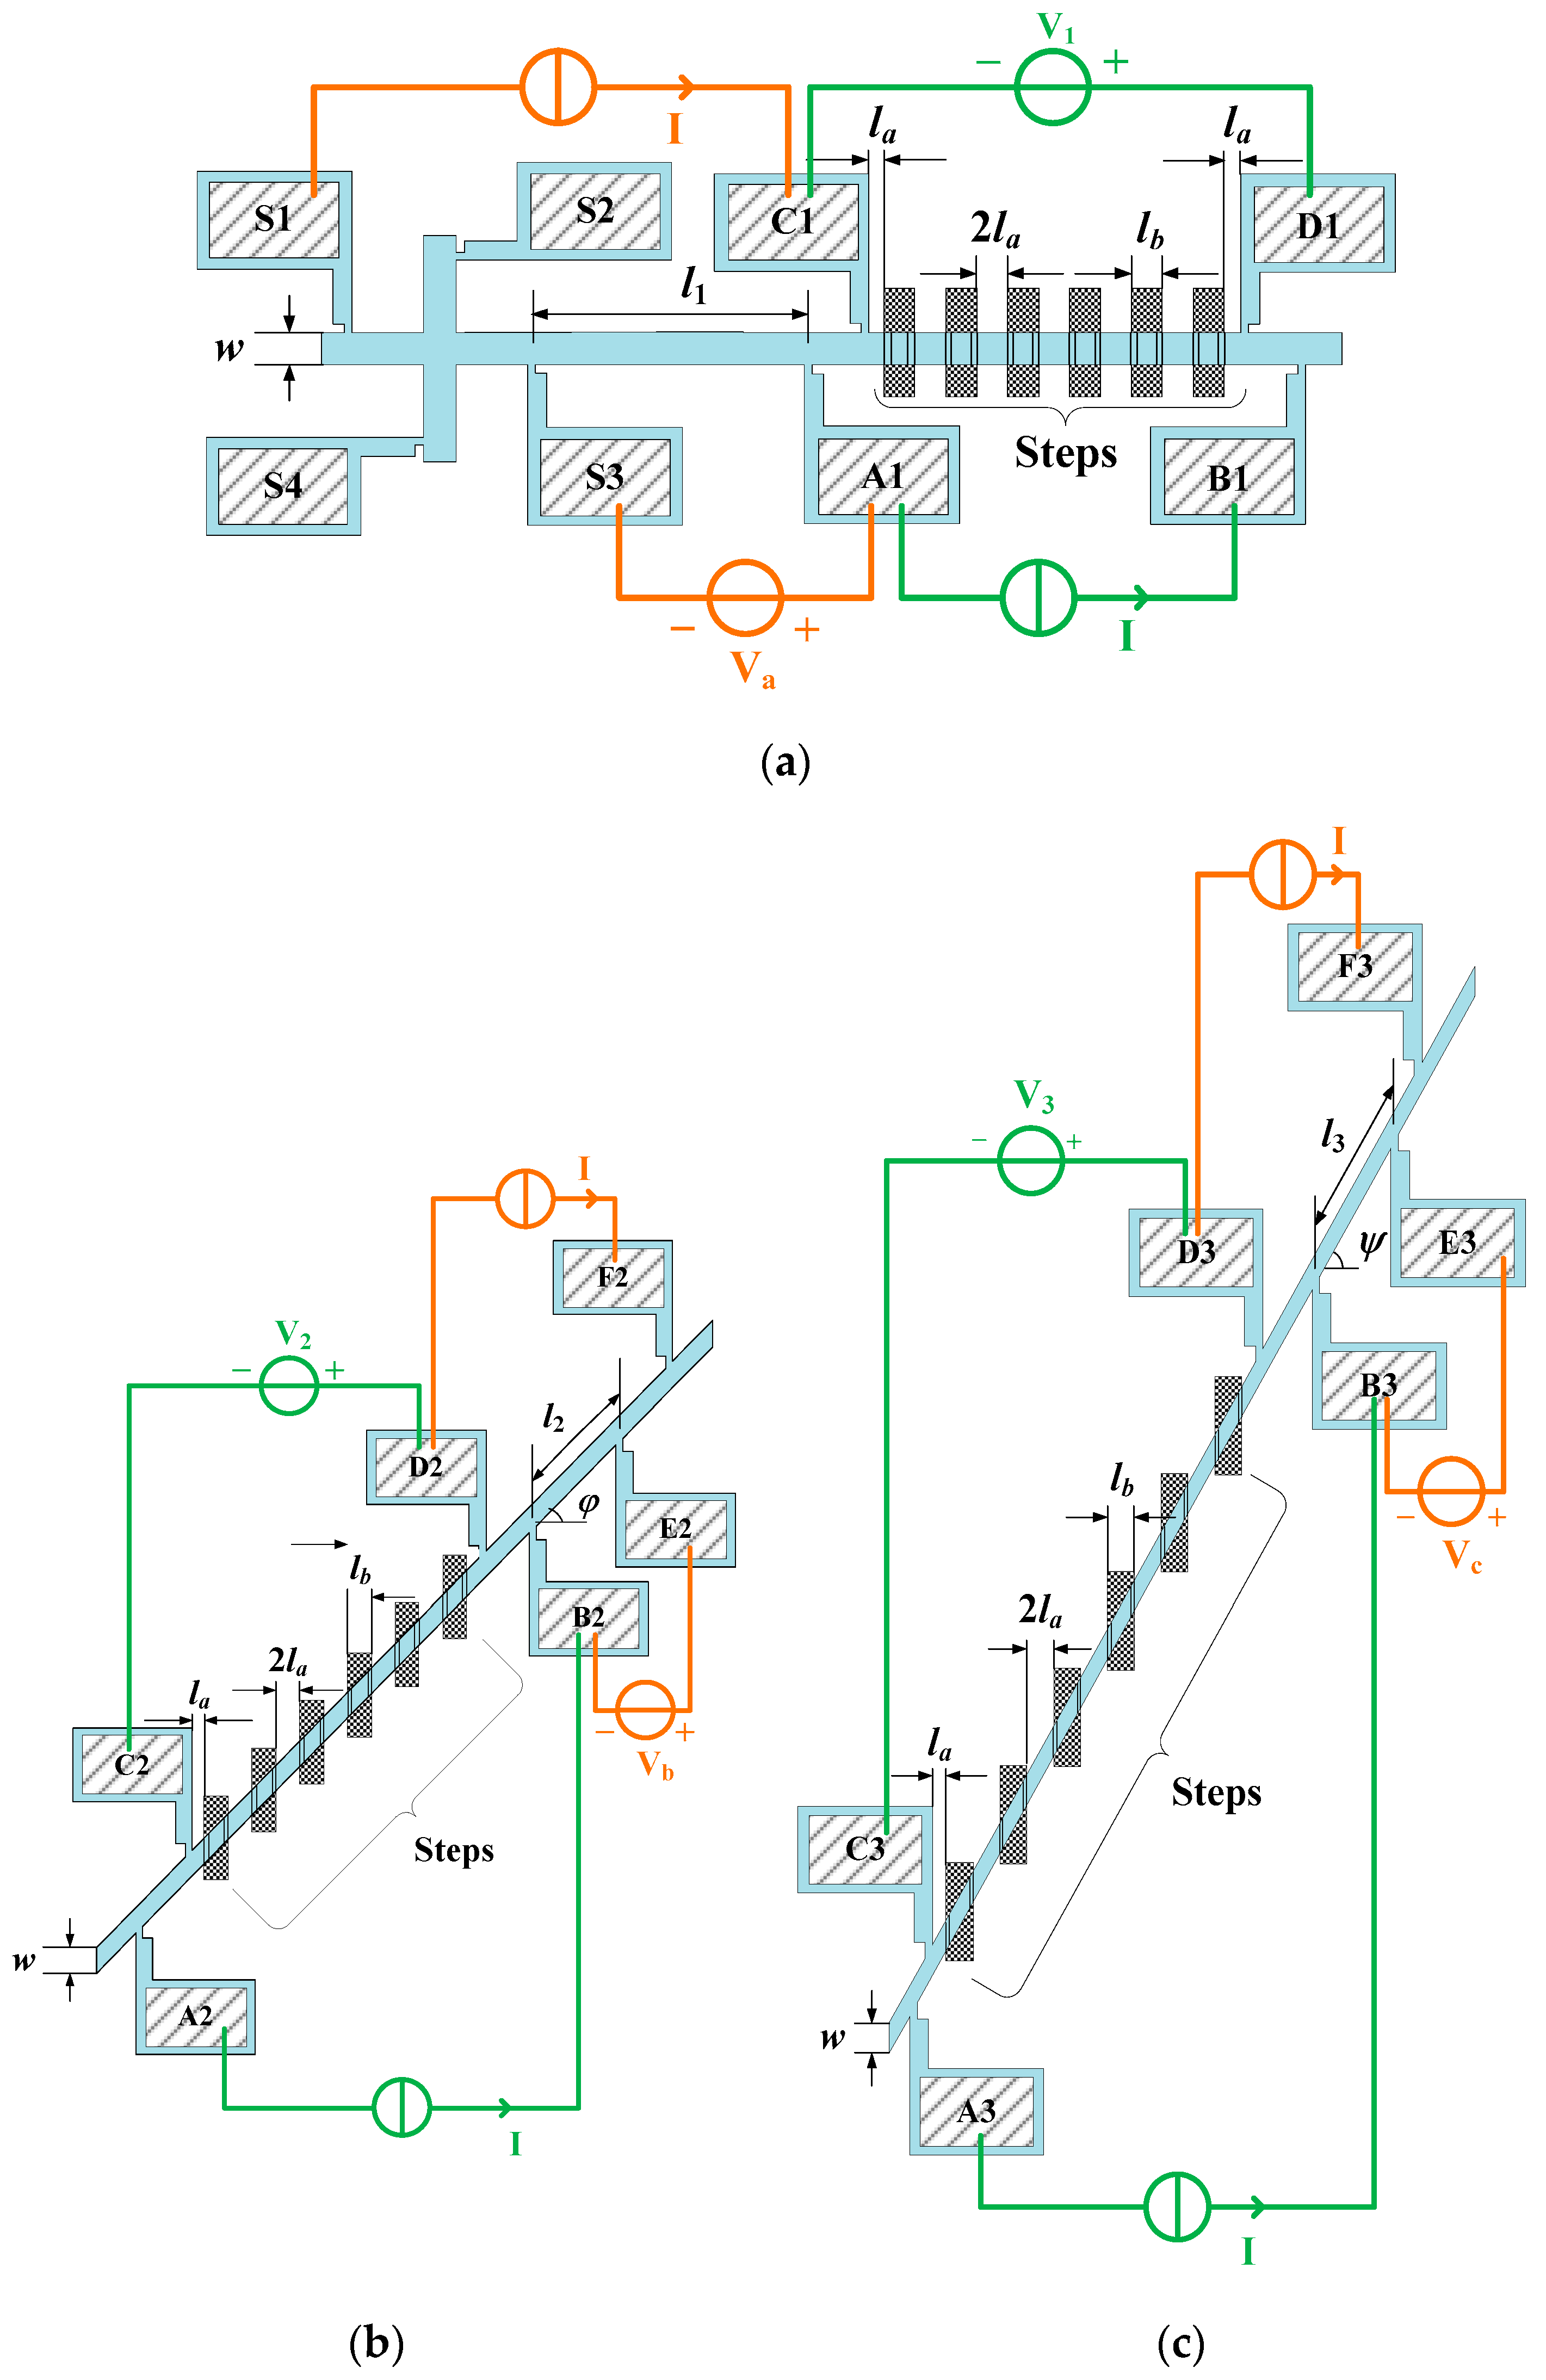
The schematic illustration of the test structure for measuring the thickness and sidewall etch angle of MEMS thin films is shown in Figure 3. It consists of three units, which deposited horizontally and at an angle of φ (0° < φ < 90°) and ψ (0° < ψ < 90°, φψ), respectively. The first unit is composed of a Greek cross structure and a four-probe bridge containing several continuous step structures (see Figure 3a). All step structures have the same dimension. The widths of the cross and the bridge are identical, and the bridge is deposited horizontally. The second unit consists of two four-probe bridges deposited at an angle of φ (see Figure 3b). The left bridge is comprised of several continuous step structures, while the right bridge is deposited on the flat surface of the PSG layer and shares two probes with the left bridge. The third unit is similar to the second unit, with the only difference of the angle of four-probe bridges (see Figure 3c). The dimensions of these three units are illustrated in Figure 3.
Greek cross structure is used to evaluate the sheet resistance [26]. Based on Van der Pauw theory, the sheet resistance of polysilicon thin film can be obtained by [27]
R S = π ln 2 ( V S 1 S 2 + V S 2 S 3 ) 2 I ,
where I is the applied current, VS1S2 is the potential different between pads S1 and S2 when the current is passed between pads S4 and S3, VS2S3 is the potential different between pads S2 and S3 when the current is forced between pads S1 and S4. The width of the bridges can be estimated as [28]
w = R S l 1 I V a ,
in which l1 is the length between contacts S3 and A1, Va is the potential different between pads A1 and S3 when the current I is applied between pads C1 and S1.
To use the test structure to obtain the thickness and sidewall etch angle of thin films, a current I is passed between contacts B1-A1, B2-A2, B3-A3, F2-D2, and F3-D3, while the potential different between pads D1-C1, D2-C2, D3-C3, E2-B2, and E3-B3 are measured as V1, V2, V3, Vb, and Vc (see Figure 3). The resistances of continuous step structures of the three units can be derived from Equations (1)–(3)
R 1 = n { 2 R S l a w + R S w [ l b 2 ( t 2 t 1 ) cos θ + 2 t 1 sin θ ] + 2 R S ( t 2 t 1 ) w sin θ + γ R S t 1 w } ,
R 2 = n { 2 R φ l a l 2 cos φ + R φ l 2 [ l b cos φ 2 ( t 2 t 1 ) cos θ + 2 t 1 sin θ ] + 2 R φ ( t 2 t 1 ) l 2 cos φ sin θ + γ R S t 1 w } ,
R 3 = n { 2 R ψ l a l 3 cos ψ + R ψ l 3 [ l b cos ψ 2 ( t 2 t 1 ) cos θ + 2 t 1 sin θ ] + 2 R ψ ( t 2 t 1 ) l 3 cos ψ sin θ + γ R S t 1 w } ,
where R1 = V1/I, R2 = V2/I, R3 = V3/I, Rφ = Vb/I, Rψ = Vc/I, l2 and l3 are the lengths of the right bridges of Unit 2 and Unit 3, respectively, n is the number of the step structures in each unit, γ is the total correction factor for the four corners of each step structure (γ = 2 × (0.559 + 0.583) = 2.284).
By solving Equations (6)–(8), one obtains
t 1 = w [ R 1 R φ R ψ w ( cos φ cos ψ ) + R 2 l 2 R S R ψ cos φ ( cos ψ 1 ) + R 3 l 3 R S R φ cos ψ ( 1 cos φ ) ] n γ R S [ R φ R ψ w ( cos φ cos ψ ) + l 2 R S R ψ cos φ ( cos ψ 1 ) + l 3 R S R φ cos ψ ( 1 cos φ ) ] ,
t 2 = t 1 + 1 2 d ( N 1 + N 2 ) 1 / 2 + 1 2 d [ 2 N 1 N 2 + 4 t 1 ε d 2 ( N 1 + N 2 ) 1 / 2 ] 1 / 2 ,
sin θ = 1 2 { ( N 1 + N 2 ) 1 / 2 + [ 2 N 1 N 2 + 4 t 1 ε d 2 ( N 1 + N 2 ) 1 / 2 ] 1 / 2 } ,
with
ε = 1 2 n M [ R S ( R 2 R 3 ) + w R φ l 2 cos φ ( R 3 R 1 ) + w R ψ l 3 cos ψ ( R 1 R 2 ) ] ,
d = 1 2 n M [ R S ( R 2 R 3 ) + w R φ l 2 ( R 3 R 1 ) + w R ψ l 3 ( R 1 R 2 ) + n M 4 ( l b + 2 l a ) ] ,
M = R S ( R φ l 2 R ψ l 3 ) + R S ( R ψ l 3 cos ψ R φ l 2 cos φ ) + w R φ l 2 R ψ l 3 ( 1 cos φ 1 cos ψ ) ,
N 1 = 2 3 [ 1 ( ε d ) 2 ] ,
N 2 = 2 1 / 3 ( d 4 + 12 d 2 t 1 2 2 d 2 ε 2 + ε 4 ) 3 d 2 A + A 3 × 2 1 / 3 d 2 ,
A = { B + B 2 4 [ 12 d 2 t 1 2 + ( ε 2 d 2 ) 2 ] 3 } 1 / 3 ,
B = 36 d 2 t 1 2 ( ε 2 + 2 d 2 ) + 2 ( ε 2 d 2 ) 3 .
Since R1, R2, R3, Rφ and Rψ are measured by four-point probe technique, and Rs and w are obtained from Equations (4) and (5), the thickness of the polysilicon layer (t1), the thickness of the PSG layer (t2) and the sidewall etch angle of the PSG layer (θ) can be determined from Equations (9)–(11).

2.3. Fabrication Process and Experimental Setup

The four-probe bridges were fabricated using the Polysilicon Multi-User MEMS Processes (PolyMUMPsTM). PolyMUMPs process is a standard surface micromachining fabrication process with three polysilicon layers, two sacrificial layers and one metal layer. The process begins with (100) silicon wafers, which are first covered with a 600 nm thick silicon nitride layer as a dielectric isolation layer. A 500 nm low-stress low pressure chemical vapor deposition (LPCVD) polysilicon layer (Poly 0) is deposited on the surface of the wafer and patterned by photolithography and plasma etching techniques. After the first polysilicon layer is fabricated, a 2 µm thick PSG layer (Oxide 1) is deposited and patterned, followed by the fabrication of a 2 µm thick polysilicon layer (Poly 1). Then, another PSG layer (Oxide 2) is deposited at a thickness of 750 nm. After the PSG layer is etched, a 1.5 µm thick polysilicon layer (Poly 2) is deposited on the surface of the PSG layer and patterned. Both Poly 1 layer and Poly 2 layer are used as the structural materials for four-probe bridges, while the single layer of Oxide 1 and the stacked layer of Oxide 1-Oxide 2 are served as the etched sacrificial layers so that the following deposited polysilicon layer can be patterned to form the step structures. The final deposited layer is a 0.5 µm thick gold layer that used for probing [29].
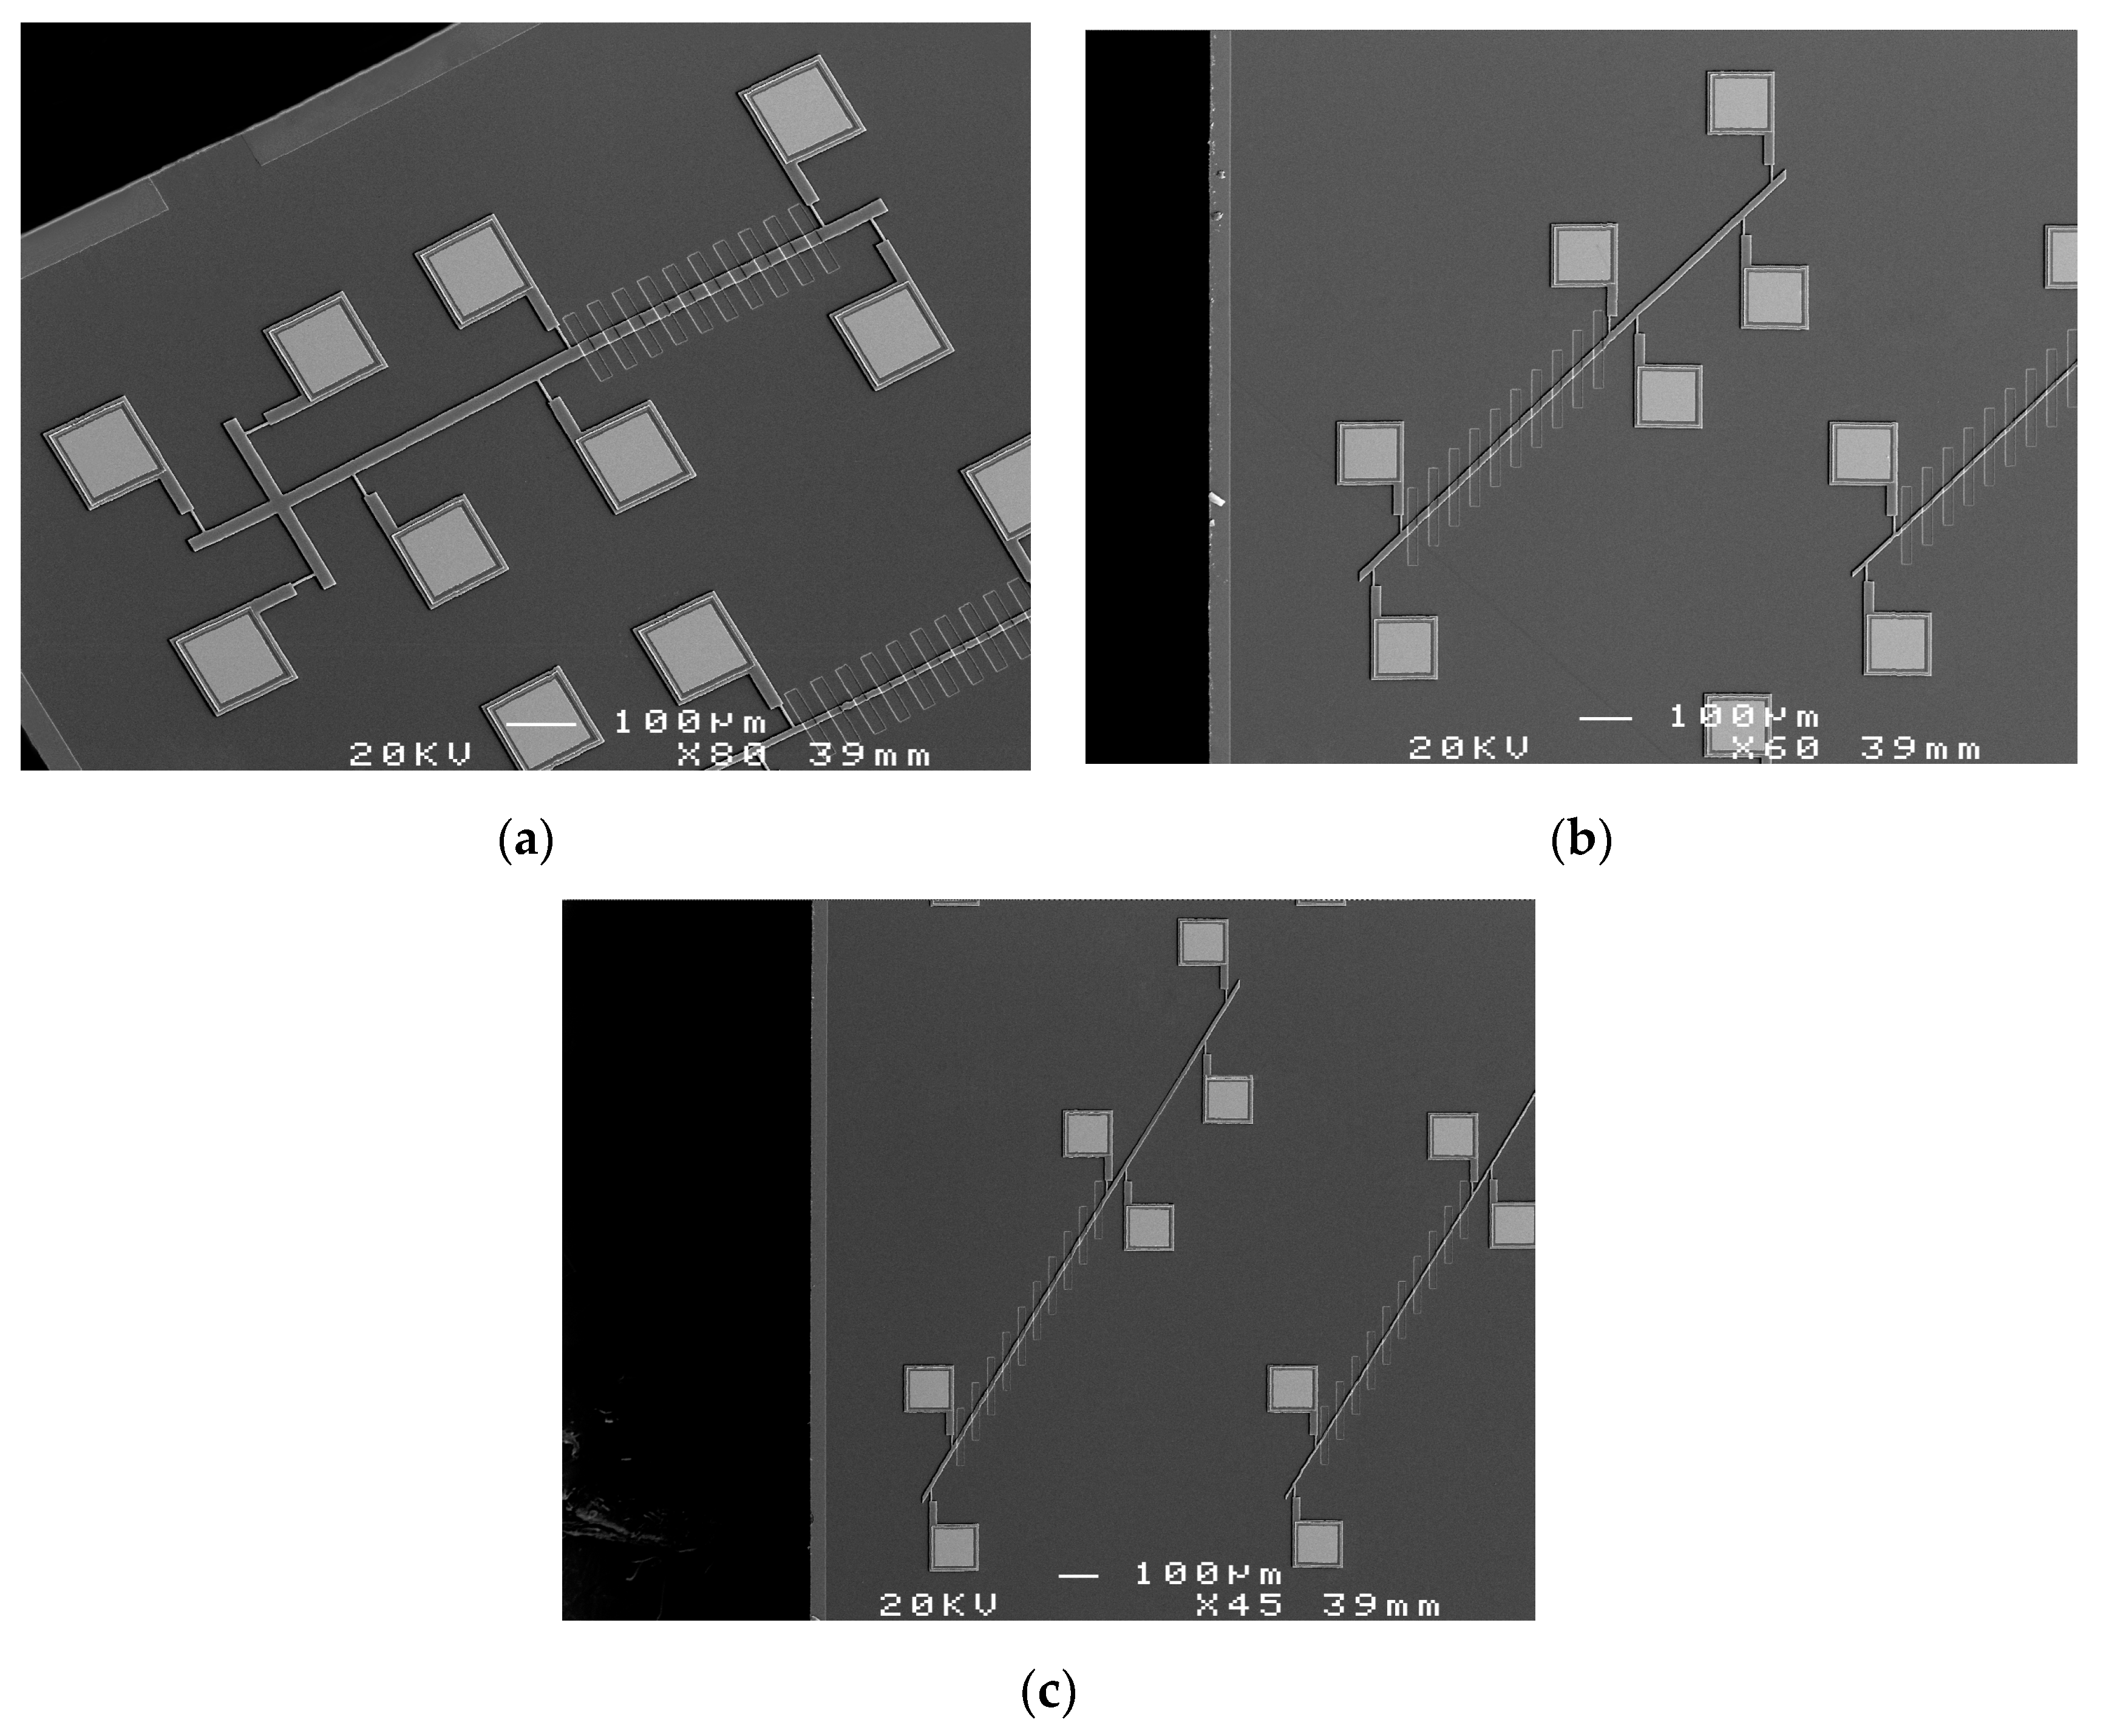
The SEM photographs of the test structure are displayed in Figure 4. Each unit contains 10 continuous step structures. The bridges are deposited horizontally and at an angle of 45° and 60°, respectively.
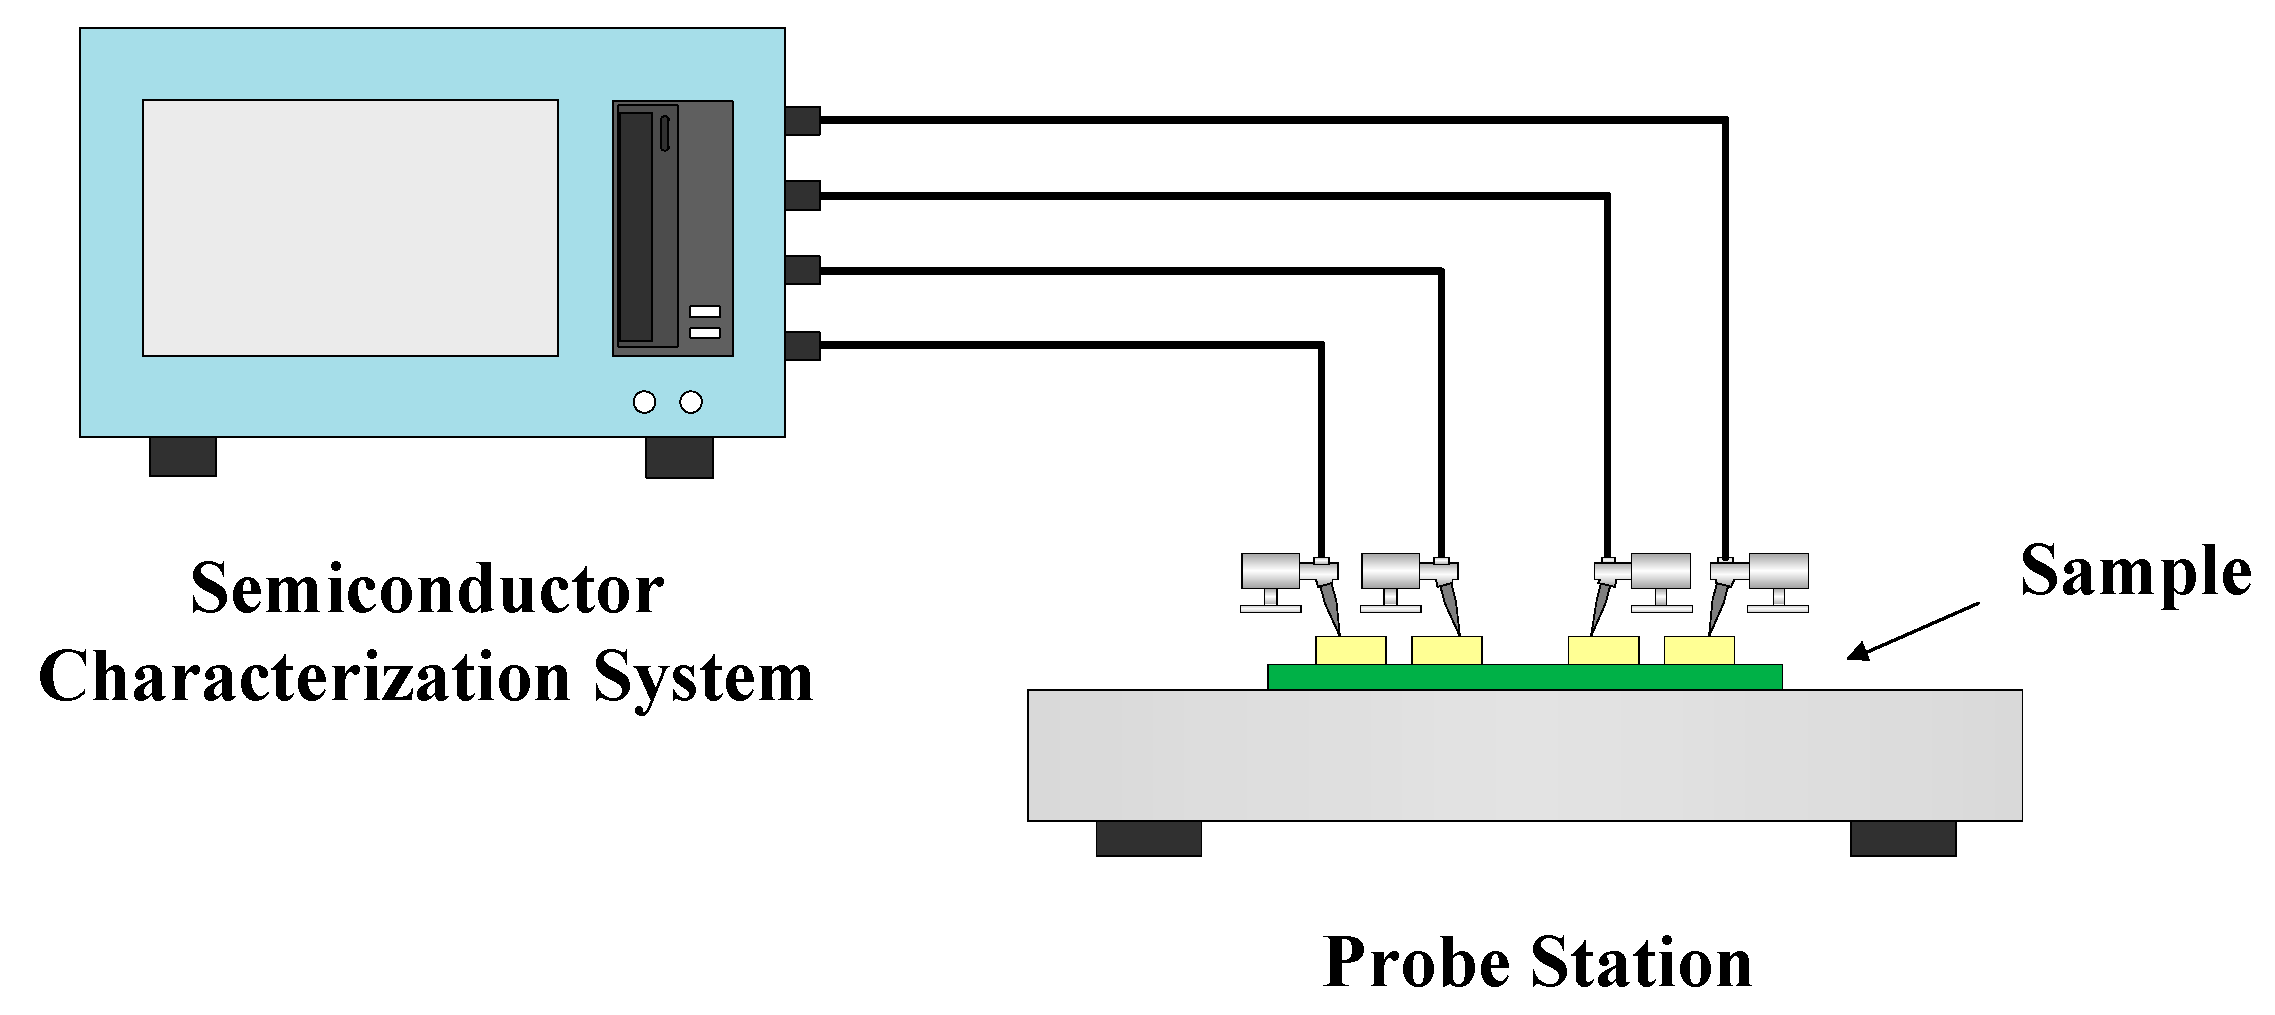
Schematic diagram of the experiment system is depicted in Figure 5. It contains a semiconductor characterization system (Keithley 4200-SCS) and a probe station. The experiments are performed using four-point probe technique. The measurement method is presented as follows. First, a Van der Pauw test is performed on the Greek cross structure. The sheet resistance of polysilicon thin film is then extracted by Equation (4). Then, a current I is applied between pads C1 and S1 while the potential different between pads A1 and S3 (Va) is measured. The width of the bridges is obtained from Equation (5). Resistances between pads C1 and D1, C2 and D2, C3 and D3, B2 and E2, B3 and E3 are measured by using four-probe I-V measurement method. The thickness of the polysilicon layer and the PSG layer and the sidewall etch angle of the PSG layer are then calculated from Equations (9)–(11).

3. Results

3.1. Simulation Results

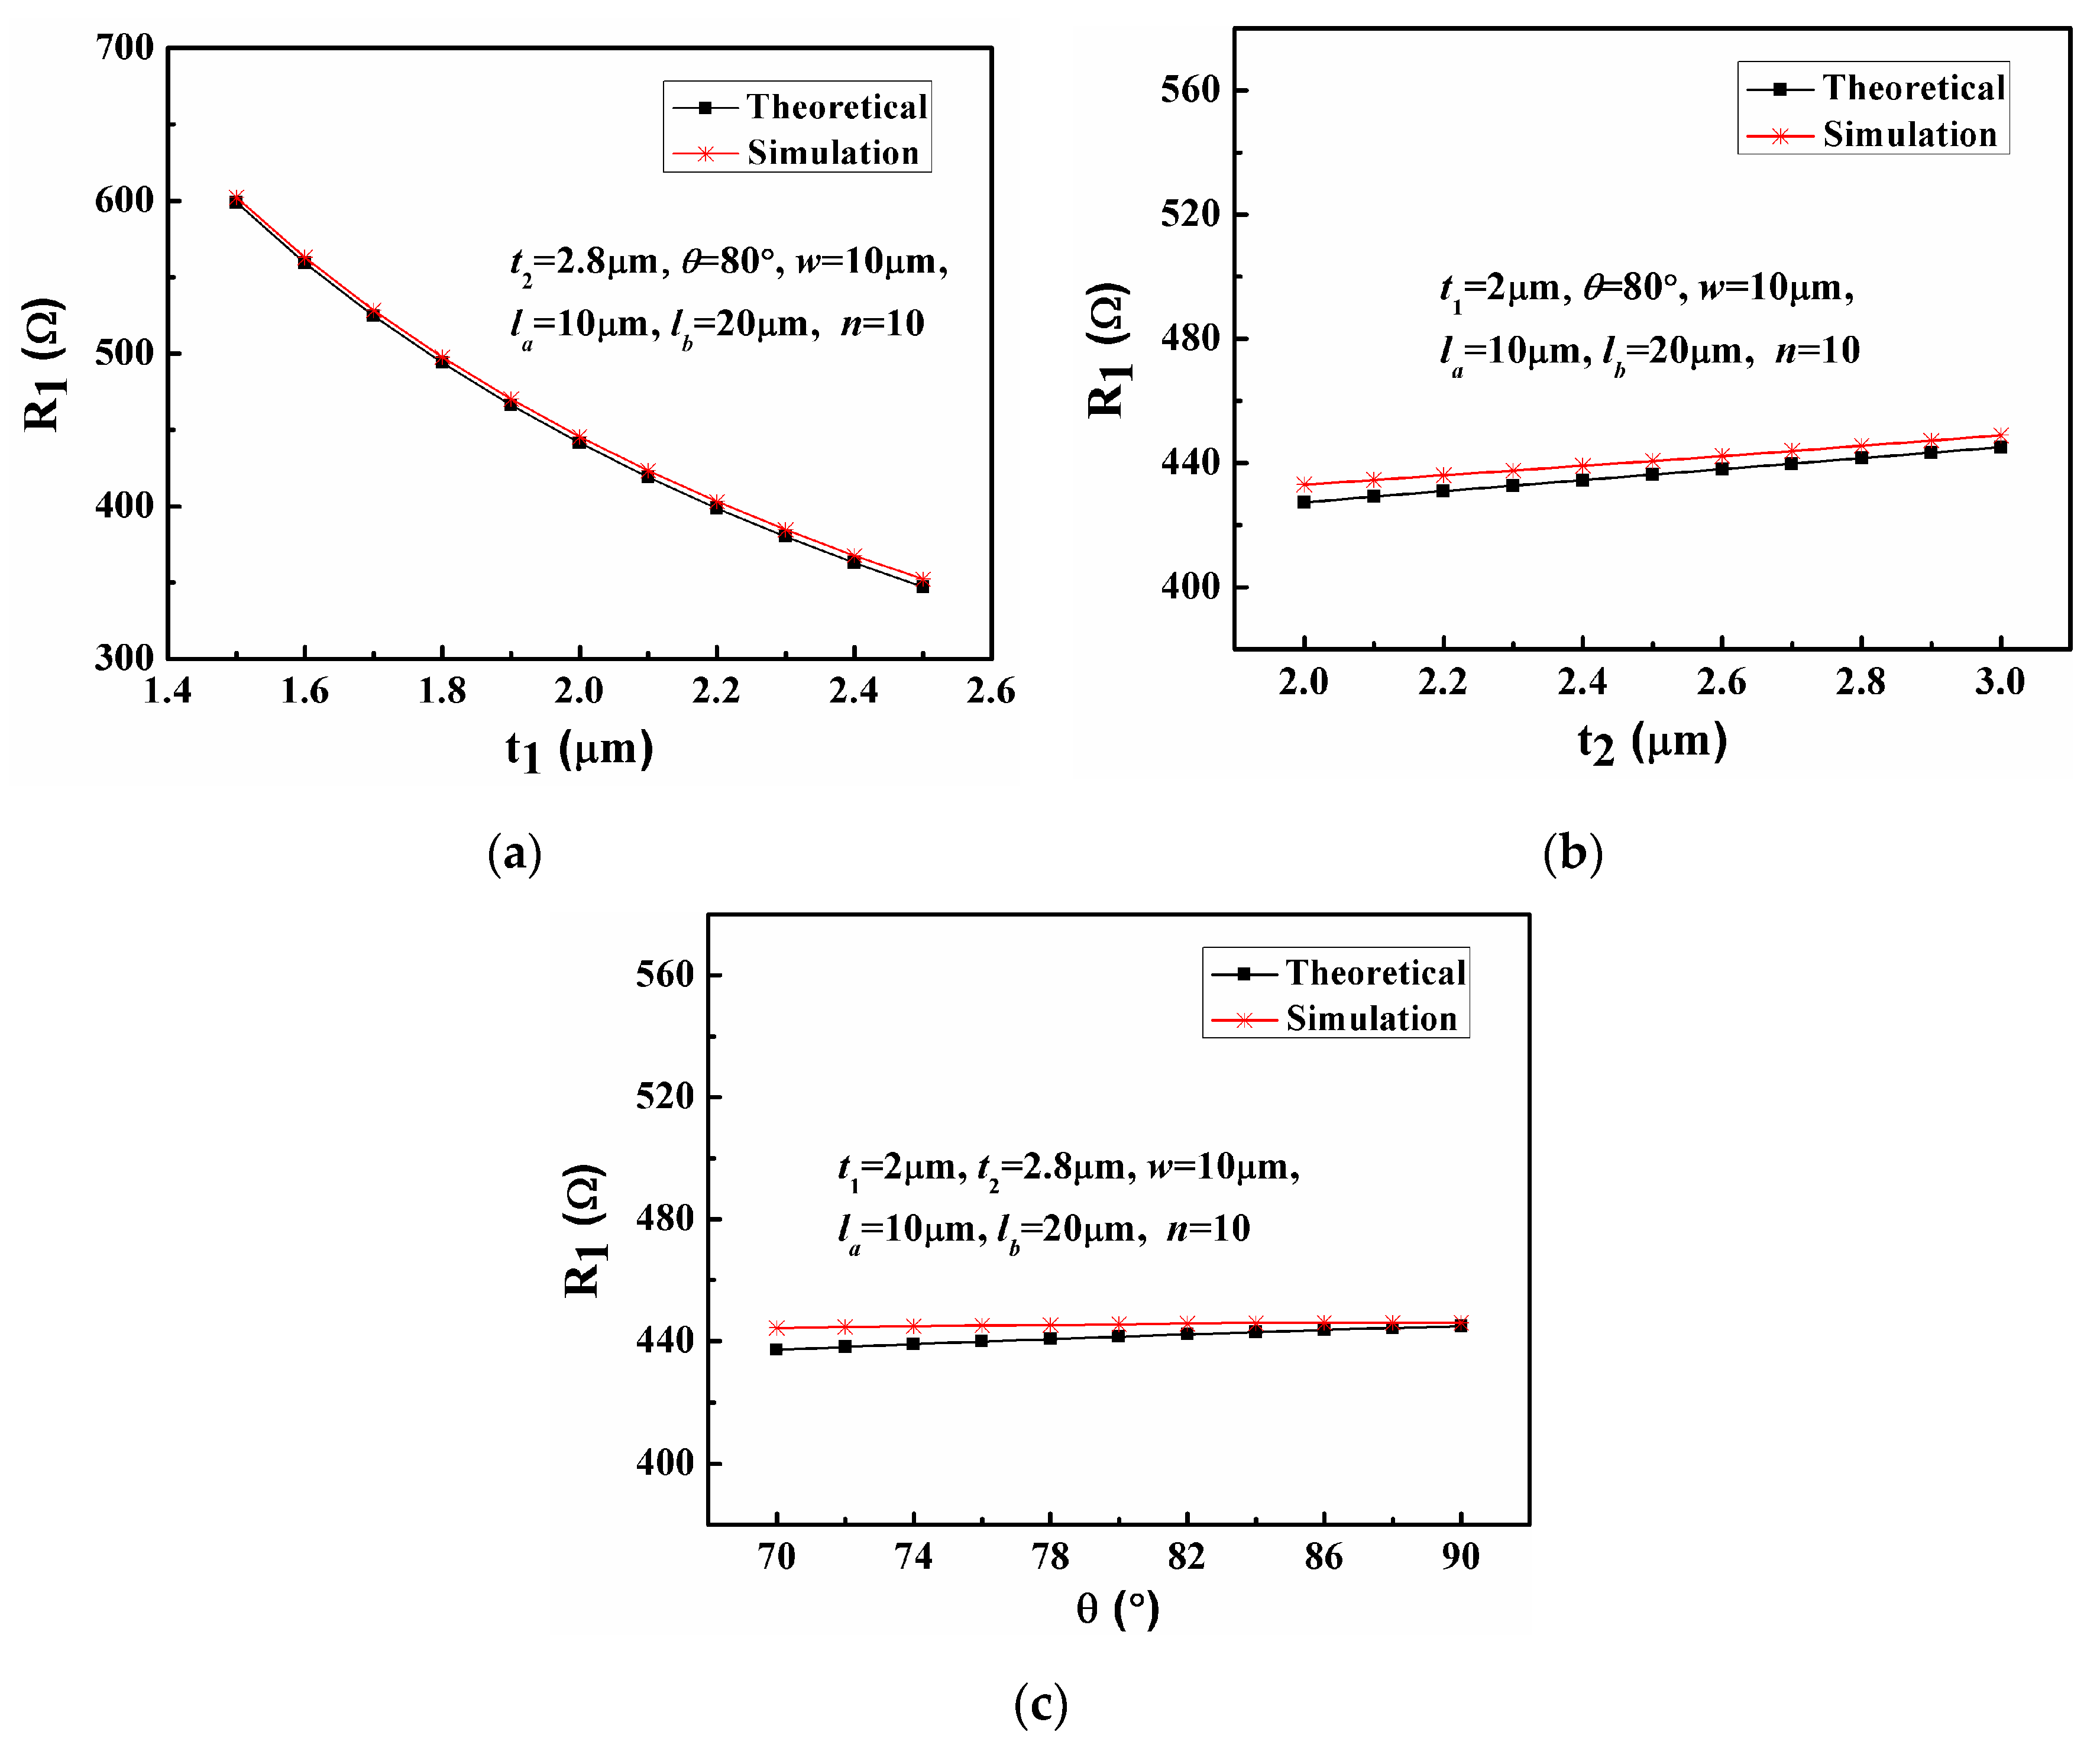
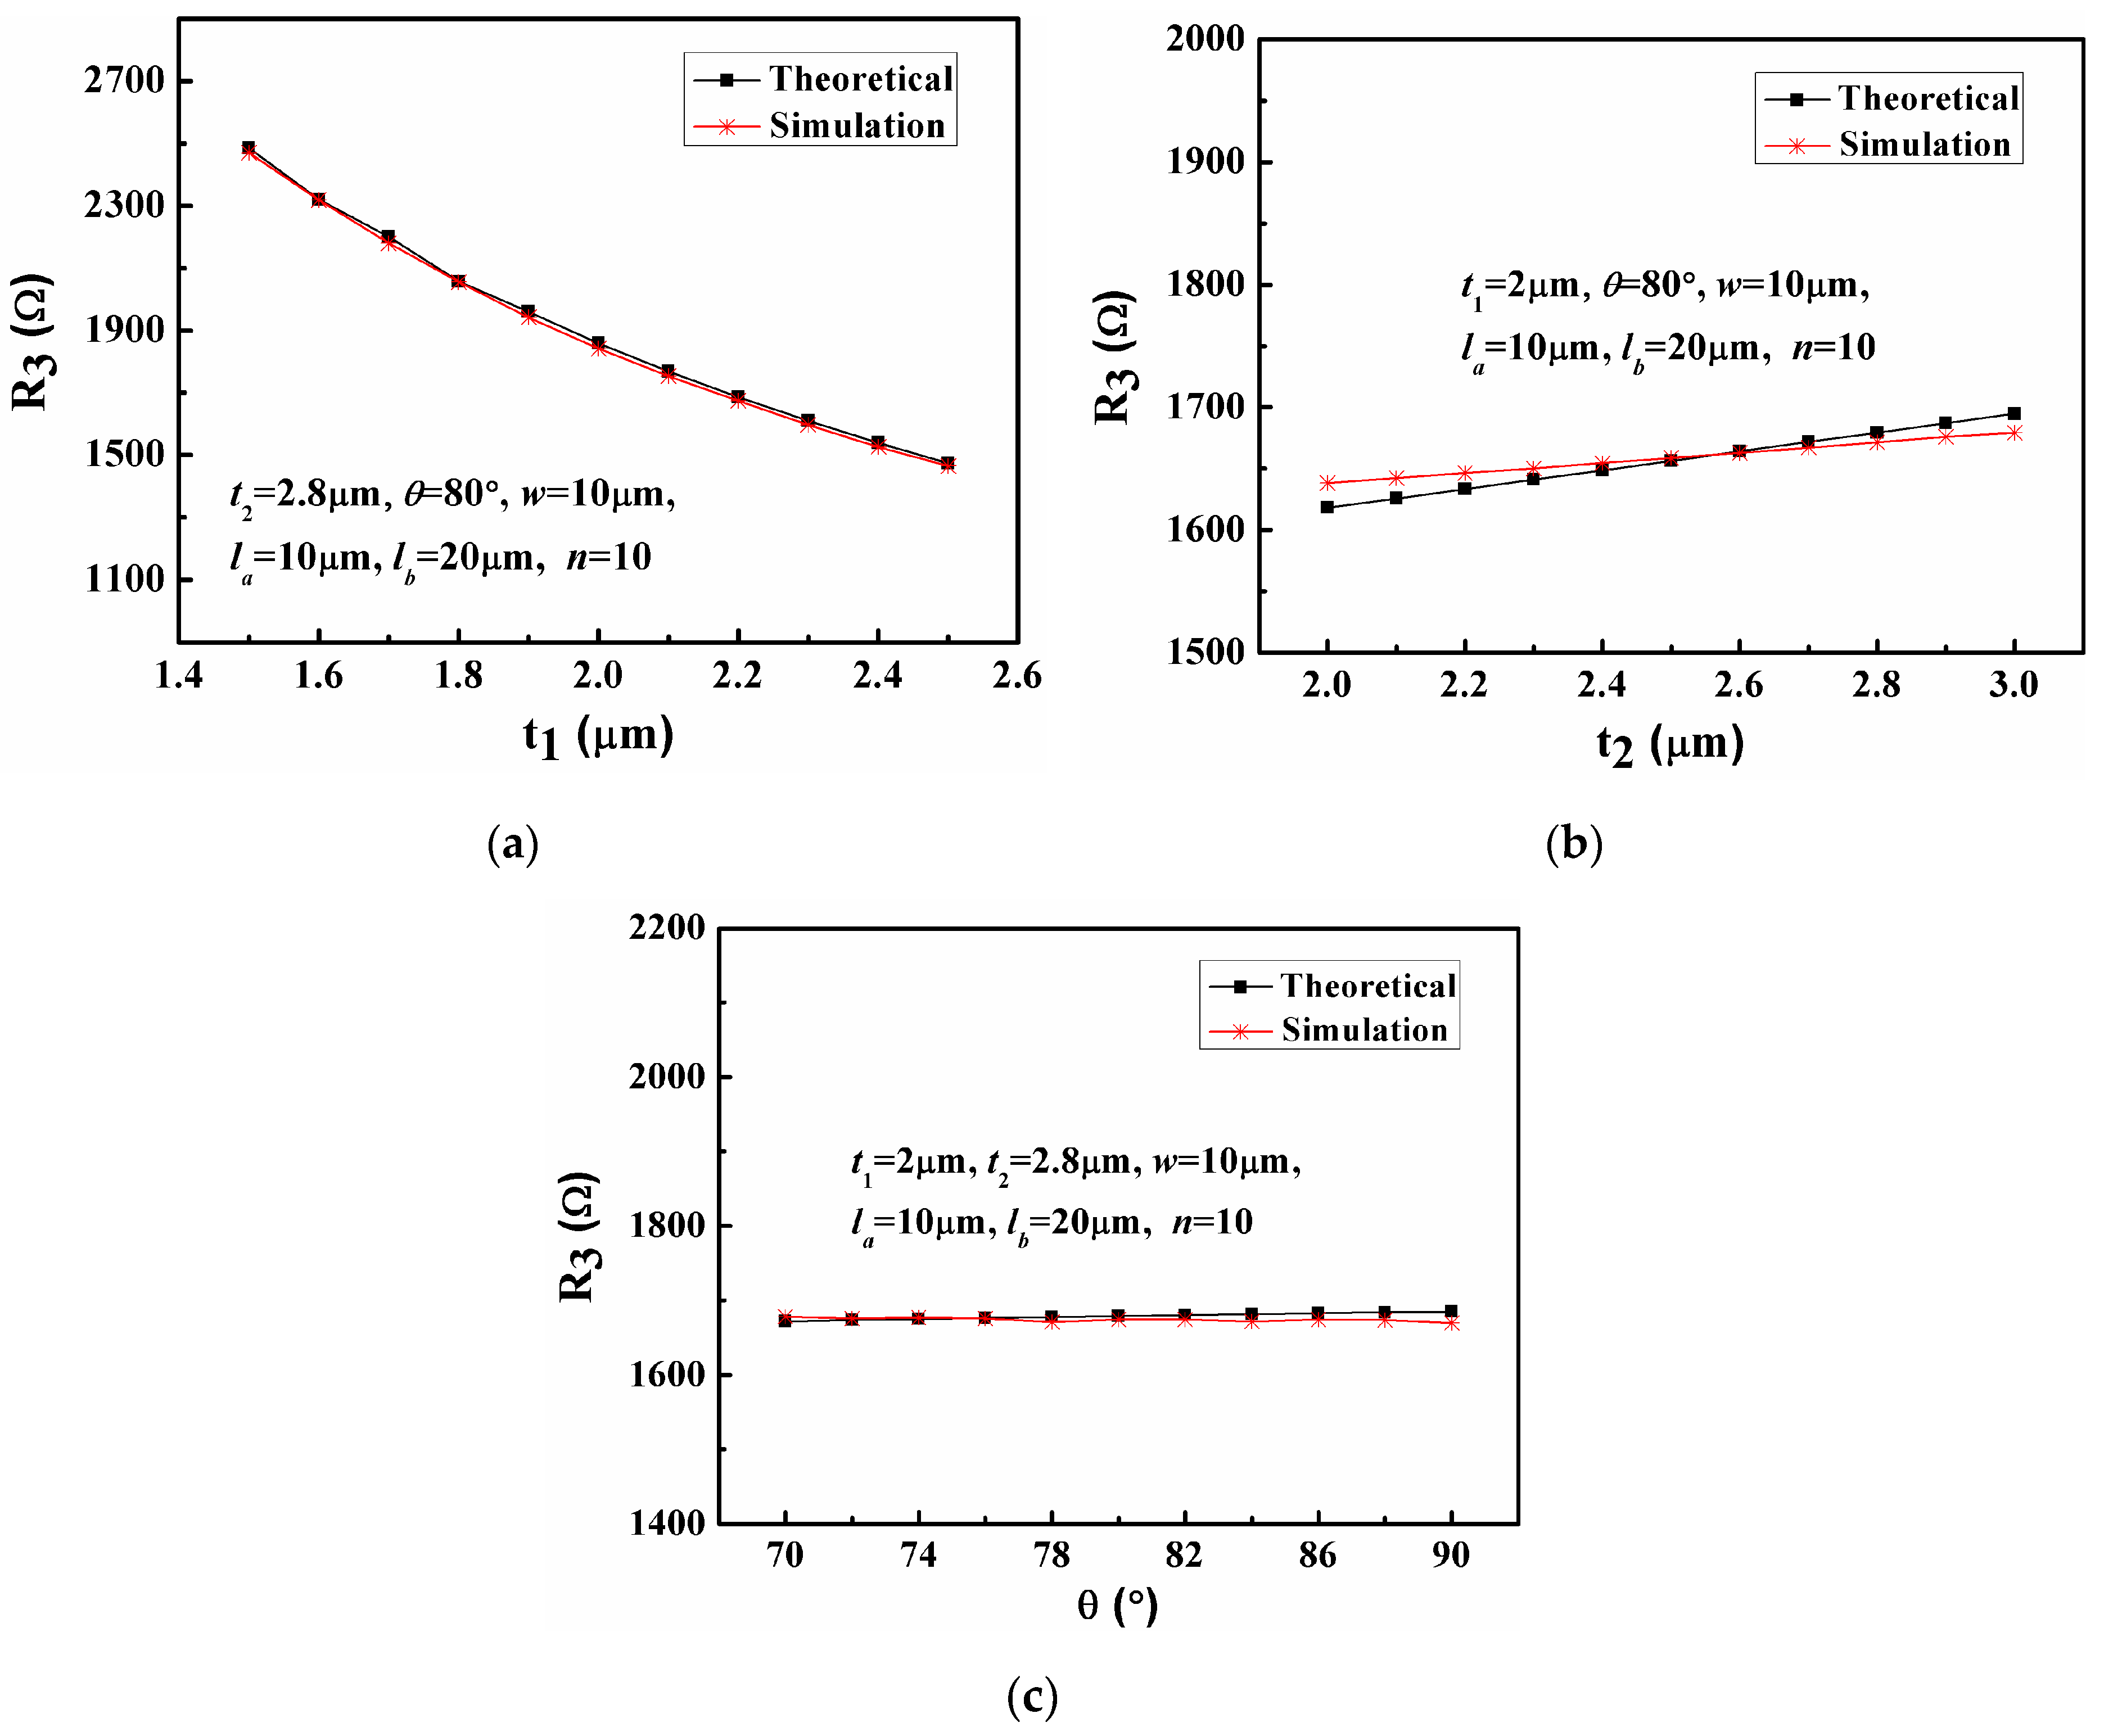
In order to verify the theoretical model, the finite element software COMSOL is adopted here to perform simulations. The dimensions of the test structure used in the simulation are w = 10 µm, la = 10 µm, lb = 20 µm, φ = 45°, ψ = 60° and n = 10, with the thickness of the polysilicon layer ranging from 1.5 µm to 2.5 µm, the thickness of the PSG layer ranging from 2 µm to 3 µm and the sidewall etch angle of the PSG layer ranging from 70 degree to 90 degree. Figure 6, Figure 7 and Figure 8 compare the relationship between resistances of continuous step structures of the three units (R1, R2, R3) and the geometrical parameters of thin films (t1, t2, θ) obtained by theoretical model and the FEM simulation. It is shown that R1, R2 and R3 nonlinearly decrease as t1 increases, linearly increase as t2 increases, and slightly increase as θ increases. The deviations between theoretical values and simulation results of R1, R2 and R3 are within 2%. These comparisons demonstrate that Equations (6)–(8) are valid.
For a given geometry (t1 = 2 µm, t2 = 2.8 µm, θ = 80°), simulation results of R1, R2 and R3 are 441.61 Ω, 852.72 Ω, and 1677.80 Ω, respectively. By substituting simulation results into Equations (9)–(11), thicknesses of the polysilicon layer and the PSG layer are estimated to be 2.039 µm and 2.820 µm, respectively, and the sidewall etch angle of the PSG layer is calculated as 80.90°. In comparison with the given geometry, the relative errors for simulation results of t1, t2 and θ are 1.95%, 0.71% and 1.13%, respectively.

3.2. Experimental Results

Experimental results are listed in Table 1 and Table 2. In order to verify the proposed method, film thickness and sidewall etch angle are also measured by using a SEM. Ten samples with different lateral dimensions are tested in the experiments. Samples 1a–5a are made of Poly 1 layer and Oxide 1 layer, and Samples 1b–5b are comprised of Poly 2 layer and Oxide 1-Oxide 2 stack. Sheet resistances for Poly 1 and Poly 2 are obtained to be (12.084 ± 0.218) Ω/sq and (21.962 ± 0.175) Ω/sq, respectively. The design values of bridge widths are 10 µm for sample 1 and sample 2, 15 µm for sample 3 and sample 4, and 20 µm for sample 5. Each sample is examined to evaluate the actual width (See Table 1 and Table 2). With the knowledge of sheet resistance and bridge width, film thickness and sidewall etch angle can be determined. Measured average values of thickness for the Poly 1 layer, the Oxide 1 layer, the Poly 2 layer and the stacked layer of Oxide 1-Oxide 2 are (2.080 ± 0.011) µm, (2.142 ± 0.012) µm, (1.614 ± 0.014) µm and (2.892 ± 0.012) µm, respectively. The sidewall etch angles for the Oxide 1 layer and the stacked layer of Oxide 1-Oxide 2 are extracted as (77.51 ± 0.61)° and (76.17 ± 0.91)°, respectively. As demonstrated in Table 1 and Table 2, these results are in agreement with experimental data obtained by SEM.

4. Discussion

There are several factors that may influence the accuracy of the experimental results obtained by the proposed method. First, it is observed from Figure 2b that there is an overetch of nitride during the PSG etch process, which causes the measured thicknesses of the oxide layers to be larger than the actual thicknesses. Second, in our extraction model, we have made the assumption that the step coverage is conformal, which is not always the case. If the sidewall deposited polysilicon film is thicker than the horizontally deposited polysilicon film, resistances of continuous step structures (R1, R2, R3) are smaller than those with uniform thickness. Accordingly, the obtained thickness of the polysilicon layer is smaller than the actual thickness, while the measured thickness and sidewall etch angle of the PSG layer are larger than the real values. On the contrary, if the sidewall polysilicon film is deposited at a smaller thickness than the horizontally deposited polysilicon film, R1, R2, and R3 increases, resulting in a larger obtained t1 and smaller obtained t2 and θ. In our experiment, the step coverage of Poly 1 is excellent, whereas the sidewall deposited Poly 2 film is thicker than the horizontally deposited Poly 2 film. This explains the experimental results of t1 for Poly 1 agree with optical results better than those of Poly 2. In addition, the extraction model is no longer valid when the thickness of the polysilicon layer is larger than the thickness of the PSG layer because the value of Rsw is calculated to be negative under this circumstance. However, the polysilicon layer used in our experiment is no thicker than the PSG layer. Thus, the experimental results listed in Table 1 and Table 2 are valid.
To overcome the limitations mentioned above, the thickness of sidewall polysilicon film should be induced into the theoretical model when the step coverage of the polysilicon layer is not conformal. The expressions for the resistances of the sidewall (Rsw) and the corner (Rc) are accordingly transformed. As for the situation where the polysilicon layer is thicker than the PSG layer, the areas of sidewalls and the areas of corners need to be redefined. Taking into account the aforementioned factors, a more sophisticated model might be established. This will be our future work.

5. Conclusions

In summary, this paper presents a nondestructive and in-line approach to determine the thickness and sidewall etch angle of surface micromachined thin films by four-probe bridges. The electrical resistance of the step structure has been studied. Continuous step structures are series-connected in order to reduce random error induced by a single step structure. Theoretical extraction models for thickness and sidewall etch angle are established. Validation of the theoretical model is confirmed by finite element method simulation. Four-probe measurements are adopted to eliminate the error caused by contact resistance. Only current-voltage measurements are required in experiments. Although the proposed method focused on the polysilicon and PSG thin films, it is possible to extend this method to other sacrificial and electrical conducting structural materials. This method has a potential in applications of production process lines.

Author Contributions

Conceptualization, H.L.; Data curation, Z.Z. and J.C.; Methodology, H.L.; Validation, Z.Z. and J.C.; Writing—original draft, H.L.

Funding

This research is partly funded by Natural Science Foundation of Jiangsu Province, grant number BK20140859, and partly funded by National Natural Science Foundation of China, grant number 51709083 and 61771183.

Acknowledgments

The authors would like to thank the Key Laboratory of MEMS of the Ministry of Education at Southeast University for the help on providing experiment system and some ideas about structure design.

Conflicts of Interest

The authors declare no conflict of interest.

References

  1. Liu, C. Foundations of MEMS, 1st ed.; Prentice Hall: Upper Saddle River, NJ, USA, 2006; p. 6. [Google Scholar]
  2. Hansen, S.T.; Ergun, A.S.; Liou, W.; Auld, B.A.; Khuri-Yakub, B.T. Wideband micromachined capacitive microphones with radio frequency detection. J. Acoust. Soc. Am. 2004, 116, 828–842. [Google Scholar] [CrossRef]
  3. Blanc, J.P.; Belleville, M.; Mieyeville, F.; Bono, H. Automatic evaluation of sensors geometrical parameters. In Proceedings of the Society of Photo-Optical Instrumentation Engineers (SPIE), Paris, France, 30 March–1 April 1999; pp. 94–102. [Google Scholar]
  4. Nguyen, C.T.C.; Howe, R.T. An integrated CMOS micromechanical resonator high-Q oscillator. IEEE J. Solid-State Circuits 1999, 34, 440–456. [Google Scholar] [CrossRef]
  5. Osterberg, P.M.; Senturia, S.D. M-TEST: A test chip for MEMS material property measurement using electrostatically actuated test structures. J. Microelectromech. Syst. 1997, 6, 107–118. [Google Scholar] [CrossRef] [Green Version]
  6. Ilic, B.; Krylov, S.; Craighead, H.G. Young’s modulus and density measurements of thin atomic layer deposited films using resonant nanomechanics. J. Appl. Phys. 2010, 108, 044317. [Google Scholar] [CrossRef]
  7. Liu, H.Y.; Wang, L. Measurements of thermal conductivity and the coefficient of thermal expansion for polysilicon thin films by using double-clamped beams. J. Micromech. Microeng. 2018, 28, 015010. [Google Scholar] [CrossRef]
  8. Jain, A.; Goodson, K.E. Measurement of the thermal conductivity and heat capacity of freestanding shape memory thin films using the 3 method. J. Heat Trans. 2008, 130, 102402. [Google Scholar] [CrossRef]
  9. Bennett, J.M.; Dancy, J.H. Stylus profiling instrument for measuring statistical properties of smooth optical surfaces. Appl. Opt. 1981, 20, 1785–1802. [Google Scholar] [CrossRef] [PubMed]
  10. Raley, N.F.; Van Duzer, T. Simple, nondestructive silicon membrane thickness measurement using a scanning electron microscope. J. Appl. Phys. 1985, 58, 280–286. [Google Scholar] [CrossRef]
  11. Henck, S.A. In situ real-time ellipsometry for film thickness measurement and control. J. Vac. Sci. Technol. A 1992, 10, 934–938. [Google Scholar] [CrossRef]
  12. Lockyer, C. A new interferometric method for measuring the thickness of thin films. J. Sci. Instrum. 1967, 44, 393–394. [Google Scholar] [CrossRef]
  13. de Groot, P.J.; de Lega, X.C. Transparent film profiling and analysis by interference microscopy. In Proceedings of the Interferometry XIV: Applications, San Diego, CA, USA, 10–14 August 2008; Volume 7064. [Google Scholar] [CrossRef]
  14. Dong, J.T.; Lu, R.S. Sensitivity analysis of thin-film thickness measurement by vertical scanning white-light interferometry. Appl. Opt. 2012, 51, 5668–5675. [Google Scholar] [CrossRef] [PubMed]
  15. Kuehnhold, P.; Nolvi, A.; Tereschenko, S. Transparent layer thickness measurement using low-coherence interference microscopy. In Proceedings of the Optical Measurement Systems for Industrial Inspection IX, Munich, Germany, 21–25 June 2015; Volume 9525. [Google Scholar]
  16. Kim, M.G.; Pahk, H.J. Fast and reliable measurement of thin film thickness profile based on wavelet transform in spectrally resolved white-light interferometry. Int. J. Precis. Eng. Manuf. 2018, 19, 213–219. [Google Scholar] [CrossRef]
  17. Lindner, M.; Schmid, M. Thickness measurement methods for physical vapor deposited aluminum coatings in packaging applications: A review. Coatings 2017, 7, 9. [Google Scholar] [CrossRef]
  18. Shaporin, A.; Streit, P.; Specht, H.; Mehner, J.; Dötzel, W. Novel test structures for characterization of microsystems parameters at wafer level. In Proceedings of the Reliability, Packaging, Testing, and Characterization of MEMS/MOEMS and Nanodevices VIII, San Diego, CA, USA, 24–29 January 2009; Volume 7206. [Google Scholar] [CrossRef]
  19. Chee, J.L.; Clark, J.V. The effect of noise on capacitive measurements of MEMS geometries. In Proceedings of the Society for Experimental Mechanics Series Conference, Indianapolis, IN, USA, 7–10 June 2010; pp. 43–51. [Google Scholar] [CrossRef]
  20. Gupta, R.K. Electronically probed measurements of MEMS geometries. J. Microelectromech. Syst. 2000, 9, 380–389. [Google Scholar] [CrossRef] [Green Version]
  21. Gennat, M.; Meinig, M.; Shaporin, A.; Kurth, S.; Rembe, C.; Tibken, B. Determination of parameters with uncertainties for quality control in MEMS fabrication. J. Microelectromech. Syst. 2013, 22, 613–624. [Google Scholar] [CrossRef]
  22. Wille, H.; Burte, E.; Ryssel, H. Simulation of the step coverage for chemical vapor deposited silicon dioxide. J. Appl. Phys. 1992, 71, 3532–3537. [Google Scholar] [CrossRef]
  23. Hagedorn, F.B.; Hall, P.M. Right-angle bends in thin strip conductors. J. Appl. Phys. 1963, 34, 128–133. [Google Scholar] [CrossRef]
  24. Hall, P.M. Resistance calculations for thin film patterns. Thin Solid Films 1968, 1, 277–295. [Google Scholar] [CrossRef]
  25. Hall, P.M. Resistance calculations for thin film rectangles. Thin Solid Films 1997, 300, 256–264. [Google Scholar] [CrossRef]
  26. Enderling, S.; Smith, C.L.S.; Dicks, M.H.; Stevenson, J.T.M.; Mitkova, M.; Kozicki, M.N.; Walton, A.J. Sheet resistance measurement of non-standard cleanroom materials using suspended Greek cross test structures. IEEE Trans. Semicond. Manuf. 2006, 19, 2–9. [Google Scholar] [CrossRef]
  27. Vernsel, W. Analysis of the Greek cross, a Van der Pauw structure with finite contacts. Solid State Electron. 1979, 22, 911–914. [Google Scholar] [CrossRef]
  28. Buehler, M.G.; Grant, S.D.; Thurber, W.R. Bridge and Van der Pauw sheet resistors for characterizing the line width of conducting layers. J. Electrochem. Soc. 1978, 125, 650–654. [Google Scholar] [CrossRef]
  29. Cowen, A.; Hardy, B.; Mahadevan, R.; Wilcenski, S. PolyMUMPs Design Handbook: Revision 13.0; MEMSCAP Inc.: Durham, NC, USA, 2012. [Google Scholar]
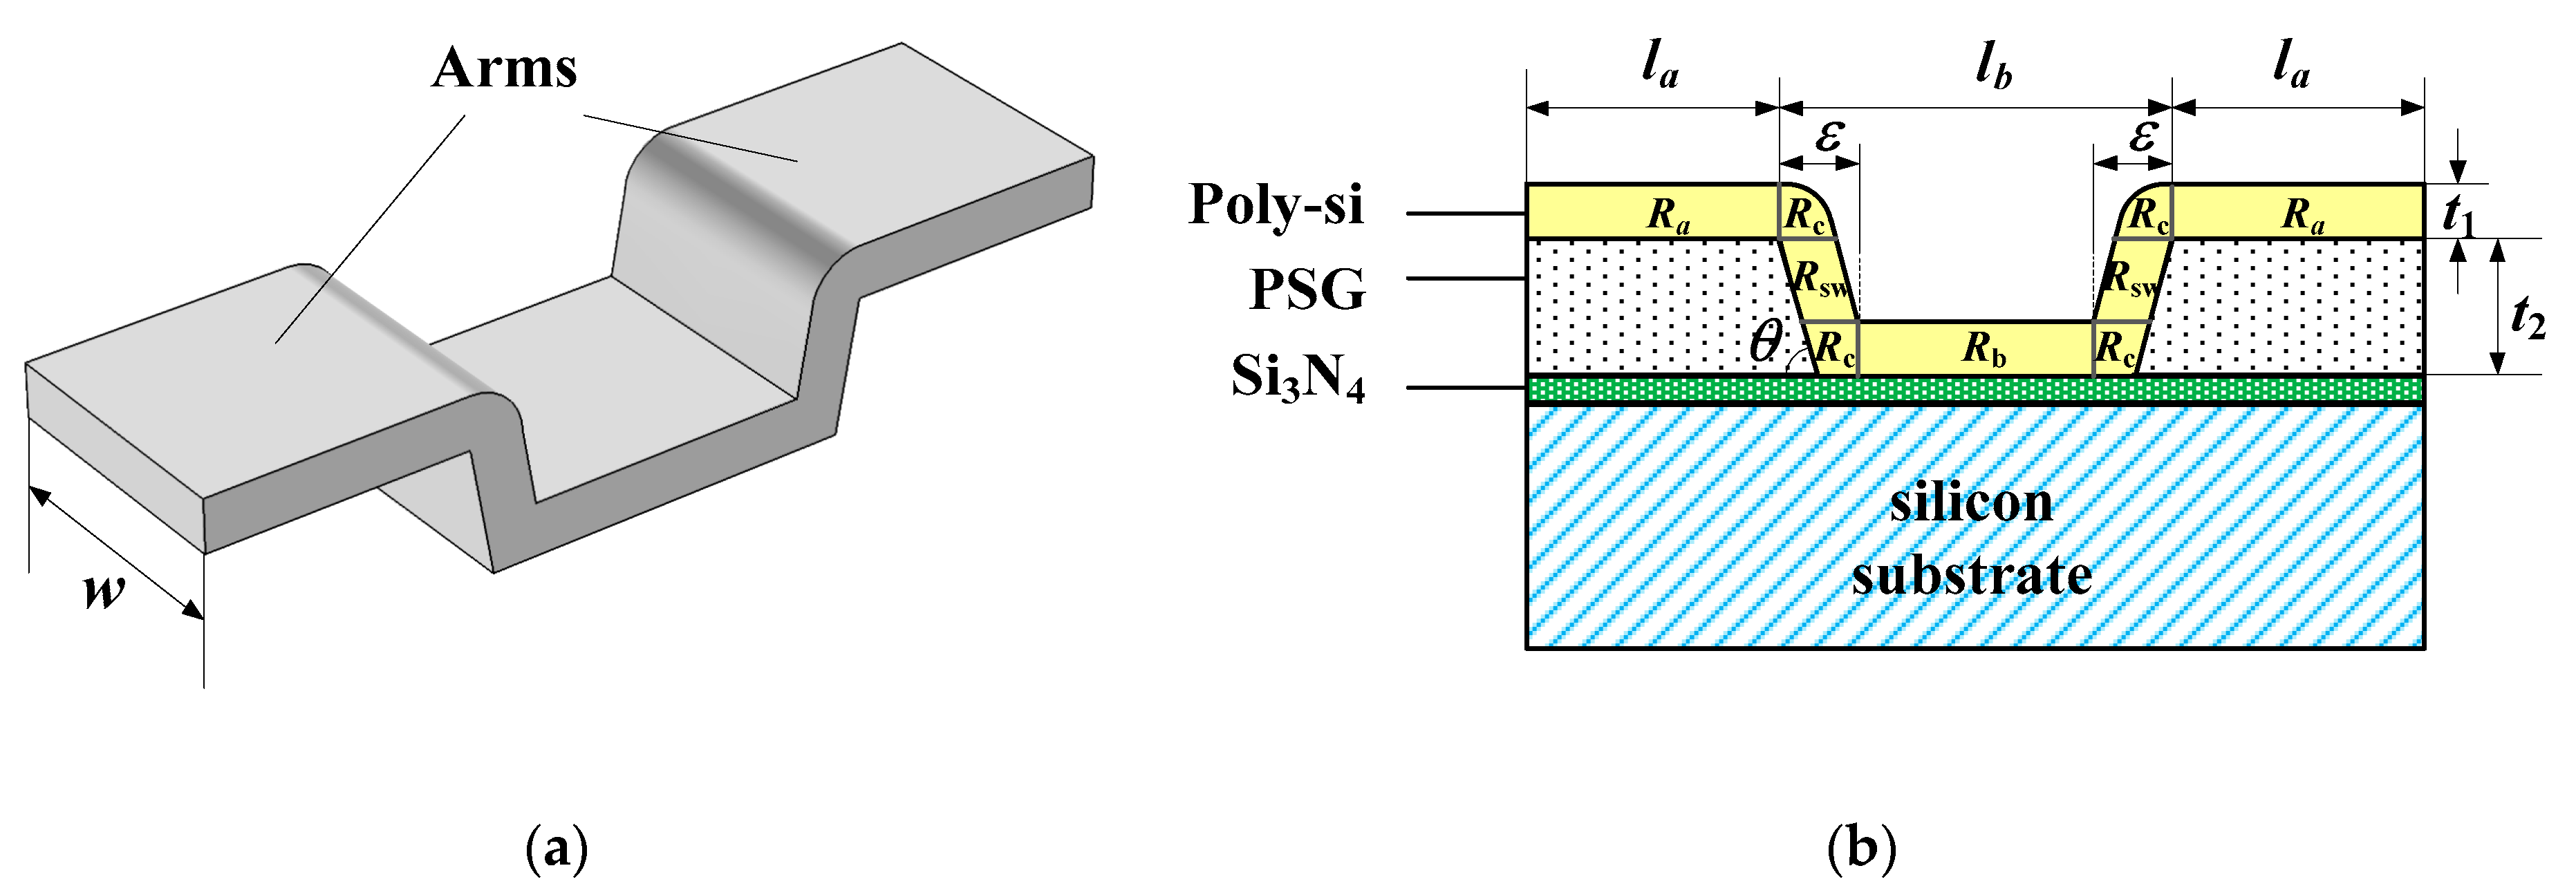
Figure 1. Schematic diagrams of a step structure: (a) 3-D view; (b) Cross section view.
Applsci 08 02424 g001
Figure 2. Resistance of corners: (a) Various patterns of corners; (b) SEM photo for the cross-section view of a step structure.
Applsci 08 02424 g002
Figure 3. Schematic illustration of the test structure for measuring geometrical parameters of surface micromachined thin films: (a) Unit 1; (b) Unit 2; (c) Unit 3.
Applsci 08 02424 g003
Figure 4. SEM photographs of the test structure: (a) Deposited horizontally; (b) Deposited at an angle of 45°; (c) Deposited at an angle of 60°.
Applsci 08 02424 g004
Figure 5. Schematic diagram of the experiment system.
Applsci 08 02424 g005
Figure 6. Theoretical and simulation results of the relationship between R1 and the geometrical parameters: (a) The thickness of the polysilicon layer (t1); (b) The thickness of the PSG layer (t2); (c) The sidewall etch angle of the PSG layer (θ).
Applsci 08 02424 g006
Figure 7. Theoretical and simulation results of the relationship between R2 and the geometrical parameters: (a) The thickness of the polysilicon layer (t1); (b) The thickness of the PSG layer (t2); (c) The sidewall etch angle of the PSG layer (θ).
Applsci 08 02424 g007
Figure 8. Theoretical and simulation results of the relationship between R3 and the geometrical parameters: (a) The thickness of the polysilicon layer (t1); (b) The thickness of the PSG layer (t2); (c) The sidewall etch angle of the PSG layer (θ).
Applsci 08 02424 g008
Table 1. Experimental results of Poly 1 layer and Oxide 1 layer.
SamplesParametersFour-Probe BridgesSEMError
Sample 1aRS12.26 Ω/sq--
w10.121 µm--
t12.083 µm1.995 μm4.41%
t22.128 µm2.003 µm6.22%
θ77.64°80.77°3.88%
Sample 2aRS11.97 Ω/sq--
w10.081 µm--
t12.096 µm1.997 µm4.96%
t22.144 µm2.005 µm6.91%
θ77.04°80.35°4.12%
Sample 3aRS12.01 Ω/sq--
w15.132 µm--
t12.069 µm1.993 µm3.83%
t22.153 µm2.002 µm7.52%
θ77.58°80.17°3.23%
Sample 4aRS12.33 Ω/sq--
w15.111 µm--
t12.081 µm2.001 µm3.99%
t22.131 µm2.003 µm6.37%
θ78.36°80.44°2.59%
Sample 5aRS11.85 Ω/sq--
w20.106 µm--
t12.073 µm2.001 µm3.58%
t22.152 µm2.008 µm7.17%
θ76.92°79.89°3.72%
Table 2. Experimental results of Poly 2 layer and stacked Oxide 1-Oxide 2 layer.
SamplesParametersFour-Probe BridgesSEMError
Sample 1bRS22.07 Ω/sq--
w10.074 µm--
t11.626 µm1.512 µm7.54%
t22.887 µm2.773 µm4.12%
θ76.03°80.22°5.22%
Sample 2bRS21.75 Ω/sq--
w10.134 µm--
t11.624 µm1.518 µm6.98%
t22.910 µm2.776 µm4.82%
θ75.82°80.64°5.98%
Sample 3bRS22.17 Ω/sq--
w15.290 µm--
t11.594 µm1.510 µm5.59%
t22.893 µm2.773 µm4.33%
θ75.29°80.96°7.01%
Sample 4bRS21.89 Ω/sq--
w15.108 µm--
t11.607 µm1.515 µm6.07%
t22.891 µm2.778 µm4.07%
θ77.56°81.03°4.28%
Sample 5bRS21.93 Ω/sq--
w20.090 µm--
t11.619 µm1.511 µm7.18%
t22.881 µm2.773 µm3.90%
θ76.15°80.88°5.85%