Article

Effects of Precursor Concentration in Solvent and Nanomaterials Room Temperature Aging on the Growth Morphology and Surface Characteristics of Ni–NiO Nanocatalysts Produced by Dendrites Combustion during SCS

1
Institute of Nanoscience and Nanotechnology, NCSR ‘‘Demokritos”, Agia Paraskevi, 15310 Attiki, Greece
2
Department of Aircraft Engine Theory, Samara National Research University, 34 Moskovskoyeshosse, 443086 Samara, Russia
3
Faculty of Engineering, Environment and Computing, Coventry University, Priory Street, Coventry CV1 5FB, UK
4
Department of Engineering and Innovation, The Open University, Venables Building, Milton Keynes MK7 6YW, UK
5
Center of Functional Nano-Ceramics, National University of Science and Technology “MISiS”, 119049 Moscow, Russia
6
Department of Materials, Imperial College London, London SW7 2BP, UK
7
Division of Powder Metallurgy and Functional Coatings, National University of Science and Technology “MISiS” , 119049 Moscow, Russia
*
Author to whom correspondence should be addressed.
Appl. Sci. 2019, 9(22), 4925; https://doi.org/10.3390/app9224925
Submission received: 24 October 2019 / Revised: 6 November 2019 / Accepted: 11 November 2019 / Published: 15 November 2019
(This article belongs to the Section Materials Science and Engineering)

Abstract

:
The morphology and surface characteristics of SCS (Solution Combustion Synthesis)-derived Ni–NiO nanocatalysts were studied. The ΤΕΜ results highlighted that the nanomaterial’s microstructure was modified by changing the reactants’ concentrations. The dendrites’ growth conditions were the main factors responsible for the observed changes in the nanomaterials’ crystallite size. Infrared camera measurements demonstrated a new type of combustion through dendrites. The XPS analysis revealed that the NiO structure resulted in the bridging of the oxygen structure that acted as an inhibitor of hydrogen adsorption on the catalytic surface and, consequently, the activity reduction. The RF-IGC indicated three different kinds of active sites with different energies of adsorption on the fresh catalyst and only one type on the aged catalyst. Aging of the nanomaterial was associated with changes in the microstructure of its surface by a gradual change in the chemical composition of the active centers.

Graphical Abstract

1. Introduction

1.1. Metallic Nickel

Over the past years, a plethora of studies have appeared searching for nanomaterials with unusual properties that are distinct from those of bulk materials. Nano-structured metals have applications in many fields including homogeneous and heterogeneous catalysis [1,2,3,4], fuel cells [5,6,7,8], nanoelectronics [5], optics [6], magnetism [7] and other areas of material technology [9,10].
The synthesis of nickel nanoparticles and their characteristics have been studied extensively over the past 10 years due to the fact of their unusual properties and potential applications in various fields. Nano-sized nickel is now used in diverse areas such as catalysts, batteries, and in super-alloys. The finer the size of the catalytic material is, the higher its catalytic activity. As an example, 30 nm nickel particles synthesized optically active 3-hydroxybutyric acid methyl ester where the ensuing yield rate was as high as 85%, and the reaction was up to 15 times higher than that of non-nano nickel catalyst for the same reaction [11].
A variety of methods have been reported for the preparation of nano-sized particles including reduction of metal oxide salts [12], decomposition of carbonyls [11], and solution reduction using various reducing agents [13].

1.2. Nickel Oxide

In recent years, studies on nickel oxide nanostructured materials have been reported extensively because of their wide-ranging potential applications.
A recent report suggests that the crystallite size plays a major role on how nano-structured nickel oxide shells behave when reduced to solid nickel nanoparticles [13]. Nickel oxide shells were placed in a hydrogen gas environment at 350 °C, and the smallest shells reported had a diameter of approximately 12 nm; they were formed in a single nucleation site of pure nickel which then proceeded to expand to replace all of the starting NiO. Slightly larger starting shells (with a diameter of approximately 25 nm) formed multiple nucleation sites around the shell which grew and eventually merged into a single nickel nanoparticle. Much larger shells (of a diameter of approximately 96 nm) formed many nucleation sites about the shell. The conclusion was that the size of the nickel oxide shells influences the way reduction occurs, since the size of the nanoparticles prior to oxidation appears to determine both the structure of the NiO nanoparticles and the distribution of the nucleation sites of metallic nickel during reduction [13].
Nickel oxide, which is an antiferromagnetic material, has been reported to display ferromagnetic characteristics as nanoparticles, probably due to the nickel vacancies, with the magnetic moment increasing with decreasing particle size [14,15]. Below a size of about 10 nm, the Ni2+–O2−–Ni2+ super exchange interaction breaks down (possibly due to the presence of more nickel vacancies) and the nanoparticles exhibit paramagnetic behavior.

1.3. Solution Combustion Synthesis

A very efficient method for the synthesis of nanomaterials is solution combustion synthesis (SCS) (e.g., [16]). It is an exothermic process and is characterized by redox reactions in a water solution containing metal nitrates as oxidizers and various organic compounds as reducers [17,18] At a pre-heating temperature range of 300–600 °C, the water is evaporated and the remaining reactants dry and heat up rapidly. Within, at most, a few minutes, they ignite and sustain a rapid exothermic reaction which results in foam-like, nano-structured, powder-form [19] SCS products with a pronounced three-dimensional dendritic structure which occurs due to the formation of hydrates when the nitrates are heated in water and the extensive gas generation during SCS [20,21].
Oxides are the most common product of the SCS process as a result of the nitrate decomposition. Hadke et al. [22] produced nickel oxide nano-powders and evaluated the influence of glycine and urea as reducers. Glycine was found to have a more intense combustion, less residual carbon, and interacted better with metal cations.
Kumar et al. [23] investigated the possibility of producing compounds other than oxides, such as metals or alloys, using SCS. They directly synthesized pure nickel nano-powder and suggested a specific reaction pathway to describe the metallic phase formation during SCS. Their research revealed that ammonia (derived from fuel decomposition) and nitric acid (derived from nitrate decomposition) are mixed in one volume during combustion and, thus, they can react. This reaction is highly exothermic and results in water, nitrogen, and hydrogen as the main equilibrium products. Depending upon the fuel-to-oxidizer ratio, they indicated that in fuel-rich conditions, the system provides a reducing atmosphere (hydrogen and carbon monoxide) that could lead to the formation of pure nickel.
The fuels added in the SCS precursor solution act as reducing agents; therefore, the production of metals is feasible through the reduction of metal oxides by the residual fuel as well [24]. Jung et al. [25] produced nickel particles using microwave-assisted SCS in fuel-rich conditions and air atmosphere. Erri et al. [26] investigated the suitable fuel-to-oxidizer ratio in order to control the velocity of combustion and obtain nickel foam. They concluded that fuel-rich conditions are necessary to provide a reducing atmosphere for the formation of metallic nickel.
Solution combustion synthesis is also a very efficient method for preparation of catalysts. The SCS-derived catalysts can be distinguished in two main groups: bulk and supported catalysts [16]. In the first group, Kumar et al. [27] reported the preparation of bulk metallic catalysts (Cu, Ni) and tested them towards ethanol reforming reactions. Concerning the synthesis of supported catalysts, Cross et al. [28] reported on the synthesis of nickel catalysts on highly porous alumina supports, achieving a surface area of ~160 m2/g.

2. Room Temperature Aging Effects

When catalysts age, their specific surface area decreases and the structural characteristics (i.e., porosity), specific volume, and average pore radius change. According to the discussion above, the apparent and bulk density of the catalysts also change.
A number of reviews have appeared recently concerning the release and transformation in the environment of engineered nanoparticles (ENPs). Lowry et al. [29] outlined a number of environmental transformation processes and theorized that the effects measured for fresh ENPs may be typical of exposures occurring at manufacturing or processing sites, but the effects of real-world environmental exposure will probably be very different. The high reactivity of such highly specific surface area nanomaterials means that they are highly physico-chemically dynamic in the environment. In fact, many transformations can occur in ENPs in the environment including photochemical, redox, adsorption, desorption, and aggregation. [30] Many changes in the crystal structure or their surface can occur and many types of mechanical defects can be observed [31].
Size changes are often observed as reported by Thurber et al. [32] where unprotected zinc oxide powders doubled in diameter after four years of exposure to the environment. Formation of the same nanocrystals was dependent on humidity and pressure [33]. As expected, oxidation of metallic nanoparticles occurs often during long-term storage. For example, copper nanoparticles were left in storage for six years under ambient conditions, and a thick oxide coating was formed on their surface and their particle size increased by up to 50% [34].
Oxidation affects different types of ENPs differently. Yin et al. [35] and others [36] showed that the chemical distribution between the core and shell of many nanoparticles decides whether oxidation takes place.
Humidity can also enhance the generation of secondary NPs. We therefore conclude that nanoparticles during use and/or storage may significantly transform compared to fresh ENMs.

3. Materials and Methods

3.1. Materials

On Table 1 that follows, the materials used for the catalysts synthesis and he performance of the hydrogenation reaction are listed.

3.2. Solution Combustion Synthesis of Ni-Based Catalysts

An aqueous precursor SCS solution was prepared with 66.7%wt nickel nitrate hexahydrate (Ni(NO3)2·6H2O) and 33.3%wt glycine as the reducer in order to produce Ni-based catalysts according to the reaction:
2 N i ( N O 3 ) 2 · 6 H 2 O + C 2 H 5 N O 2 N i + N i O + N O 2 + 2 N O + N 2 + 2 C O 2 29 2 H 2 O + 5 2 O 2
Four different quantities (i.e., 25, 50, 75, or 100 mL) of distilled water were employed for the dissolution of the solid mixture in order to prepare four precursor solutions. Each solution was placed in a borosilicate glass beaker and preheated on a hot plate with mild magnetic stirring up to 70 °C. It was then placed in a preheated furnace (500 °C) for the combustion to take place. Thus, four Ni-based nanocatalysts were synthesized by only changing the amount of water added in the initial solution (Table 2). Once the SCS ended, the products were removed from the furnace and were left to cool at room temperature.

3.3. Characterization of the Solution Combustion Synthesized Catalysts

Reversed-flow inverse gas chromatography (RF-IGC) was employed to study the hydrogen adsorption phenomena [37,38,39]. During the measurements, helium was the carrier gas with a 24 cm3/min constant volumetric flow rate, 0.5 mL H2 was the injected reactant at atmospheric pressure, and the volume of the catalytic powder in the diffusion column was 5 cm3. In order to double the chromatographic signals, the direction of the carrier gas flow was reversed twice every two minutes, as that was a shorter time than the gas holdup. All the experiments conducted by RF-IGC were performed at least 3 times.
The temperature evolution during SCS and the temperature of the combustion wave were monitored in situ with a high-speed infrared camera (model A655SC, FLIR Systems, Wilsonville, USA).
An FEI CM20 TEM operating at 200 kV was utilized to study the microstructure and morphology of the synthesized catalysts. The TEM specimens were prepared by drop-casting 1 μL of catalyst suspension in ethanol onto carbon-support Cu TEM grids.
In order to depict the changes in surface electronic and chemical properties of the material, X-ray photoemission spectroscopy (XPS) measurements were carried out, where the photon energy is fixed and the electron intensity is measured as a function of electron kinetic energy.
X-ray photoemission spectroscopy is a highly sensitive surface analysis technique with the signal originating from a thin layer at the surface (<3 nm). All the photoelectron spectra reported here were recorded on a load-locked Kratos XSAM800 system equipped with a dual anode X-ray source. The excitation source that was used is a Mg Kα (1253.6 eV), operated at 12 kV and 10 mA, . Throughout the measurements, the base pressure of the chamber was maintained below 10−9 mbar. The electron energy analyzer was set to the high magnification mode to collect electrons from the smallest possible area on the specimen, approximately 4.0 mm2. All spectra were calibrated with respect to the adventitious carbon at 284.8 eV present in the sample due to the ambient exposure and to the Au 4f7/2 core lines (84 eV) as well. Metallic gold was kept in direct contact with the sample to align the Fermi level. The photoelectron spectra thus obtained were analyzed using Casa XPS software using a Shirley background subtraction algorithm. Core lines were fitted with a 50% mixture of Gaussian and Lorentzian line shape functions to keep the residue (x2) <1.

3.4. Hydrogenation of Maleic Acid

The catalysts’ activity was tested towards the hydrogenation of maleic acid in the aqueous phase for the production of succinic acid. An amount of 1.0 g of catalyst was added to the catalytic reactor at 80 °C with 30 mL of distilled water and was left for 1 h for saturation with hydrogen. After that, 0.26 g of maleic acid was inserted in the reactor in order to react with 50 mL of hydrogen at atmospheric pressure.
Both catalyst saturation with hydrogen and with hydrogenation were carried out under continuous mechanical stirring. The amount of the reacted hydrogen was measured every minute at atmospheric pressure in order to calculate the conversion of maleic acid to succinic acid. To check the reproducibility, each catalytic test was repeated at least three times.

4. Results and Discussion

4.1. Transmission Electron Microscopy (TEM)

Three catalysts with the same initial composition (nickel nitrate and glycine), but with different quantities of water added in the initial solution, were firstly preheated at 70 °C and then placed in the furnace at the same temperature (500 °C), where the water evaporated and the reaction occurred in the gel. After SCS, it was found that the microstructures of all the catalysts were different, and this was why they were studied by TEM.
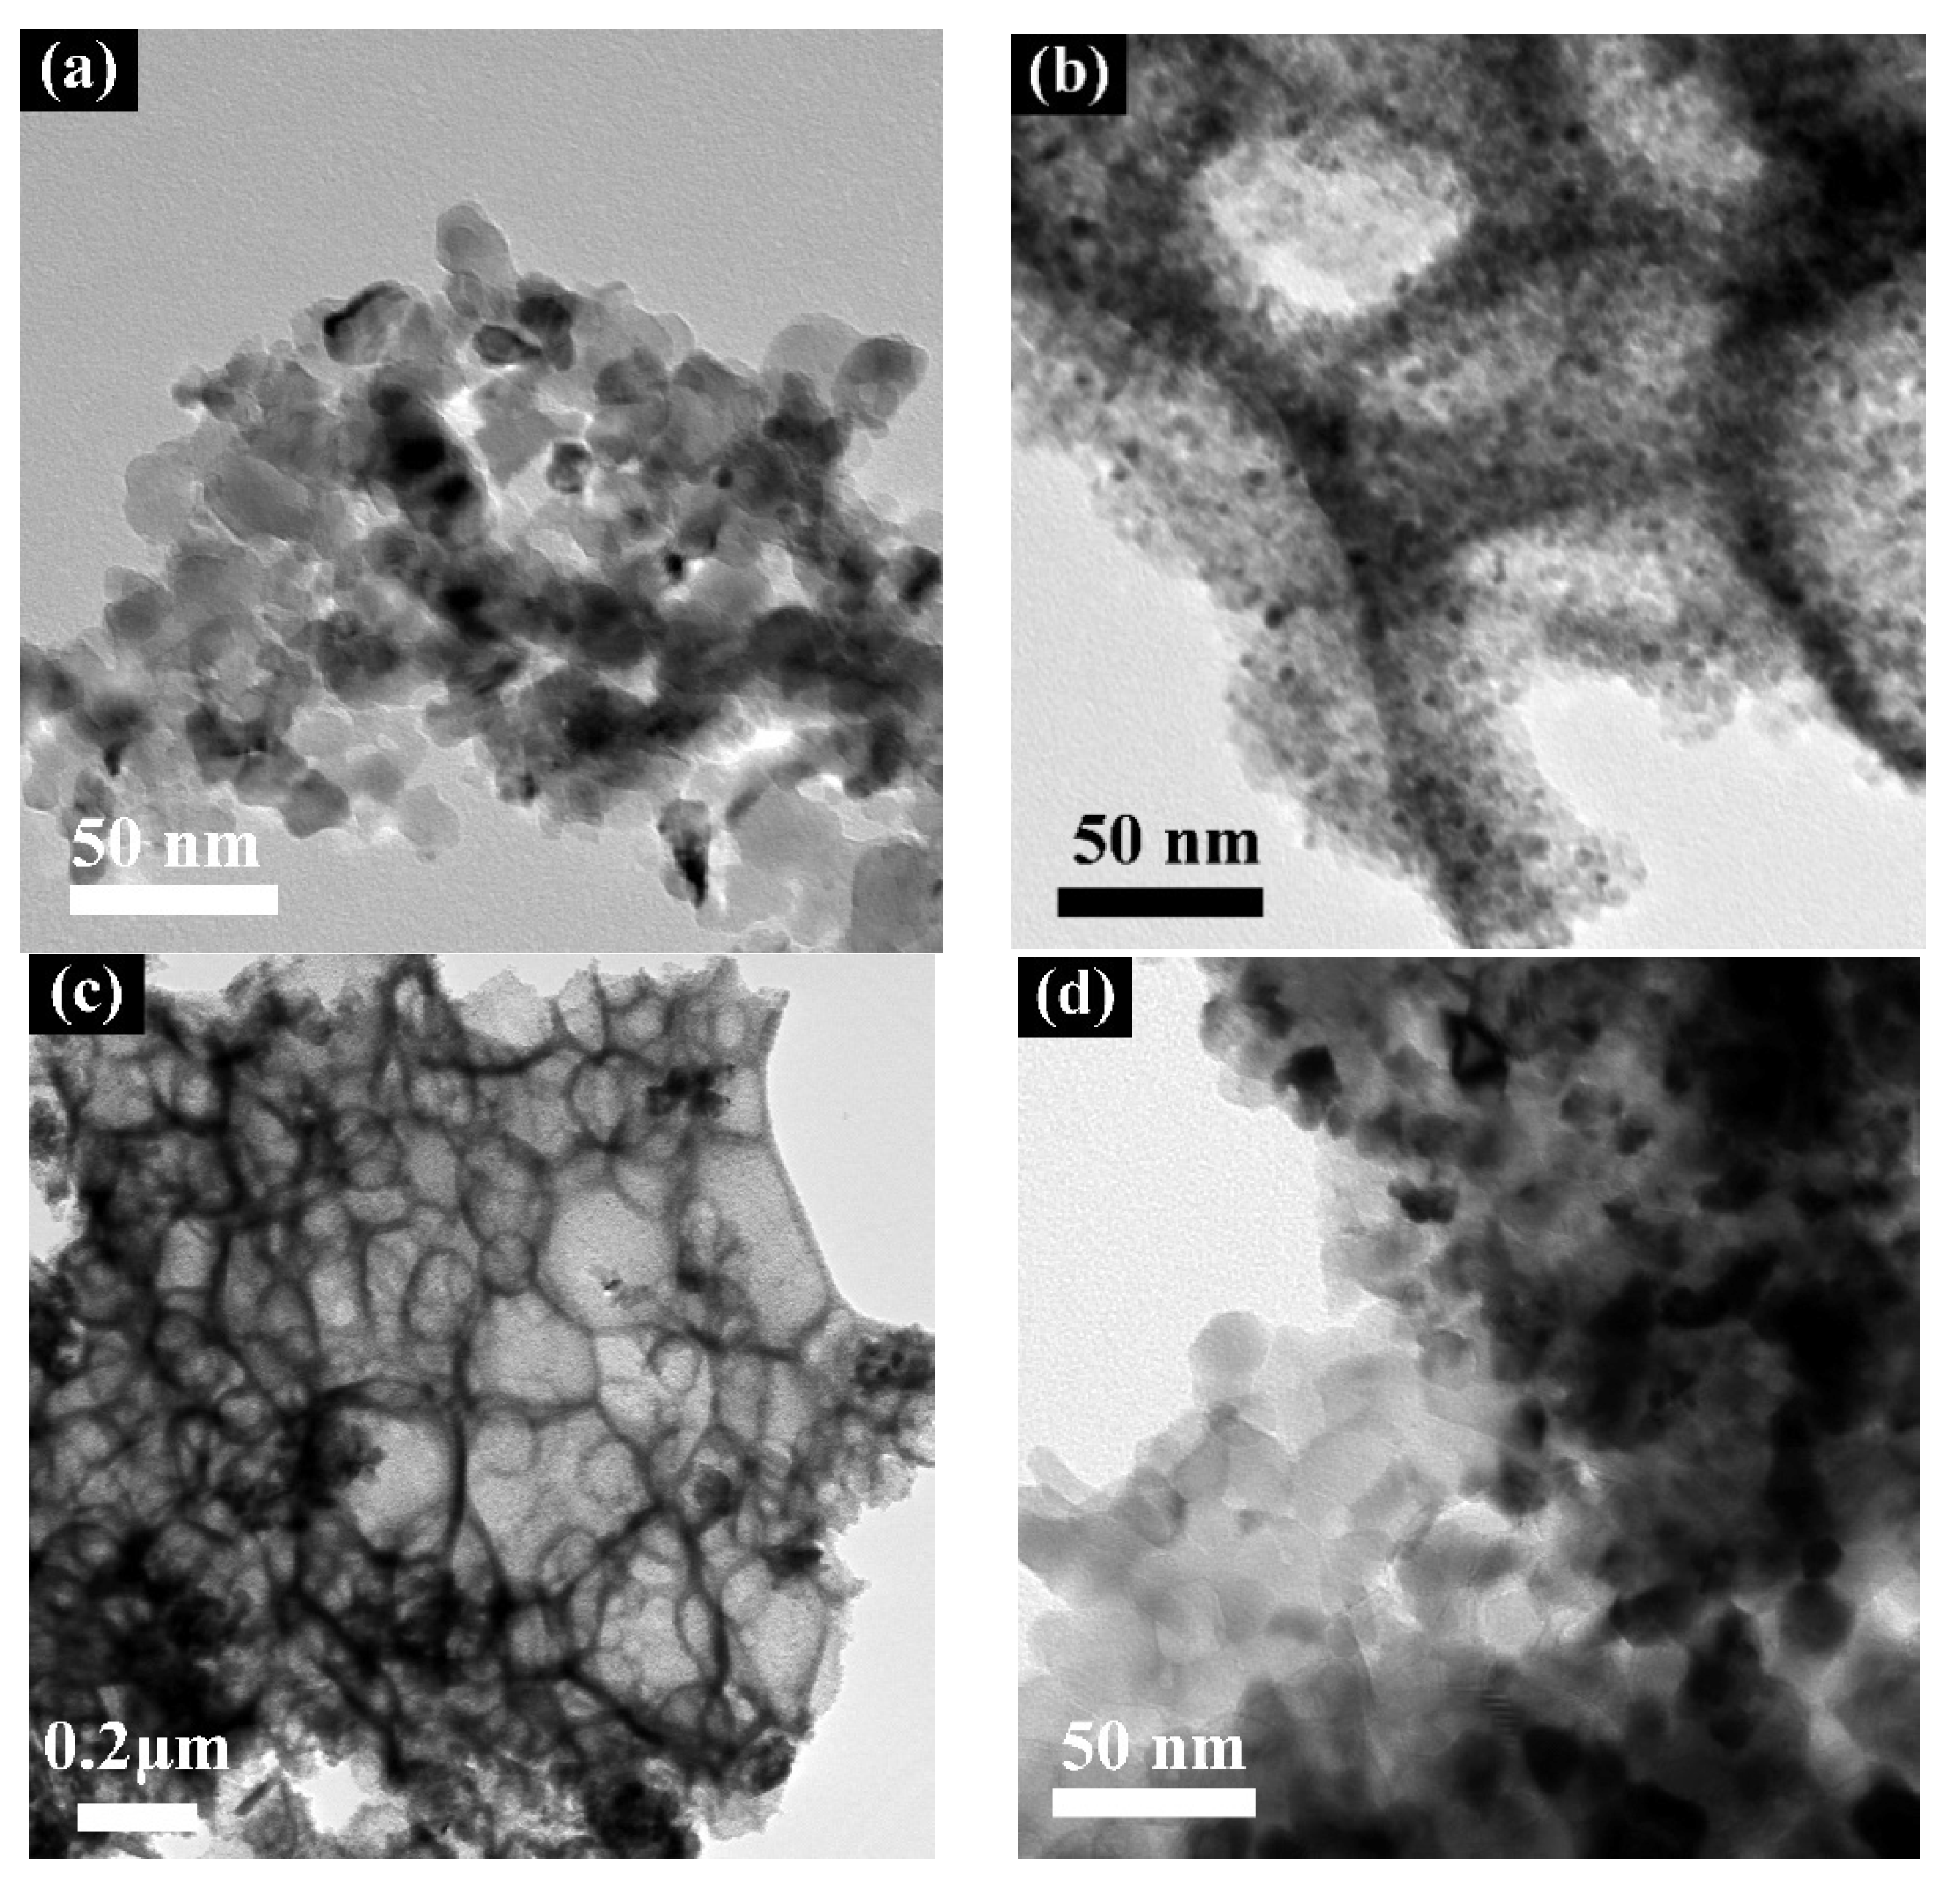
Figure 1 exhibits the typical TEM micrographs of sample S_29 (100 mL of water as solvent). It can be noticed by comparing Figure 1a,b that there were sample regions where the crystallites obtained a size ranging between 15 and 50 nm, while in other regions, the crystallite size was much smaller, ranging between 5 and 12 nm. The latter areas constituted the majority of the sample mass. Another interesting feature was that the fine crystallites formed the shells of the empty spheres as shown in the low-magnification bright field image of Figure 1c. Since these spheres formed a three-dimensional solid, their shells were projected as dark rings of 50–170 nm diameter due to the higher absorption of the electron beam along the sphere edges. A typical selected area electron diffraction pattern is presented in Figure 1d. Figure 1d shows the selected area electron diffraction (SAED) pattern of the same sample. The polycrystalline diffraction rings, indicated by the arrows, corresponded to 0.241 nm (NiO), 0.209 nm (NiO), 0.203 nm (Ni), 0.176 nm (Ni), 0.148 nm (NiO), 0.126 nm (NiO), 0.124 nm (Ni), 0.106 nm (Ni), and 0.104 nm (NiO), being in agreement with our previous work [40].
Figure 2a,b exhibits high-resolution TEM images of the large and small crystallite regions, respectively. Since in both regions (101) NiO as well as (111) Ni lattice fringes can be seen with d-spacings of 0.241 nm and 0.203 nm, respectively, it can be concluded that both regions consisted of Ni and NiO nano-crystallites.
Figure 3a–c demonstrates typical TEM bright field images of sample S27 (75 mL H2O). The microstructure of this sample was very similar to that of S29 (100 mL H2O), consisting of regions with larger Ni and NiO 20–40 nm crystallites, as shown in Figure 3a, and regions of smaller 5–12 nm nanocrystals as shown in Figure 3b. As in the case of sample S29, the smaller nanocrystals formed the shell of empty spheres, as shown in Figure 3c, with the main difference with S_29 being their larger size ranging between 100 and 300 nm. It is also worth noting that in sample S27, the areas consisted of small nanocrystals constituting the minority of the sample’s mass in contrast to sample S29 where they constituted the majority. This trend was further enhanced in sample S25 (50 mL H2O), where only larger Ni and NiO crystallites were observed as shown in Figure 3d, i.e., no areas of small nanocrystals forming shells of empty spheres were observed.
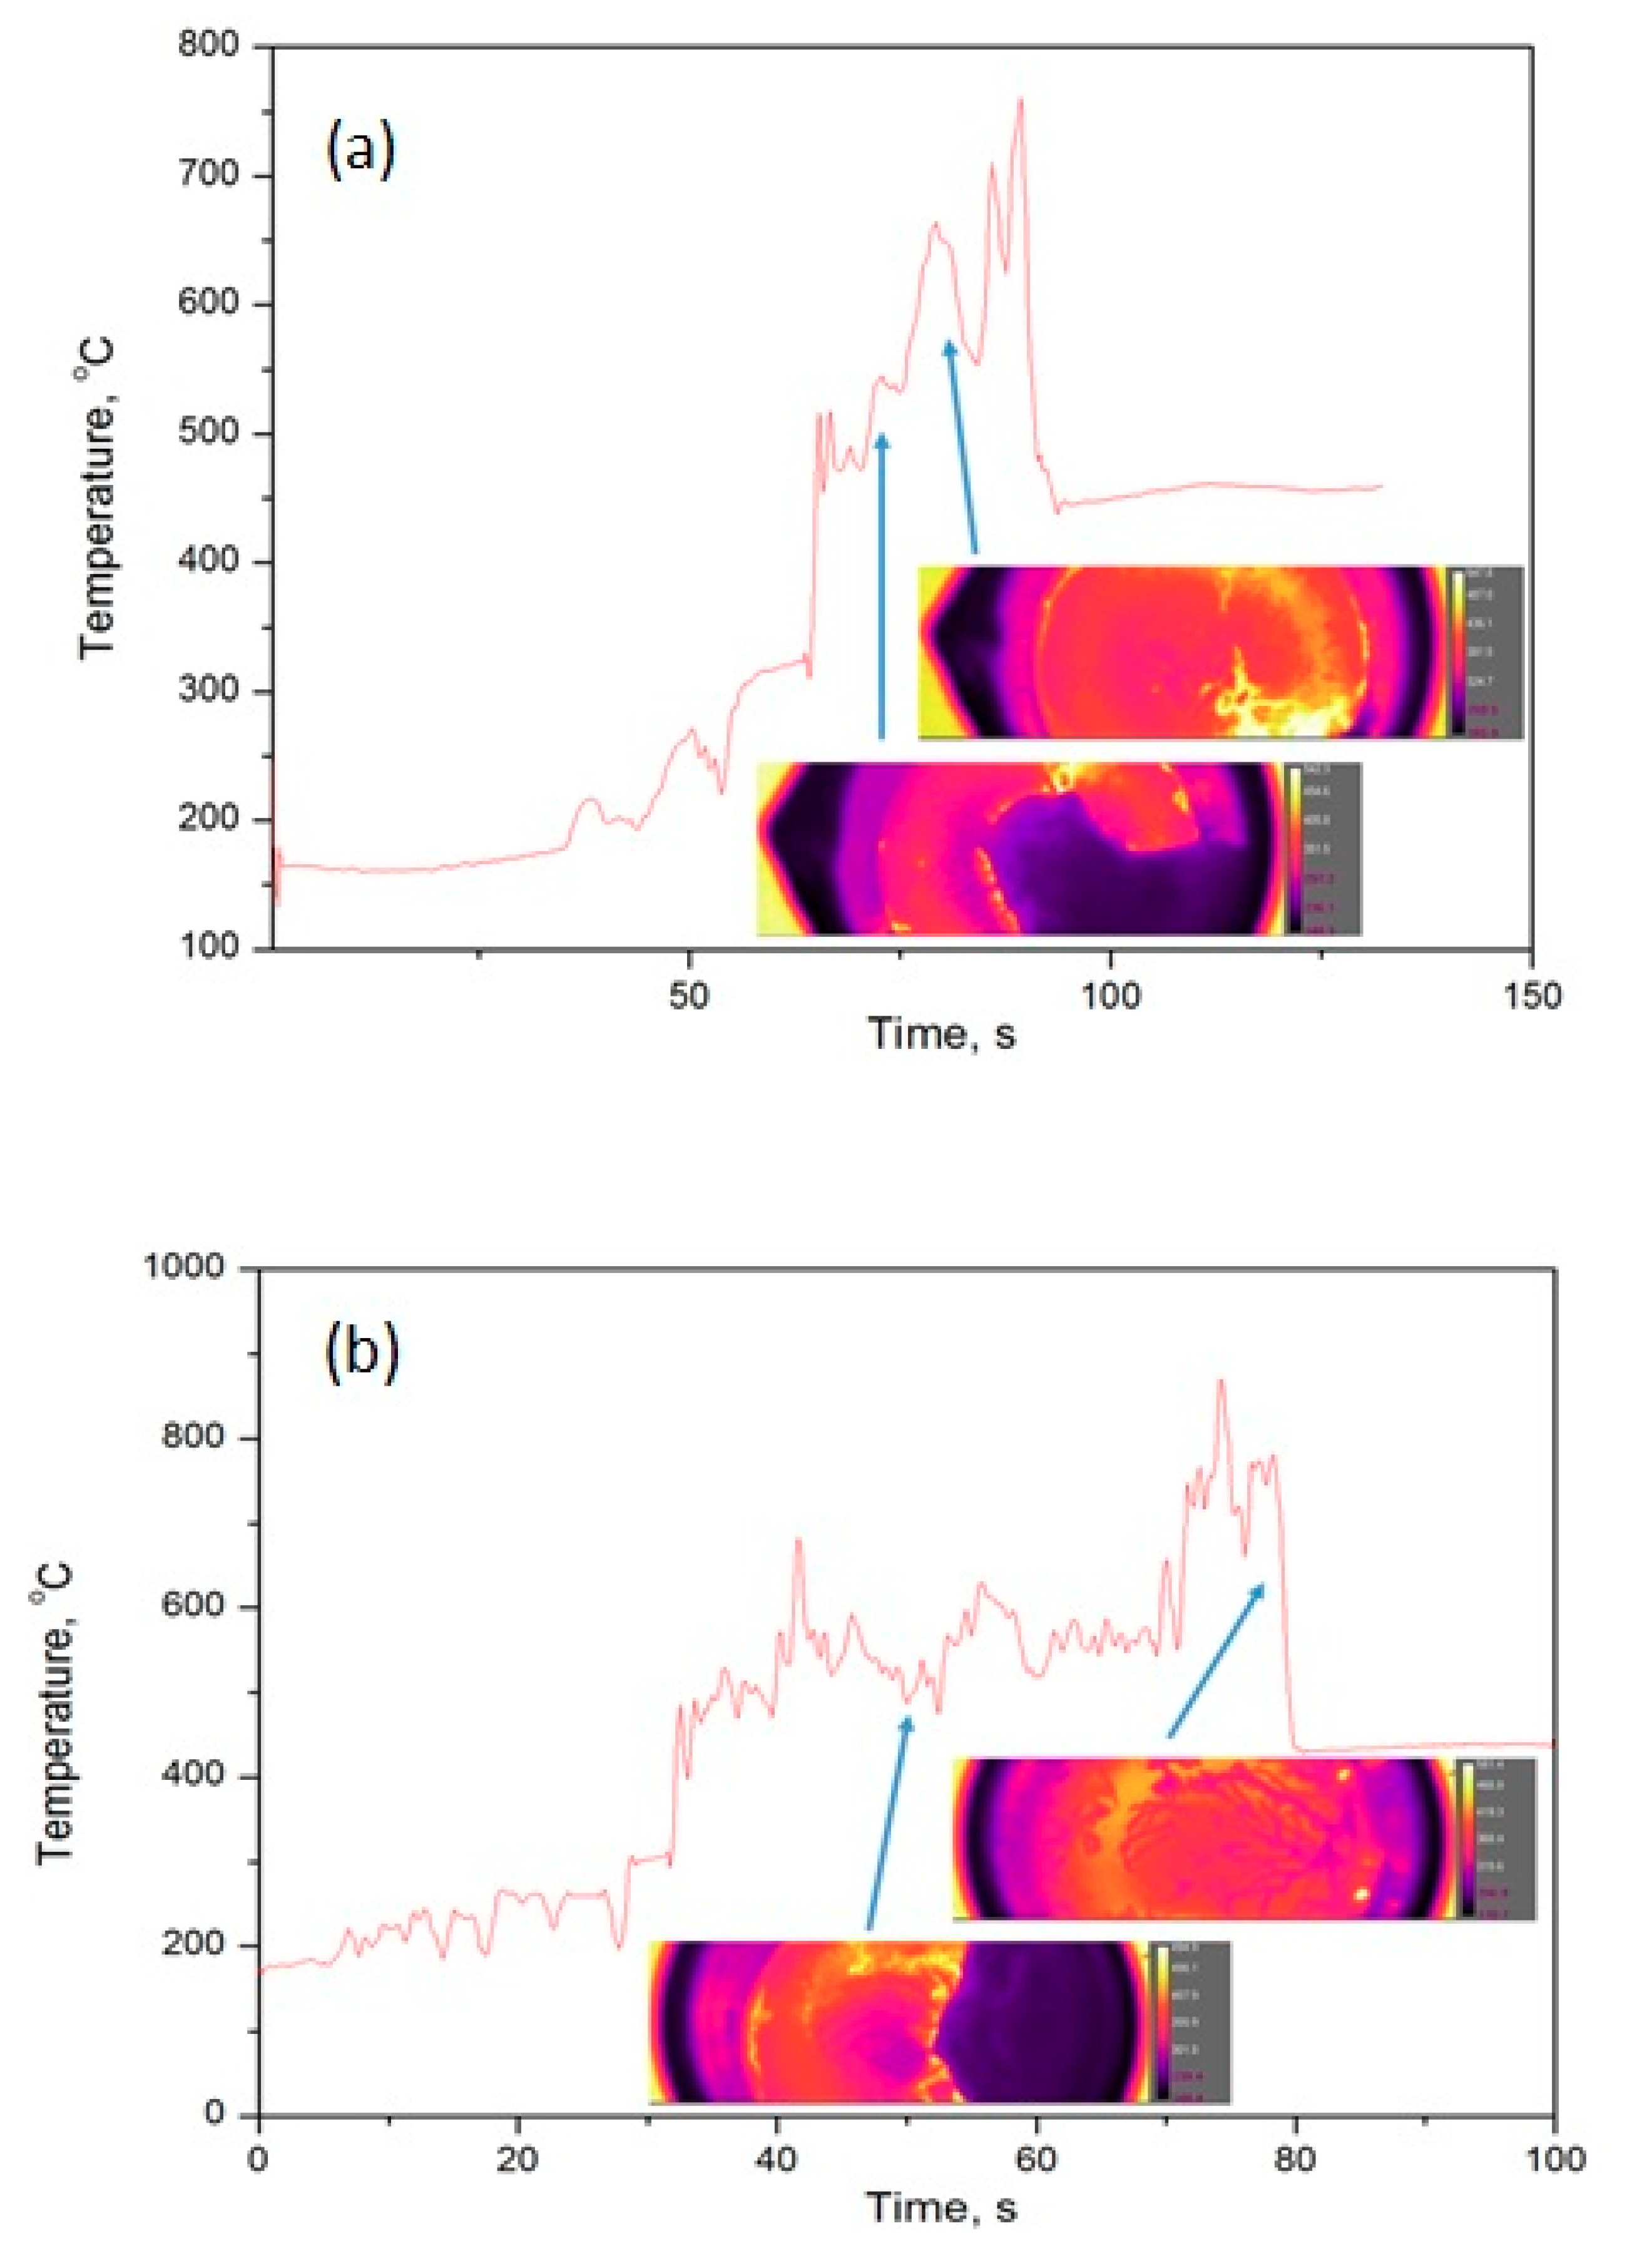
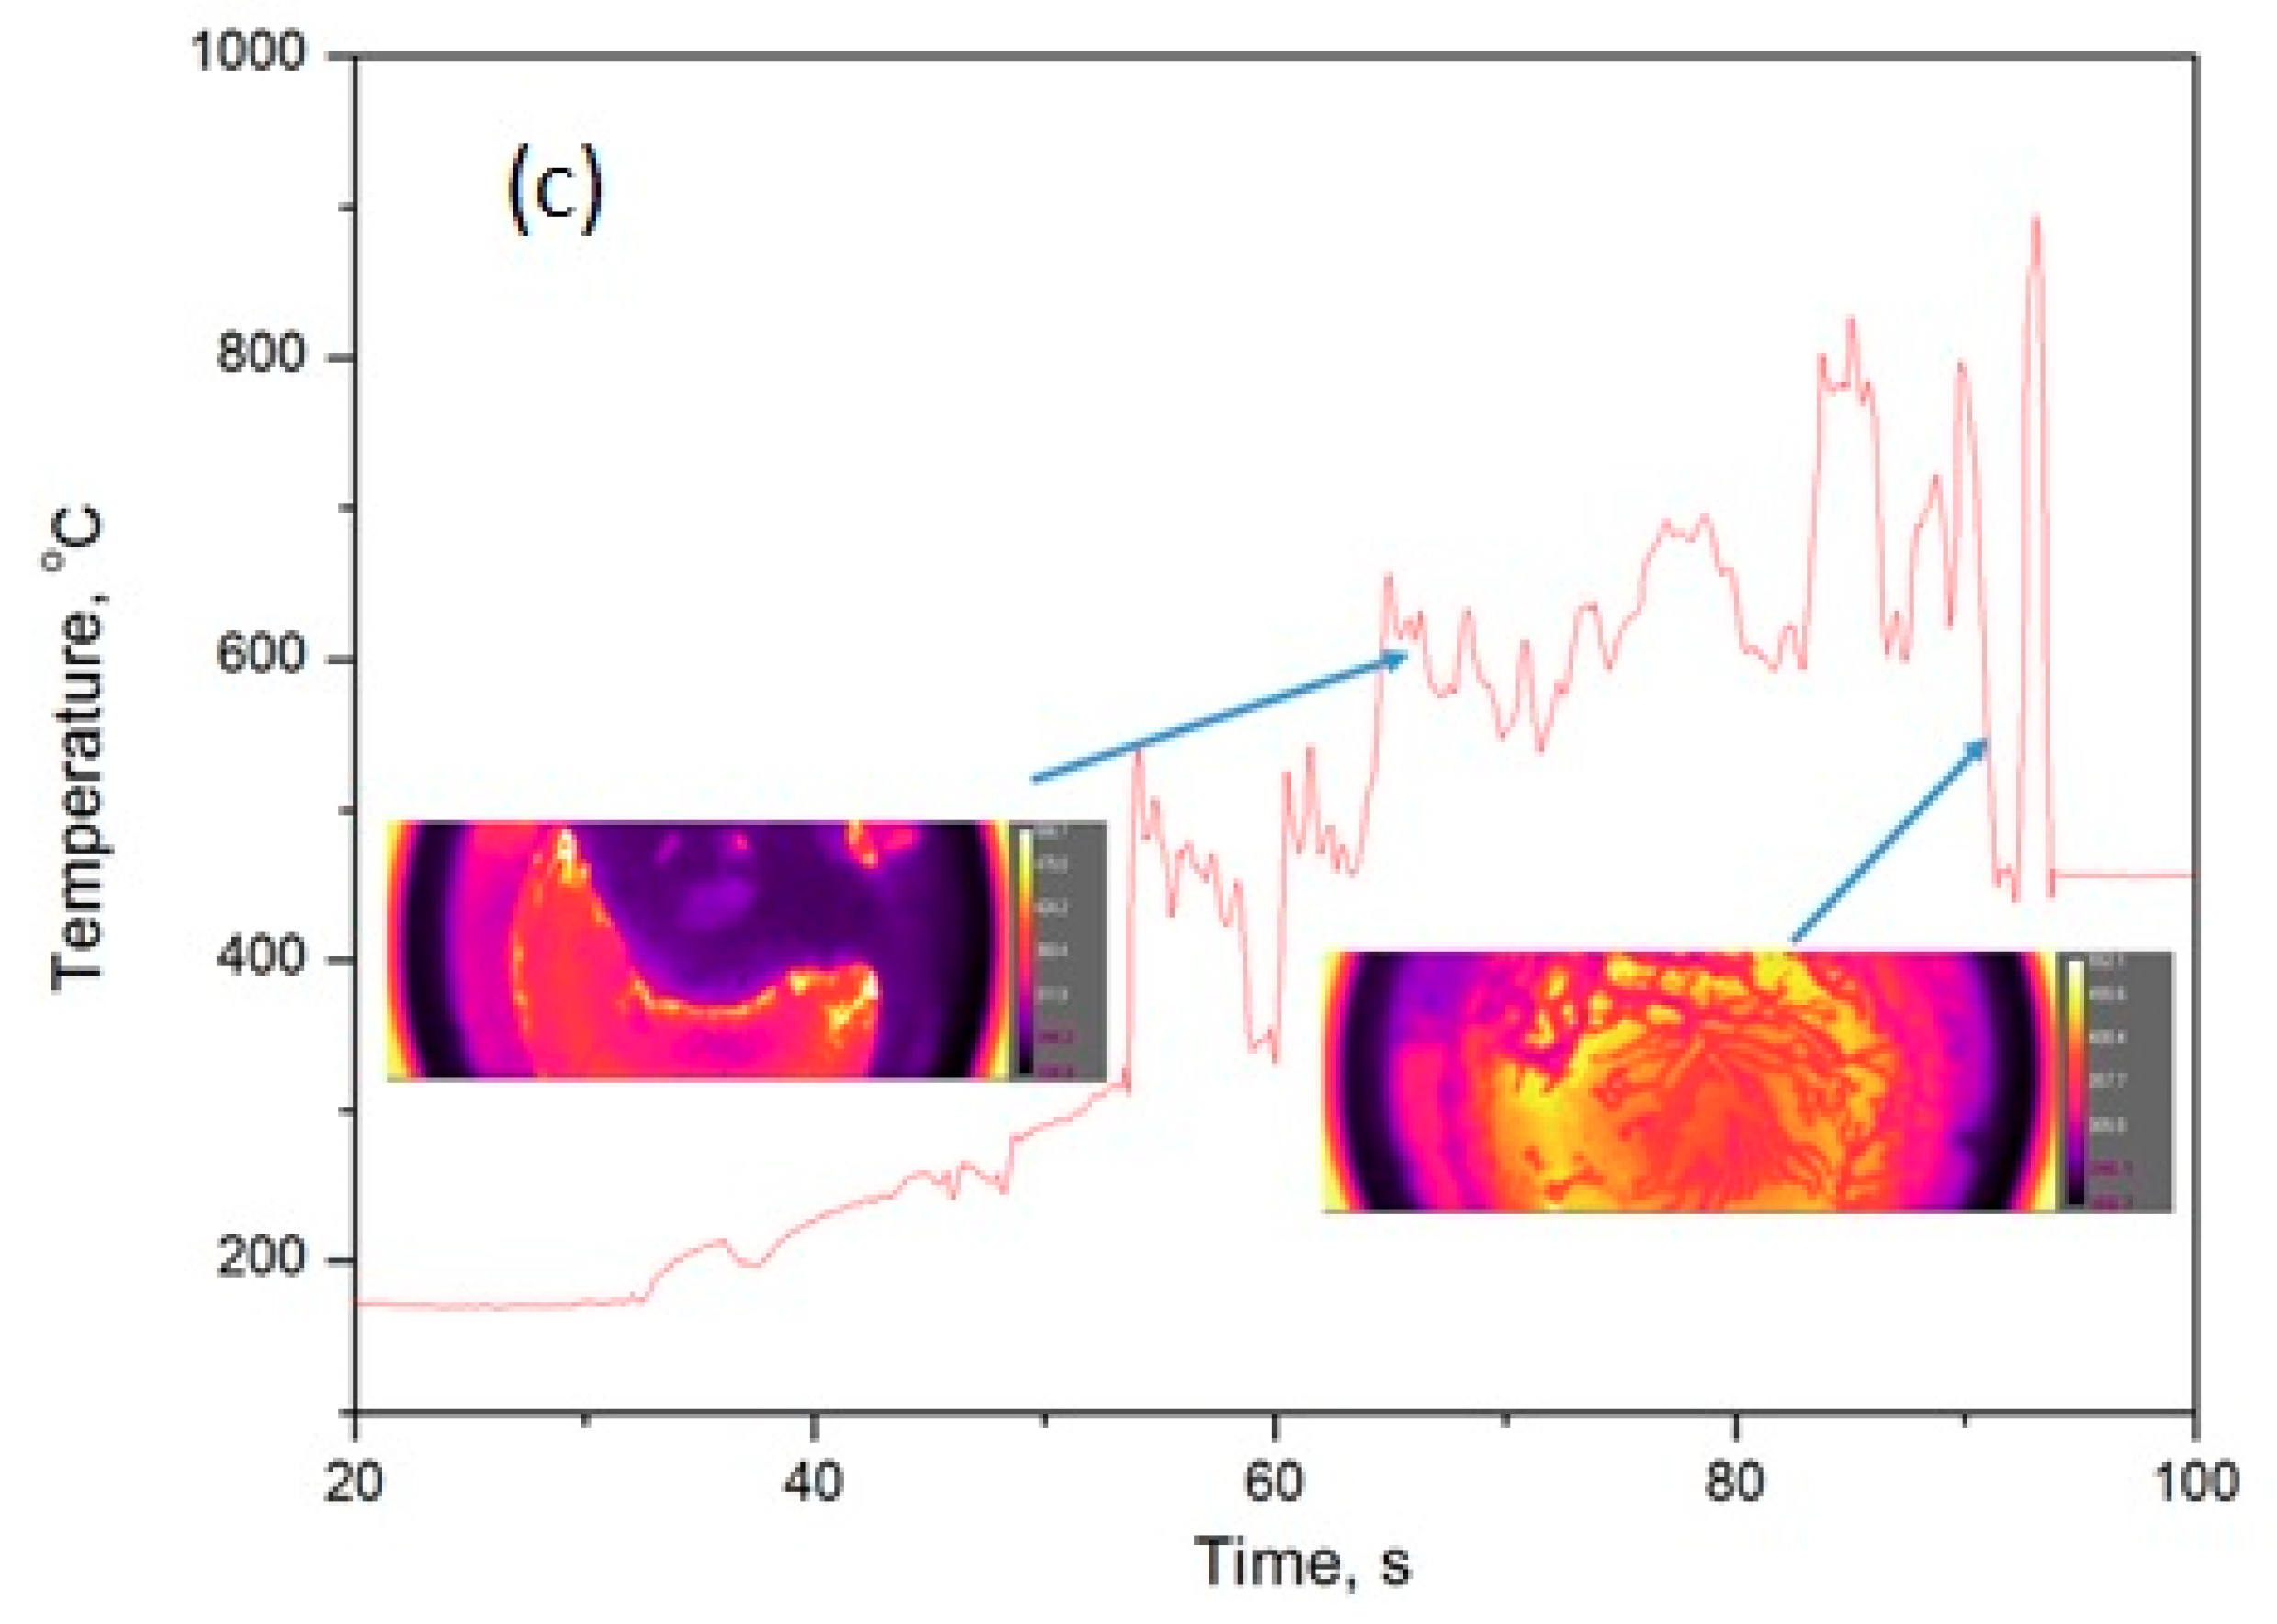
As can be seen from Figure 4, the combustion in the gel went through the dendrites. When the precursors’ concentration decreased (i.e., 100 mL, 75 mL, 50 mL H2O), the combustion temperature increased correspondingly (i.e., 760 °C, 880 °C, 900 °C). This could be associated to the fact that dendrites growing in a larger volume may have a more distributed structure and that synthesis heat loss is more intensive during combustion, resulting in a decrease in the combustion temperature. It appears that the shape and amount of dendrite growth affects all kinds of material properties.
Figure 3 exhibits the TEM images of two catalysts prepared using the SCS method at different concentrations of nickel nitrate and glycine in water. We highlight that the surface morphology was modified by changing the reactants’ concentrations in water. Thus, the concentration of the initial mixture of Ni(NO3)2 and glycine in water plays a significant role in the nano-catalyst microstructure. As it has been previously discussed [40] for this system, the catalytic activity (for the samples prepared with 50, 75, and 100 mL of water) increases as the water content also increases, indicating a connection to the reduction of the nano-crystallites sizes, a parameter that affects the catalysts’ specific surface areas. The dendrites’ growth conditions appear to be the main factor that is responsible for the observed changes in the crystallite size of the samples, as their structure depends on the concentration of nickel nitrate and glycine in the water.

4.2. Infa-Red (IR)- Camera

Earlier studies [40] revealed that, in water, nickel nitrate and glycine originate complexes which have dendrite structures. A dendrite is a branching and diverging formation that occurs during accelerated or constrained crystallization under non-equilibrium conditions when a crystal splits according to certain laws. It was determined that, in this system, dendrites can be three-dimensionally volumetric or two-dimensionally flat, and this depends on the heating conditions (in the first case, heating from all sides in the furnace, and in the second case, heating from the bottom). Interestingly, the dendrite structure depended on the water volume and it remained in the gel phase after the water evaporation. All the branches that were formed during preheating in the water remained intact in the gel phase. When the gel was heated, the combustion started and the wave of combustion went through the branches as can be seen in Figure 4. The appearance of the final product was similar to dendrites with different structures, and this depends on the concentration in the initial solution, the heating condition, composition, time of preheating, temperature of preheating, etc.
The different dendrite structures indicate that combustion took place in different conditions during SCS. The heat distribution during cooling was also affected, and, in both stages, crystallites were formed. The more developed the structure of dendrites, the lower the combustion temperature, the higher the cooling velocity, and the smaller the size of crystallites. Here, we can conclude that a new type of combustion was discovered: combustion in dendrites. Figure 4 depicts dendrites during combustion and temperatures of combustion at different concentrations of the precursor in water.
As can be seen from Figure 4, combustion in gel went through the dendrites, and when the precursor’s concentration decreased (i.e., 100 mL, 75 mL, 50 mL H2O), the combustion temperature increased correspondingly (i.e., 760 °C, 880 °C, 900 °C). This could be associated to the fact that dendrites growing in a larger volume have a more distributed structure, and during combustion synthesis, heat loss is more intensive, resulting in a decrease in the combustion temperature. It appears that the shape and amount of dendrite growth affects all sorts of material properties.

4.3. X-ray Photoelectron Spectroscopy (XPS)

In our previous study [40], it was concluded that catalytic activity increases by decreasing the precursor’s concentration. However, it is of high importance to investigate the influence of the precursor’s concentration in the initial mixture on the composition of the catalytic surface. To begin with, the XRD analysis revealed the presence of two resulting phases in the composition of the final products: nickel oxide and metallic cubic nickel.
The presence of vacancies is very common in the stoichiometry of NiO. Hence, XPS would be a handy tool to detect any changes in the surface’s chemical or electronic properties. The percentage concentration of Ni and O at the surface of nano-nickel catalysts produced by SCS is presented in Table 3.
The data presented in Table 3 were acquired from the survey spectrum and shows a consistent decrease in oxygen content at the surface. This finding could be of interest, as the decreased concentration of oxygen may lead to bridging of the oxygen structures in the NiO lattice. Table 4 shows the binding energy values of the Ni2+ and Ni3+ states in the Ni 2p spectra of the XPS analysis.
As can be seen from Table 4, in all cases (from 25 mL to 100 mL), NiO was oxidized to Ni2O3. The two Ni2+ ions lost an extra electron each to form Ni3+ to maintain charge neutrality, generating quasi-localized holes for each Ni vacancy. The NiO structure is more Ni deficient and can result in the bridging of the oxygen structure. These bridging structures can cause problems in the adsorption of hydrogen on the catalyst surface and, as consequence, reduce its activity.
The size dependence of the conventional exchange bias and anisotropic energy between the Ni-core and the NiO-shell nanoparticles was studied. The shell grew at the expense of the Ni-core, forming a passivating layer of NiO as confirmed and estimated by the XPS measurements. Figure 5 demonstrates the Ni 2p core level spectra for all four samples.
These spectra were fitted to find the influence of the water concentration in defining the oxidation state of Ni. The intense Ni 2p3/2 peak could be fitted with two components: one at 854.2 ± 0.2 eV and the other at 856.2 ± 0.2 eV. The lower energy component corresponded to the Ni2+ state in the standard Ni–O octahedral bonding configuration in NiO, while the one at the higher energy corresponded to the Ni2+ vacancy-induced Ni3+ states. The changes in the area of these two components can be directly linked to the surface concentrations of these two species. By comparing the intensities, it can clearly be seen that by increasingly adding water, the concentration of the surface-oxidized states increased considerably. The Ni2+ to Ni3+ ratio decreased considerably, from 3.3 to 1.3. The presence of strong satellite peaks around 864 eV and 880 eV is typical for NiO2. Satellites are typical for d-block elements. Satellites arise due to the interaction between unfilled d orbitals and O 2p orbitals of the oxygen ligand. Satellites arise due to the multi-electron excitation transitions between unfilled Ni 3d orbitals and O 2p orbitals of the oxygen ligand. After a photoelectron is emitted from the nickel 2p site, two final states are possible:
(1) To screen the core hole, the Ni 3d level is pulled down below the ligand level (O 2p) and one electron is transferred from the ligand into the Ni 3d level. This corresponds to the main line with a final configuration given by c3d9L (c denotes a hole in the core level).
(2) There is no charge transfer between the ligand and nickel and the system stays in its c3d8 configuration resulting in the satellite line.
The O1s spectra in Figure 6 showed considerable changes in the spectral features. Oxygen spectra for the Ni25 sample had contributions of three different bonding environments Ni2+–O (529.8 ± 0.2 eV and 531.8 ± 0.2 eV) and NiOOH (532.5 ± 0.2 eV). The presence of NiOOH at the surface may be attributed to the incomplete reaction of precursor materials. The deprotonation of NiOOH is highly dependent on the pH of the solution and occurs at neutral or moderately alkaline pH conditions (7–11). This could be a possible reason explaining the absence of this component in the O1s spectrum with added water. However, the increase in the surface concentration of Ni3+–O was also reflected in this spectrum (Table 3).
Table 5 presents the binding energy values of oxygen bonded in the NiO and Ni2O3 states on the catalysts’ surface produced by SCS.
Hence, it can be suggested, based on the XPS spectra, that the addition of water in the SCS yields higher concentrations of surface-oxidized states. The ratio NiO/Ni2O3 decreased from 4.3 (50 mL of water) to 1.35 (100 mL of water), explaining why nickel catalyst activity in the hydrogenation of maleic acid increased in this row. Thus, the reason for the changing activity was that the NiO structure resulted in the bridging of the oxygen structure. These bridging structures can cause problems in the adsorption of hydrogen on the catalyst’s surface and, as consequence, reduces its activity.

4.4. Catalytic Hydrogenation of Maleic Acid

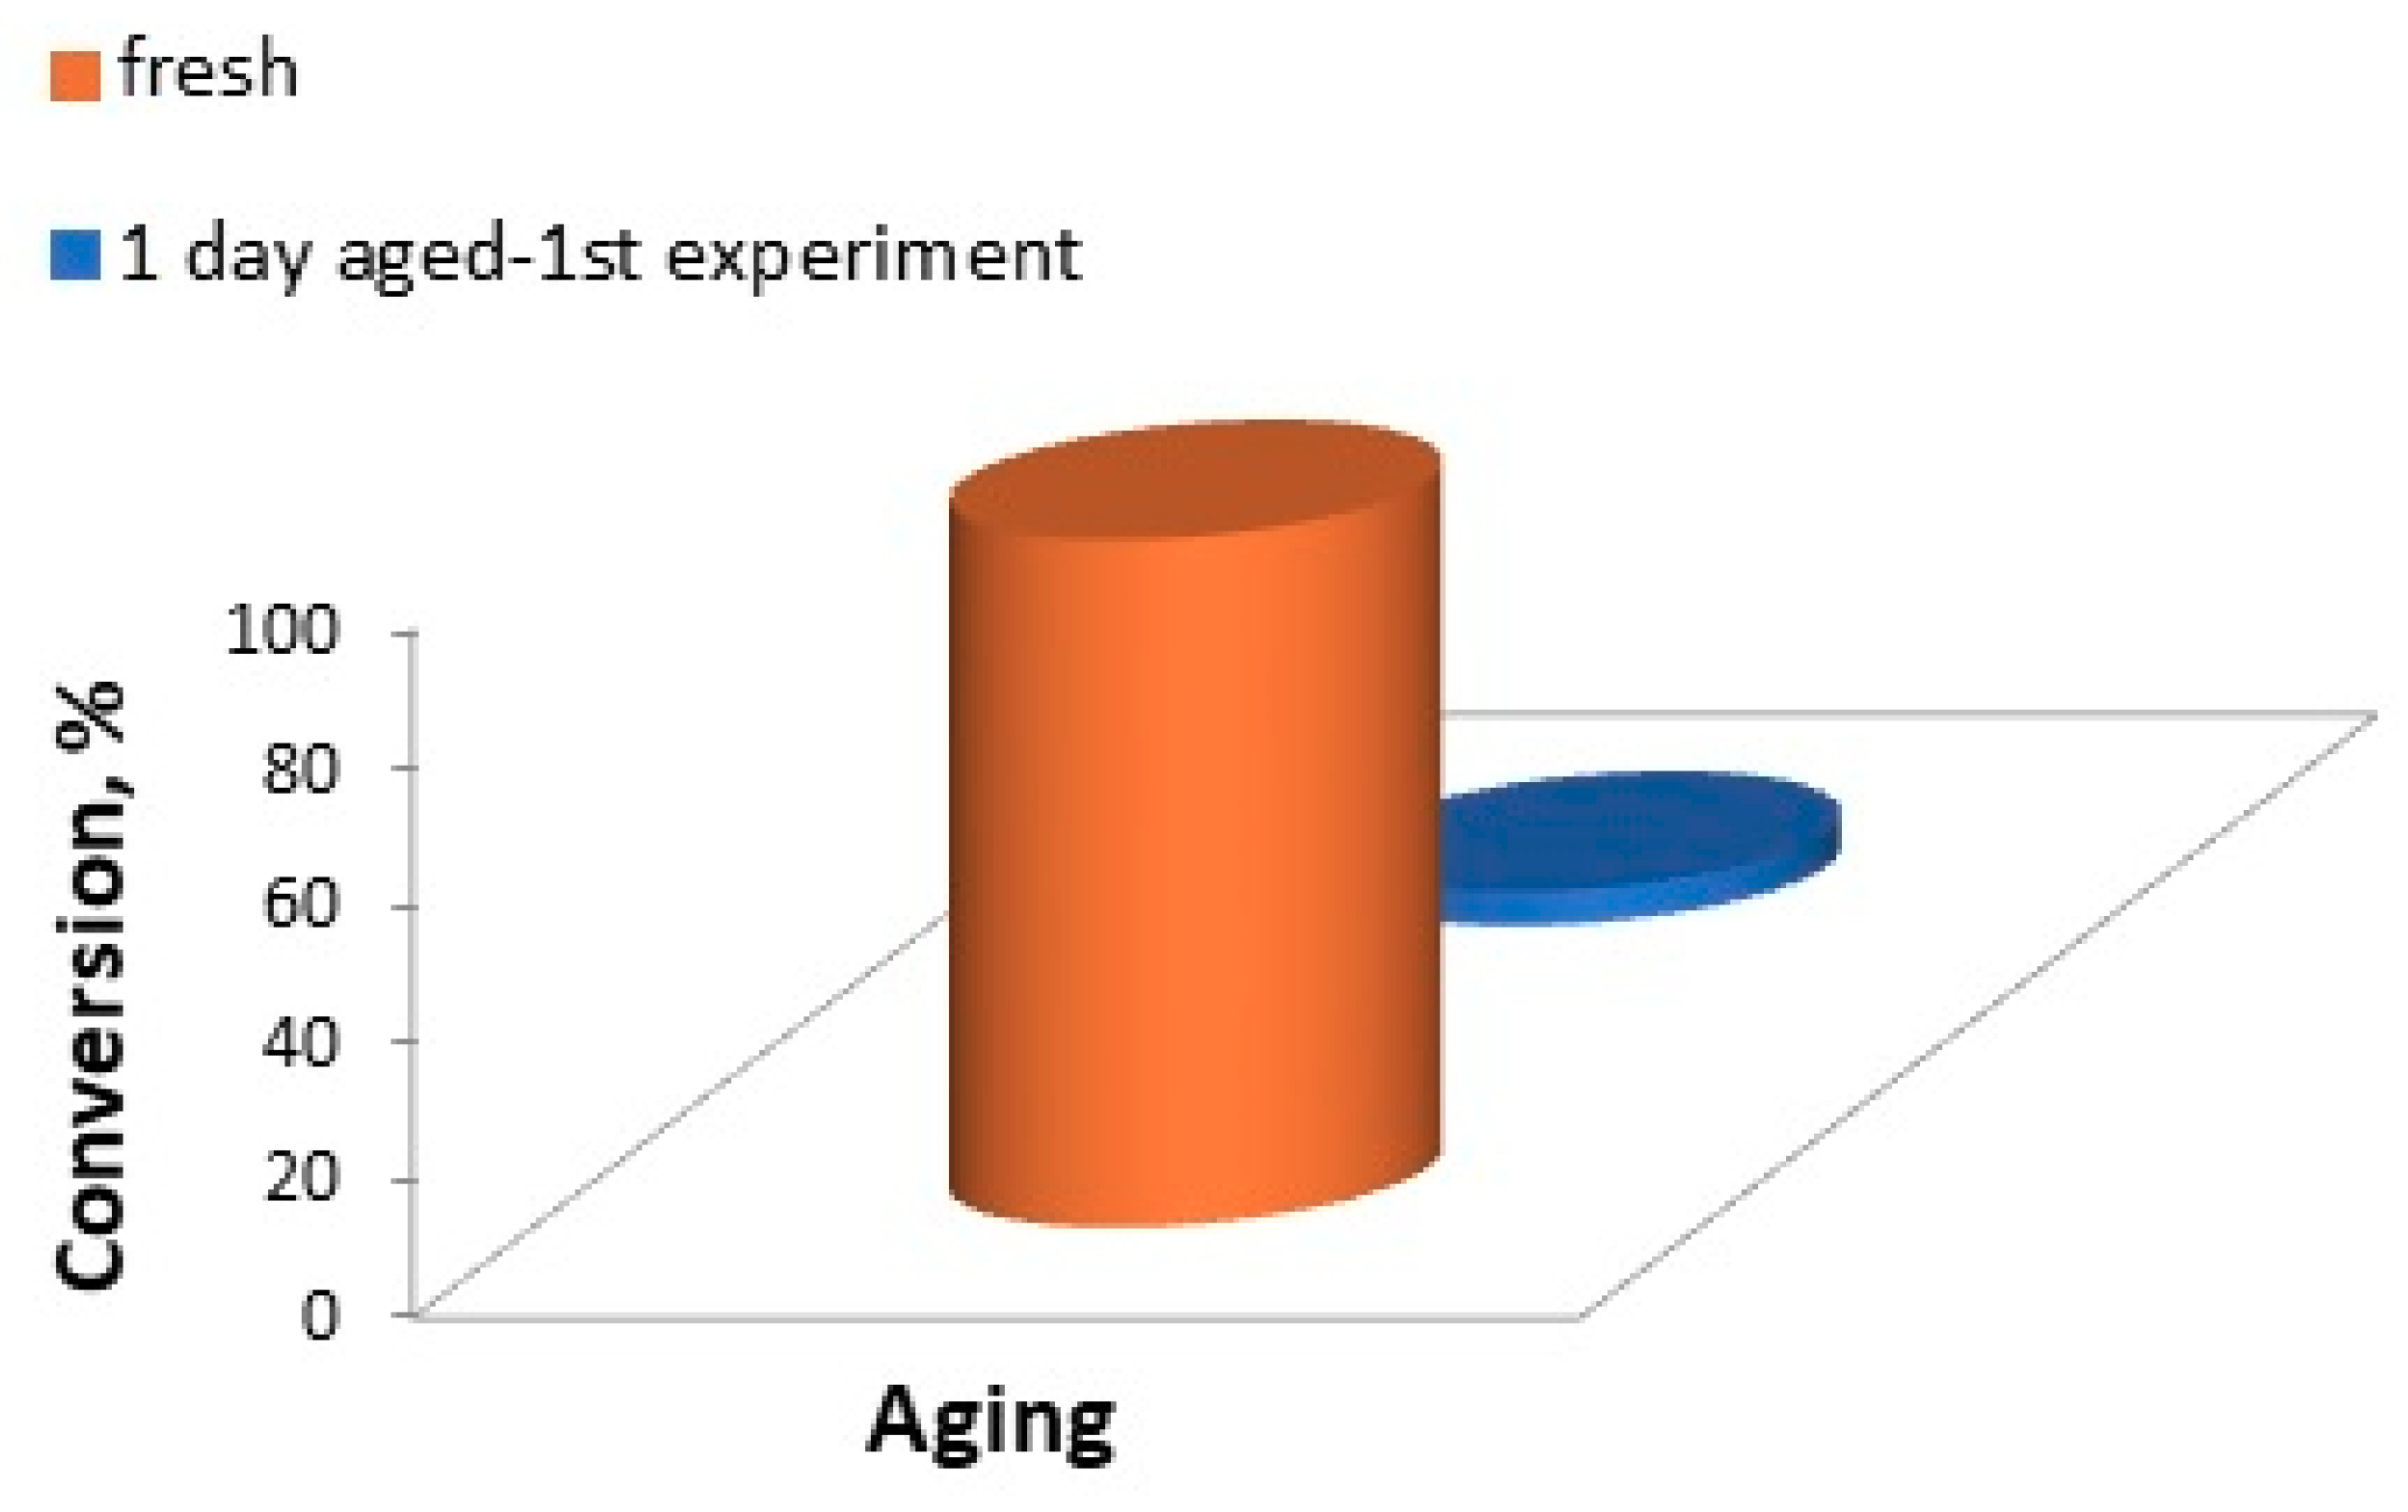
The catalytic performance of the SCS-derived Ni-based nanocatalysts was studied, focusing on the hydrogenation of maleic acid in the liquid phase. It was found that, when freshly prepared Ni catalyst was immediately employed in the liquid phase hydrogenation of maleic acid, it was very active and the degree of conversion of maleic acid into succinic acid was 100%. However, when the same catalyst was used, after one day it was almost inactive (Figure 7). This implies that the catalyst’s composition or structure (or both) changed and so did its adsorption properties. This reveals the necessity to investigate the reasons for the severe reduction in the catalyst’s activity in the liquid phase hydrogenation of maleic acid. The term “structural changes” means the reduction of the catalysts’ specific surface area and the alteration of their structural characteristics (i.e., porosity, specific volume, and average pore radius) due to the implied aging of the catalysts. As a result of the abovementioned changes, the number and nature of the active centers were altered as well as the adsorption energy of the surface.

4.5. Reversed Flow – Inverse Gas Chromatography (RF-IGC)

The hydrogen adsorption phenomena can reveal how adsorption properties and surface properties are changed under aging conditions. There can be variations concerning the nature and the different groups of the active sites for hydrogen adsorption over Ni catalysts. Thus, the various adsorption parameters are here presented which are related to hydrogen adsorption in the context of maleic acid hydrogenation in a temperature that allows for the maximum catalytic activity (80 °C).
The local energy of adsorption (ε), the local isotherm (θ), the local maximum monolayer capacity (c*max), the local adsorbed equilibrium concentration of CO (c*s) as well as the energy distribution function ϕ (ε; t) are the physicochemical parameters that were determined by RF-IGC, and they are related to the examination of the surface heterogeneity.
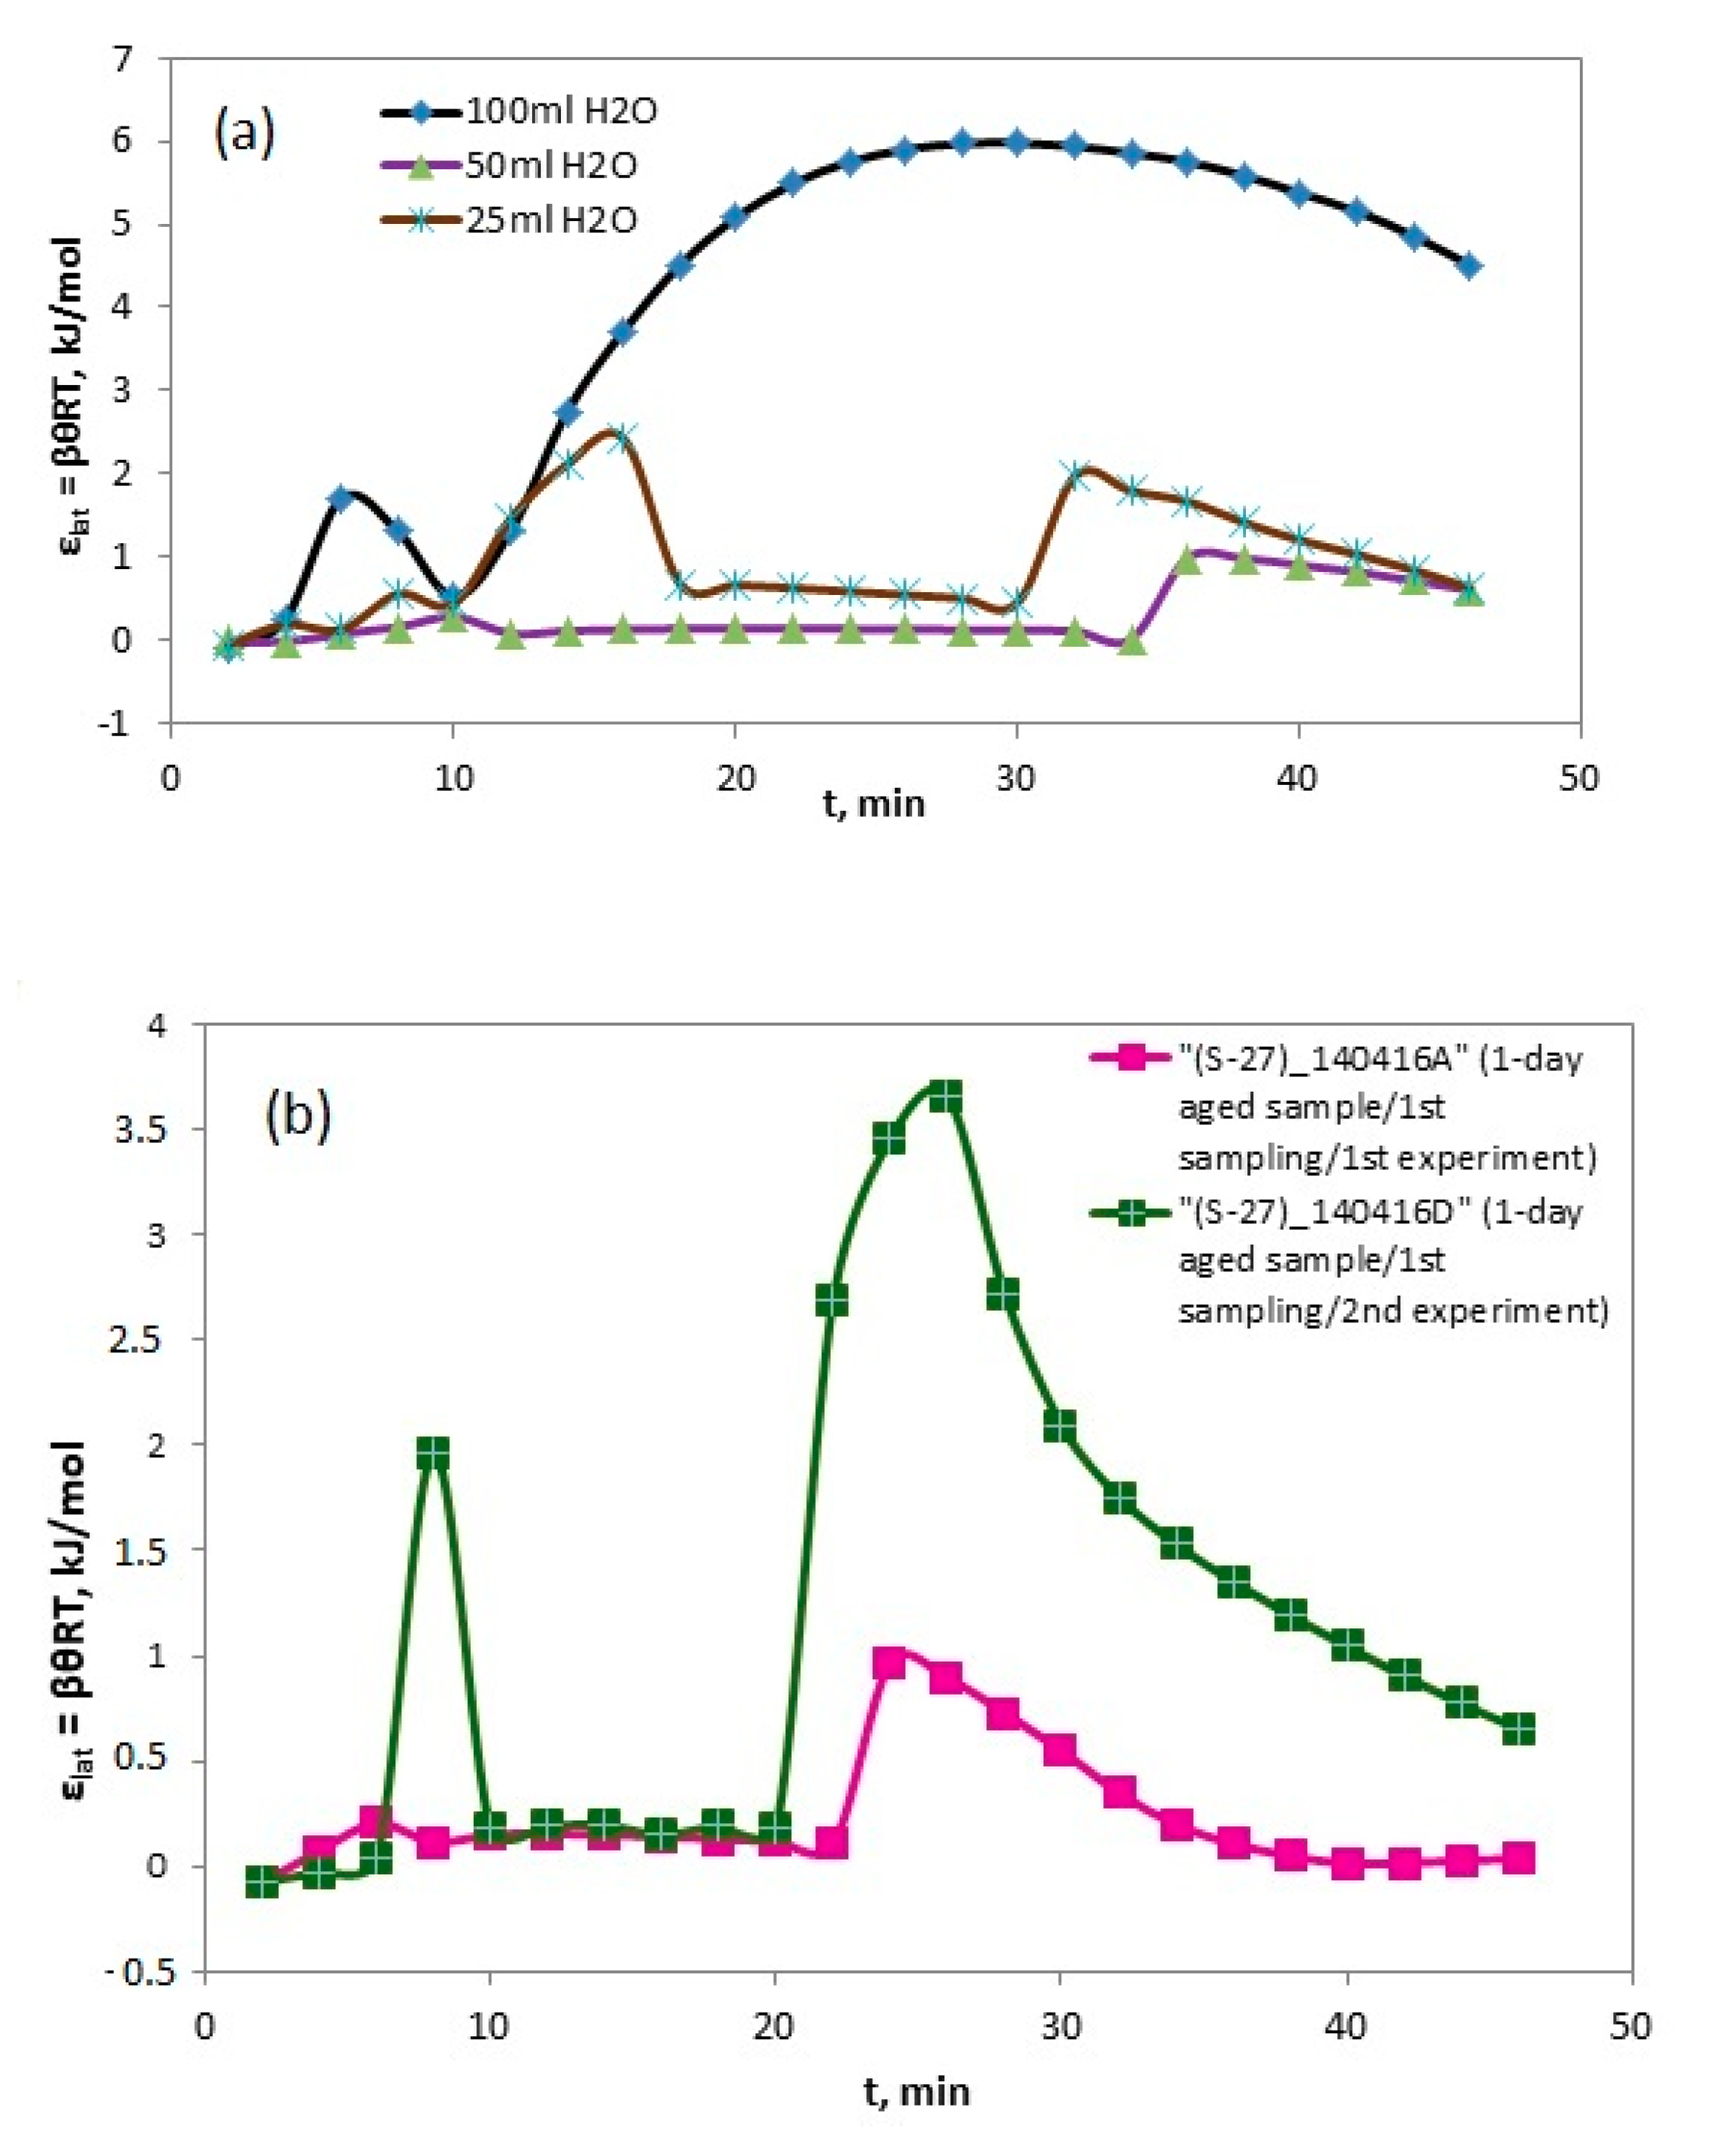
The time distribution of the lateral local adsorption energies, among the adsorbed species for the different powdered catalyst samples, illustrates the different characteristics of the surfaces of catalysts prepared at different quantities of water (Figure 8a) and aging durations (Figure 8b).
Figure 8a depicts the time variation of the lateral local adsorption energies which are the points distinguishing the various types of active sites in each catalyst.
The change of activity during aging can be explained by the presence of at least two types of active centers on the catalyst surface (Figure 8b). Some of them are responsible for adsorption reactions, and their number per unit surface of the catalyst does not change during aging. Others catalyze the reaction of hydrogen redistribution, and when the catalyst is aging, their properties and the number of active centers per unit surface significantly change.
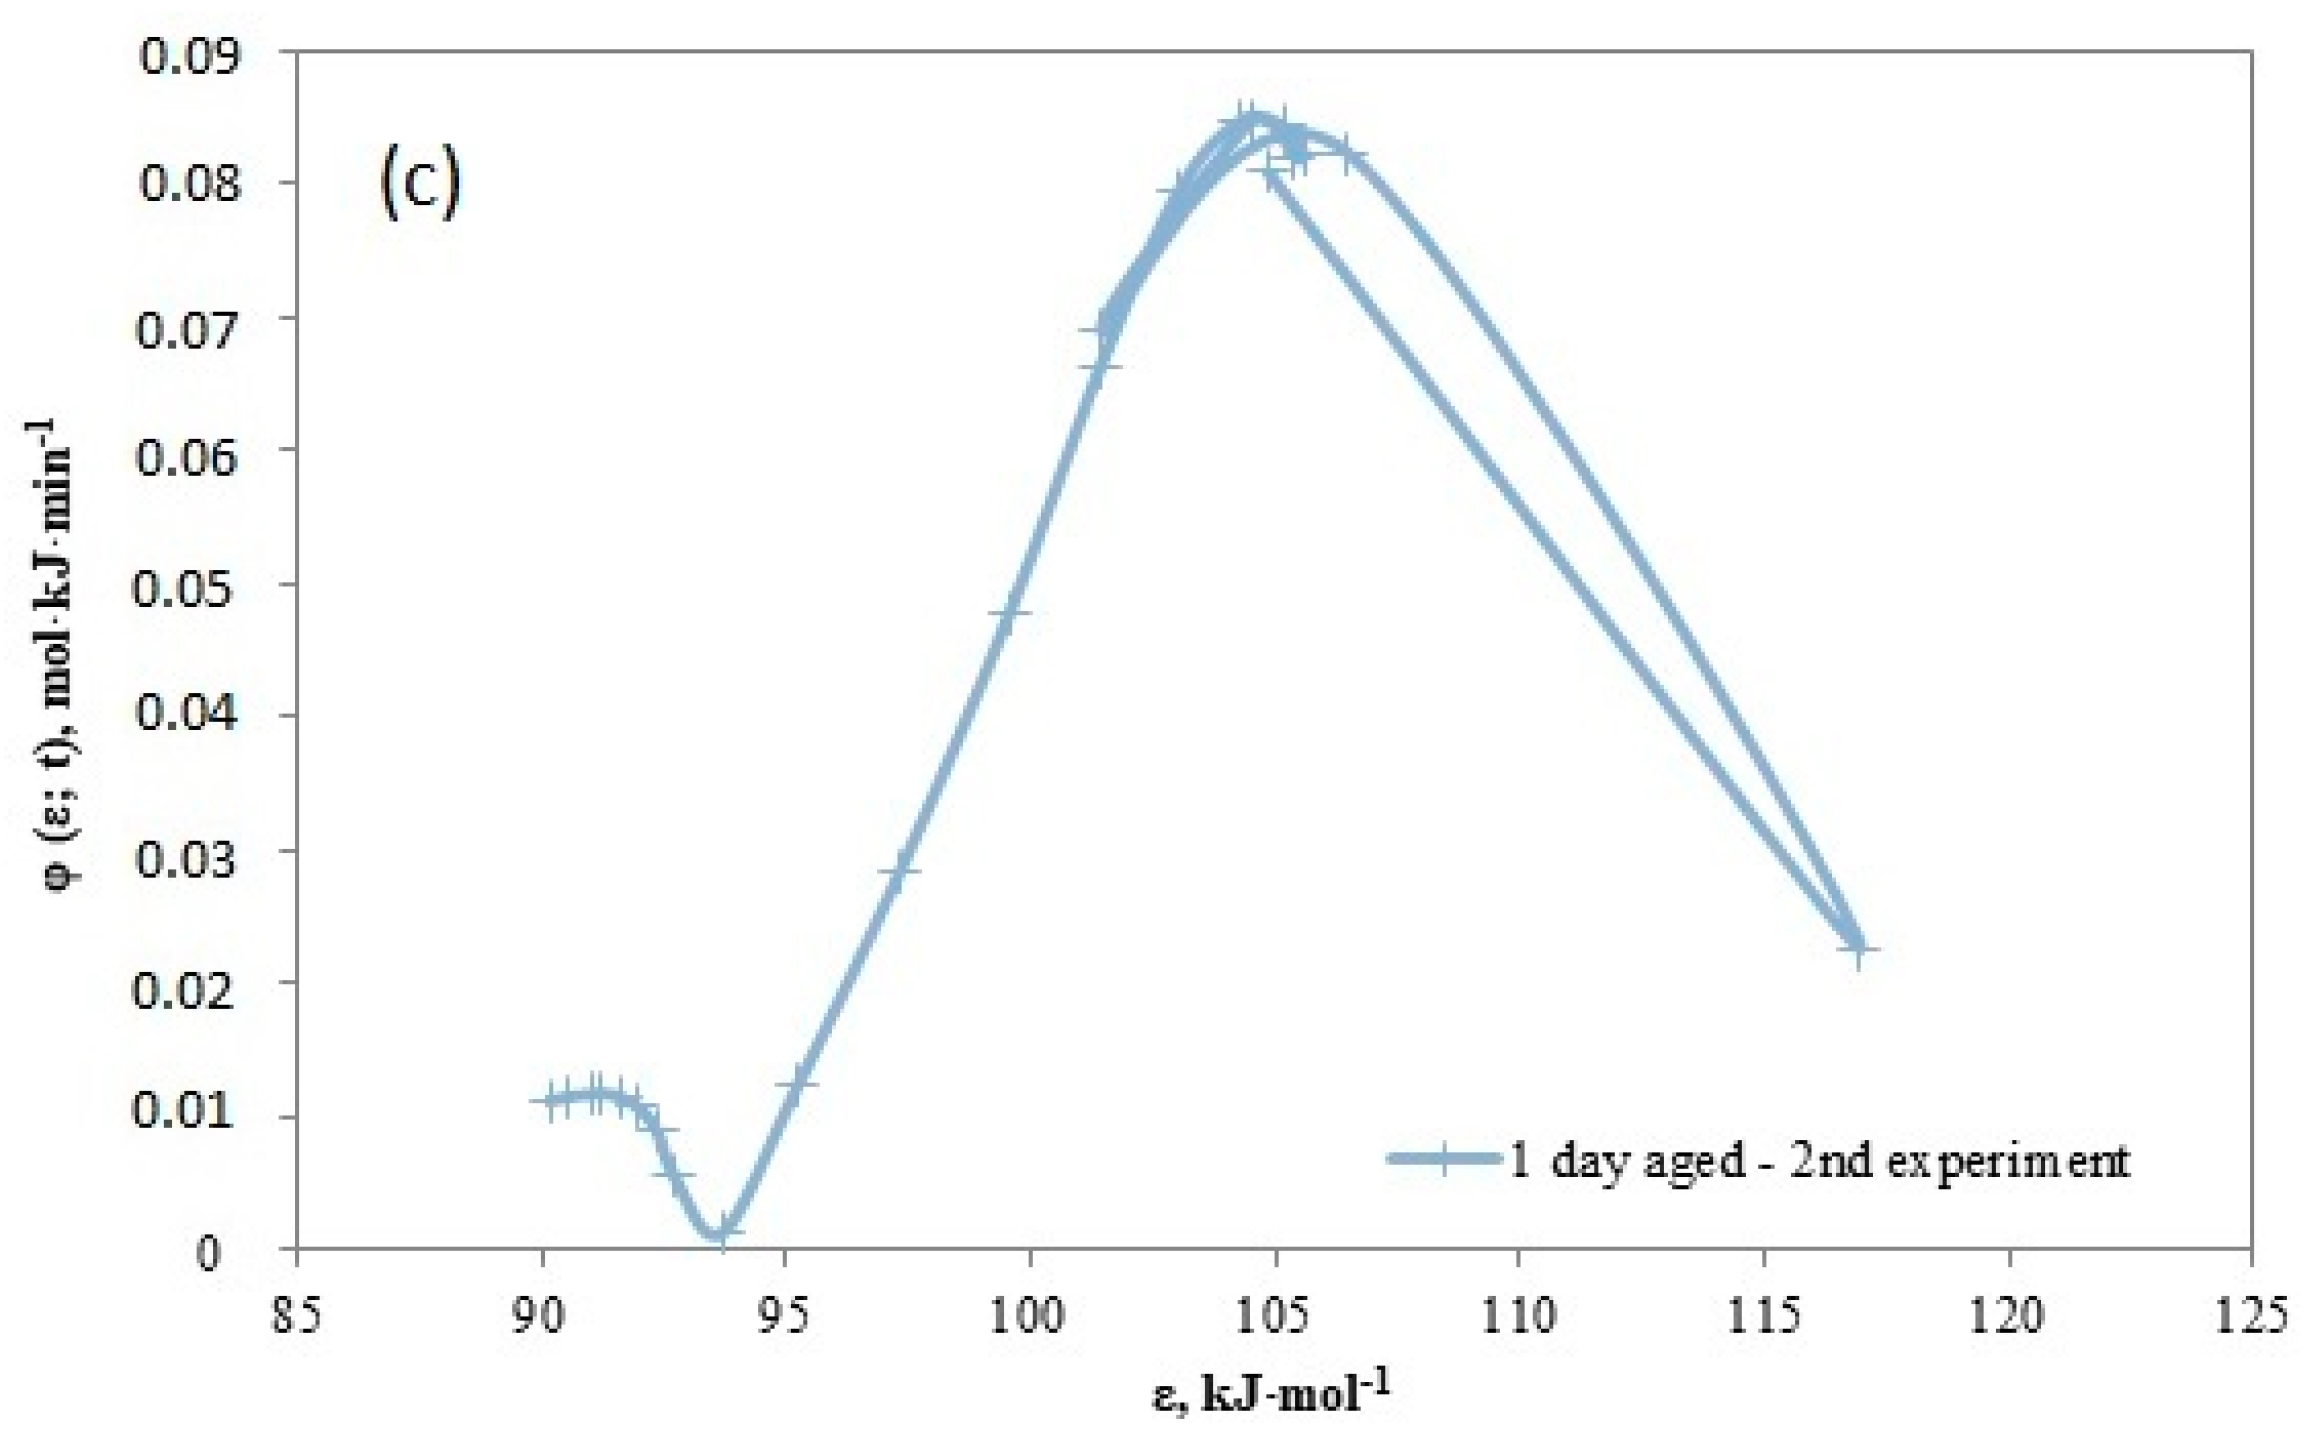
Figure 9a–c depicts the rough aspect of the surface heterogeneity of the powdered catalyst S-27 (75 mL of water in the initial mixture): fresh catalyst and 1 day aged catalyst (first and second experiment) through the distribution density function of the local adsorption energies over energy.
The various curves shown in Figure 9, obtained for the hydrogen adsorption over the produced catalysts, illustrate the existence of three types of active sites with respect to adsorption energy ε. Groups A, B, and C (Figure 9a) indicate the three groups of active sites corresponding to higher, intermediate, and lower energies of adsorption, respectively. In general, Type A active sites, corresponding to high values of ε, demonstrate a narrower distribution compared to the main curve B, while the type C active sites, which correspond to lower energies of adsorption, form a narrow distribution. After 1 day of aging of the SCS nanocatalyst, the adsorption of hydrogen changed and there was only one group of active centers with respect to the adsorption energy (Figure 9b). This justifies the change in the activity of the Ni nanocatalysts after 1 day of aging. The aged catalyst (first experiment) (Figure 6b) had only one type of active site because of the changing composition and structure as shown in the XPS and TEM results. The aged catalyst (second experiment) (Figure 9c) had only two types of active sites due to the reduction of NiO with hydrogen after the first experiment and which resulted in the nickel providing the second type of active site.
A possible explanation for the change in the number of active centers with aging is the structural and composition alterations. The difference between the fresh catalyst and 1 day aged catalyst was that, in the 1 day aged catalyst, the concentrations of NiO and Ni2O3 increased on the surface because of the oxidation process as shown in the XPS analysis. The difference between the first and second experiment for the 1 day aged catalyst was the nickel concentration on the surface, due to the reduction in the nickel oxide after the first experiment.
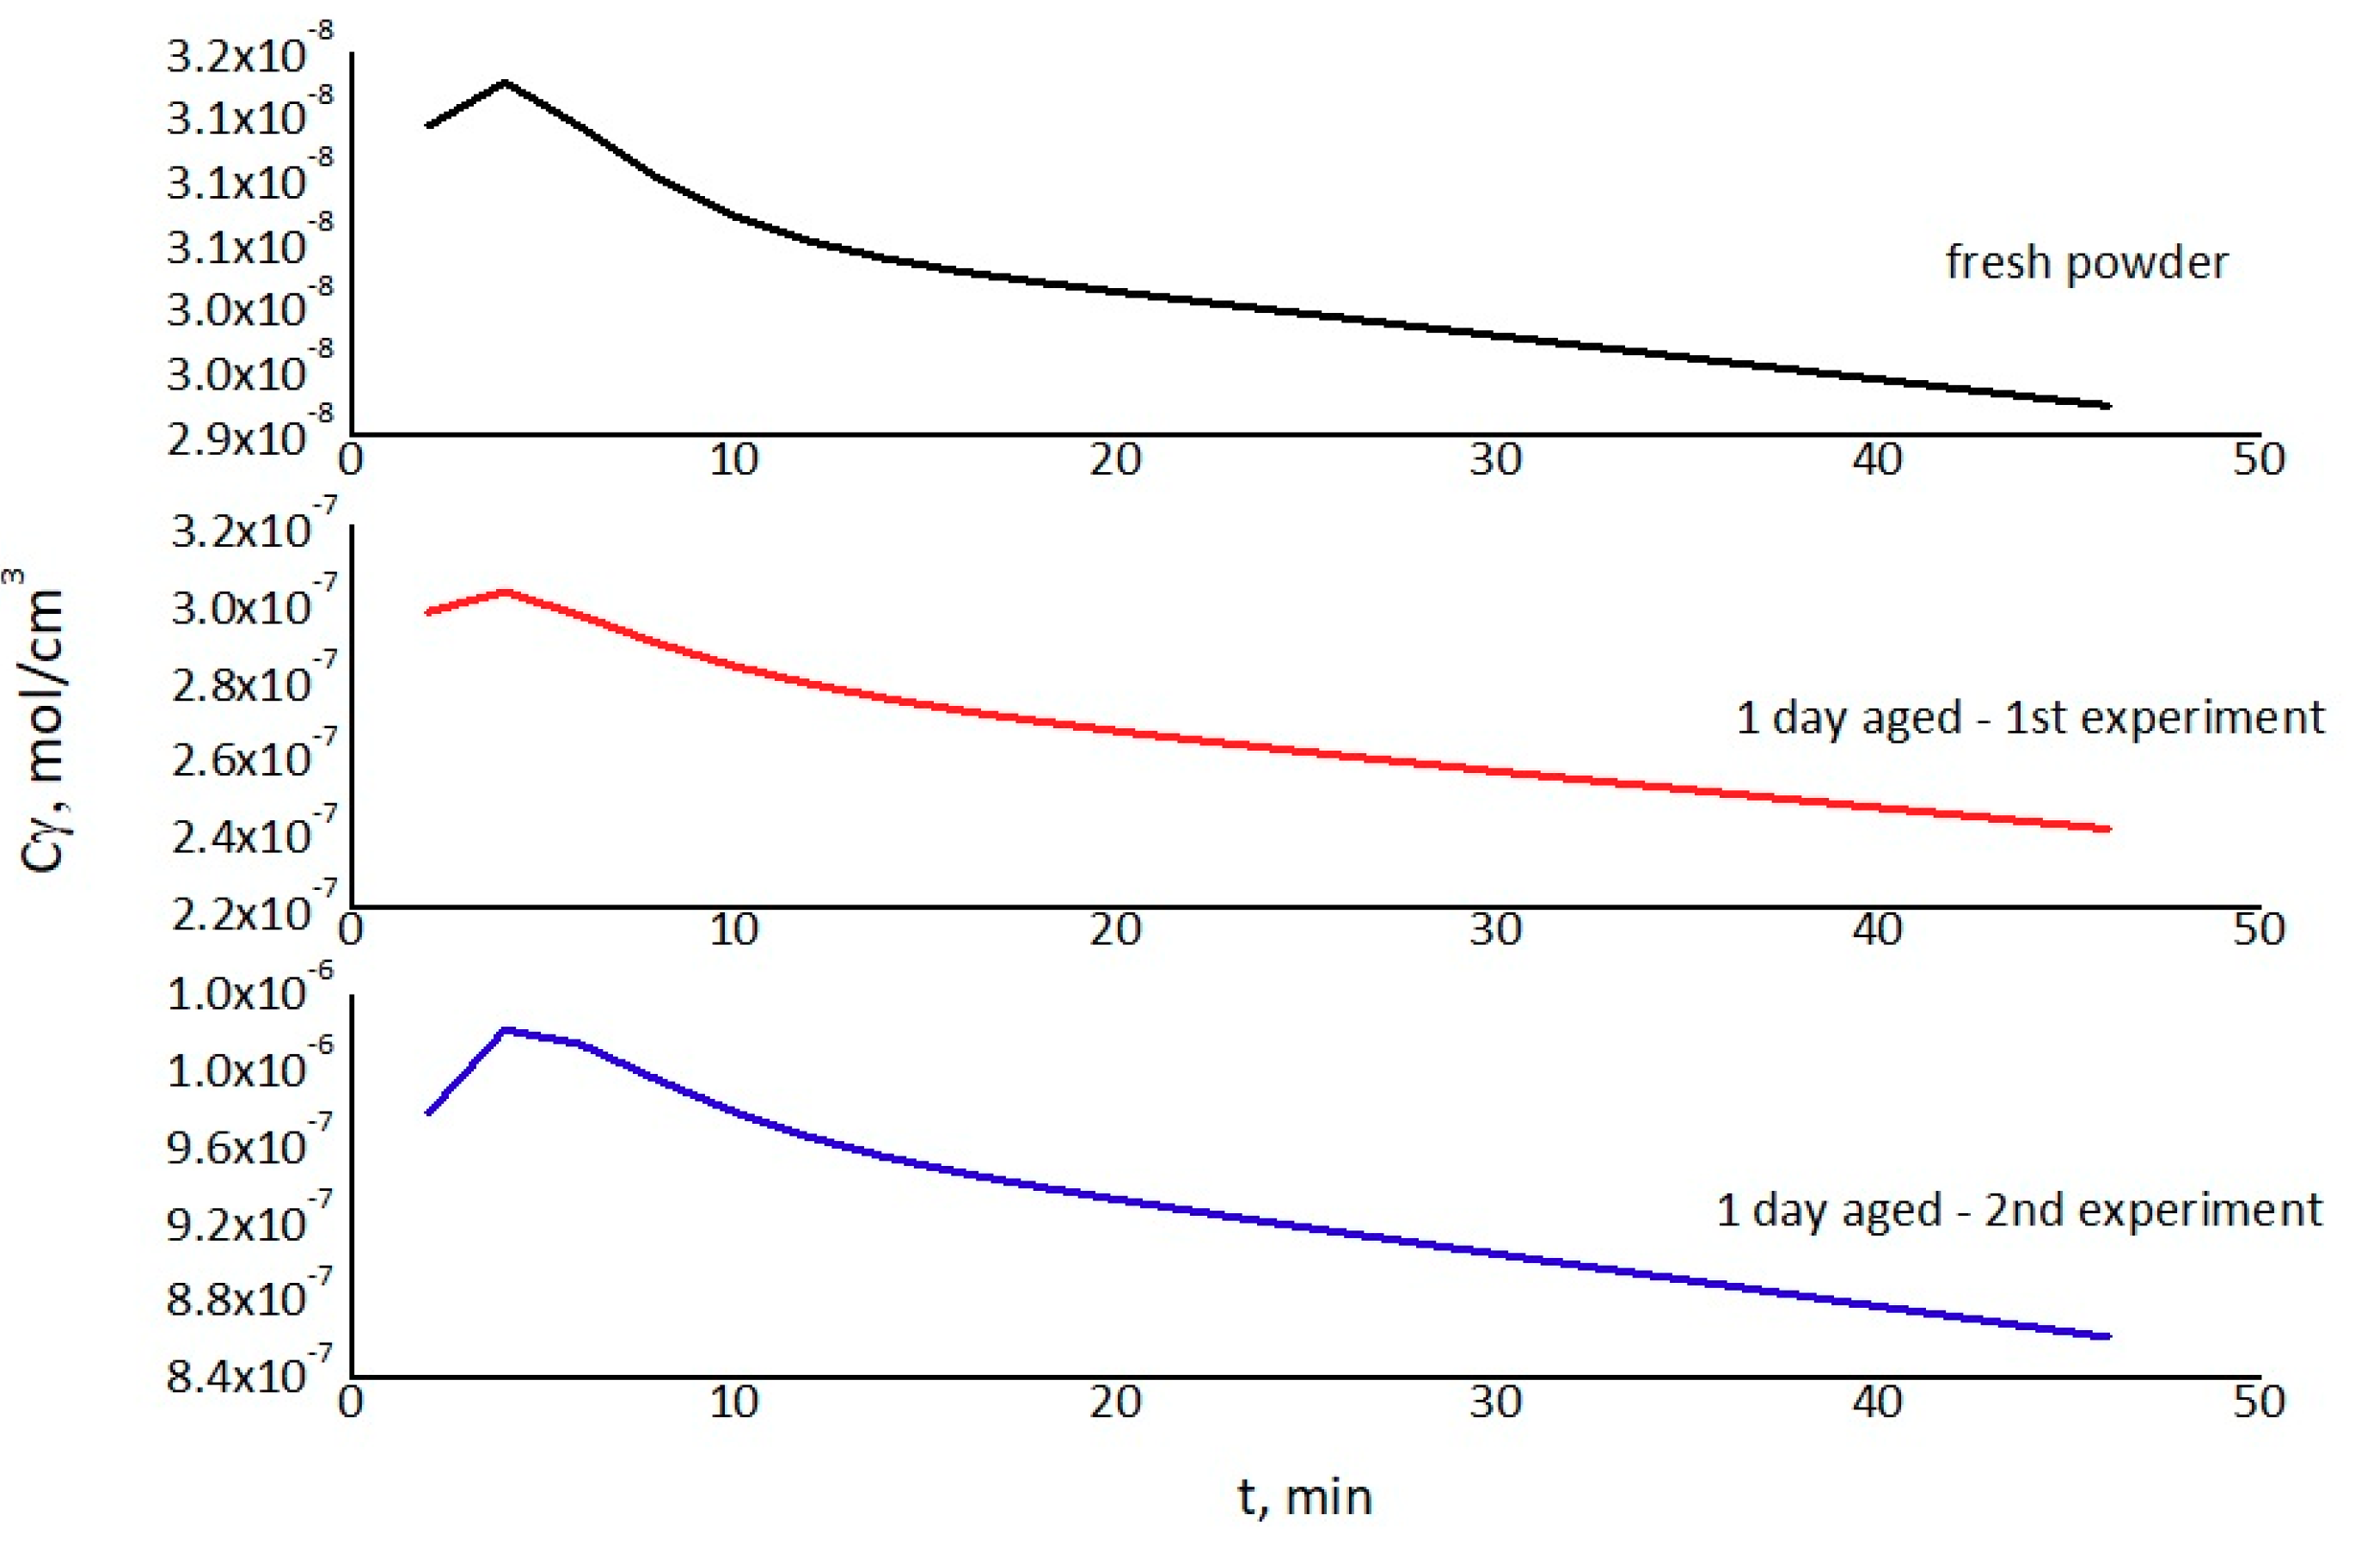
Figure 10 shows the aging effect’s influence on the non-adsorbed hydrogen concentration on the fresh catalyst as well as on the 1 day aged catalyst experiments.
The time–variation curves of the equilibrium adsorbed concentration (cy) are depicted in Figure 10, where a linear regression fit was attempted in each case. It appears that the highest gradient appeared for the 1 day aged catalyst from the second experiment and the lowest for the 1 day aged catalyst from the first experiment. This fact, as well as the fact that the highest values for the equilibrium adsorbed concentration were measured for the catalysts, allows for determining the apparent activity ranking of these types of catalysts as follows: fresh > 1 day aged first experiment > 1 day aged second experiment. Rapid reduction of the non-adsorbed hydrogen concentration in the second experiment in comparison with first experiment can be connected to the different compositions of the catalysts because of the partial reduction NiO to Ni during the first experiment. It is known that the oxide reduction temperature depends on the particle size, and the usual temperatures for reduction are 300–500 °C. Nano nickel oxide can be reduced at temperatures even less than 100 °C [41,42].
Thus, the reduction at 80 °C could be originated to the size of the nanoparticles and the localized temperature raise; it is possibly connected to local overheating due to the exothermic reaction O2 + H2. The O2 can stay in the pores even after the vacuum treatment in cases where the pores have a complicated shape.
If the partial reduction of a catalyst is possible, then after the first experiment with the fresh catalyst, the catalyst would possess a higher concentration of nickel on the surface, and that explains the quicker adsorption of hydrogen than on NiO (first experiment) and the lower concentration of non-adsorbed hydrogen in the second experiment.
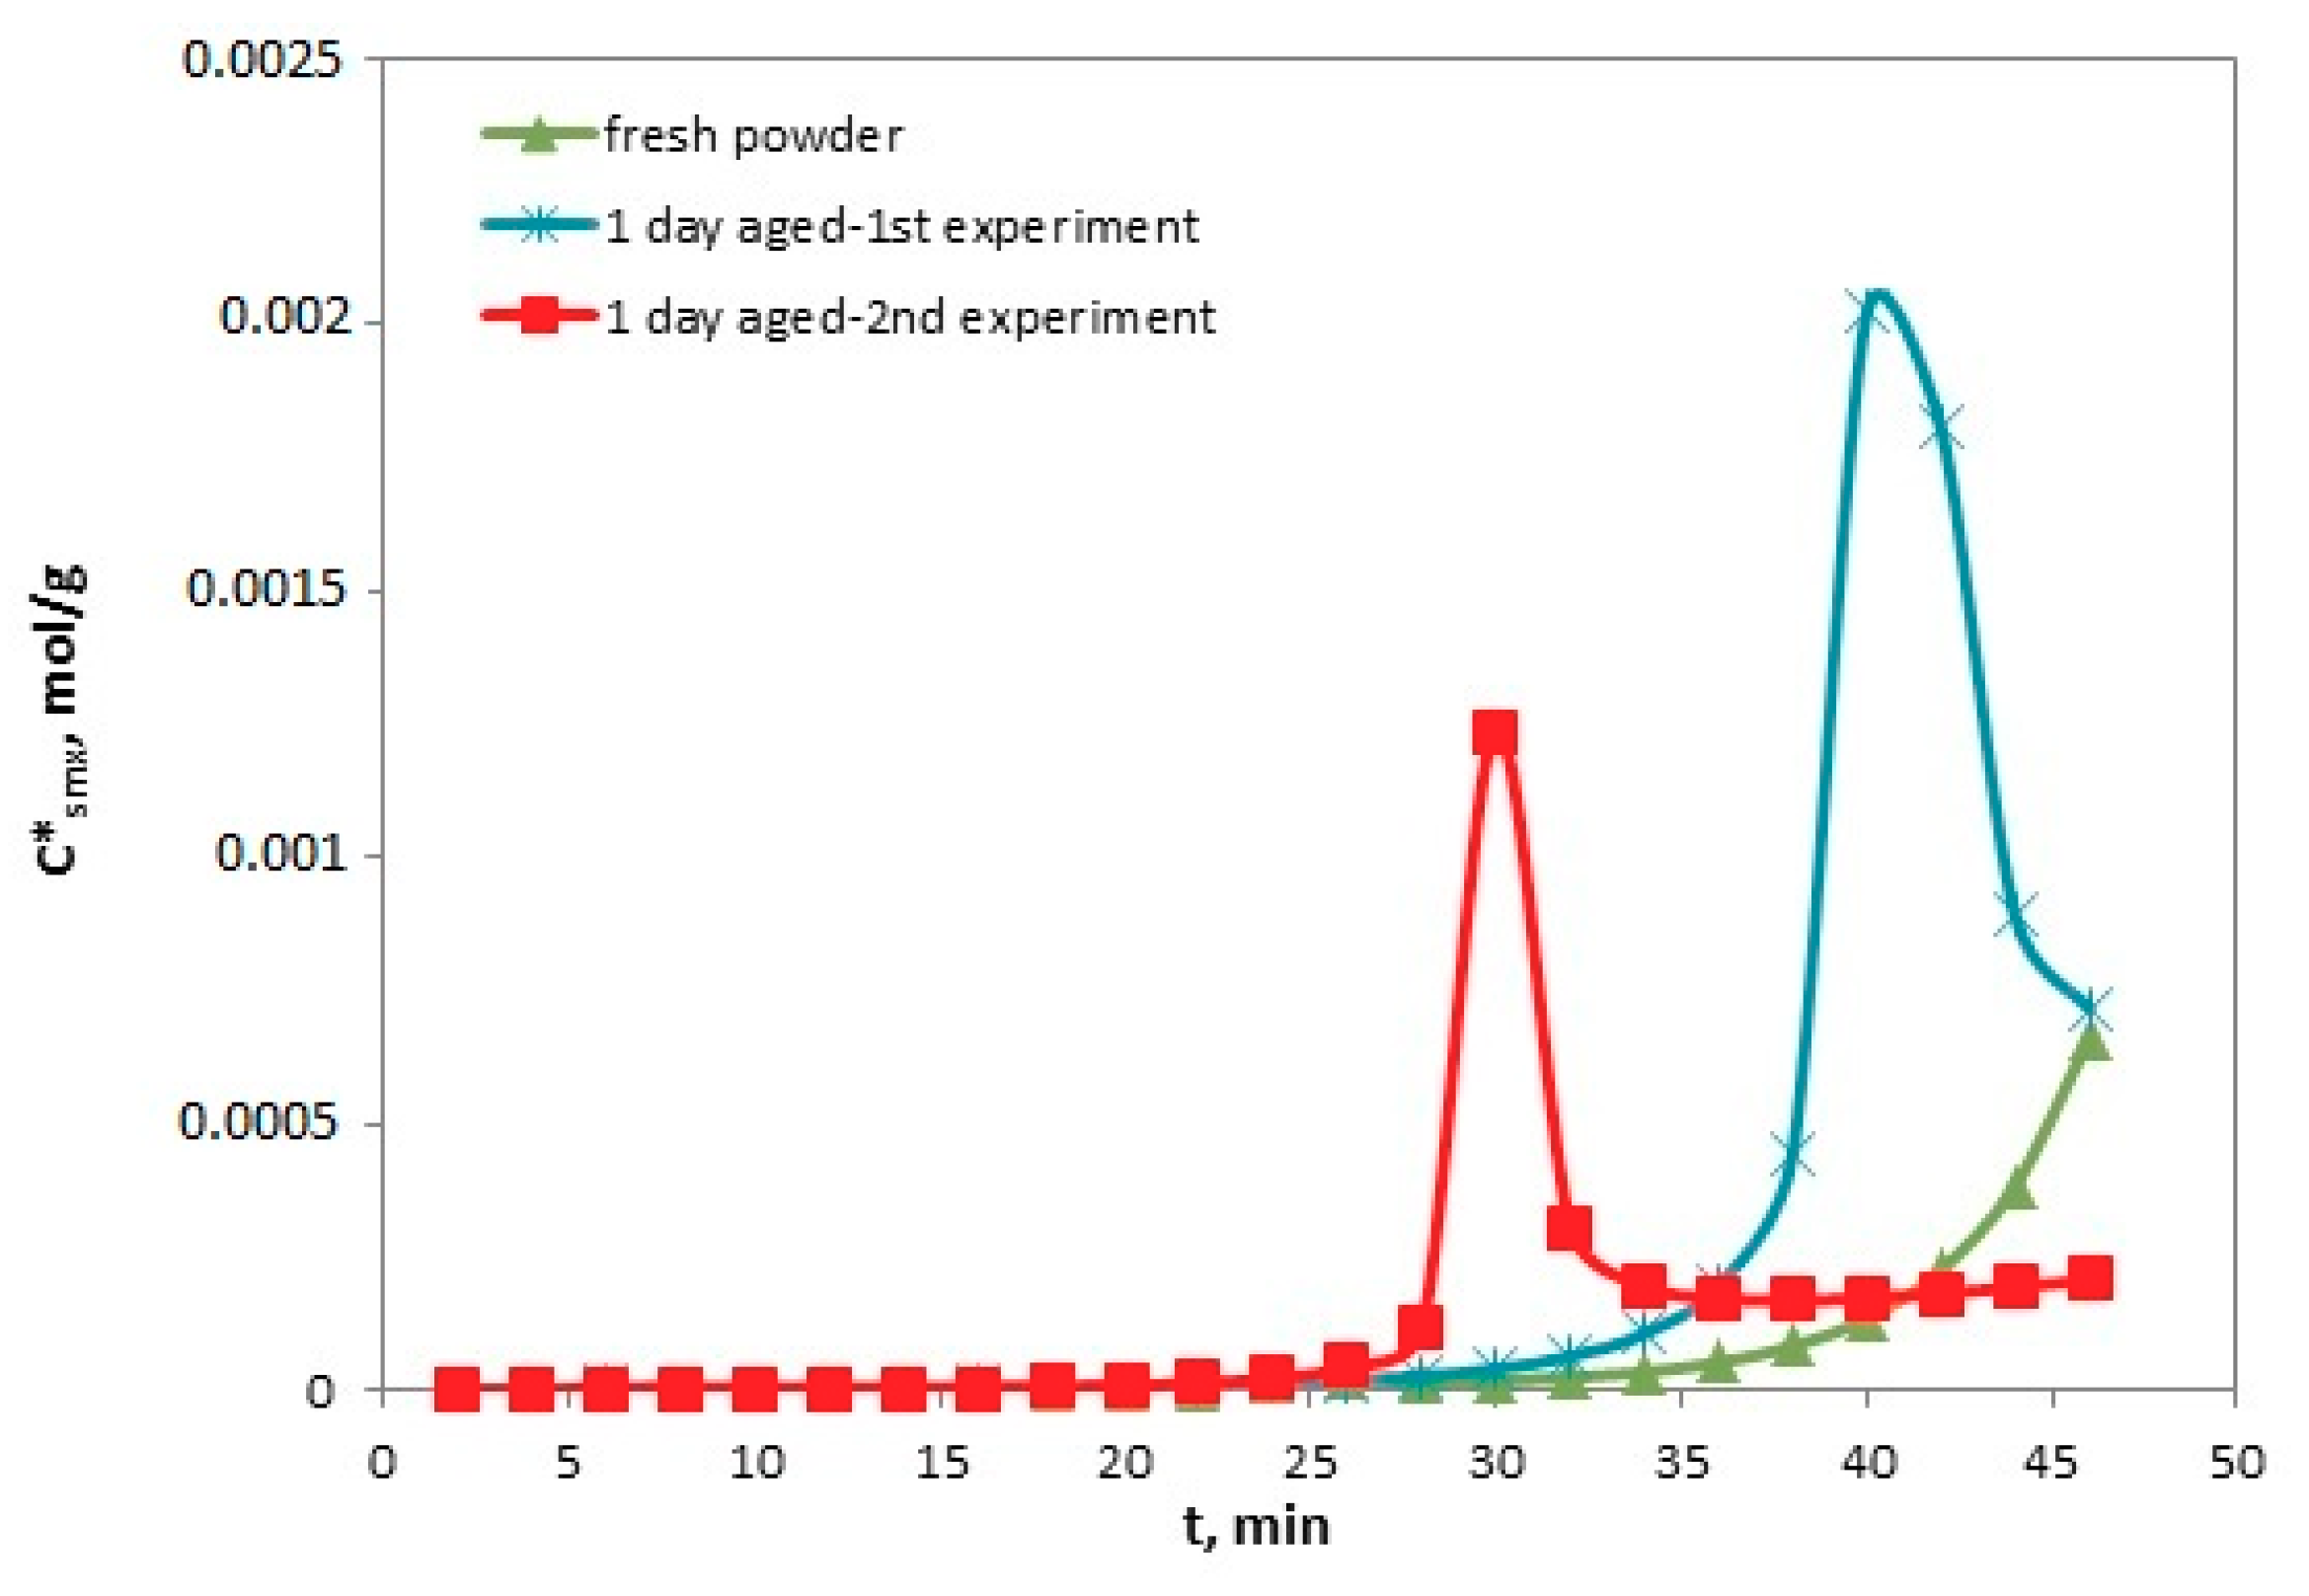
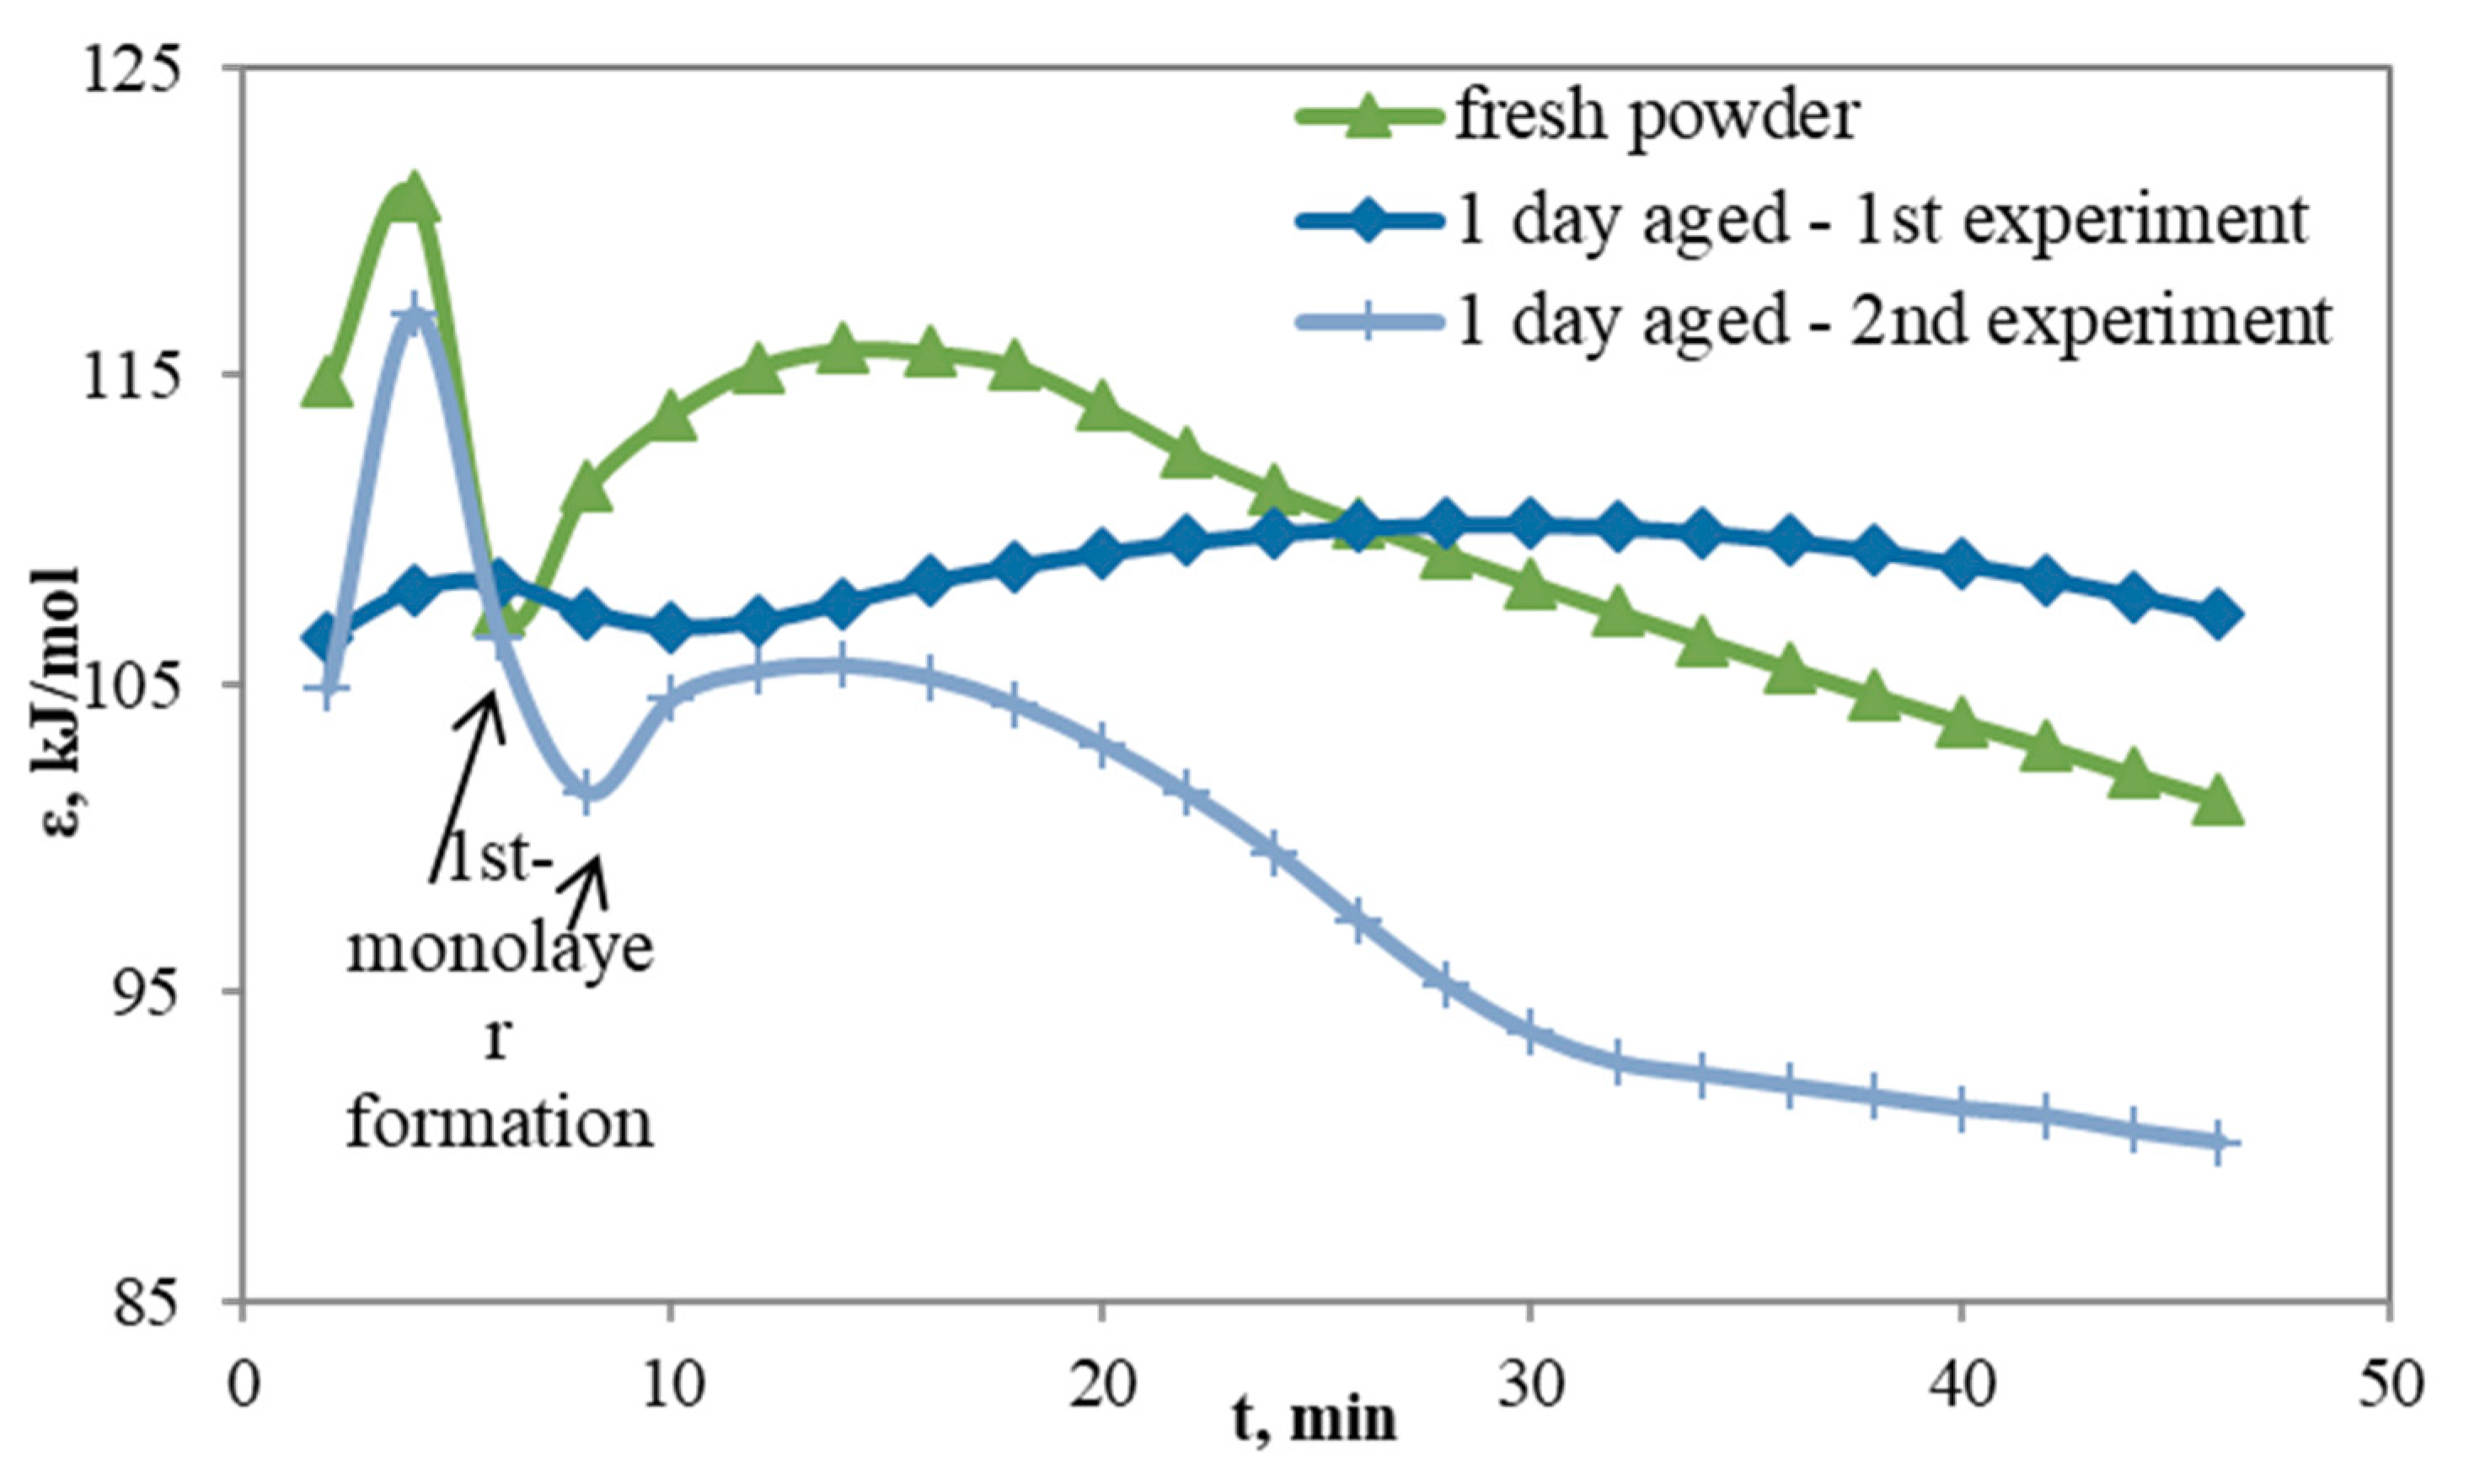
Figure 11 exhibits the influence of aging on local monolayer capacities, and it describes how Csmax changes with the catalyst aging. Thus, in the case of fresh catalyst and aged catalyst, the local monolayer changed 2–3 times. The tmax in the latter case was 50, 40, and 30 min, respectively. Therefore, the monolayer capacity and the time of its maximum was a function of aging time.
It is possible that when the catalyst is aged, the nickel crystal lattice alters and it is better suited for hydrogen adsorption, explaining why the local monolayer was finalized more quickly compared to the fresh catalyst. After the first experiment, where NiO was partially reduced to Ni, the hydrogen adsorption was quicker and the monolayer originated more quickly at the second experiment in comparison with the first one.
Figure 12 displays the role of catalyst aging in the local adsorption energy.It appears that the energy of adsorption decreased because of the aging effect. This connected with the origination of more suitable crystal lattice parameters for hydrogen adsorption during aging. During the second experiment, the energy of adsorption was even less in comparison to the first experiment because of the NiO reduction and formation of Ni. These effects are often called room temperature aging effects, because the hydrogen adsorption was influenced by the crystal lattice parameters. It looks like the aging parameters of the crystal lattice are more suitable for hydrogen adsorption. The reduction of the hydrogen adsorption energy can create a negative influence on the catalyst activity if it decreases too far from the optimum adsorption energy.

5. Conclusions

The precursor concentration in solvent and the catalyst room temperature aging on the growth morphology and surface characteristics of Ni–NiO nanopowders produced by dendrite combustion during SCS were studied. The TEΜ results highlighted that the nanocatalysts’ microstructures were modified by changing the reactants’ concentrations in water. Thus, the concentration of the initial mixture of Ni(NO3)2 and glycine in water played a significant role in the nanocatalysts.
The dendrites’ growth conditions appeared to be the main factor that was responsible for the observed changes in the crystallite size of the samples, as their structure depends on the concentration of nickel nitrate and glycine in the water. Various dendrite structures indicated that the combustion took place in different conditions during SCS, and the heat distribution during cooling was also affected. The IR high-speed camera demonstrated combustion in the dendrites. A new combustion type was discovered: combustion in dendrites. The more developed the structure of dendrites, the lower the combustion temperature, the higher the cooling velocity, and the smaller the crystallites.
We studied the size dependence of the conventional exchange bias and anisotropic energy between the Ni-core and NiO-shell nanoparticles. The shell grew at the expense of the Ni-core, forming a passivating layer of NiO as confirmed and estimated by the XPS measurements. By comparing the XPS spectra intensities, it can clearly be seen that by increasingly adding water, the concentration of surface oxidized states increased considerably. The ratio of NiO/Ni2O3 decreased from 4.3 (50 mL of water) to 1.35 (100 mL of water), justifying why nickel catalyst activity in the hydrogenation of maleic acid increased in this row. The reason for the changing activity was that the NiO structure resulted in the bridging of the oxygen structure. These bridging structures can cause problems in adsorption of hydrogen on the catalyst surface and, as a consequence, reduce its activity.
Investigations of the reasons for the severe reduction in the catalysts’ activity toward the liquid phase hydrogenation of maleic acid during room temperature aging was conducted by studying the hydrogen adsorption phenomena with reversed-flow inverse gas chromatography (RF-IGC). It indicated the existence of three different kinds of active sites corresponding to higher, intermediate, and lower energies of adsorption on the fresh catalyst. Aged catalyst appeared to have only one type of active site because of the change in the composition and structure, as indicated by the XPS and TEM analysis. Aging had an influence on the local monolayer capacities. In the case of fresh catalyst and aged catalyst, the local monolayer changed 2–3 times. Therefore, the monolayer capacity and the time of its maximum was a function of aging time. For the first time, room temperature aging of oxide nanomaterials was investigated, as room temperature aging is new phenomenon for catalysts. Due to the increasing attention of researchers toward SCS and other approaches to synthesizing nano-catalysts as well as other nanomaterials, this research will play a significant role in nanomaterial studies.The importance of this work combined with our previous studies [19,21,40,43,44] is high, as it demonstrates that the severe control of the reaction conditions (such as the concentration of precursors in the solvent, the type of solvent, the solvent pretreatment conditions, preheating temperature, reagents concentration, etc.) provides the possibility of tuning the properties and characteristics of materials produced by SCS even at a large scale. This research will be of great interest for the larger community of scientists who are occupied with nanomaterial synthesis and processing. The unique properties of nanoparticles result in a great number of potential applications in the areas of catalysis, microelectronics, medical electronics, ultra-high density magnetic storage media, biomedical magnetics (magnetic carriers for cancer treatment), cooling systems, etc.

Author Contributions

Conceptualization, G.X.; methodology, G.X.; software, O.T.; validation, G.X. and G.V.; formal analysis, G.X.; investigation, O.T.; data curation, G.X.; writing—original draft preparation, G.X., O.T., N.B. (TEM analysis), S.K. and A.D. (XPS analysis), S.R. and E.L. (infra-red camera analysis); writing—review and editing, G.X. and O.T.; visualization, G.X.; supervision, G.X., A.C.

Funding

Nikos Boukos would like to acknowledge support of this work (TEM analysis) by the project MIS 5002772, implemented under the Action “Reinforcement of the Research and Innovation Infrastructure”, funded by the Operational Programme “Competitiveness, Entrepreneurship and Innovation” (NSRF 2014–2020) and co-financed by Greece and the European Union (European Regional Development Fund). Part of this work was supported by the Ministry of Education and Science of the Russian Federation in the framework of the implementation of the program of increasing the competitiveness of SSAU among the world’s leading scientific and educational centers for 2013–2020. Part of this work (infrared camera measurements) was carried out with the financial support from the Ministry of Science and Higher Education of the Russian Federation in the framework of Increased Competitiveness Program of NUST “MISiS” (No. K2-2018-013), implemented by a governmental decree dated 16 March 2013, N 211.

Acknowledgments

The authors would like to thank Metaxa, Eleni for the reverse-flow inverse gas chromatography measurements in the School of Chemical Engineering, National Technical University of Athens, Greece.

Conflicts of Interest

The author declares no conflict of interest.

References

  1. Kreibig, U.; Bonnemann, H.; Hormes, J. Handbook of Surfaces and Interfaces of Materials; Academic Press: San Diego, CA, USA, 2001. [Google Scholar]
  2. Bonnemann, H.; Richards, R. Manufacture of heterogeneous mono- and bimetallic colloid catalysts and their applications in fine chemical synthesis and fuel cells. In Synthetic Methods of Organometallic Inorganic Chemistry; Herrmann, W.A., Brauer, G., Eds.; ThiemeVerlag: Stuttgart, Germany, 2002; Volume 10, pp. 209–224. [Google Scholar]
  3. El-Sayed, M.A. Some Interesting Properties of Metals Confined in Time and Nanometer Space of Different Shapes. Acc. Chem. Res. 2001, 34, 257–264. [Google Scholar] [CrossRef] [PubMed]
  4. Thomas, J.M.; Johnson, B.F.G.; Raja, R.; Sankar, G.; Midgley, P.A. High-Performance Nanocatalysts for Single-Step Hydrogenations. Acc. Chem. Res. 2003, 36, 20–30. [Google Scholar] [CrossRef] [PubMed]
  5. Cui, C.; Lieber, C.M. Functional Nanoscale Electronic Devices Assembled Using Silicon Nanowire Building Blocks. Science 2001, 291, 851–853. [Google Scholar] [CrossRef] [PubMed]
  6. Eychmuller, A. Structure and Photophysics of Semiconductor Nanocrystals. J. Phys. Chem. B 2001, 104, 6514–6528. [Google Scholar] [CrossRef]
  7. Puntes, V.F.; Krishnan, K.M.; Alivistos, A.P. Molecular Rulers for Scaling Down Nanostructures. Science 2001, 291, 2115–2117. [Google Scholar] [CrossRef]
  8. Sun, S.; Murray, C.B.; Weller, D.; Folks, L.; Moser, A. Monodisperse FePt nanoparticles and ferromagnetic FePt nanocrystal superlattices. Science 2000, 287, 1989–1992. [Google Scholar] [CrossRef]
  9. Rao, C.N.R.; Kulkarni, G.U.; Thomas, P. Metal nanoparticles and their assemblies. Chem. Soc. Rev. 2000, 29, 27–35. [Google Scholar] [CrossRef]
  10. Chen, S. Two-Dimensional Crosslinked Nanoparticle Networks. Adv. Mater. 2000, 12, 186–189. [Google Scholar] [CrossRef]
  11. Harada, T.S.; Tai, A.O. Improvement of nickel catalyst for enantioface-differentiating (asymmetric) hydrogenation of methyl-acetoacetate. Chem. Lett. 1977, 10, 1131–1132. [Google Scholar] [CrossRef]
  12. Kimijima, K.; Sugimoto, T.J. Effects of the water content on the growth rate of AgCl nanoparticles in a reversed micelle system. J. Colloid Interface Sci. 2005, 286, 520–525. [Google Scholar] [CrossRef]
  13. Medford, J.A.; Johnston-Peck, A.C.; Tracy, J.B. Nanostructural transformations during the reduction of hollow and porous nickel oxide nanoparticles. Nanoscale 2013, 5, 155–159. [Google Scholar] [CrossRef] [PubMed]
  14. Ji, J.-Y.; Shih, P.-S.; Chan, T.-S.; Ma, Y.-R.; Wu, S.Y. Magnetic properties of cluster glassy Ni/NiO core–shell nanoparticles: An investigation of their static and dynamic magnetization. Nanoscale Res. Lett. 2015, 10, 243–256. [Google Scholar] [CrossRef] [PubMed]
  15. Mandal, S.; Banerjee, S.; Menon, K.S.R. Core-shell model of the vacancy concentration and magnetic behavior for antiferromagnetic nanoparticle. Phys. Rev. B 2009, 80, 214420. [Google Scholar] [CrossRef]
  16. Varma, A.; Mukasyan, A.S.; Rogachev, A.S.; Manukyan, K.V. Solution combustion synthesis of nanoscale materials. Chem. Rev. 2016, 116, 14493–14586. [Google Scholar] [CrossRef]
  17. Patil, K.C.; Aruna, S.T.; Mimani, T. Combustion synthesis: An update. Curr. Opin. Solid State Mater. Sci. 2002, 6, 507–512. [Google Scholar] [CrossRef]
  18. Deganello, F.; Tyagi, A.K. Solution combustion synthesis, energy and environment: Best parameters for better materials. Prog. Cryst. Growth Charact. Mater. 2018, 64, 23–61. [Google Scholar] [CrossRef]
  19. Thoda, O.; Xanthopoulou, G.; Vekinis, G.; Chroneos, A. Parametric Optimisation of Solution Combustion Synthesis Catalysts and Their Application for the Aqueous Hydrogenation of Maleic Acid. Catal. Lett. 2018, 148, 764–778. [Google Scholar] [CrossRef]
  20. Thoda, O.; Xanthopoulou, G.; Vekinis, G.; Chroneos, A. Review of Recent Studies on Solution Combustion Synthesis of Nanostructured Catalysts. Adv. Eng. Mater. 2018, 20, 1800047. [Google Scholar] [CrossRef]
  21. Xanthopoulou, G.; Thoda, O.; Roslyakov, S.; Steinman, A.; Kovalev, D.; Levashov, E.; Vekinis, G.; Sytschev, A.; Chroneos, A. Solution combustion synthesis of nano-catalysts with a hierarchical structure. J. Catal. 2018, 364, 112–124. [Google Scholar] [CrossRef]
  22. Hadke, S.; Kalimila, M.T.; Rathkanthiwar, S.; Gour, S.; Sonkusare, R.; Ballal, A. Role of fuel and fuel-to-oxidizer ratio in combustion synthesis of nano-crystalline nickel oxide powders. Ceram. Int. 2015, 41, 14949–14957. [Google Scholar] [CrossRef]
  23. Kumar, A.; Wolf, E.E.; Mukasyan, A.S. Solution combustion synthesis of metal nanopowders: Nickel—Reaction pathways. AlChE J. 2011, 57, 2207–2214. [Google Scholar] [CrossRef]
  24. Wen, W.; Wu, J.-M. Nanomaterials via solution combustion synthesis: A step nearer to controllability. RSC Adv. 2014, 4, 58090–58100. [Google Scholar] [CrossRef]
  25. Jung, C.H.; Jalota, S.; Bhaduri, S.B. Quantitative effects of fuel on the synthesis of Ni/NiO particles using a microwave-induced solution combustion synthesis in air atmosphere. Mater. Lett. 2005, 59, 2426–2432. [Google Scholar] [CrossRef]
  26. Erri, P.; Nader, J.; Varma, A. Controlling combustion wave propagation for transition metal/alloy/cermet foam synthesis. Adv. Mater. 2008, 20, 1243–1245. [Google Scholar] [CrossRef]
  27. Kumar, A.; Cross, A.; Manukyan, K.; Bhosale, R.R.; van den Broeke, L.J.P.; Miller, J.T.; Mukasyan, A.S.; Wolf, E.E. Combustion synthesis of copper–nickel catalysts for hydrogen production from ethanol. Chem. Eng. J. 2015, 278, 46–54. [Google Scholar] [CrossRef]
  28. Cross, A.; Kumar, A.; Wolf, E.E.; Mukasyan, A.S. Combustion Synthesis of a Nickel Supported Catalyst: Effect of Metal Distribution on the Activity during Ethanol Decomposition. Ind. Eng. Chem. Res. 2012, 51, 12004–12008. [Google Scholar]
  29. Lowry, G.V.; Gregory, K.B.; Apte, S.C.; Lead, J.R. Transformations of nanomaterials in the environment. Environ. Sci. Technol. 2012, 46, 6893–6899. [Google Scholar] [CrossRef]
  30. Mitrano, D.M.; Motellier, S.; Clavaguera, S.; Nowack, B. Review of nanomaterial aging and transformations through the life cycle of nano-enhanced products. Environ. Int. 2015, 77, 132–147. [Google Scholar] [CrossRef]
  31. Kenning, G.G.; Heidt, C.; Barnes, A.; Martin, J.; Grove, B.; Madden, M. Thermally activated magnetization and resistance decay during near ambient temperature aging of Co nanoflakes in a confining semi-metallic environment. J. Appl. Phys. 2011, 110, 114312. [Google Scholar] [CrossRef]
  32. Thurber, A.P.; Alanko, G.; Beausoleil, G.L., II; Dodge, K.N.; Hanna, C.; Punnoose, A. Unusual crystallite growth and modification of ferromagnetism due to aging in pure and doped ZnO nanoparticles. J. Appl. Phys. 2012, 111, 07C319. [Google Scholar] [CrossRef]
  33. Ali, M.; Winterer, M. ZnO nanocrystals: Surprisingly ‘alive’. Chem. Mater. 2009, 22, 85–91. [Google Scholar] [CrossRef]
  34. Mudunkotuwa, I.A.; Pettibone, J.M.; Grassian, V.H. Environmental implications of nanoparticle aging in the processing and fate of copper-based nanomaterials. Environ. Sci. Technol. 2012, 46, 7001–7010. [Google Scholar] [CrossRef] [PubMed]
  35. Yin, F.; Wang, Z.W.; Palmer, R.E. Ageing of mass-selected Cu/Au and Au/Cu core/shell clusters probed with atomic resolution. J. Exp. Nanosci. 2012, 7, 703–710. [Google Scholar] [CrossRef]
  36. Fetisov, A.V.; Kozhina, G.A.; Estemirova, S.K.; Mitrofanov, V.Y. On the room-temperature aging effects in YBa2Cu3O6+δ. Phys. C 2015, 515, 54–61. [Google Scholar] [CrossRef] [Green Version]
  37. Katsanos, N.A.; Karaiskakis, G. Time-Resolved Inverse Gas Chromatography and Its Practical Applications; HNB Publishing: New York, NY, USA, 2004; Volume 1. [Google Scholar]
  38. Metaxa, E.; Kolliopoulos, A.; Agelakopoulou, T.; Roubani-Kalantzopoulou, F. The role of surface heterogeneity and lateral interactions in the adsorption of volatile organic compounds on rutile surface. Appl. Surf. Sci. 2009, 255, 6468–6478. [Google Scholar] [CrossRef]
  39. Arvaniti, I.; Netos, V.; Siokos, V.; Metaxa, E.; Kalantzopoulou, F.R. Relation between adsorption and catalysis in the case of NiO and Co3O4. Appl. Surf. Sci. 2010, 256, 5559–5565. [Google Scholar] [CrossRef]
  40. Xanthopoulou, G.; Thoda, O.; Metaxa, E.D.; Vekinis, G.; Chroneos, A. Influence of atomic structure on the nano-nickel-based catalyst activity produced by solution combustion synthesis in the hydrogenation of maleic acid. J. Catal. 2017, 348, 9–21. [Google Scholar] [CrossRef]
  41. Furstenau, R.; McDougall, G.; Langell, M. Initial stages of hydrogen reduction of NiO (100). Surf. Sci. 1985, 150, 55–79. [Google Scholar] [CrossRef]
  42. Rodriguez, A.; Hanson, J.C.; Frenkel, A.I.; Kim, J.Y.; Pérez, M. Experimental and Theoretical Studies on the Reaction of H2 with NiO: Role of O Vacancies and Mechanism for Oxide Reduction. J. Am. Chem. Soc. 2002, 124, 346–354. [Google Scholar] [CrossRef]
  43. Thoda, O.; Xanthopoulou, G.; Vekinis, G.; Chroneos, A. The effect of the precursor solution’s pretreatment on the properties and microstructure of the SCS final nanomaterials. Appl. Sci. 2019, 9, 1200. [Google Scholar] [CrossRef] [Green Version]
  44. Thoda, O.; Xanthopoulou, G.; Prokof’ev, V.; Roslyakov, S.; Vekinis, G.; Chroneos, A. Influence of preheating temperature on Solution Combustion Synthesis of Ni–NiO nanocomposites: Mathematical model and experiment. Int. J. Self-Propagating High-Temp. Synth. 2018, 27, 207–215. [Google Scholar] [CrossRef]
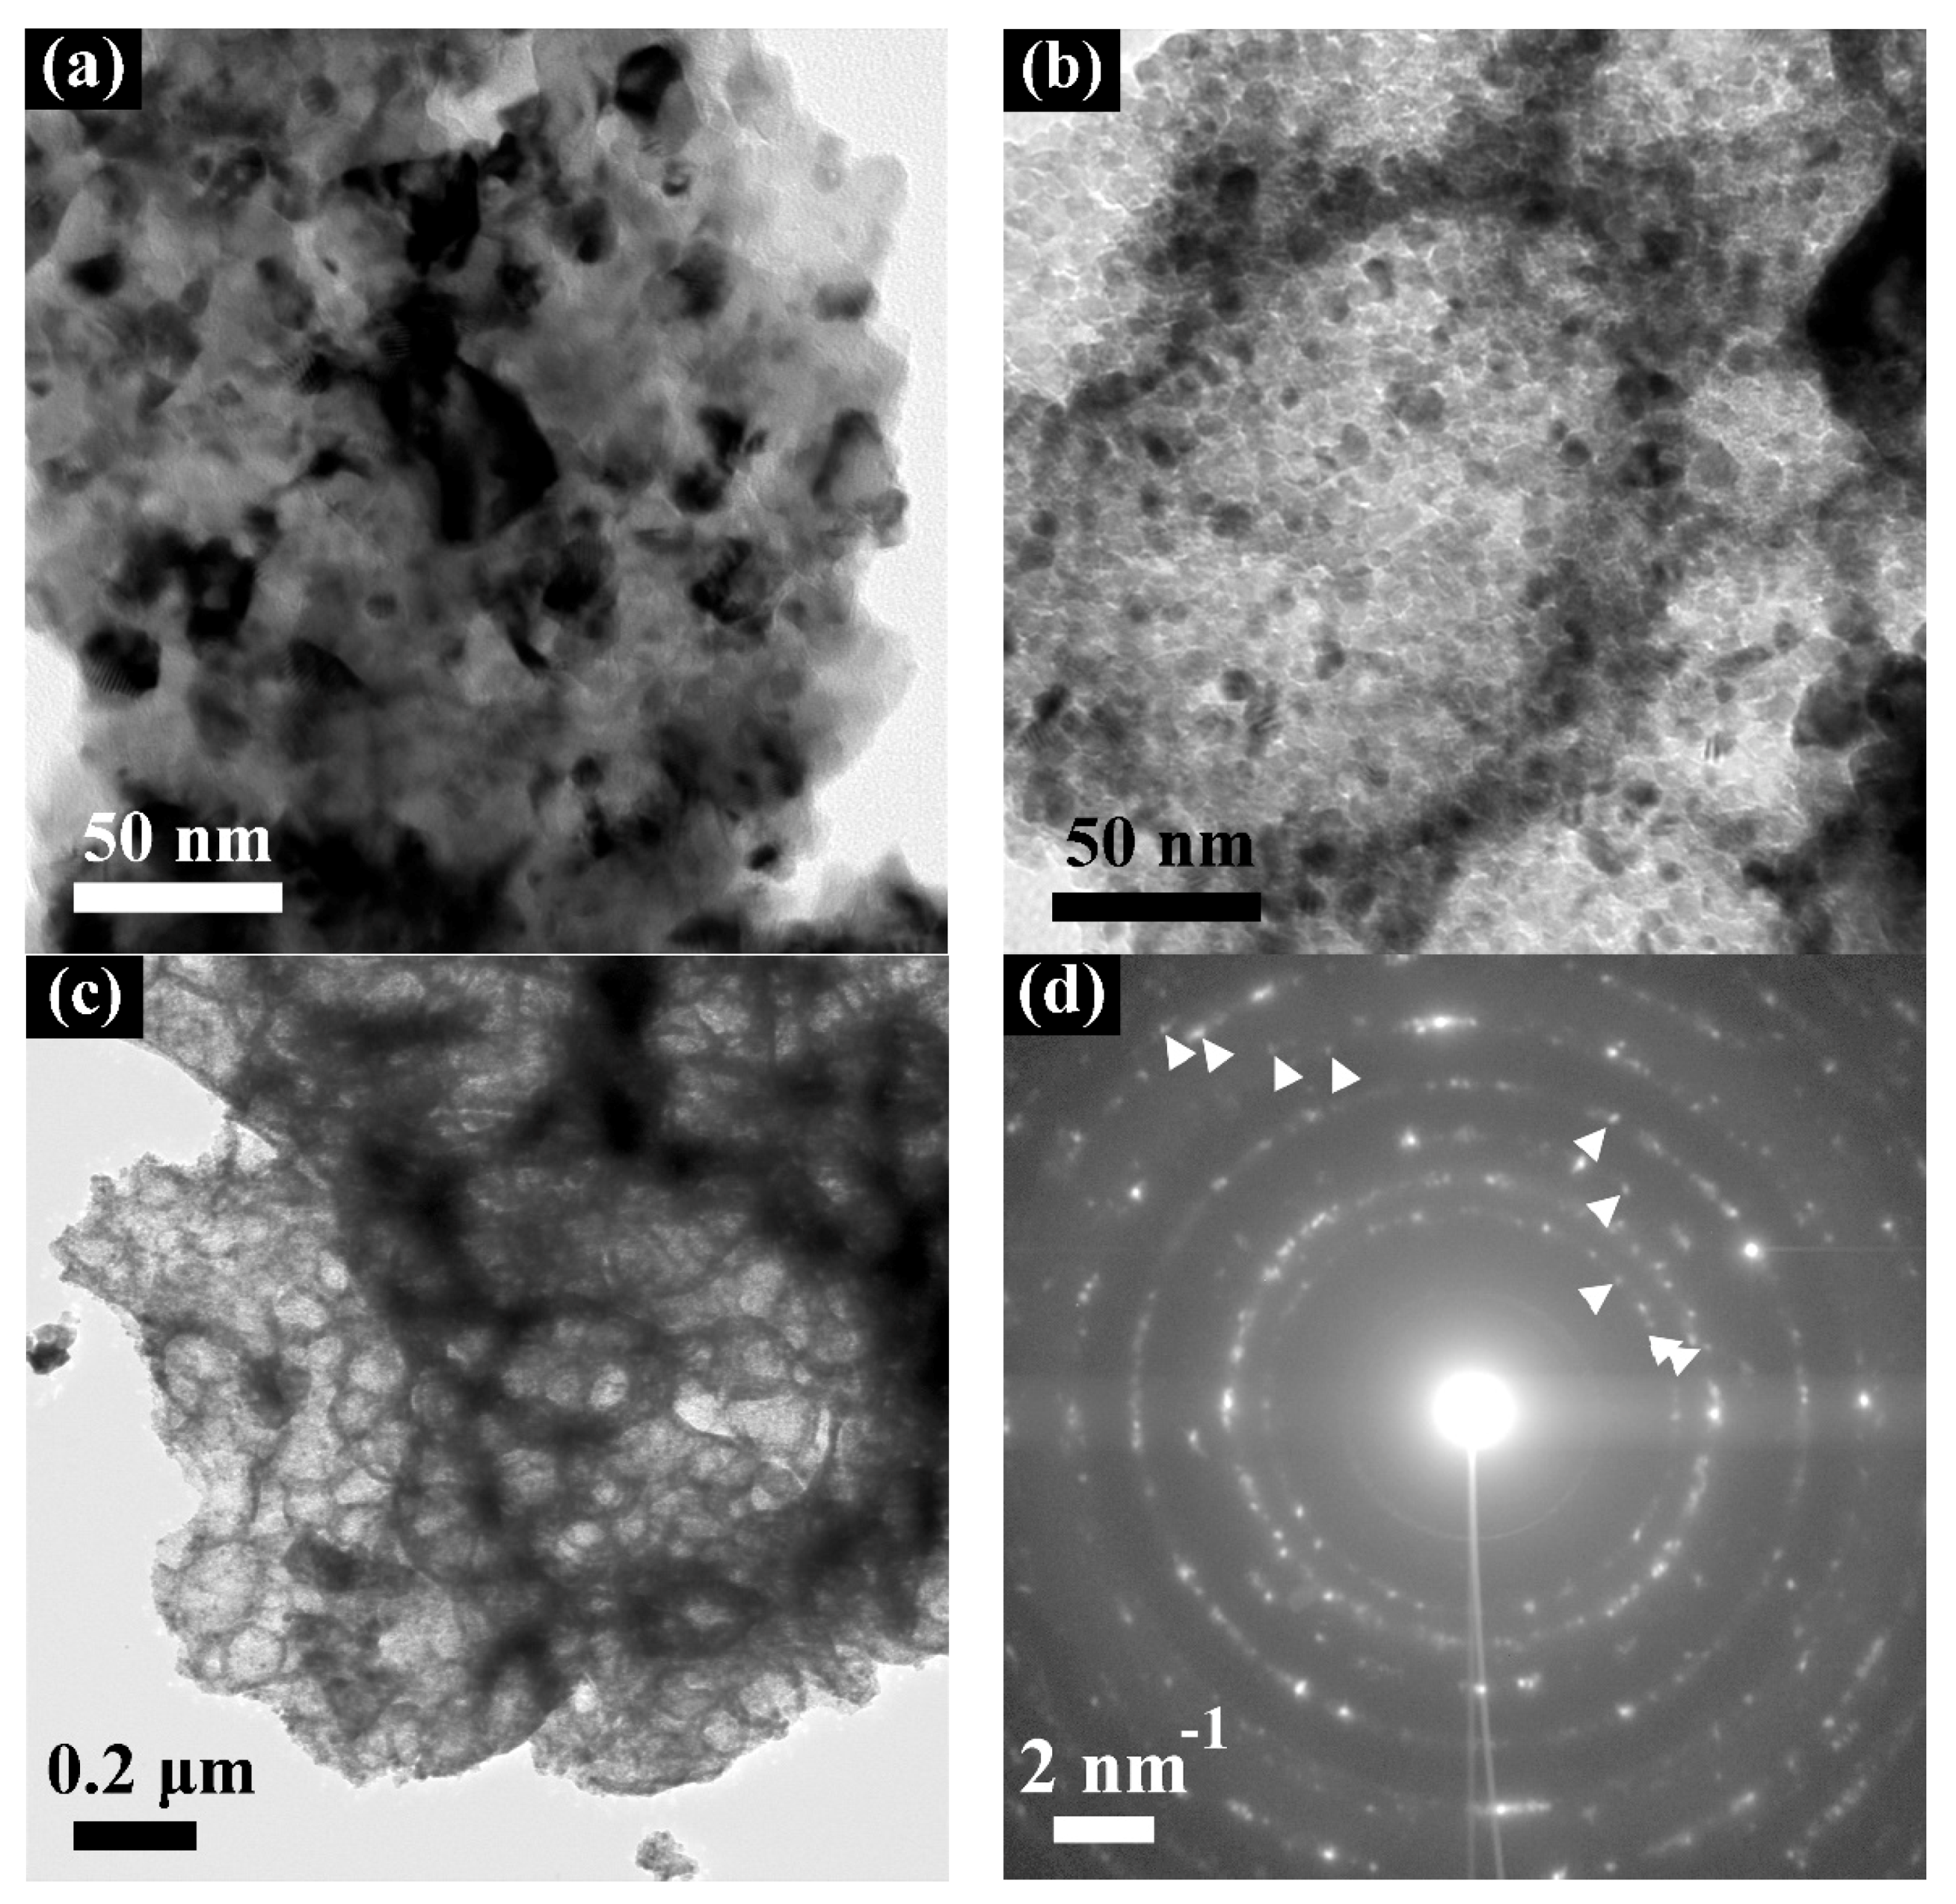
Figure 1. S_29 (100 mL of H2O). TEM bright field images of areas exhibiting 15–50 nm crystallites (a) and 5–12 nm crystallites (b). (c) A low-magnification TEM image of area (b). A typical selected area electron diffraction (SAED) pattern (d).
Applsci 09 04925 g001
Figure 2. HRTEM images of larger and smaller Ni and NiO nanocrystals.
Applsci 09 04925 g002
Figure 3. Sample S27. TEM bright field images of areas exhibiting 20–40 nm crystallites (a). Sample 27 (75 mL H2O) and 5–12 nm crystallites (b). (c) A low-magnification TEM image of area (b). TEM bright field image of sample S25 (50 mL H2O) (d).
Applsci 09 04925 g003
Figure 4. The influence of precursor concentration in water on combustion temperature during SCS: (a) 100 mL, (b) 75 mL, and (c) 50 mL (preheating temperature 300 °C).
Applsci 09 04925 g004aApplsci 09 04925 g004b
Figure 5. Ni2p core level spectra.
Applsci 09 04925 g005
Figure 6. O1s core level spectra.
Applsci 09 04925 g006
Figure 7. Influence of the effect of aging on the conversion of maleic acid in the Ni nanocatalyst produced by SCS (at 80 °C).
Applsci 09 04925 g007
Figure 8. Time-distribution of the lateral local adsorption energies among adsorbed species for the powdered catalyst samples: (a) S-27 (prepared at different quantities of water) and (b) S-27 (75 mL H2O, 1 day aged).
Applsci 09 04925 g008
Figure 9. The energy distribution function ϕ (ε; t) versus the local adsorption energy, ε, at the temperature of the maximum catalytic activity (80 °C) for the adsorption of hydrogen on Ni nanocatalysts (sample 27): (a) fresh catalyst, (b) 1 day aged catalyst ( first experiment), and (c) 1 day aged catalyst (second experiment).
Applsci 09 04925 g009aApplsci 09 04925 g009b
Figure 10. The aging effect on the non-adsorbed hydrogen concentration on the catalyst surface of fresh catalyst, 1 day aged catalyst (first experiment), and 1 day aged catalyst (second experiment) concerning the system H2/Ni (75 mL of water in the initial mixture).
Applsci 09 04925 g010
Figure 11. The aging effect on the local monolayer capacity concerning the system H2/Ni: fresh catalyst, 1 day aged catalyst (first experiment), 1 day aged (second experiment).
Applsci 09 04925 g011
Figure 12. The local adsorption energy of the powdered catalyst samples at 80 °C and the role of aging on their local adsorption energy.
Applsci 09 04925 g012
Table 1. Materials used for solution combustion synthesis (SCS) catalyst production and the hydrogenation reaction.
MaterialManufacturerAssay/Purity
Nickel (II) nitrate hexahydrate for analysis (Ni(NO3)2·6H2O)Merck99.0%–102.0%
Glycine for synthesis (CH2NH2COOH)PanReacAppliChem99.0%
Maleic acid (HOOCCH=CHCOOH)Riedel-de Haën99.0%
Hydrogen (H2)Air Liquide99.999%
Table 2. The conducted experiments.
Number of ExperimentWater Added in the Precursor Solution
2550 mL
2775 mL
2825 mL
29100 mL
Table 3. Influence of water concentration in the initial mixture on the concentration of nickel and oxygen on the surface of each sample (taken from the survey scan).
Water Volume, mLNi, %O, %
2519.7080.30
5021.1078.90
7522.5077.50
10023.3076.70
Table 4. Binding energy values of the Ni2+ and Ni3+ states in the Ni 2p spectra.
Water Volume, mLNi 2p3/2Ni 2p1/2
Ni2+Ni3+Ni2+Ni3+
25854.2 ± 0.2 eV856.2 ± 0.2 eV872.1 ± 0.2 eV874.5 ± 0.2 eV
50854.1 ± 0.2 eV856.1 ± 0.2 eV872.1 ± 0.2 eV874.4 ± 0.2 eV
75854.3 ± 0.2 eV856.2 ± 0.2 eV872.2 ± 0.2 eV874.2 ± 0.2 eV
100854.3 ± 0.2 eV856.3 ± 0.2 eV872.1 ± 0.2 eV874.2 ± 0.2 eV
Table 5. Binding energy values of oxygen bonded in the NiO and Ni2O3 states and their respective ratios.
O1s
O:Ni2+O:Ni3+O:NiOOHNi2+–O:Ni3+–O
25529.8 ± 0.2 eV531.8 ± 0.2 eV532.5 ± 0.2 eV4.3
50529.7 ± 0.2 eV531.7 ± 0.2 eV-1.8
75529.8 ± 0.2 eV531.8 ± 0.2 eV-1.9
100529.8 ± 0.2 eV531.9 ± 0.2 eV-1.35